consumer demand for north carolina seafood
TRANSCRIPT
1
Consumer Demand for North Carolina Seafood
Barry Nash, Jane Harrison, John Whitehead1
Overview A survey of North Carolina residents was conducted to determine the current consumption of seafood and the potential demand for North Carolina seafood. Approximately 1,600 residents from across North Carolina who enjoy eating seafood responded to the survey, and our respondents were representative of the state’s population based on where they lived, their genders, race and ethnicity.
The seafood consumer survey consisted of a questionnaire that included a choice experiment. The questionnaire collected information on respondents’ perceptions of seafood and how often they purchased seafood.
The choice experiment determined respondents’ willingness-to-pay (WTP) for North Carolina seafood. Choice experiments are often used to determine WTP for unique features of a product or service, and they have helped determine consumer preferences for local seafood (Davidson et al. 2012; Fonner and Sylvia 2014; Jaffrey et al. 2004; Roheim et al. 2012; Ropicki et al. (2010); Rudd et al. 2011; Sun et al. 2017).
With choice experiments, respondents are provided with several options of food items including their unique qualities and prices, and respondents are instructed to choose the most desirable option. By comparing responses over a variety of buying scenarios, we can presume the perceived value the consumer is placing on various characteristics of seafood, such as where seafood is harvested in the world.
This survey was designed to determine: ● How often consumers eat seafood at home and at restaurants;● Where consumers typically purchase their seafood for home consumption;● How interested consumers are in knowing the origins of their seafood;● How consumers’ perceptions of seafood vary based on harvest origins, product safety and
environmental concerns.
Overall, the survey shows respondents, if given a choice, would buy North Carolina seafood over seafood from other East Coast states and foreign countries. N.C. residents want their purchase dollars to support the livelihoods of North Carolina commercial fishermen and dealers. The market value seafood producers (fishermen and dealers) offer consumers is:
- A variety of species from which to choose;- A flavorful, nutritious source of dietary protein and omega 3 fats that promote cardiovascular
health;- Handling practices that protect the safety of seafood;- Products perceived as responsibly harvested, meaning commercial fishermen follow state and
federal regulations that protect finite fishery stocks for the next generation of seafood consumers.
Price, however, seems to be a prime determinant influencing purchase intent among those who responded to this survey. In general, cost-conscious consumers may be less likely to choose North Carolina seafood products if a lower-priced alternative is available.
1 We are grateful for the review of this report and recommendations by John Aydlett (NC Department of Agriculture), Scott Baker (NC Sea Grant) and Sara Mirabilio (NC Sea Grant). Any errors though can be attributed to the authors.
UNC-SG-21-02
2
What follows is a summary of the survey sample and key results. For a full description of the survey design and choice experiment analysis, visit go.ncsu.edu/choiceexperiment.
Survey Sample We obtained our respondents for the survey from an online panel administered by Survey Sampling International, a consumer and business-to-business survey-research firm. Survey respondents were selected among individuals who register to participate in the company’s online surveys and polls (Baker et al. 2010). The survey was launched online in March 2020 using Qualtrics, an online tool for writing survey questions, distributing surveys to participants and analyzing their answers.
Map 1. Survey respondents by zip code
One-thousand-six-hundred-seven (1,607) individuals responded to the survey. After removing those who did not provide adequate replies to a number of the questions, the final number of participants was 1,400. The geographic locations of the respondents are displayed by zip code in Map 1. The darkest blue color indicated 35 respondents, which was the highest number of responses from any given zip code.
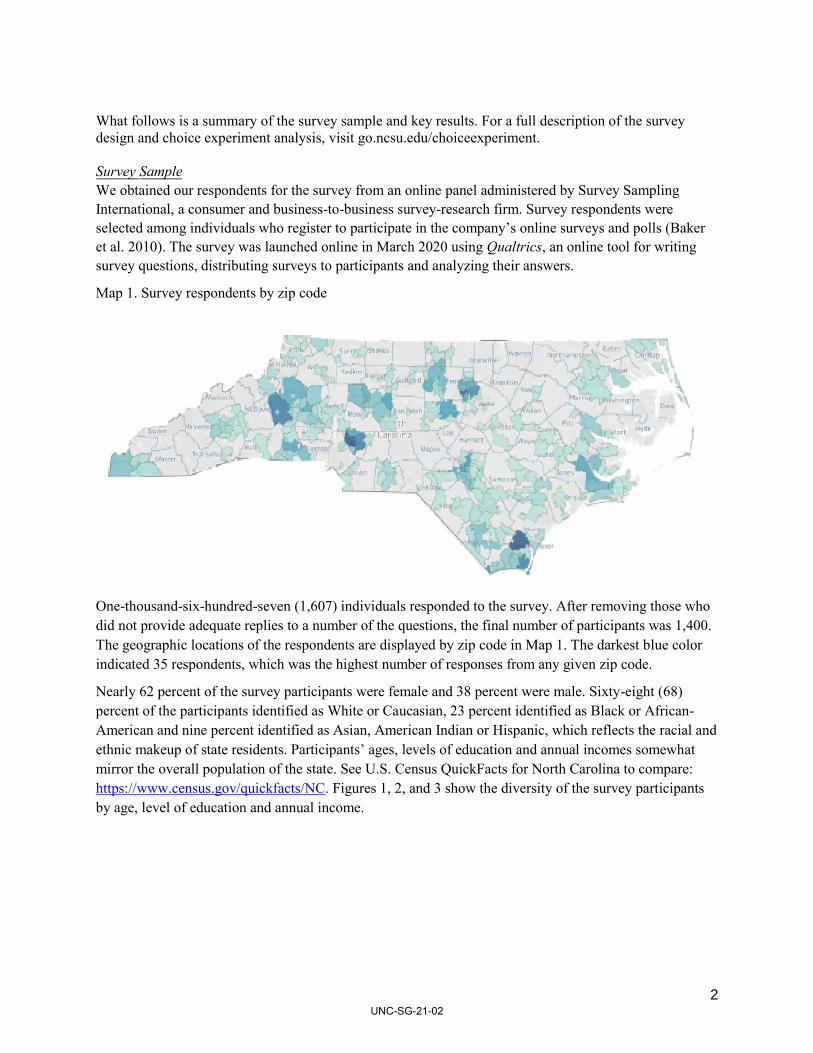
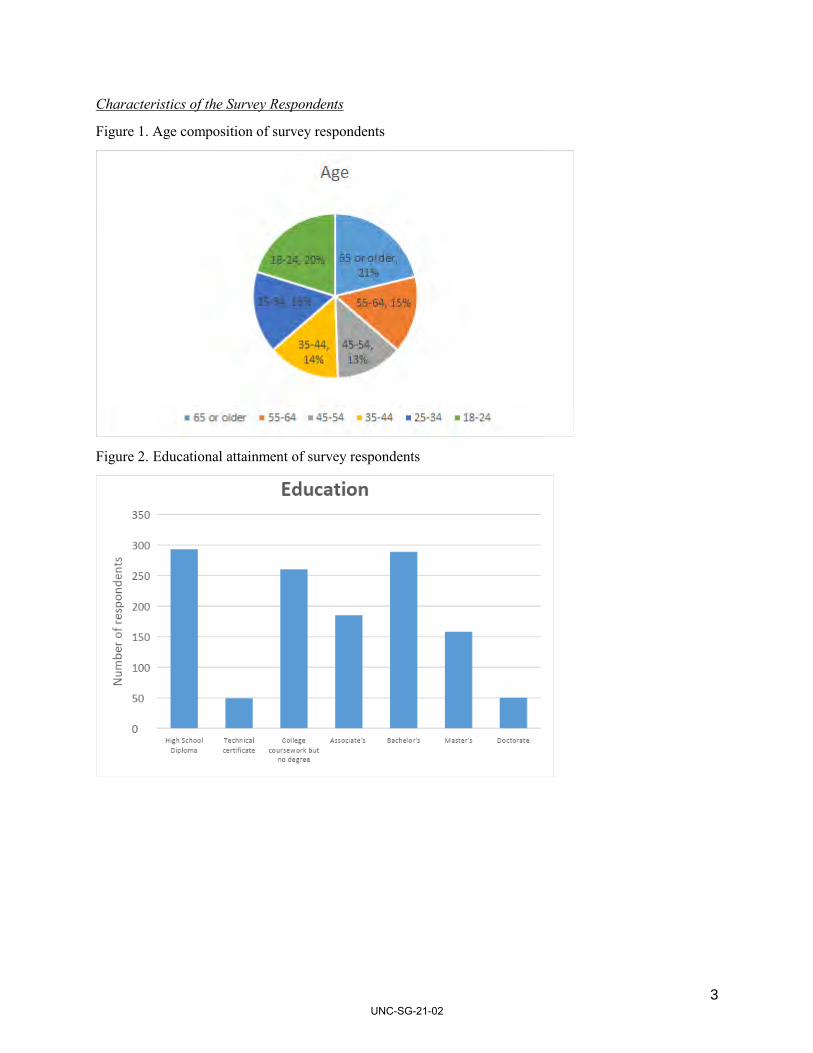
Nearly 62 percent of the survey participants were female and 38 percent were male. Sixty-eight (68) percent of the participants identified as White or Caucasian, 23 percent identified as Black or African-American and nine percent identified as Asian, American Indian or Hispanic, which reflects the racial and ethnic makeup of state residents. Participants’ ages, levels of education and annual incomes somewhat mirror the overall population of the state. See U.S. Census QuickFacts for North Carolina to compare: https://www.census.gov/quickfacts/NC. Figures 1, 2, and 3 show the diversity of the survey participants by age, level of education and annual income.
UNC-SG-21-02
3
Characteristics of the Survey Respondents
Figure 1. Age composition of survey respondents
Figure 2. Educational attainment of survey respondents
UNC-SG-21-02
4
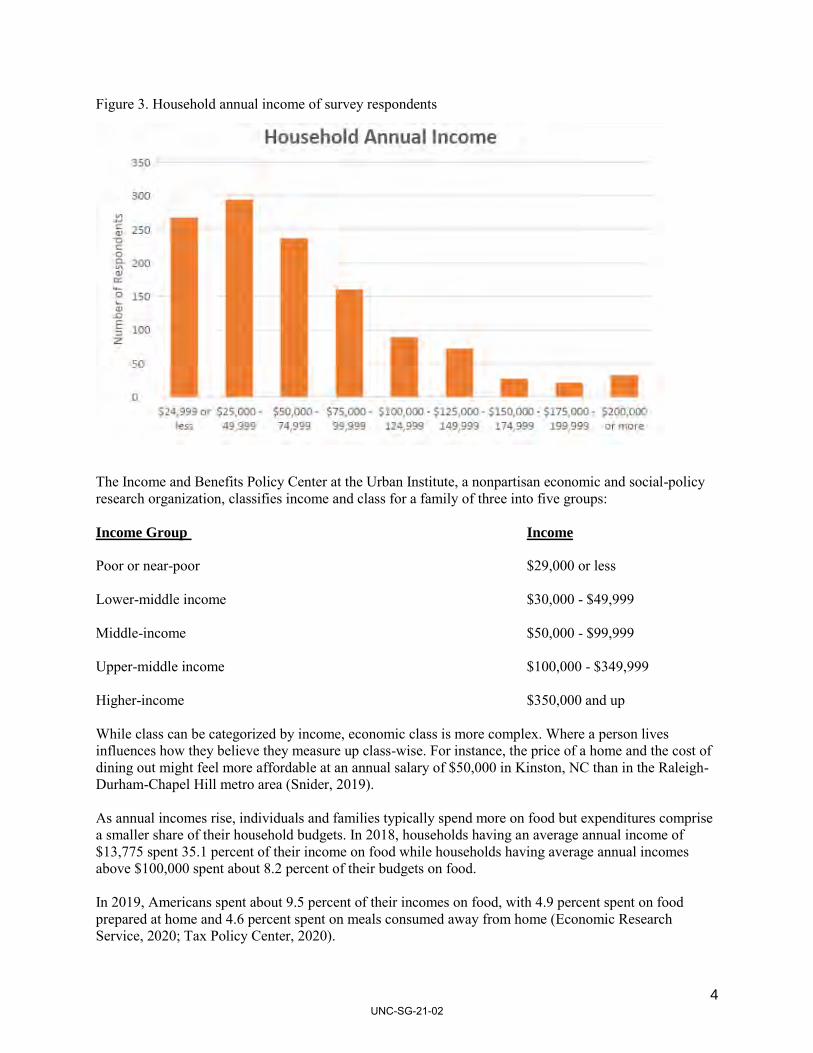
Figure 3. Household annual income of survey respondents
The Income and Benefits Policy Center at the Urban Institute, a nonpartisan economic and social-policy research organization, classifies income and class for a family of three into five groups: Income Group Income Poor or near-poor $29,000 or less Lower-middle income $30,000 - $49,999 Middle-income $50,000 - $99,999 Upper-middle income $100,000 - $349,999 Higher-income $350,000 and up While class can be categorized by income, economic class is more complex. Where a person lives influences how they believe they measure up class-wise. For instance, the price of a home and the cost of dining out might feel more affordable at an annual salary of $50,000 in Kinston, NC than in the Raleigh-Durham-Chapel Hill metro area (Snider, 2019). As annual incomes rise, individuals and families typically spend more on food but expenditures comprise a smaller share of their household budgets. In 2018, households having an average annual income of $13,775 spent 35.1 percent of their income on food while households having average annual incomes above $100,000 spent about 8.2 percent of their budgets on food. In 2019, Americans spent about 9.5 percent of their incomes on food, with 4.9 percent spent on food prepared at home and 4.6 percent spent on meals consumed away from home (Economic Research Service, 2020; Tax Policy Center, 2020).
UNC-SG-21-02
5
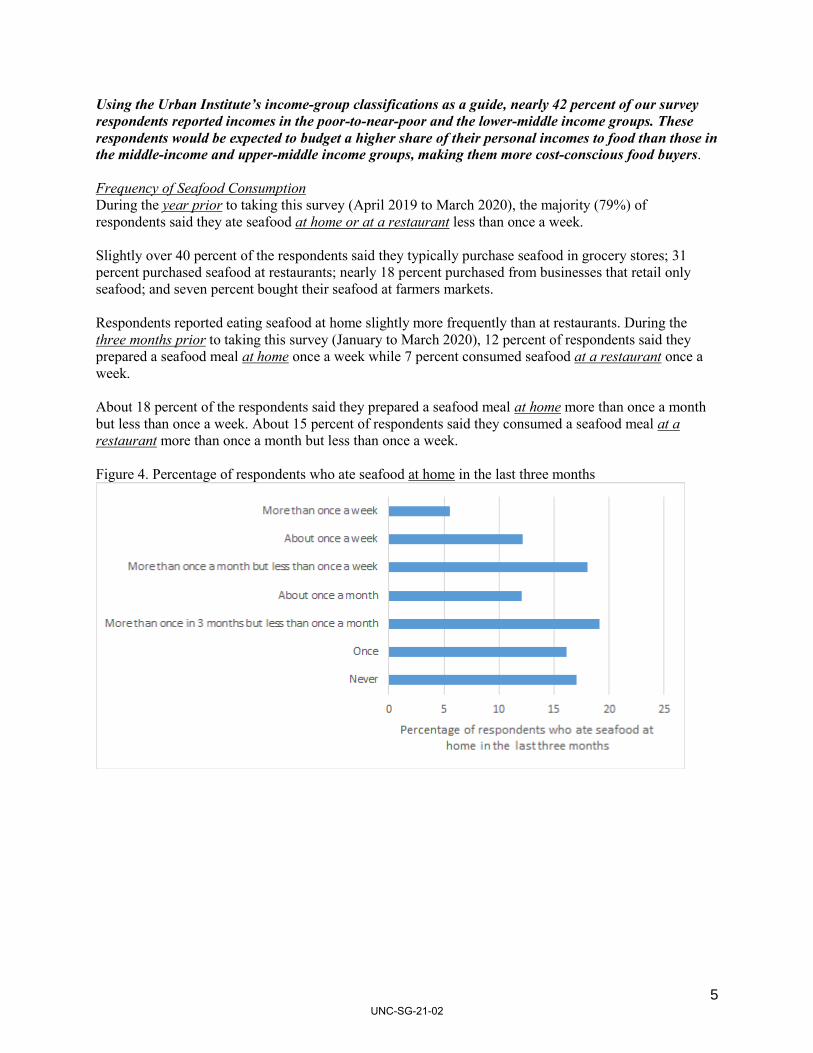
Using the Urban Institute’s income-group classifications as a guide, nearly 42 percent of our survey respondents reported incomes in the poor-to-near-poor and the lower-middle income groups. These respondents would be expected to budget a higher share of their personal incomes to food than those in the middle-income and upper-middle income groups, making them more cost-conscious food buyers. Frequency of Seafood Consumption During the year prior to taking this survey (April 2019 to March 2020), the majority (79%) of respondents said they ate seafood at home or at a restaurant less than once a week. Slightly over 40 percent of the respondents said they typically purchase seafood in grocery stores; 31 percent purchased seafood at restaurants; nearly 18 percent purchased from businesses that retail only seafood; and seven percent bought their seafood at farmers markets. Respondents reported eating seafood at home slightly more frequently than at restaurants. During the three months prior to taking this survey (January to March 2020), 12 percent of respondents said they prepared a seafood meal at home once a week while 7 percent consumed seafood at a restaurant once a week. About 18 percent of the respondents said they prepared a seafood meal at home more than once a month but less than once a week. About 15 percent of respondents said they consumed a seafood meal at a restaurant more than once a month but less than once a week. Figure 4. Percentage of respondents who ate seafood at home in the last three months
UNC-SG-21-02
6
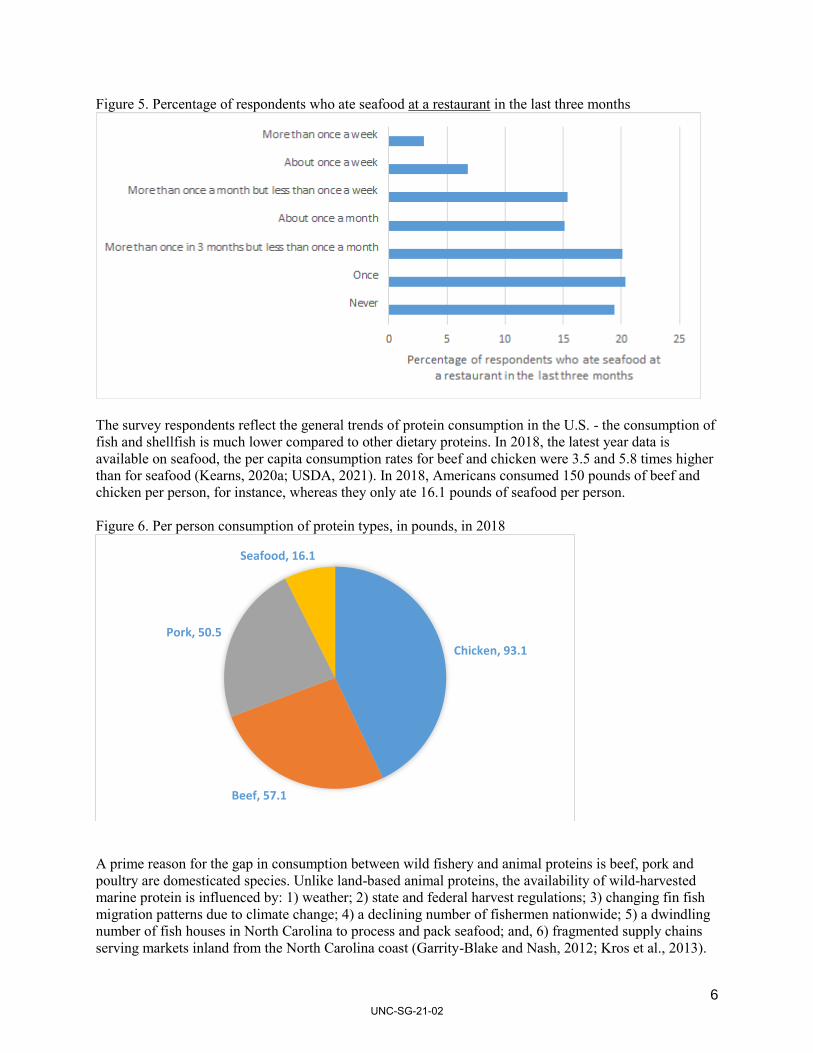
Figure 5. Percentage of respondents who ate seafood at a restaurant in the last three months
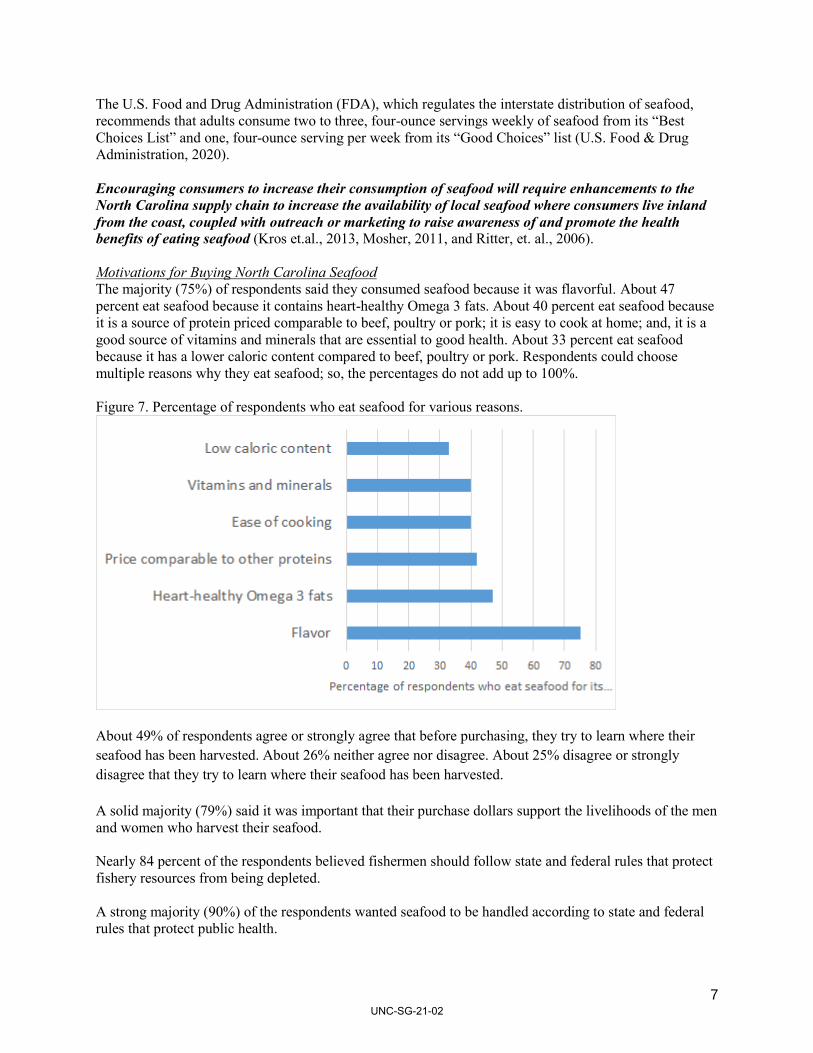
The survey respondents reflect the general trends of protein consumption in the U.S. - the consumption of fish and shellfish is much lower compared to other dietary proteins. In 2018, the latest year data is available on seafood, the per capita consumption rates for beef and chicken were 3.5 and 5.8 times higher than for seafood (Kearns, 2020a; USDA, 2021). In 2018, Americans consumed 150 pounds of beef and chicken per person, for instance, whereas they only ate 16.1 pounds of seafood per person. Figure 6. Per person consumption of protein types, in pounds, in 2018
A prime reason for the gap in consumption between wild fishery and animal proteins is beef, pork and poultry are domesticated species. Unlike land-based animal proteins, the availability of wild-harvested marine protein is influenced by: 1) weather; 2) state and federal harvest regulations; 3) changing fin fish migration patterns due to climate change; 4) a declining number of fishermen nationwide; 5) a dwindling number of fish houses in North Carolina to process and pack seafood; and, 6) fragmented supply chains serving markets inland from the North Carolina coast (Garrity-Blake and Nash, 2012; Kros et al., 2013).
Chicken, 93.1
Beef, 57.1
Pork, 50.5
Seafood, 16.1
UNC-SG-21-02
7
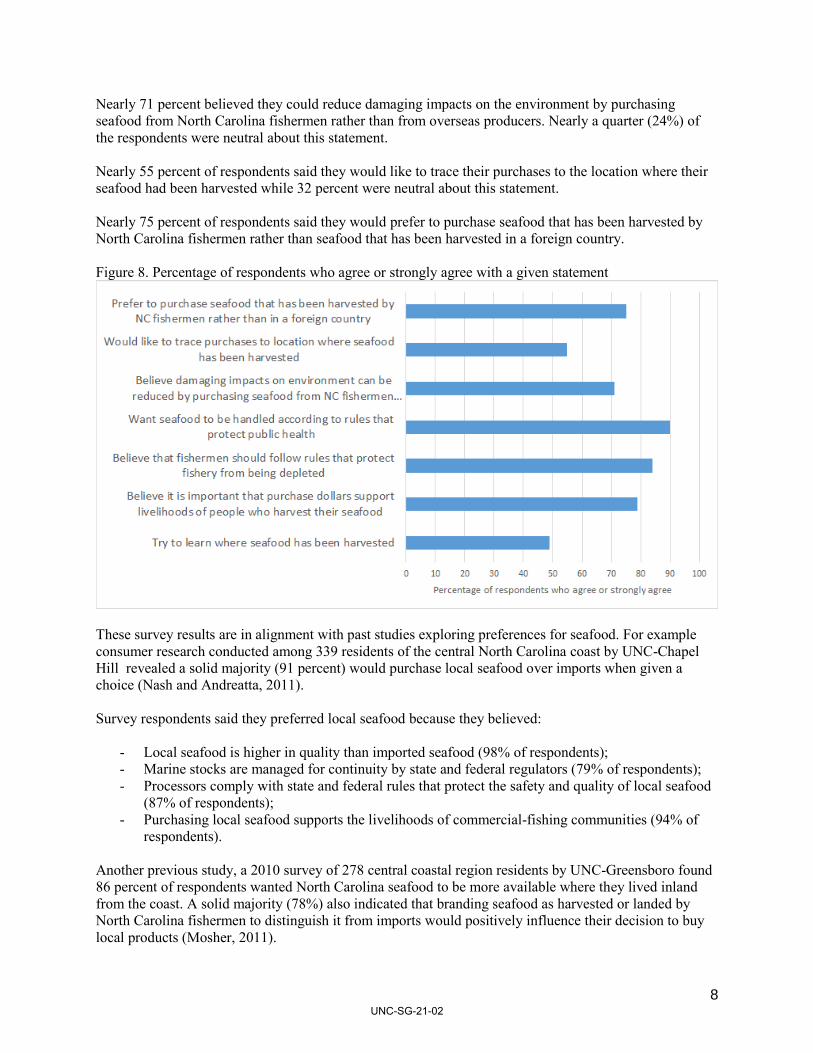
The U.S. Food and Drug Administration (FDA), which regulates the interstate distribution of seafood, recommends that adults consume two to three, four-ounce servings weekly of seafood from its “Best Choices List” and one, four-ounce serving per week from its “Good Choices” list (U.S. Food & Drug Administration, 2020). Encouraging consumers to increase their consumption of seafood will require enhancements to the North Carolina supply chain to increase the availability of local seafood where consumers live inland from the coast, coupled with outreach or marketing to raise awareness of and promote the health benefits of eating seafood (Kros et.al., 2013, Mosher, 2011, and Ritter, et. al., 2006). Motivations for Buying North Carolina Seafood The majority (75%) of respondents said they consumed seafood because it was flavorful. About 47 percent eat seafood because it contains heart-healthy Omega 3 fats. About 40 percent eat seafood because it is a source of protein priced comparable to beef, poultry or pork; it is easy to cook at home; and, it is a good source of vitamins and minerals that are essential to good health. About 33 percent eat seafood because it has a lower caloric content compared to beef, poultry or pork. Respondents could choose multiple reasons why they eat seafood; so, the percentages do not add up to 100%. Figure 7. Percentage of respondents who eat seafood for various reasons.
About 49% of respondents agree or strongly agree that before purchasing, they try to learn where their seafood has been harvested. About 26% neither agree nor disagree. About 25% disagree or strongly disagree that they try to learn where their seafood has been harvested. A solid majority (79%) said it was important that their purchase dollars support the livelihoods of the men and women who harvest their seafood. Nearly 84 percent of the respondents believed fishermen should follow state and federal rules that protect fishery resources from being depleted. A strong majority (90%) of the respondents wanted seafood to be handled according to state and federal rules that protect public health.
UNC-SG-21-02
8
Nearly 71 percent believed they could reduce damaging impacts on the environment by purchasing seafood from North Carolina fishermen rather than from overseas producers. Nearly a quarter (24%) of the respondents were neutral about this statement. Nearly 55 percent of respondents said they would like to trace their purchases to the location where their seafood had been harvested while 32 percent were neutral about this statement. Nearly 75 percent of respondents said they would prefer to purchase seafood that has been harvested by North Carolina fishermen rather than seafood that has been harvested in a foreign country. Figure 8. Percentage of respondents who agree or strongly agree with a given statement
These survey results are in alignment with past studies exploring preferences for seafood. For example consumer research conducted among 339 residents of the central North Carolina coast by UNC-Chapel Hill revealed a solid majority (91 percent) would purchase local seafood over imports when given a choice (Nash and Andreatta, 2011). Survey respondents said they preferred local seafood because they believed:
- Local seafood is higher in quality than imported seafood (98% of respondents); - Marine stocks are managed for continuity by state and federal regulators (79% of respondents); - Processors comply with state and federal rules that protect the safety and quality of local seafood
(87% of respondents); - Purchasing local seafood supports the livelihoods of commercial-fishing communities (94% of
respondents). Another previous study, a 2010 survey of 278 central coastal region residents by UNC-Greensboro found 86 percent of respondents wanted North Carolina seafood to be more available where they lived inland from the coast. A solid majority (78%) also indicated that branding seafood as harvested or landed by North Carolina fishermen to distinguish it from imports would positively influence their decision to buy local products (Mosher, 2011).
UNC-SG-21-02
9
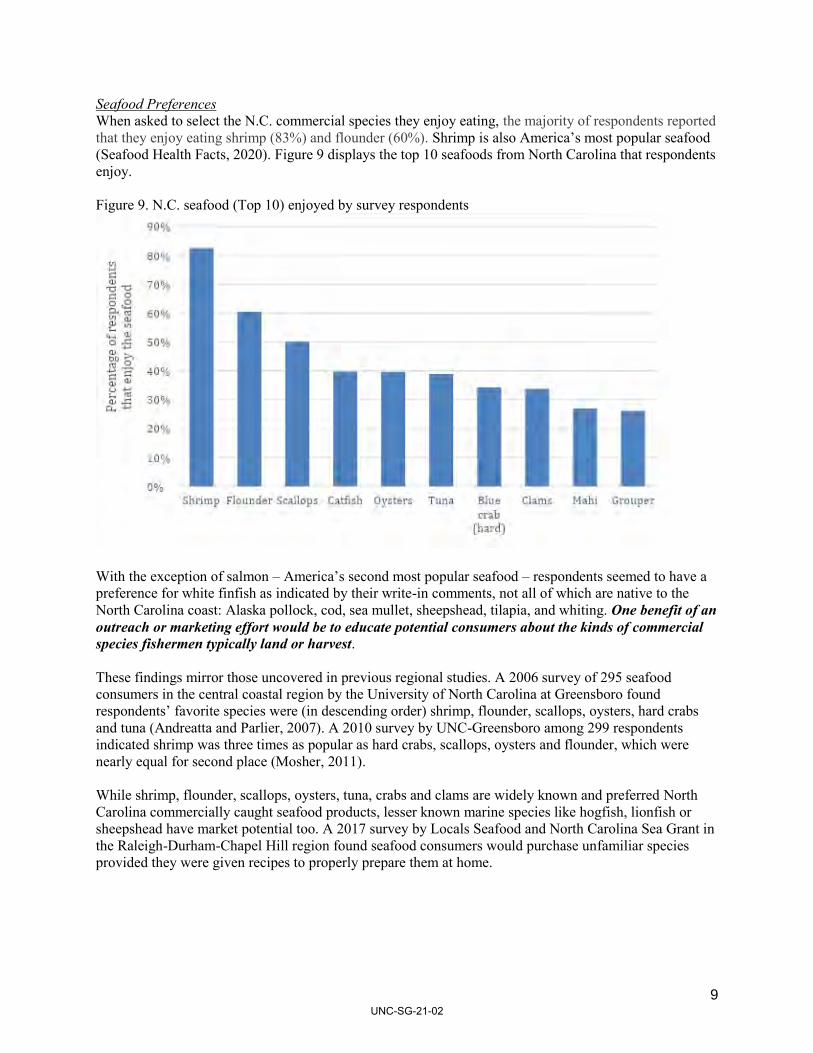
Seafood Preferences When asked to select the N.C. commercial species they enjoy eating, the majority of respondents reported that they enjoy eating shrimp (83%) and flounder (60%). Shrimp is also America’s most popular seafood (Seafood Health Facts, 2020). Figure 9 displays the top 10 seafoods from North Carolina that respondents enjoy. Figure 9. N.C. seafood (Top 10) enjoyed by survey respondents
With the exception of salmon – America’s second most popular seafood – respondents seemed to have a preference for white finfish as indicated by their write-in comments, not all of which are native to the North Carolina coast: Alaska pollock, cod, sea mullet, sheepshead, tilapia, and whiting. One benefit of an outreach or marketing effort would be to educate potential consumers about the kinds of commercial species fishermen typically land or harvest. These findings mirror those uncovered in previous regional studies. A 2006 survey of 295 seafood consumers in the central coastal region by the University of North Carolina at Greensboro found respondents’ favorite species were (in descending order) shrimp, flounder, scallops, oysters, hard crabs and tuna (Andreatta and Parlier, 2007). A 2010 survey by UNC-Greensboro among 299 respondents indicated shrimp was three times as popular as hard crabs, scallops, oysters and flounder, which were nearly equal for second place (Mosher, 2011). While shrimp, flounder, scallops, oysters, tuna, crabs and clams are widely known and preferred North Carolina commercially caught seafood products, lesser known marine species like hogfish, lionfish or sheepshead have market potential too. A 2017 survey by Locals Seafood and North Carolina Sea Grant in the Raleigh-Durham-Chapel Hill region found seafood consumers would purchase unfamiliar species provided they were given recipes to properly prepare them at home.
UNC-SG-21-02
10
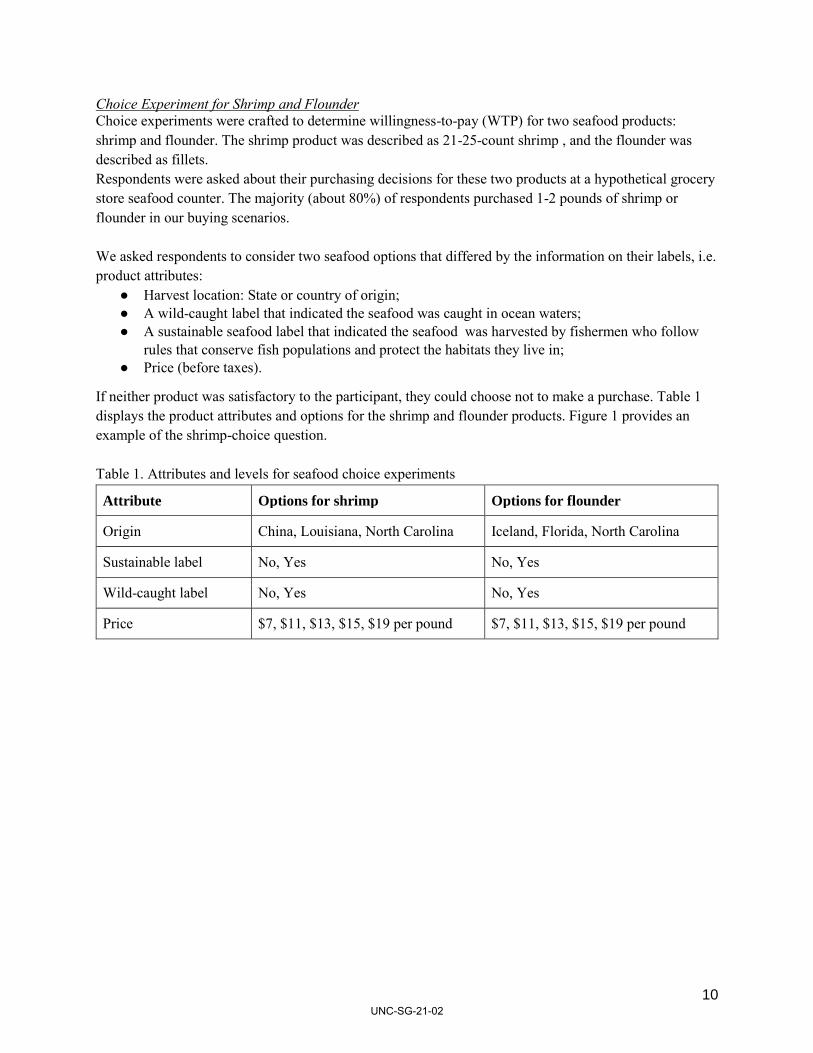
Choice Experiment for Shrimp and Flounder Choice experiments were crafted to determine willingness-to-pay (WTP) for two seafood products: shrimp and flounder. The shrimp product was described as 21-25-count shrimp , and the flounder was described as fillets. Respondents were asked about their purchasing decisions for these two products at a hypothetical grocery store seafood counter. The majority (about 80%) of respondents purchased 1-2 pounds of shrimp or flounder in our buying scenarios. We asked respondents to consider two seafood options that differed by the information on their labels, i.e. product attributes:
● Harvest location: State or country of origin; ● A wild-caught label that indicated the seafood was caught in ocean waters; ● A sustainable seafood label that indicated the seafood was harvested by fishermen who follow
rules that conserve fish populations and protect the habitats they live in; ● Price (before taxes).
If neither product was satisfactory to the participant, they could choose not to make a purchase. Table 1 displays the product attributes and options for the shrimp and flounder products. Figure 1 provides an example of the shrimp-choice question. Table 1. Attributes and levels for seafood choice experiments
Attribute Options for shrimp Options for flounder
Origin China, Louisiana, North Carolina Iceland, Florida, North Carolina
Sustainable label No, Yes No, Yes
Wild-caught label No, Yes No, Yes
Price $7, $11, $13, $15, $19 per pound $7, $11, $13, $15, $19 per pound
UNC-SG-21-02
11
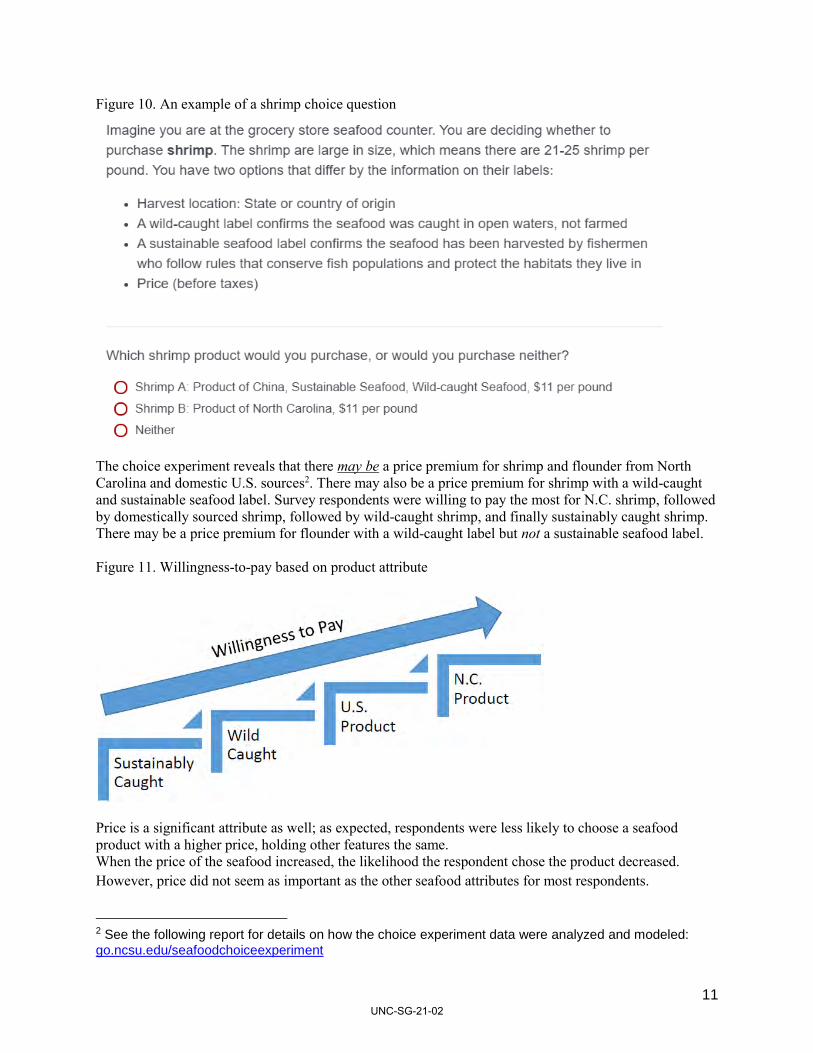
Figure 10. An example of a shrimp choice question
The choice experiment reveals that there may be a price premium for shrimp and flounder from North Carolina and domestic U.S. sources2. There may also be a price premium for shrimp with a wild-caught and sustainable seafood label. Survey respondents were willing to pay the most for N.C. shrimp, followed by domestically sourced shrimp, followed by wild-caught shrimp, and finally sustainably caught shrimp. There may be a price premium for flounder with a wild-caught label but not a sustainable seafood label. Figure 11. Willingness-to-pay based on product attribute
Price is a significant attribute as well; as expected, respondents were less likely to choose a seafood product with a higher price, holding other features the same. When the price of the seafood increased, the likelihood the respondent chose the product decreased. However, price did not seem as important as the other seafood attributes for most respondents.
2 See the following report for details on how the choice experiment data were analyzed and modeled:
go.ncsu.edu/seafoodchoiceexperiment
UNC-SG-21-02
12
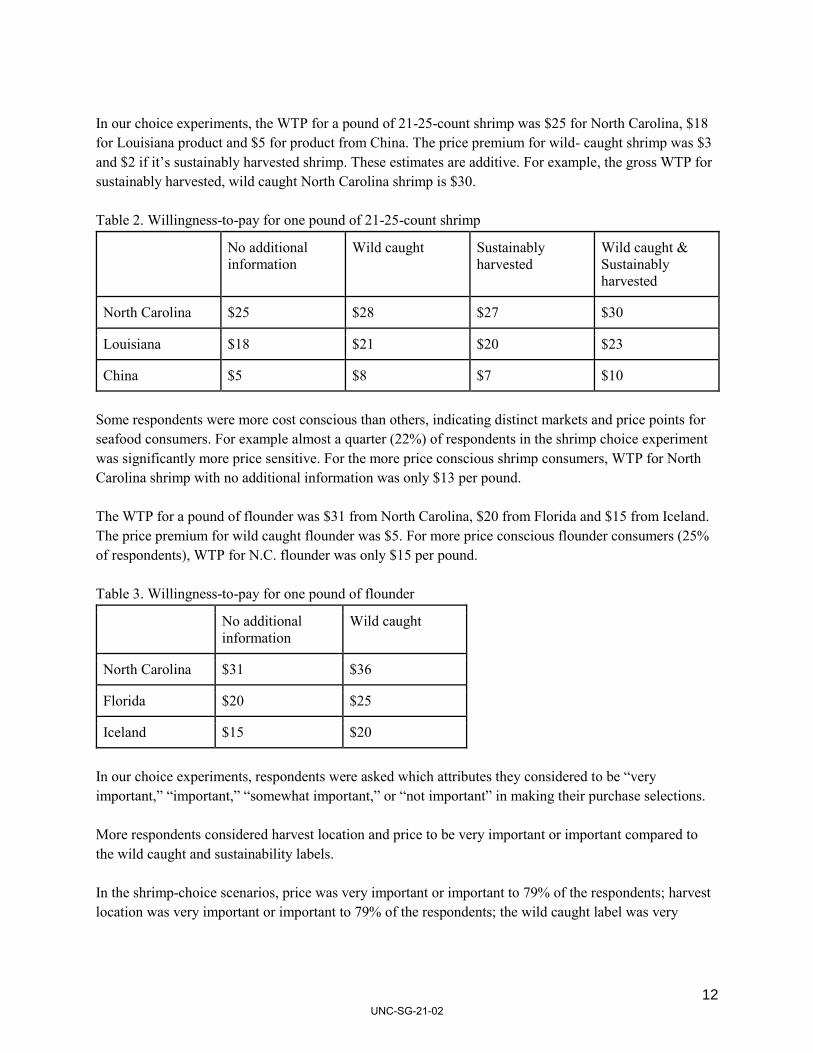
In our choice experiments, the WTP for a pound of 21-25-count shrimp was $25 for North Carolina, $18 for Louisiana product and $5 for product from China. The price premium for wild- caught shrimp was $3 and $2 if it’s sustainably harvested shrimp. These estimates are additive. For example, the gross WTP for sustainably harvested, wild caught North Carolina shrimp is $30. Table 2. Willingness-to-pay for one pound of 21-25-count shrimp
No additional information
Wild caught Sustainably harvested
Wild caught & Sustainably harvested
North Carolina $25 $28 $27 $30
Louisiana $18 $21 $20 $23
China $5 $8 $7 $10
Some respondents were more cost conscious than others, indicating distinct markets and price points for seafood consumers. For example almost a quarter (22%) of respondents in the shrimp choice experiment was significantly more price sensitive. For the more price conscious shrimp consumers, WTP for North Carolina shrimp with no additional information was only $13 per pound. The WTP for a pound of flounder was $31 from North Carolina, $20 from Florida and $15 from Iceland. The price premium for wild caught flounder was $5. For more price conscious flounder consumers (25% of respondents), WTP for N.C. flounder was only $15 per pound. Table 3. Willingness-to-pay for one pound of flounder
No additional information
Wild caught
North Carolina $31 $36
Florida $20 $25
Iceland $15 $20
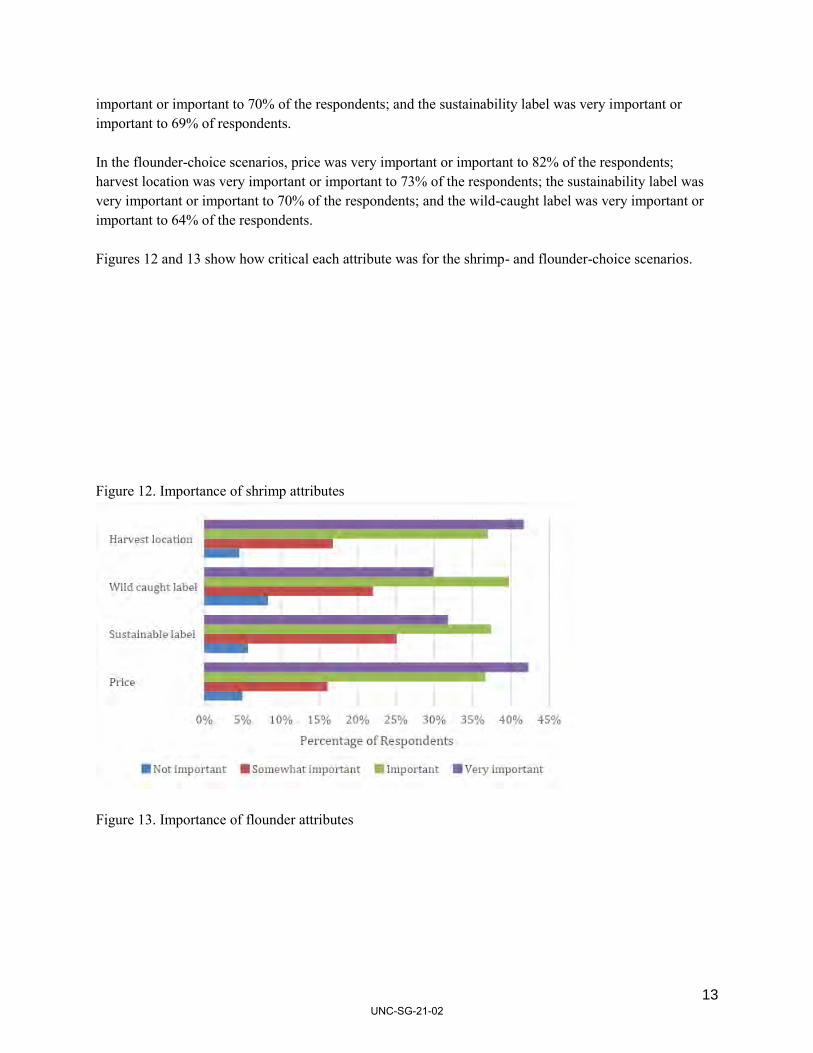
In our choice experiments, respondents were asked which attributes they considered to be “very important,” “important,” “somewhat important,” or “not important” in making their purchase selections. More respondents considered harvest location and price to be very important or important compared to the wild caught and sustainability labels. In the shrimp-choice scenarios, price was very important or important to 79% of the respondents; harvest location was very important or important to 79% of the respondents; the wild caught label was very
UNC-SG-21-02
13
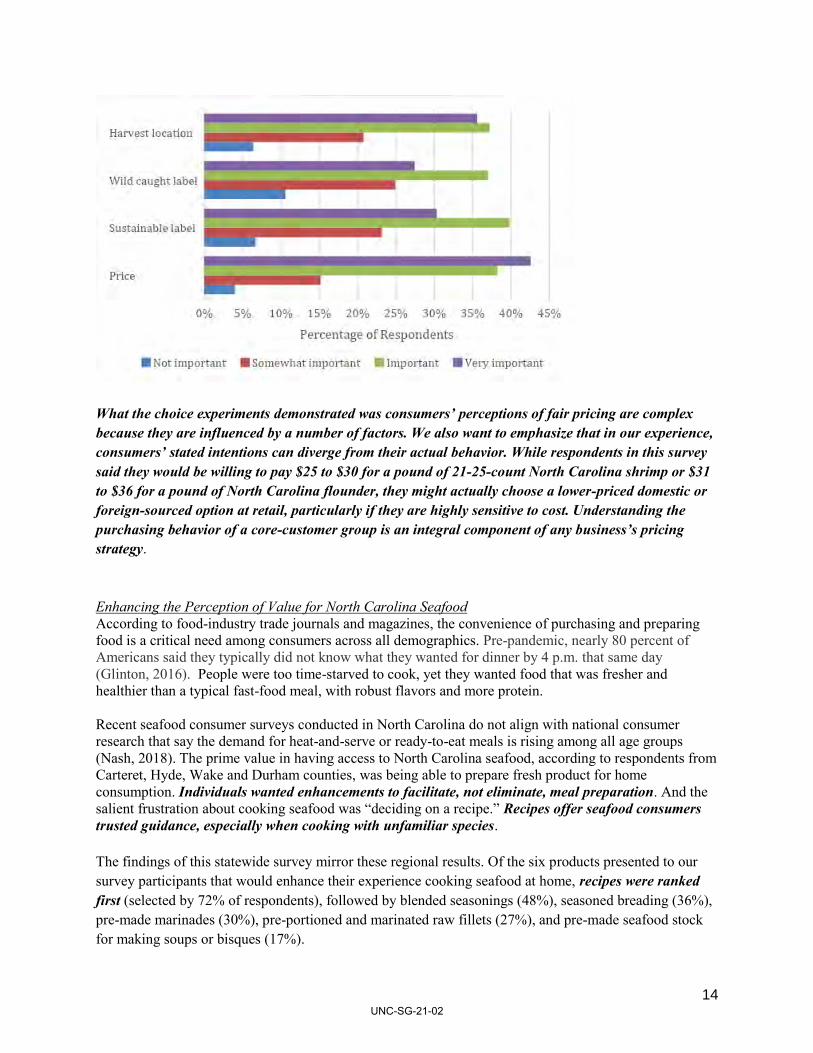
important or important to 70% of the respondents; and the sustainability label was very important or important to 69% of respondents. In the flounder-choice scenarios, price was very important or important to 82% of the respondents; harvest location was very important or important to 73% of the respondents; the sustainability label was very important or important to 70% of the respondents; and the wild-caught label was very important or important to 64% of the respondents. Figures 12 and 13 show how critical each attribute was for the shrimp- and flounder-choice scenarios. Figure 12. Importance of shrimp attributes
Figure 13. Importance of flounder attributes
UNC-SG-21-02
14
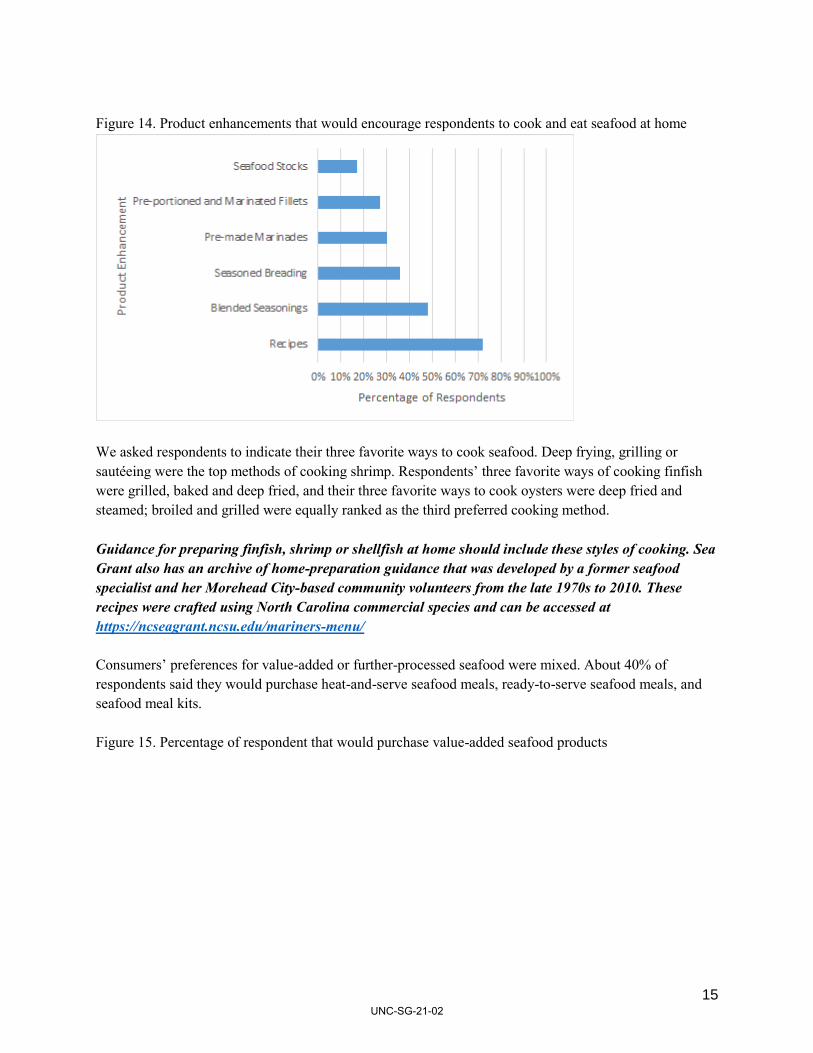
What the choice experiments demonstrated was consumers’ perceptions of fair pricing are complex because they are influenced by a number of factors. We also want to emphasize that in our experience, consumers’ stated intentions can diverge from their actual behavior. While respondents in this survey said they would be willing to pay $25 to $30 for a pound of 21-25-count North Carolina shrimp or $31 to $36 for a pound of North Carolina flounder, they might actually choose a lower-priced domestic or foreign-sourced option at retail, particularly if they are highly sensitive to cost. Understanding the purchasing behavior of a core-customer group is an integral component of any business’s pricing strategy. Enhancing the Perception of Value for North Carolina Seafood According to food-industry trade journals and magazines, the convenience of purchasing and preparing food is a critical need among consumers across all demographics. Pre-pandemic, nearly 80 percent of Americans said they typically did not know what they wanted for dinner by 4 p.m. that same day (Glinton, 2016). People were too time-starved to cook, yet they wanted food that was fresher and healthier than a typical fast-food meal, with robust flavors and more protein. Recent seafood consumer surveys conducted in North Carolina do not align with national consumer research that say the demand for heat-and-serve or ready-to-eat meals is rising among all age groups (Nash, 2018). The prime value in having access to North Carolina seafood, according to respondents from Carteret, Hyde, Wake and Durham counties, was being able to prepare fresh product for home consumption. Individuals wanted enhancements to facilitate, not eliminate, meal preparation. And the salient frustration about cooking seafood was “deciding on a recipe.” Recipes offer seafood consumers trusted guidance, especially when cooking with unfamiliar species. The findings of this statewide survey mirror these regional results. Of the six products presented to our survey participants that would enhance their experience cooking seafood at home, recipes were ranked first (selected by 72% of respondents), followed by blended seasonings (48%), seasoned breading (36%), pre-made marinades (30%), pre-portioned and marinated raw fillets (27%), and pre-made seafood stock for making soups or bisques (17%).
UNC-SG-21-02
15
Figure 14. Product enhancements that would encourage respondents to cook and eat seafood at home
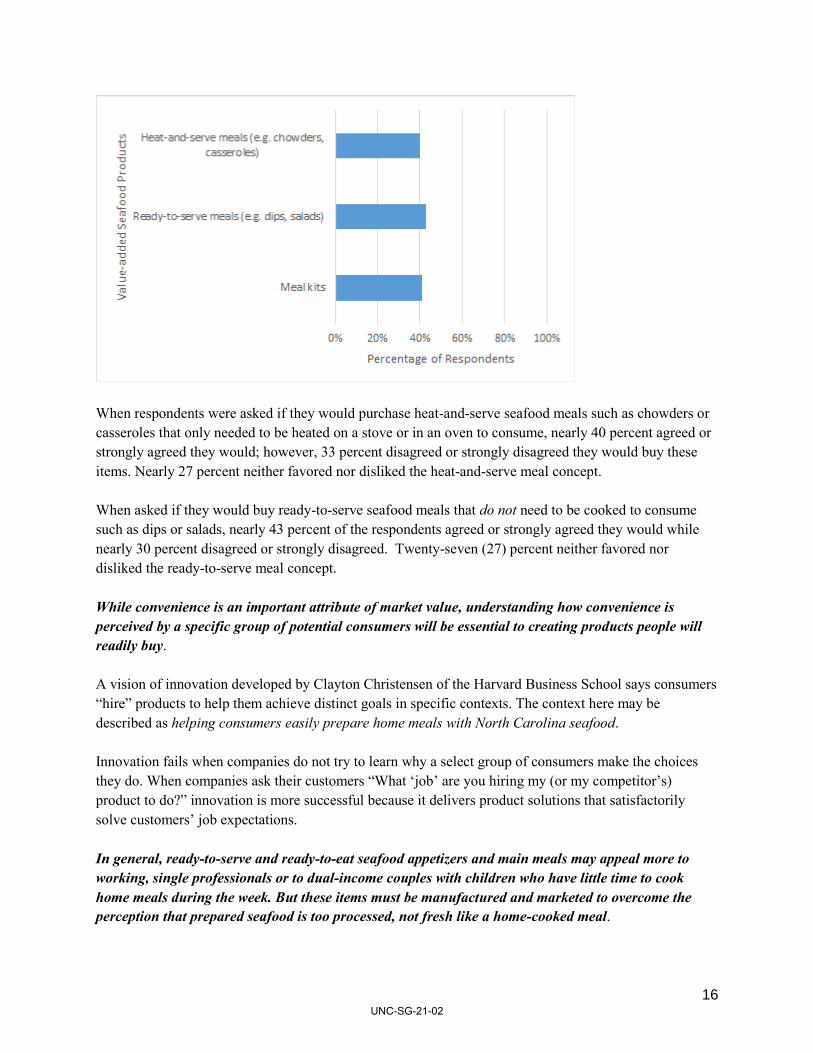
We asked respondents to indicate their three favorite ways to cook seafood. Deep frying, grilling or sautéeing were the top methods of cooking shrimp. Respondents’ three favorite ways of cooking finfish were grilled, baked and deep fried, and their three favorite ways to cook oysters were deep fried and steamed; broiled and grilled were equally ranked as the third preferred cooking method. Guidance for preparing finfish, shrimp or shellfish at home should include these styles of cooking. Sea Grant also has an archive of home-preparation guidance that was developed by a former seafood specialist and her Morehead City-based community volunteers from the late 1970s to 2010. These recipes were crafted using North Carolina commercial species and can be accessed at https://ncseagrant.ncsu.edu/mariners-menu/ Consumers’ preferences for value-added or further-processed seafood were mixed. About 40% of respondents said they would purchase heat-and-serve seafood meals, ready-to-serve seafood meals, and seafood meal kits. Figure 15. Percentage of respondent that would purchase value-added seafood products
UNC-SG-21-02
16
When respondents were asked if they would purchase heat-and-serve seafood meals such as chowders or casseroles that only needed to be heated on a stove or in an oven to consume, nearly 40 percent agreed or strongly agreed they would; however, 33 percent disagreed or strongly disagreed they would buy these items. Nearly 27 percent neither favored nor disliked the heat-and-serve meal concept. When asked if they would buy ready-to-serve seafood meals that do not need to be cooked to consume such as dips or salads, nearly 43 percent of the respondents agreed or strongly agreed they would while nearly 30 percent disagreed or strongly disagreed. Twenty-seven (27) percent neither favored nor disliked the ready-to-serve meal concept. While convenience is an important attribute of market value, understanding how convenience is perceived by a specific group of potential consumers will be essential to creating products people will readily buy. A vision of innovation developed by Clayton Christensen of the Harvard Business School says consumers “hire” products to help them achieve distinct goals in specific contexts. The context here may be described as helping consumers easily prepare home meals with North Carolina seafood. Innovation fails when companies do not try to learn why a select group of consumers make the choices they do. When companies ask their customers “What ‘job’ are you hiring my (or my competitor’s) product to do?” innovation is more successful because it delivers product solutions that satisfactorily solve customers’ job expectations. In general, ready-to-serve and ready-to-eat seafood appetizers and main meals may appeal more to working, single professionals or to dual-income couples with children who have little time to cook home meals during the week. But these items must be manufactured and marketed to overcome the perception that prepared seafood is too processed, not fresh like a home-cooked meal.
UNC-SG-21-02
17
Last, we asked our respondents about their interest in meal kits, which contain pre-portioned food ingredients and recipes in one package to make home-cooked meals easier to prepare. The popularity of meal-preparation services is that the ingredients come pre-portioned, ready to assemble and cook, which saves time at the recipe-planning stage, time spent at a grocery store and time at home dicing and preparing individual ingredients. Most meal kits are ready in about one-half hour. The overarching value of meal kits is more convenience, less preparation hassle and better nutrition for people who believe they are too busy to cook their own meals. The criticisms of meal kits are the excessive packaging required to keep food fresh and microbiologically safe as well as the cost. Meal kits tend to be less expensive than restaurant meals, but they are more expensive than buying the ingredients to cook at home (Burke, 2018; Schmeiser, 2017; Tapp, 2018). Nearly 41 percent of the respondents said they would purchase meal kits while 26 percent said they would not. Nearly 33 percent neither liked nor disliked the meal-kit concept. Previous seafood consumer research in North Carolina indicates that meal kits address a desire for fresh ingredients, pre-portioning to reduce food waste and recipes to properly cook a seafood meal; however, people stressed they wanted to assemble their own kit from a selection of seafood and non-seafood ingredients at a single venue. This type of setup would allow them to judge the quality or freshness of ingredients for themselves (Nash, 2018).
Recommendations This survey is the latest among several local and regional surveys conducted since 2005 that shows in-state seafood buyers prefer, if given a choice, North Carolina seafood over out-of-state and foreign seafood. For this section, we consulted with state-agency specialists who have for many years collaborated with commercial-fishing stakeholders on a variety of projects, and as a result, have insights on how the commercial industry might capture greater market share across the state for its products: John
UNC-SG-21-02
18
Aydlett of the North Carolina Department of Agriculture & Consumer Services and Scott Baker and Sara Mirabilio, fisheries specialists with North Carolina Sea Grant. An effective food-marketing program must address four elements: product, promotion, place and price (Ritter, et.al., 2006).
The product should meet target consumers’ expectations for nutrition, taste and convenience (for example, the ease a customer has preparing a home meal with local seafood).
The results of this survey show strong consumer demand for North Carolina seafood because its market value has these attributes:
- It is flavorful and generally promotes good health; - Purchase dollars support the livelihoods of commercial fishermen; - Fishermen follow state and federal rules that protect the continuity of limited fishery resources; - Dealers follow state and federal rules that protect the safety of seafood; - The number of miles local seafood travels from the point of harvest to the end user is much lower
than imported seafood, resulting in a smaller “carbon footprint.” (amount of carbon dioxide and other carbons emitted into the atmosphere due to fossil-fuel consumption)
Promotion should inform potential customers why North Carolina seafood is worth buying and where it can be purchased. The attributes of market value this survey uncovered should help build effective advertising campaigns.
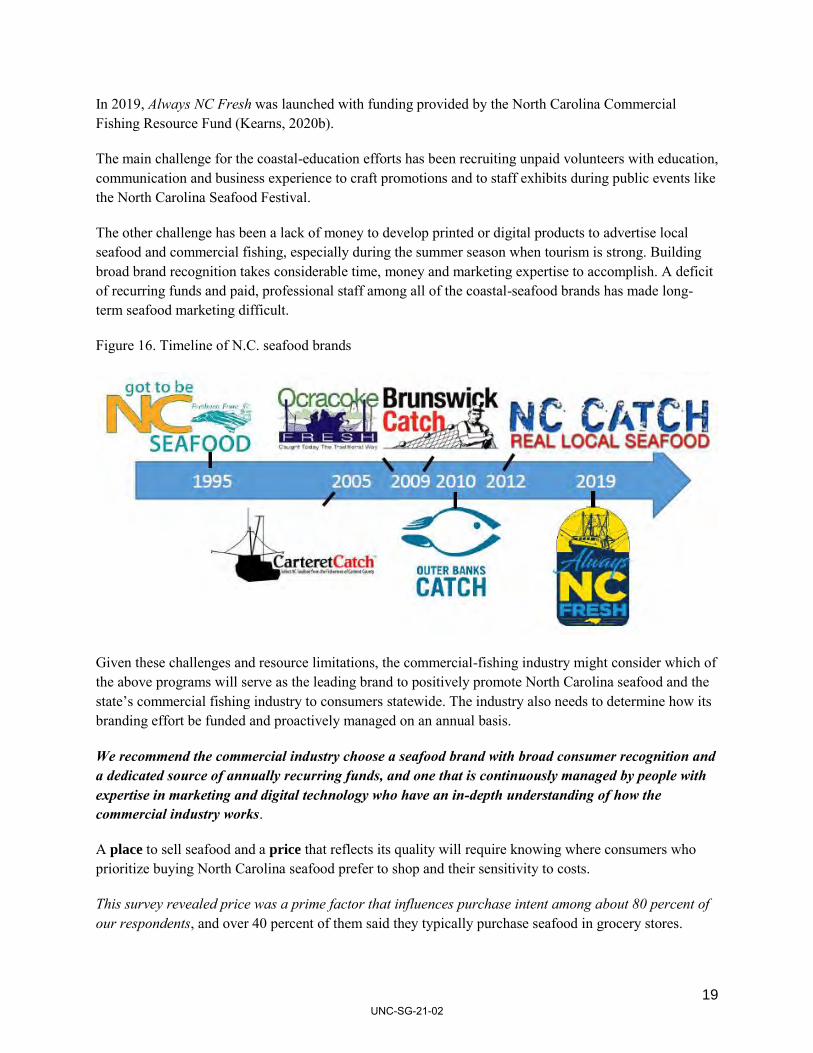
Since about 1995, the North Carolina Department of Agriculture & Consumer Services (NCDA&CS) has supported the Got to be NC Seafood program, which raises consumer awareness of the businesses that produce and sell wild-caught and cultured marine and freshwater species (John Aydlett, NCDA&CS seafood marketing specialist, personal communication).
Between 2005 and 2012, five local-seafood educational initiatives were unveiled along the coast to also raise public awareness of North Carolina seafood and commercial fishing: Brunswick Catch, Carteret Catch, North Carolina Catch, Ocracoke Fresh, and Outer Banks Catch (Nash, Mirabilio and Baker, 2014).
The messages of the “catch groups” have been primarily educational, informing consumers that:
- Many species harvested along the North Carolina coast are available in certain seasons of the year;
- Fishermen are good stewards of the environment because they observe state and federal rules that protect the continuity of limited fishery resources;
- Processors observe state and federal rules that protect public health by ensuring seafood is safe to eat;
- Buying local seafood supports the livelihoods of fishermen and seafood dealers; - The lifestyle and heritage of commercial-fishing communities have value and should be
celebrated.
UNC-SG-21-02
19
In 2019, Always NC Fresh was launched with funding provided by the North Carolina Commercial Fishing Resource Fund (Kearns, 2020b).
The main challenge for the coastal-education efforts has been recruiting unpaid volunteers with education, communication and business experience to craft promotions and to staff exhibits during public events like the North Carolina Seafood Festival.
The other challenge has been a lack of money to develop printed or digital products to advertise local seafood and commercial fishing, especially during the summer season when tourism is strong. Building broad brand recognition takes considerable time, money and marketing expertise to accomplish. A deficit of recurring funds and paid, professional staff among all of the coastal-seafood brands has made long-term seafood marketing difficult.
Figure 16. Timeline of N.C. seafood brands
Given these challenges and resource limitations, the commercial-fishing industry might consider which of the above programs will serve as the leading brand to positively promote North Carolina seafood and the state’s commercial fishing industry to consumers statewide. The industry also needs to determine how its branding effort be funded and proactively managed on an annual basis.
We recommend the commercial industry choose a seafood brand with broad consumer recognition and a dedicated source of annually recurring funds, and one that is continuously managed by people with expertise in marketing and digital technology who have an in-depth understanding of how the commercial industry works.
A place to sell seafood and a price that reflects its quality will require knowing where consumers who prioritize buying North Carolina seafood prefer to shop and their sensitivity to costs.
This survey revealed price was a prime factor that influences purchase intent among about 80 percent of our respondents, and over 40 percent of them said they typically purchase seafood in grocery stores.
UNC-SG-21-02
20
A 2013 study by North Carolina Sea Grant and the East Carolina College of Business, however, found the availability of North Carolina whole crabs, flounder and shrimp at major grocery chains decreased as stores became more distant from the coast. Knowledge of these species, specifically where they were harvested, also decreased among seafood-department managers the more distant stores were from the coast. Also, large grocers like Food Lion, Harris Teeter, Kroger, and Whole Foods tended to have a uniform supply of seafood, but the supply consistency was likely due to imports. North Carolina seafood would have to compete, primarily on price, with these imports.
The study also found no indication of significant price variation regardless of the retailer’s geographic proximity to the coast, suggesting seafood prices are set based on market conditions as opposed to being largely cost based (for example, prices that account for shipping costs).
This raises an important question: Does offering North Carolina seafood through major grocery chains make strategic sense? Will stakeholders receive enough revenue to recover their handling and distribution costs and earn a profit? We recommend further market research to help answer these questions.
Unlike distribution routes to the northeastern USA, the commercial industry suffers from fragmented and underdeveloped supply chains moving west from the coast to markets further inland. The Sea Grant-East Carolina College of Business study recommended the following:
- Construct at least one processing and cold-storage aggregation facility on the coast. A high-quality cold storage facility with the capacity to freeze large volumes of seasonal seafood would permit the distribution of local products to better fit consumer demand and increase industry profits.
- Build a centralized distribution center farther inland from the coast. This distribution center would act as an aggregator of commodities sourced from all coastal regions and allow local seafood to flow across North Carolina through more established and efficient distribution channels.
Establishing and maintaining shared-use infrastructure will require considerable collaboration and coordination among many commercial-fishing stakeholders (Kros, Rowe and Nash, 2013). The full report is at https://go.ncsu.edu/seafood-supply-chain
We recommend the industry review and consider the recommendations in the 2013 supply-chain study.
Finally, as two North Carolina seafood-fraud cases revealed in 2020, some processors will capitalize on the demand for local by labeling imported seafood as domestic product (Haugdahl, 2020; Walker, 2020).
But out of necessity, some dealers and retailers fill gaps in the availability of popular seafood with products from other states and other countries because their customers want access to cooked crab meat, shrimp or tunas, for instance, the year round.
Many consumers care where their food is sourced (Pages, 2017). Being transparent about the origins of seafood will be critical to attracting and retaining customers who want to support North Carolina seafood businesses.
UNC-SG-21-02
21
Can a marketing program encourage consumers to prioritize buying from North Carolina seafood producers even when some of the seafood available does not originate from North Carolina waters?
How the commercial industry should address this question and invest its financial resources to take advantage of new inland markets will require ongoing conversations and collaborative projects with its state-agency partners.
We recommend that wild-caught seafood producers consider reestablishing an annual meeting, like the North Carolina Aquaculture Development Conference, where stakeholders and their state-agency partners can discuss the opportunities and challenges of selling more local seafood across North Carolina. NCDA&CS and North Carolina Sea Grant are willing to help industry members organize an initial meeting.
References Advice about Eating Fish. 2020. U.S. Food and Drug Administration. Available at https://www.fda.gov/food/consumers/advice-about-eating-fish Andreatta, S. and A. Parlier. Harnessing Consumer Preferences to Create New Markets for North Carolina Seafood. Available at https://ncseagrant.ncsu.edu/ncseagrant_docs/FRG/06-ST-02-Final_Report.pdf Burke, E. 2018. Pros and Cons of Meal Kits. Money Management International. Available at https://www.moneymanagement.org/blog/pros-and-cons-of-meal-kits Food Prices and Spending. 2020. Economic Research Service. U.S. Department of Agriculture. Available at https://www.ers.usda.gov/data-products/ag-and-food-statistics-charting-the-essentials/food-prices-and-spending/ Garrity-Blake, B. and B. Nash. 2012. An Inventory of North Carolina Fish Houses: Five-Year Update. North Carolina Sea Grant. Available at https://ncseagrant.ncsu.edu/ncseagrant_docs/products/2010s/fishhouse_inventory_2012.pdf Glinton, S. (2016). What’s for Dinner? The Options for a Fast Answer Multiply. National Public Radio. Available at: http://www.npr.org/sections/thesalt/2016/05/03/476488223/what-s-for-dinner-the-options-for-a-fast-answer-multiply
Haugdahl, S. 2020. Seafood Scandal: NC man admits to selling foreign crab as 'Product of USA.' 13 News Now. Available at https://www.13newsnow.com/article/life/food/seafood-scandal-nc-man-admits-to-selling-foreign-crab-as-product-of-usa/291-ca808acf-3880-45e3-b444-fe7733bfff0a
Household Income Quintiles. 2020. Tax Policy Center. Urban Institute and Brookings Institution. Available at https://www.taxpolicycenter.org/statistics/household-income-quintiles Kearns, M. 2020a. US seafood consumption rises to highest level since 2007, but falls short of USDA recommendations. Seafood Source. Available at https://www.seafoodsource.com/news/supply-trade/us-seafood-consumption-rises-to-the-highest-level-seen-since-2007-but-falls-short-of-usda-recommendations
UNC-SG-21-02
22
Kearns, M. 2020b. New Public Relations Campaign Shines a Spotlight on North Carolina Commercial Fishing. Seafood Source. Available at https://www.seafoodsource.com/news/supply-trade/new-public-relations-campaign-shines-a-spotlight-on-north-carolina-commercial-fishing
Kros, J., Jason Rowe and Barry Nash. 2013. A Supply Chain Analysis of North Carolina’s Commercial Fishing Industry. Available at: https://ncseagrant.ncsu.edu/ncseagrant_docs/products/2010s/supply_chain_analysis_nc_commercial_fishing.pdf Mosher, K. 2011. Local Catch: And the Survey Says: Local Seafood Reigns. Coastwatch. Winter Issue. Available at https://ncseagrant.ncsu.edu/coastwatch/previous-issues/2011-2/winter-2011/local-catch-and-the-survey-says-local-seafood-reigns/
Nash, B. 2018. Discerning Consumer Needs and Product-Safety Specifications of Ready-to-Eat, Seafood Meals for the “Fast-Dinner” Market, R/MG 1612. North Carolina Sea Grant
Nash, B, S. Mirabilio and M.S. Baker. 2014. Developing Commercial Identities to Raise Awareness of Local Seafood. Journal of Extension, 52(5). Available at: http://www.joe.org/joe/2014october/iw8.php
Nash, B. and S. Andreatta. 2011. New Business Models for Small-Scale Fishermen and Processors. Available at https://ncseagrant.ncsu.edu/ncseagrant_docs/products/2010s/new_biz_model_fishermen_11-05.pdf Overview of the U.S. Seafood Supply. 2020. Seafood Health Facts. Available at https://www.seafoodhealthfacts.org/seafood-choices/overview-us-seafood-supply Pages, H. 2017. Transparency Content and the Consumer Journey. Response Media. Available at https://www.responsemedia.com/wp-content/uploads/2017/07/RM_Transparency_Survey_Final.pdf Ritter, L., B. Nash and W. Small. 2006. Branding Seafood: Developing a Marketing Plan to Sell Value-added Seafood Products. North Carolina Sea Grant. Available at https://ncseagrant.ncsu.edu/ncseagrant_docs/products/2000s/bp_branding_seafood.pdf Schmeiser, L. 2017. Meal Kits Ask You to Pick Your Battle: Decrease Food Waste or Actual Waste? Observer. Available at https://observer.com/2017/04/packaging-waste-blue-apron-meal-kits/ Snider, S. 2019. Where Do I Fall in the American Economic Class System? U.S. News & World Report. Available at https://finance.yahoo.com/news/where-fall-american-economic-class-194318488.html Tapp, F. 2018. The Pros and Cons of Food Delivery and Meal Prep Services. Huffington Post. Available at https://www.huffpost.com/entry/food-delivery-service-pros-cons_n_5b992d94e4b0cf7b00459d2c
United States Department of Agriculture. 2021. Food Availability (Per Capita) Data System. Economic Research Service. Available at https://www.ers.usda.gov/data-products/food-availability-per-capita-data-system/
Walker, S. 2020. Columbia seafood company head gets year in prison for selling falsely-labeled crab meat. OBX Today. Available at https://www.obxtoday.com/top-stories/columbia-seafood-company-head-gets-year-in-prison-for-selling-falsely-labeled-crab-meat/
UNC-SG-21-02