consumer debt level of the department of health …
TRANSCRIPT
CONSUMER DEBT LEVEL OF THE DEPARTMENT OF HEALTH PUB LIC SERVANTS IN MAHIKENG
by
LESOLOBE PATRICK MOAISI
submitted in accordance with the requirements for the degree of
MASTER OF COMMERCE
in the subject
BUSINESS MANAGEMENT
at the
UNIVERSITY OF SOUTH AFRICA
SUPERVISOR: PROF M S NGWENYA
NOVEMBER 2013
Lesolobe Moaisi Page i
DECLARATION
Student number: 33710570
I declare that:
CONSUMER DEBT LEVEL OF THE DEPARTMENT OF HEALTH PUB LIC
SERVANTS IN MAHIKENG is my own work and that all the sources that I have used
or quoted have been indicated and acknowledged by means of complete references.
…………………………………. … …………………
MR L.P. MOAISI DATE
Lesolobe Moaisi Page ii
ABSTRACT
Studies as described in the literature review indicate that most South Africans are
highly in debt. The South African Reserve Bank’s quarterly bulletin is one of the
prominent barometers for measuring household debt in the country and over the last
five years has been indicating a steady decline but still very high household debt
among South Africans. Studies have also shown that this relates to poor financial
literacy and consumer ignorance in applying basic financial management practices.
This is discussed in Chapter two of the study.
The aim of the study was to determine the consumer debt level of the Department of
Health public servants in Mahikeng, North West Province. This study used a
consumer survey to measure consumer indebtedness among public servants in
Mahikeng.
The results of the study support literature in that the study found that most public
servants are indebted. The findings also showed that 63% of the public servants
spent more than 20% of their income in servicing debt. Thirteen per cent of the
public servants taking part in the study had been served with either garnishee or
emolument orders.
The results of the study seem to suggest that public servants working for the
Department of Health in Mahikeng and taking part in the study were indebted.
Keywords : Consumer debt, financial literacy, over-indebtedness, credit providers,
public servants, garnishee order

Lesolobe Moaisi Page iii
ACKNOWLEDGEMENTS
My gratitude goes to
Firstly, UNISA, for their enormous support through the research workshop I
attended, which enlightened me to work confidently through my dissertation;
The North West Department of Health, for allowing me to conduct the study on their
premises. I will definitely provide the department with a copy of the report;
My supervisor, Professor Ngwenya, for the guidance and support he provided to
enable me to complete this project. His patience and respect need to be shared with
others as it provided the hope and enthusiasm to complete my dissertation;
Mr Andries Masenge, for his assistance with the development of the questionnaires,
and his lessons on data capturing and data analysis.
To my wife, Kgalalelo and two sons Odirile and Modisa, for sacrificing family time for
me to fulfil my dream. Thank you and I owe you; and
Finally, I thank my relatives and colleagues whose faith and confidence in me
continued to drive my quest for excellence and purpose.
After all, God knows what we need.

Lesolobe Moaisi Page iv
TABLE OF CONTENTS
Declaration......................................... ......................................................................... i
Abstract..................................... .................................................................................. ii
Acknowledgement........................ .............................................................................. iii
Table of contents.........................................................................................................iv
List of figures...................................................................................................... ......... ix
List of tables.................................................................................................................x
List of acronyms..........................................................................................................xi
CHAPTER ONE
INTRODUCTION
1.1 Background Of The Study ........................................................................................................ 1
1.2 Problem Statement .................................................................................................................... 4
1.3 Objectives Of The Study .......................................................................................................... 6
1.3.1 Primary objective ................................................................................................................ 6
1.3.2 Secondary objectives ......................................................................................................... 6
1.4 Literature Review ....................................................................................................................... 6
1.4.1 Introduction .......................................................................................................................... 6
1.4.2 Current status of consumer debt in South Africa ........................................................... 7
1.4.3. International consumer debt reports .............................................................................. 9
1.4.4. Current trends among civil servants ............................................................................. 10
1.5 Research Methodology ........................................................................................................... 11
1.5.1 Study design ......................................................................................................................... 11
1.5.2 Data collection .................................................................................................................. 12
1.5.3 Questionnaire design ....................................................................................................... 12
1.5.4 Population .......................................................................................................................... 13
1.5.5 Sampling ............................................................................................................................ 13
1.5.6 Data analysis ..................................................................................................................... 14
1.6 Scope and Demarcation of the Study ................................................................................... 15
1.6.1 Delimitation of the study .................................................................................................. 15
1.7 Significance of the Study ........................................................................................................ 15
Lesolobe Moaisi Page v
1.9 Outline of the Study ................................................................................................................. 17
1.8 Conclusion ................................................................................................................................ 18
CHAPTER TWO
THEORETICAL CONCEPTS RELATING TO CONSUMER DEBT
2.1 Introduction ............................................................................................................................... 20
2.2 Personal Financial Management........................................................................................... 21
2.2.1. Financial literacy .............................................................................................................. 25
2.2.2 Impact of financial literacy on consumer debt .............................................................. 26
2.3 What is Consumer Indebtedness? ........................................................................................ 27
2.4 The Rising Consumer Debt .................................................................................................... 29
2.5 Why do People Take Household Debt ................................................................................. 31
2.6 Classification of Consumer Debt ........................................................................................... 33
2.6.1 Personal loans .................................................................................................................. 35
2.6.2 Other personal loans ....................................................................................................... 35
2.6.3 Overdrafts .......................................................................................................................... 37
2.6.4 Educational loans ............................................................................................................. 37
2.6.5 Credit cards ....................................................................................................................... 38
2.6.6 Store cards ........................................................................................................................ 40
2.6.7 Hire purchase .................................................................................................................... 40
2.7 Measuring Consumer Debt .................................................................................................... 41
2.8 Consumer Debt and Demographic Variables ..................................................................... 44
2.8.1 Age and consumer debt .................................................................................................. 45
2.8.2 Gender ............................................................................................................................... 46
2.8.3 Education and consumer debt........................................................................................ 47
2.8.4 Income and consumer debt ............................................................................................ 48
2.9 Garnishee Orders .................................................................................................................... 51
2.10 Who is a Public Servant? ..................................................................................................... 52
2.11 Effect of Consumer Debt ...................................................................................................... 53
2.12 Conclusion .............................................................................................................................. 54
Lesolobe Moaisi Page vi
CHAPTER THREE
RESEARCH METHODOLOGY
3.1 Introduction ............................................................................................................................... 56
3.2 Research Methodology ........................................................................................................... 56
3.3 Study Design ............................................................................................................................ 57
3.4 Population and Sample Frame .............................................................................................. 58
3.5 Sampling ................................................................................................................................... 58
3.6 Method of Data Collection ...................................................................................................... 60
3.7 Structure of the Questionnaire ............................................................................................... 61
3.8 Piloting ....................................................................................................................................... 62
3.9 Response Rate ........................................................................................................................ 63
3.10 Validity ..................................................................................................................................... 63
3.11 Reliability ................................................................................................................................ 64
3.12 Ethical Considerations .......................................................................................................... 64
3.13 Study Limitations ................................................................................................................... 65
3.14 Data Analysis ......................................................................................................................... 66
3.15. Conclusion ............................................................................................................................. 67
CHAPTER FOUR
ANALYSES AND INTERPRETATION OF THE RESULTS
4.1 Introduction ............................................................................................................................... 68
4.2 Demographic Information ....................................................................................................... 69
4.3 Personal Income ...................................................................................................................... 71
4.4 Information on Consumer Debt ............................................................................................. 75
4.5 After-Tax Monthly Income Last Month Debt Payment Ratio (Debt–Income Ratio) .... 89
4.6 Personal Expenditure .............................................................................................................. 92
4.7 Garnishee Order ...................................................................................................................... 94
4.8 Conclusion ................................................................................................................................ 96

Lesolobe Moaisi Page vii
CHAPTER FIVE
PERSONAL FINANCIAL MANAGEMENT SERVICES IN SOUTH AFR ICA
5.1 Introduction ............................................................................................................................... 98
5.2 Financial Literacy Programmes ............................................................................................. 98
5.3 Regulators .............................................................................................................................. 101
5.3.1 National Credit Regulator (NCR) ................................................................................. 101
5.3.2 Credit Ombud .................................................................................................................. 103
5.3.3 National Consumer Tribunal ......................................................................................... 104
5.3.4 Micro Finance Regulatory Council (MFRC) ............................................................... 105
5.4 Non-Commercial Sector ....................................................................................................... 106
5.4.1 National Consumer Forum (NCF) ................................................................................ 106
5.4.2 South African Savings Institute ........................................................................................ 108
5.5 Government Departments .................................................................................................... 108
5.6 Summary ................................................................................................................................. 110
CHAPTER SIX
SUMMARY, CONCLUSIONS AND RECOMMENDATIONS
6.1 Introduction ............................................................................................................................. 112
6.2 Summary ................................................................................................................................. 113
6.3 Conclusions of Each Research Objective ......................................................................... 116
6.4 Recommendations ................................................................................................................ 118
6.5 Limitations and Suggestions for Future Research ........................................................... 120
6.6 Summary of the Chapter ...................................................................................................... 121
Reference List ............................................................................................................................... 123
Annexure A Consent form... ....................... ....................................................... 141
Annexure B Questionnaire ...................................................................................................... 143

Lesolobe Moaisi Page viii
LIST OF FIGURES
FIGURE 1.1: TOTAL OUTSTANDING DEBT/YEARLY INCOME AND MONTHLY PAYMENT/INCOME
BY PROVINCE ................................................................................................................................. 9
FIGURE 2.1: REASONS FOR BORROWING – PURPOSE OF PERSONAL LOANS ............................ 32
FIGURE 2.2: LOAN SOURCES ..................................................................................................................... 34
FIGURE 2.3: NUMBER OF ACCOUNTS (AS A PERCENTAGE OF THE TOTAL) ................................ 34
FIGURE 2.4: AMOUNTS PAID TO MICRO-LENDERS DURING THE 2006/2007 FINANCIAL YEAR
ACCORDING TO AGE GROUP ...................................................................................................... 45
FIGURE 2.5: TOTAL OUTSTANDING DEBT/YEARLY INCOME AND MONTHLY PAYMENT/INCOME
BY GENDER .................................................................................................................................. 47
FIGURE 2.6: NUMBER OF PUBLIC SERVANTS WHO MADE PAYMENTS TO MICRO-LENDERS, REFLECTED ACCORDING TO SALARY LEVEL ............................................................................ 50
FIGURE 4.1: ADDITIONAL MONTHLY INCOME FROM OTHER SOURCES ........................................ 75
FIGURE 4.2: PAY DEBT MONTHLY .................................................................................................... 76
FIGURE 4.3: REASONS FOR TAKING ON DEBT ................................................................................ 77
FIGURE 4.4 PERCENTAGE OF TYPES OF CONSUMER DEBT INCURRED ....................................... 78
FIGURE 4.5: VALUE OF MONTHLY DEBT PAYMENT ......................................................................... 80
FIGURE 4.6: OUTSTANDING VALUE OF CONSUMER DEBT ............................................................. 83
FIGURE 4.8: PROPORTION OF INDEBTED RESPONDENT BY MONTHLY AFTER-TAX INCOME..... 92
FIGURE 4.9: RAND VALUE OF MONTHLY PERSONAL EXPENDITURE ............................................ 93
FIGURE 4.10: TOTAL MONTHLY DEBT PAYMENT TO PERSONAL EXPENDITURE ......................... 94
FIGURE 4.11: NUMBER OF EMPLOYEES WITH GARNISHEE ORDERS PER GENDER ................... 95
FIGURE 4.12: NUMBER OF GARNISHEE ORDERS PER SALARY LEVEL ......................................... 96

Lesolobe Moaisi Page ix
LIST OF TABLES
TABLE 4.1: GENDER PROFILE OF PARTICIPANTS ........................................................................... 69
TABLE 4.2: AGE PROFILE OF PARTICIPANTS................................................................................... 70
TABLE 4.3: HIGHEST EDUCATION LEVEL ACHIEVED ...................................................................... 71
TABLE 4.4: CLASSIFICATION OF RESPONDENTS PER INCOME ..................................................... 72
TABLE 4.5: CLASSIFICATION OF RESPONDENTS PER MONTHLY REMUNERATION ..................... 73
TABLE 4.6: TOTAL AFTER-TAX MONTHLY INCOME FROM PUBLIC SERVICE ................................. 74
TABLE 4.7: DESCRIPTIVE DEBT PAYMENT VARIABLES .................................................................. 79
TABLE 4.8: DESCRIPTIVE DATA ON CONSUMER DEBT ................................................................... 84
TABLE 4.9: FOUR MOST COMMON CONSUMER DEBT VARIABLES ................................................ 87
TABLE 4.10: MONTHLY DEBT PAYMENT PER GENDER .................................................................. 88
TABLE 4.11: OUTSTANDING DEBT OBLIGATION PER GENDER ...................................................... 88
TABLE 4.12: DEBT–INCOME RATIO PER SALARY LEVEL ................................................................ 90

Lesolobe Moaisi Page x
LIST OF ACRONYMS
AIDS – acquired immune deficiency syndrome
BMR – Bureau of Market Research
DEDECT – Department of Economic Development, Environment,
Conservation and Tourism
EU – European Union
HIV – human immunodeficiency virus
NAAMSA – National Association of Automobile Manufactures of South
Africa
NCA – National Credit Act 34 of 2005
NCES – National Centre for Education Statistics
NCF – National Consumer Forum
NCT – National Consumer Tribunal
NIDS – National Income Dynamic Study
NRC – National Credit Regulator
NWPG – North West Provincial government
ORC – Opinion Research Corporation
NSFAS – National Student Financial Aid Scheme
PERSAL – Personnel and Salary Administration
PSC – Public Service Commission
SAARF – South African Advertising Research Foundation
SASI – South African Savings Institute
SIU – Special Investigating Unit
SPSS – Statistical Package for Social Sciences
UNISA – University of South Africa

Lesolobe Moaisi Page 1
CHAPTER ONE
INTRODUCTION
1.1 BACKGROUND OF THE STUDY
As a result of South Africa’s political transition there has been an increase in the
ability of a large proportion of South Africans to access credit facilities (Núñez,
Forrester & De Wet, 2008:9). Consumers who were previously not strategically
prioritised by large institutions have come into increasing focus, and new credit
products from a wide range of suppliers (financial retailers and others) continue to be
developed and marketed. The new credit products include term loans, revolving
credit facilities, short-term cash loans, educational credit and non-mortgage housing
finance backed by pension funds, while ‘save-to-borrow’ products allow first-time
credit access for previously excluded consumers (Ardington, Lam, Leibbrandt &
Levinsohn, 2004). Overall, the growth in credit consumption has exceeds growth in
income, leading to an increase in household debt (Hurwitz & Luiz, 2007). Consumer
spending has also been the key driver of the South African economy. This consumer
spending has largely been fuelled by consumer credit, leading to, in some instances,
high levels of indebtedness (Mlandu, 2007:17).
A variety of research reports indicate that household debt is high and has been
increasing worldwide (ORC, 2001). In South Africa, household debt was recorded to
be decreasing since 2008 but is still high at 77.6% (SARB, 2010). The Reserve
Bank(2010) also indicates that consumer credit accounts for roughly 35% of the
aggregate household debt in South Africa. The consumer credit indicated above by
the Reserve Bank was measured using variables such as open accounts, personal
loans, instalment sale transactions, operational and financial lease agreements and
securitisation transactions.
The consumer National Credit Regulator (2011) has revealed that the total
outstanding gross debtors’ book of consumer credit for the quarter ending March
2011 was R1.21 trillion and that the number of accounts increased marginally from

Lesolobe Moaisi Page 2
R35.05 million to R35.24 million during the same period. The report also indicated
that credit facilities, which mainly consist of credit cards, store cards and bank
overdrafts, have increased from R10.25 billion to R10.43 billion in 2011. This is a
clear indication that consumer debt in South Africa is very high.
The Opinion Research Corporation (ORC) Macro (2001:4) comments on debt as
follows –
Debt is a common instrument used to maintain a stable level of
consumption, compatible with its lifetime resources, over different stages
of the individual or family's lifecycle. Being indebted, formally or via
informal family channels, is normal consumer behaviour; and a certain
level of debt is inevitable for the majority of households, particularly at the
earlier stages of their lifecycle.
Consumer debt refers to debt that has been incurred primarily for the purchase of
consumer goods, and excludes mortgage debt, which is regarded as an investment
because it lasts for a lifetime (investorWords, 2011.). Accountingglossary (2011)
defines consumer debt as debt incurred for consumable or depreciating assets that
are not considered investments. This includes credit card debt, hire purchases, car
loans, family loans that will be repaid, etc. It does not include routine bills paid
monthly such as water, phone and electricity, nor does it include mortgages, home or
business equity loans, home or business equity lines of credit, or share margin
accounts (Accountingglossary, 2011).
The relationship between credit and debt represents the two sides of the same coin.
Credit is that which is provided and debt is that which is owed (Finlay, 2009:3). A
consumer will buy goods or services on credit and incur debt. The seller incurs credit
while the consumer incurs debt. Finlay (2009) defines credit as future money made
available in the present, and debt as past money to be repaid in the future.

Lesolobe Moaisi Page 3
In terms of over-indebtedness, the Bureau of Market Research (2009:6) asserts that
examples of over‐indebtedness include the following:
– consumers spending of more than 25% of their gross monthly income on
unsecured repayments;
– consumers spending more than 50% of their gross monthly income on total
borrowing repayments;
– consumers with four or more credit repayments; and
– consumers who are in arrears on credit commitments for more than three
months.
The current economic environment, which is characterised by high cost of living,
sometimes requires a consumer to supplement the income to meet the standard of
living being aspired to. This compels consumers to make use of debts, such as car
financing, in trying to meet their requirements. Debt is not a bad mechanism to meet
one’s current consumption as long as it is managed properly. The effect of over-
indebtedness can be catastrophic to a consumer’s life and even to those closely
dependent on the person incurring the debt, e.g. family members. It is therefore
important that consumers be aware of their debt level, especially if it is above their
own limit. Consumers should be financially literate and be able to practice prudent
financial management on their income to avoid being trapped in debts.
Just like any organisation, the Department of Health (DoH) has to provide its
services, in this case, health care services in the most effective manner possible. It
can only achieve its goals if its human resources are physically, mentally and
emotionally well. This involves managing low productivity, absenteeism, the high sick
leave rate and other factors which might impair performance. The DoH has to ensure
that its human resources are well equipped to manage their personal matters,
including debt management by providing appropriate wellness programmes that will
ensure that the DoH minimises the effects of social problems in terms of its mandate.
The South African Reserve Bank (2012) has indicated that even though household
debt is declining, it is still high above 76%. At the same time, if public servants have
debt problems, their performance will be affected. The Department of health has to
Lesolobe Moaisi Page 4
determine firstly whether debt management is a challenge to the personnel so that
the DoH can introduce relevant intervention strategies through its wellness
programmes.
The purpose of this study was to determine the level of indebtedness among the civil
servants working in the North West Provincial Department of Health (NWPDoH) in
Mahikeng. The study explored the different types of debt incurred by public servants.
The results of the study aimed at assisting the DoH in North West Province to
develop relevant wellness programmes aimed at addressing the effects of debt on
employees’ performance. Awareness among public servants will prompt them to
seek relevant intervention that will help in managing debt problems.
This study took the form of a descriptive study of the current debt level in the
department, and involved 212 civil servants as a sample size. A questionnaire was
used to determine the cost of servicing debts and the most prevalent type of debt
among public servants. Data collection was conducted among the permanently
employed public servants working in the provincial health offices, and used different
variables referred from the reviewed literature to conduct the analysis. It is expected
that the final report will be submitted to the DoH upon approval by the University of
South Africa. The recommendation will assist the DoH to develop effective
intervention strategies thereby improving human resource performance.
1.2 PROBLEM STATEMENT
Despite the introduction of the National Credit Act, reports have shown that
consumer indebtedness is still very high. The Credit Bureau Monitor report of the
National Credit Regulator (NCR, 2010) showed that in the fourth quarter of 2010,
47% of the 19 million credit-active consumers in South Africa had impaired credit
records. The report further indicated that for every R100.00 a household earns,
R78.50 goes towards servicing debts. The National Credit Regulator (NCR, 2012)
also indicated a rise in credit usage where the number of credit agreements entered
into for the quarter ended December 2012 increased by 18.52%.

Lesolobe Moaisi Page 5
According to the Public Service Commission report (2007) on the indebtedness of
public servants, there were 4 063 public servants in 2006/2007 who made payments
to service micro-loan debt through the Personnel and Salary Administration
(PERSAL) system. The report further indicated that consumer debt could lead to ill
health, low productivity, compromised ethical standards and employees seeking
remuneration outside the public service. This negative effect of being indebted is
further elaborated by Garman, Leech and Grable (1996) who argue that poor
financial behaviour could result in extremely high costs being incurred by employers,
which include absenteeism, tardiness, fighting with co-workers and supervisors, job
stress and reduced employee productivity.
The annual report of the North West Department of Health (NWDoH, 2010/11)
indicated that the estimated cost for the sick leave taken by the employees for the
2010/11 financial year was R 53 867 232.19 and that the average number of sick
leave days per employee for the year were eight. The annual report also indicated
that the most prevalent types of misconduct cases in the NWDoH were fraud, gross
negligence, gross absenteeism, theft and abscondment. The literature explicitly
associates these types of misconduct cases with consumer indebtedness (Garman
et al., 1996).
Public servants generally have more job security than their private counterparts
(Public Service Commission, 2007). The workforce in the private sector depends on
the economic condition while in the public sector; workforce is minimally affected by
economic factors. Due to high job security, civil servants are easily eligible to taking
personal loans, credit cards and other forms of credit and are thus subject to
incurring debts (Public Service Commission, 2007). Credit providers often target civil
servants because they are viewed as being in a position to service their debts based
on their job security. The current study thus focused on examining the current state
of consumer debt level of the Department of Health public servants in Mahikeng.

Lesolobe Moaisi Page 6
1.3 OBJECTIVES OF THE STUDY
1.3.1 Primary objective
The primary objective of this study was to determine the consumer debt level of the
Department of Health public servants in Mahikeng, North West Province.
1.3.2 Secondary objectives
To help achieve the primary objective, the secondary objectives of the study were:
• to identify the most common types of consumer debt owed by public servants in
Mahikeng;
• to determine the monthly expenditure of public servants towards servicing debt;
• to determine the income and sources of income among public servants used to
service debt;
• to gain an understanding of the nature of consumer indebtedness and the extent
of the problem; and
• To investigate the extent to which public servants have been served with
garnishee orders as a result of consumer indebtedness.
1.4 LITERATURE REVIEW
1.4.1 Introduction
A person is over-indebted if he or she considers that he or she has difficulties in
repaying debts, whether consumer debt or a mortgage (Opinion Research
Corporation, 2001:2). The level of consumer indebtedness can also be measured by
the debt–income ratio. The level of debt at which a household becomes over-
indebted depends on factors such as the size and structure of the debt, the debt-
servicing arrangements, the assets of the household, other personal and economic
characteristics of the household as well as external factors such as the state of the
economy (Opinion Research Corporation, 2001:4).
Nyaruwata and Leibbrandt (2009) categorise personal debt into the following eleven
types: bond, personal loan from bank, personal loans from micro-lenders, personal
loan from mashonisa (loan sharks), study loans from banks, study loans from other

Lesolobe Moaisi Page 7
institutions, motor vehicle loan, credit cards, store credit cards, hire purchase and
loans from family members and friends.
The Public Service Commission (2007) in its report on indebtedness among public
servants used the PERSAL system to determine the level of indebtedness and
concluded that most public servants are in debt.
1.4.2 Current status of consumer debt in South Afri ca
In the quarterly bulletin released in December 2012, the South African Reserve Bank
indicated that household debt had been declining from the all-time high of 82%
registered in 2008 but was still high above 76%. The Reserve Bank (2010) also
indicated that household debt was mostly driven by mortgage debt, which also
seemed to be declining but still taking the biggest proportion of household debt. The
report indicated that consumer credit accounted for roughly 35% of the aggregate
household debt in 2009. The current study focused only on consumer debt and
excluded mortgage debt.
According to Nyaruwata and Leibbrandt (2009), households with higher annual
income, have a bigger proportion of debt than those with lower income. They also
point out that the outstanding debt to yearly income ratio and the monthly debt
payment to monthly income ratio are lower at the lower-income levels. The study
however suggests that the reason could be some under-reporting of debt in the
lower section of the income spectrum. This current study differed from the study
conducted by Nyaruwata and Leibbrandt (2009) in that it used a self-administered
questionnaire to collect data, and was hoped that the anonymity clause would
reduce under-reporting. The study only assessed personal debt, and not household
debt as well as in the case of Nyawuta and Leibbrandt (2009).
Contrary to the results of the study conducted by Nyaruwata and Leibbrandt (2009),
the results of a similar study by Mashigo (2006) indicated that poor households face
multiple debts. Mashigo’s findings suggest that the lowest-income categories witness
the greatest increase in the numbers and percentages of indebtedness, which is in
line with the current study under review. Mashigo(2006) further attributes the

Lesolobe Moaisi Page 8
increase in the percentage of indebtedness among the lower income category to the
marginalisation of the poor households by the formal financial institutions resulting in
these households utilising informal financial services of the abusive moneylenders
who place the households in the debt spirals. Mashigo (2006), unlike Nyaruwata and
Leibbrandt (2009), did not indicate any under-reporting of respondents at any
category.
Nyaruwata and Leibbrandt (2009) also indicate that male-headed households have
both a higher outstanding balance to yearly income ratio and last payment to
monthly income ratio. This is contrary to the Public Service Commission Report
(2007), which found that female employees in the public sector pay more than their
male counterparts to micro-lenders.
The current study adds knowledge to the existing literature based on studies
conducted by Mashigo (2006), the Public Service Commission(2007) and Nyaruwata
and Leibbrandt (2009), and use the same variables, namely gender, income level,
outstanding debt, monthly debt payment to compare the North West Province debt
level to the provincial health office debt level. The study represents the health
workers as a specific population, with customised findings and in addition,
investigates garnishee orders within the DoH.
In demonstrating consumer debt as a challenge, Figure 1.1 below indicates the level
of indebtedness per province reflected in the Nyaruwata and Leibbrandt (2009)
study.

Lesolobe Moaisi Page 9
Figure 1.1: Total outstanding debt/yearly income an d monthly payment/income
by province
Source: Adapted from Nyaruwata and Leibbrandt (2009:8)
From Figure 1.1 it can be seen that consumers in North West Province(NWP) spent
almost 13% of their monthly income on debt when using the last payment as a
reference. The outstanding debt as a ratio of annual income was around 15%. This
might imply that consumers in NWP were able to manage their debt. Nyaruwata and
Leibbrandt (2009), however, mentioned that the drivers of higher ratios in other poor
provinces, such as Mpumalanga, were presumably due to the low income of
respondents as opposed to inordinately high debt levels.
1.4.3. International consumer debt reports
High consumer debt levels are not unique to South African consumers, but affect
consumers all over the world. The Reserve Bank of Australia noted an upward drift in
the maximum permissible debt servicing ratio of 50% of gross income (Griffiths,
2007). In Sweden, the aggregate household indebtedness was reported to be slightly
over 70% of GDP (Persson, 2008)

Lesolobe Moaisi Page 10
According to Bird, Hagstrom and Wild (1999), the growth of credit card debt in the
United States (US) has been mostly high among households below the World Bank
poverty line of $1.00 per day. However, it has also been pointed out that rising
indebtedness has had an adverse effect on households by increasing the number of
household bankruptcies, which reveals that the number of non-business
bankruptcies in the US increased from about 300 000 in 1985, to an all-time high of
1.35 million in 2001, according the data from the US Courts. This increase has far
outstripped the growth in population (Dutt, 2003).
1.4.4. Current trends among civil servants
According to The Nation (2010), published in Thailand, it was found that in 2010,
84.1% of all civil servants were indebted, compared to 81.6% in 2006. Furthermore,
it was indicated that lower salaries might have been the cause of high indebtedness
which could lead to corruption among civil servants (The Nation, 2010). Most reports
and newspaper articles in South Africa suggest that civil servants are highly corrupt.
This is supported by the Business Anti-Corruption unit (2011), which highlighted in
The Economist that the Special Investigating Unit (SIU), one of South Africa’s anti-
corruption bodies, had identified 400 000 civil servants receiving welfare payments to
which they were not entitled. One of the reasons for this might also be low pay as
alluded to in the Nation article. It was not the intention of the current study to
determine the reasons for indebtedness of civil servants in the North West
Department of health; however, the study sought to determine the level of
indebtedness of these employees.
The Public Service Commission (2007) indicated that public servants are in debt.
However, the study only looked at payment by public servants through PERSAL
system. This implies that any other mechanism of payment, e.g. stop order,
instalment payment (hire purchase), credit card payment or any personal debt which
cannot by law be deducted through the PERSAL system were excluded (Department
of Public Service and Administration, 1994). The study also alluded to the fact that in
most cases, the PERSAL system did not have sufficient data because PERSAL it is
not audited as required by the National Treasury. The PSC study did not determine

Lesolobe Moaisi Page 11
whether public servants were over-indebted or not but indicated only the number of
personnel and the amount paid through the PERSAL system to service debt.
In a study conducted by Duasa (2008) for the International Islamic University in
Malaysia, it was found that almost 70% of government servants spent 0% to 79% of
their income on debt, while 4.5% of government servants spent more than 100% of
their income on debt. This reflects the high burden of debt among government
servants in Malaysia.
Duasa’s (2008:8) study went further to compare government servants’ individual and
household income with debt which indicated that the individual income–debt ratio
was higher than the household income–debt ratio. In South Africa, with its high level
of unemployment of 25.6% (Statistics South Africa, 2013), the ratios might indicate
insignificant difference. The current study focused on the personal income–debt ratio
only.
1.5 RESEARCH METHODOLOGY
1.5.1 Study design
Research design is the plan according to which we plan to obtain research
participants and collect information from them (Welman & Kruger, 1999:46). The
current study used the descriptive quantitative survey research method. Quantitative
research is any type of research that produces findings arrived at by statistical
procedures or other means of quantification (Strauss & Carbin, 1998). In quantitative
research, the aim is to learn about the large population by surveying a sample of that
population (Leedy & Ormrod, 2010:187).
Leedy and Ormrod (2010:182) contend that quantitative research involves either
identifying the characteristics of the phenomenon or exploring the correlation among
two or more phenomena. The current study quantified the amount of money spent by
respondents in servicing debt, which determined the level of debt of the respondents.
Furthermore, the study examined the garnishee order in the provincial office. This
was then compared with the general consumer debt level in the country to examine

Lesolobe Moaisi Page 12
whether public servants working in the provincial Department of Health were worse
or better off than the rest of consumers in the country. The analysis extrapolated the
current state of affairs, and suggested which intervention should be implemented.
1.5.2 Data collection
The study used a self-administered questionnaire to collect data. Tustin et al. (2005)
describe a self-administered questionnaire as a fairly structured paper questionnaire,
which is sent to a targeted population, where a personal interview is not required.
This is to promote confidentiality and to encourage honesty as much as possible.
During the current study, the questionnaire did not require the participants to write
their name or anything that would link them to the questionnaire or the study and
thus promoted honesty as it was an anonymous questionnaire.
The questionnaire was not mailed to the target population but submitted conveniently
to the offices of the sampled population as they were in one specified building. The
office telephone number was used to make follow-up calls regarding the submission
of the questionnaire. The participants were requested to respond within a specified
period and to return the completed questionnaire by putting them in a ballot box
dedicated for the study. This was done to promote honesty in response as the
researcher would not be able to link a response to an individual. Honesty in filling in
the questionnaire was intended to promote accuracy and reliability of the data
collected. Data on the garnishee order was collected through the PERSAL system.
1.5.3 Questionnaire design
A questionnaire is defined as a structured sequence of questions designed to draw
out facts and opinions, and which provides a vehicle for recording the data (Tustin et
al., 2005:385). It is important to consider the question content, phrasing and
sequence when constructing a questionnaire. The questionnaire format could be
unstructured (no pre-formulated questions), semi-structured or structured (mostly
close-ended questions) (Tustin et al., 2005). The current study used a mixture of
structured and unstructured questions (semi structured) to collect data. Some of the
responses required were open-ended.

Lesolobe Moaisi Page 13
1.5.4 Population
According to Bless (1995 as cited in De Vos et al, 2005), a population is a set of
elements on which the research focuses and to which the results obtained by testing
the sample should be generalised. According to De Vos et al, (2005), “population”
refers to individuals in the universe who possess specific characteristics, or to a set
of entities that represent all the measurements of the practitioner or researcher.
The population in the study was the civil servants employed within the provincial
office of the DoH. The sampling frame used was the list of employees reflected in the
PERSAL system (human resource electronic database) for the provincial health
office. There were 423 employees registered on the PERSAL system as the
provincial health department employees (PERSAL system, 2011). The employees on
the payroll were categorised as 31 senior managers, 68 middle managers, 219
technical/professional employees and 105 lower-level employees. The vacancy rate
of the provincial office as in October 2011 was 27.2%. This was the population from
which the sample was drawn.
1.5.5 Sampling
Sampling is described as taking a portion of a population or universe and
considering it as a representative of that population or universe (De Vos et al, 2005).
According to Bailey (cited in De Vos et al, 2005), a sample is defined as a subset or
portion of the total population.
The study used the non-probability quota sampling method. The quota sampling
method selects respondents in the same proportions that they are found in the
general population, but not in a random fashion (Leedy & Ormrod, 2010:212). This
sampling method also regulates only the size of each category within the sample and
in most cases in a convenient way.
The current study ensured that the sample covered all the categories of employees
in the provincial office such as senior managers, middle managers, professional-
level employees, and lower-level employees. The sample was selected
proportionally according to the population but in a convenient way. Employees who

Lesolobe Moaisi Page 14
showed interest in participating in the study and within the categories mentioned
were chosen. Employees were visited in their offices and as per category of the
position in the workplace. This was to ensure that each category of employees was
covered and to ensure that a proper sample size for the study was attained.
According to Gay and Arasian (2003:113), when selecting a sample, the researcher
should consider the following:
- if the population has fewer than 100 people, the entire population should be
surveyed;
- if the population comprises approximately 500 people or units, 50% should be
sampled; and
- if the population comprises approximately 1 500 people or units, 20% thereof
should be sampled.
Given the above guideline and that the study population was 423, a sample size of
212 employees was used, where it was categorised according to the proportion of
each level to the total study population. There were 15 senior managers, 34 middle
managers, 110 professional employees and 53 lower-level employees. The sample
size used also took into consideration the time, cost and capacity to collect the
required information.
1.5.6 Data analysis
Data analysis is a practice by which raw data is ordered and organised so that useful
information can be extracted from it (Smith, 2011). This data is analysed to ensure
that the primary objective of the study is achieved. In this study, a questionnaire was
used to collect data and thus the descriptive data analysis method was used. This
technique represents the basic analysis of survey data (Tustin et al., 2005:480).
Frequency distribution was used to describe data. This entails the construction of
tables and graphs that show in absolute and relative terms how often the different
values of the variable are encountered in the sample (Tustin et al., 2005:523).

Lesolobe Moaisi Page 15
Inferential analysis was also used in the study to estimate the population
parameters. This implied utilising a particular sample statistic to estimate the
corresponding population parameter (Tustin et al., 2005). The current study sought
to determine the consumer debt level of employees in the provincial Department of
Health and therefore had to make an inference from the study sample.
Data was analysed by computer by means of spreadsheets using Excel formulas for
coding. Data is presented as graphic presentations such as bar graphs, histograms
and pie charts. The researcher also used the Statistical Package for Social Sciences
(SPSS) 14.0 version to analyse the data.
The researcher determined the mean outstanding debt per yearly income ratio and
the mean monthly debt payment to monthly income ratio to determine the level of
indebtedness of DoH employees and compared it with other findings like the
provincial debt level or national debt level as described in the literature review.
1.6 SCOPE AND DEMARCATION OF THE STUDY
1.6.1 Delimitation of the study
Delimitations of the study the self-imposed boundaries set by the researcher on its
purpose and scope (Lunenburg & Irby, 2008:135). The problem of over-
indebtedness cuts across all sectors; however, the current study was limited to the
public servants in the provincial Department of Health offices in Mafikeng. The
current study also excluded mortgage loans as part of the variables. This is because
Mafikeng is semi-urban as such some public servants might be staying in rural areas
in Mafikeng, which do not qualify for mortgage loans or pay municipal services.
1.7 SIGNIFICANCE OF THE STUDY
The study examined the consumer debt from the primary point of view (being
assessing the personal debt) and not consumer credit records held elsewhere. This
implied awareness of a household’s debt level and whether it was acceptable, mild
or severe. The awareness of the consumer debt level among public servants might
prompt some intervention strategies from both the employer and the employee.
Most studies and reports from relevant entities for example NCR, consider consumer

Lesolobe Moaisi Page 16
credit instead of consumer debt by relying on the records kept by lending institutions,
instalment loan shops, academic institutions and credit card-issuing institutions as a
source of information. This research was intended to assess consumer debt from the
consumer’s point of view. This included looking at personal income and assessing
monthly payment on consumer debt, which has been incurred primarily for the
purchase of consumer goods.
Current reports are directed at assessing the general public consumer debt and
never specific to a particular group. The study covered the debt level of DoH
employees around Mahikeng. The study population are permanently employed and
have secure employment, so it is a good market for credit providers and deceiving
marketing tactics hence the employees were able to purchase on credit with ease.
This could lead to blind accumulation of debts, which could be detrimental to the
general wellbeing of the consumer.
Each department in the public service has an employee’s assistance programme,
which in some departments is called a wellness programme. This unit/department
seeks to assist civil servants in managing their social activities and to ensure that
social challenges do not affect their work performance. This entails assisting the
employees with stress management, personal financial management, HIV/AIDS and
other chronic diseases, and other related problems that might affect the employees’
performance in the workplace. The results of the study highlight whether consumer
debt is a problem among civil servants and propel the DoH to conduct intervention
programmes that could assist employees to deal with consumer debts specifically.
The relevant organisation might be roped in to assist with programmes on debt and
personal financial management. This could contribute to improved performance and
staff morale in the workplace because household debt could have a negative effect
on both the employee and the employer. It could lead to stress and other health-
related complications as reported by Garman et al. (1996) and lower productivity in
the workplace, which will affect the entity’s performance.

Lesolobe Moaisi Page 17
Follow-up research might also be conducted to assess the impact of consumer debt
among civil servants. This will help to identify how debt problems affect work
performance, which could lead to better management of the problem and ultimately
improve employees’ performance and social wellbeing.
1.8 OUTLINE OF THE STUDY
The chapters in the study will be structured as follows:
Chapter one: Introduction
The chapter deals with the problem statement, the rationale for carrying out the
research and the study design.
Chapter two: Literature review
The chapter provides a literature review of consumer debt levels and their impact on
individual job performance.
Chapter three: Research methodology
This will cover the procedure that was followed in undertaking the study.
Chapter four: Presentation and analysis of the find ings
The chapter provides the summary of the results making use of tables, figures,
graphs and verbal descriptions, which will be presented in the findings. The chapter
also covered the analysis and interpretation of the findings in the study.
Chapter five: Personal financial management service s in South Africa
This chapter will consider services offered to consumers to manage their finances in
order to avoid the debt trap.
Lesolobe Moaisi Page 18
Chapter six: Summary, conclusion and recommendation s
The chapter covers feasible recommendations to the DoH, and present the
concluding remarks on the study.
1.9 CONCLUSION
This chapter introduced the background to the study, the problem statement,
research objectives, the research design and the chapter outlay. It entailed the
rationale for the research and the processes that were followed to carry out the
research.
Debt is one of the major financial problems for high and low earners alike. The more
a person borrows, the more interest is paid and the less disposable income that
person has. Debt problems bring worry, stress, marital problems and a sense of
hopelessness about the future. Debt problems can also enslave the individual,
especially if such person does not honestly face the problem and make a plan to get
out of debt and stay out of it. The majority of people who fall into the debt trap lose
their belongings due to inappropriate debt management or by not being aware that
they are over indebted (Public Service Commission, 2007). One of the major
remedies in managing debt problems is firstly awareness and acknowledgement of
the debt problem and rather to set proper mechanisms to create a solution.
The current study isolated a particular group and assessed its consumer debt level in
relation to the general public consumer debt level as reported by a variety of
research reports. Targeting the study group (health employees in Mahikeng) under
review, lead to more specific intervention strategies to be developed and thus
appropriately addressing the identified challenges. This will be to the benefit of both
the employer and the employee.
The chapter also highlighted the research design that was used in the study. Data
was collected by means of a self-administered questionnaire. A sample was drawn
from the population using the non-probability quota sampling technique and the data
was analysed by means of the SPSS package. The reliability and validity of the data

Lesolobe Moaisi Page 19
were also tested.
Since the focus of this research was on consumer debt among public servants,
Chapter two will review different sources of literature on consumer debt and discuss
various drivers of consumer debt in detail. The objectives and findings of the study
will then be compared with the reviewed literature.

Lesolobe Moaisi Page 20
CHAPTER TWO
THEORETICAL CONCEPTS RELATING TO CONSUMER DEBT
2.1 INTRODUCTION
The financial systems of the 21st century have been growing with speed,
sophistication and by becoming more complex (Nyamute & Maina, 2011:2) the world
over. The financial and social environment within which people make financial
decisions are constantly changing given the dynamics and ever-improving
technology of modern life. Financial products and services have multiplied along with
technological and other means of marketing them (Greenspan, 2005). This
necessitates the need for a consumer to keep up with these changes so as to
manage assets accordingly. It also entails having required financial management
knowledge and skills to make appropriate financial decisions together with discipline
to stick to the right decisions.
This chapter focuses on the theoretical and empirical literature relating to consumer
debt. The chapter is organised into five parts.
Part one explores the broader component of financial management and the way it
relates to consumer indebtedness. There is a strong relation between consumer
indebtedness and poor financial management.
Part two consists of sections 2.3 to 2.6, which present an overview of consumer
indebtedness with respect to the definition of consumer debt, the current level of
consumer indebtedness and factors leading to indebtedness among consumers and
households. Consumers incur debt for a variety of reasons. The most prominent
reasons are home improvement and emergencies (Mlandu, 2007).
Part three of the chapter will classify consumer debt according to its source. Studies
have indicated that poor households are more likely than other consumers to incur
debt from informal credit providers like mashonisa (micro-money lenders) because
they are unable to meet the requirements for borrowing from formal credit providers

Lesolobe Moaisi Page 21
such as banks (Mashigo, 2006). On the other end, middle-income households will
more likely incur debt from formal credit providers (Scott & Pressman, 2011). Credit
cards, home purchase mortgages, instalment loans and home equity lines have
undoubtedly become increasingly familiar to ordinary households as ways to fulfil the
desired living standards (Zhao, 2003:1). Section 2.5 of this chapter will discuss in
detail the classification of consumer debt as described in the literature.
The association between consumer debt and demographic variables forms the fourth
part of the chapter, and this will be discussed in detail in sections 2.7 to 2.8. This
section will also examine the different methods of measuring consumer debt. This
will be the basis for determining the methodology of measuring consumer debt level
in the current study.
The fifth part, in sections 2.9 to 2.10, covers garnishee orders and seeks to describe
public servants within the context of the current study. The Public Service
Commission (2007) in its report on indebtedness, used data from the PERSAL
system to determine the number of garnishee orders paid by public servants.
Consumer debt can have a negative influence on both the employee and the
employer. It can lead to stress and other health-related complications as reported by
Garman et al. (1996) and lower productivity in the workplace, which will affect the
entity’s performance. The chapter will briefly touch on the effect of consumer debt on
employees and the employer. The discussion starts with the relationship between
personal financial management and consumer indebtedness.
2.2 PERSONAL FINANCIAL MANAGEMENT
Survival in this century depends on having resources to sustain one-self. The
greatest resource nowadays is having income to be able to meet the basic needs
and other personal needs as indicated by Maslow’s hierarchy of needs. The income
earned by an individual just like any other resource needs good management to
ensure that the best value can be extracted and utilised efficiently and effectively
(Muske & Winter, 2004). It is for these reasons that any consumer should have basic
knowledge and skills in terms of personal financial management that would enable
Lesolobe Moaisi Page 22
sufficient control of finances, resulting in meeting the basic needs and other
necessities.
Financial management generally refers to a set of behaviours in the areas of cash
management, credit management, financial planning, investments, insurance and
retirement and estate planning (Dowling, Corney & Hoiles, 2009:5). This is
emphasised by a BancVue (2010) website article, which typically describes personal
finance management as a tool that help consumers to track and manage their
finances, create budgets, categorise and anticipate spending, and analyse the
distribution and performance of their investments. It involves the efficient use of
personal finance to meet the individual’s motives and goals. Nyamute and Maina
(2011:2) also stress the importance of practices such as budgeting and cash flow
management, account ownership, use of credit, savings behaviour, and asset
accumulation as core elements of personal financial management. Personal financial
management is therefore one of the important tools to manage and protect a
consumer’s resources and ways to utilise these resources to meet the required
standard of living.
Equally important, personal financial planning forms the integral part of an
individual’s financial management. Swart (2004:5) defines personal financial
planning as the organisation of individual’s financial and personal data for the
purpose of developing a strategic plan to constructively manage income, assets and
liabilities to meet near and long-term goals and objectives. The definition of personal
financial management and financial planning suggests some similarities. Both terms
seem to imply planning and implementing financial goals throughout one’s lifetime.
Nowadays the cost of living is increasing rapidly as inflation tends to erode personal
income (Pressman & Scott, 2010). This necessitates efficient utilisation of personal
finances. Financial management practices help individuals or households keep track
of their income and expenditure in order to improve their financial status and to keep
up with the current standard of living. These practices involve behaviours such as
budgeting, making payments on time, saving money, managing one’s credit card
debt, and having an idea of one’s net worth (Pham, Yap & Dowling, 2012:463).
Lesolobe Moaisi Page 23
Employees, who use more of the financial management practices recommended by
experts, report a lower level of financial hardship or stress and a higher degree of
satisfaction with their financial status than adults who employ few of the
recommended strategies (Joo & Grable, 2004:30). Garman et al. (1996:165) suggest
that negative financial decisions could be rectified or avoided by providing
employees with the necessary financial counselling and intelligence to manage their
finances in a more effective manner. Consumers who spend more than they earn,
who do not keep financial records, do not plan and implement regular investment
programmes, are individuals who make flawed financial decisions (Kotzè & Smit,
2008:41).
Indeed, several studies have found that individual positive financial management
practices have been the single most influential determinant of debt and financial
satisfaction (Gathergood, 2012; Joo & Grable, 2004).
The Australia and New Zealand Banking Group Limited (2005) identified three core
factors that cause people to fall into financial difficulty:
• ‘unhealthy’ ways of thinking about finances;
• circumstances or events outside their control; and
• lack of financial skills and knowledge.
Individuals make decisions with regard to their personal finances on a daily basis,
and even though these decisions are necessary for day-to-day survival, it can be a
daunting task (Joo & Grable, 2004). Old-fashioned values concerning financial
management, such as budgeting and saving, are lost in the pursuit of instant
gratification, and consumers tend to spend more than they earn (Dowling et al.,
2009:6)
Individuals are not being responsible when it comes to their personal finances, as
revealed by Anthes (2004:51), who reports that, according to a 2004 Retirement
Confidence Survey, only 58 per cent of workers are currently saving for retirement,
and even these workers do not calculate how much money they have to save to live

Lesolobe Moaisi Page 24
comfortably by the time they retire. A shocking finding was that half of the workers
who are not saving for retirement feel confident that they will have enough retirement
money by the time they need it, proving once again that there exists a great need for
financial literacy training in South Africa as well as worldwide (Streeter, 2003:4). One
of the reasons as suggested by Disney and Gathergood (2012) is that ignorance
plays a role in determining the participation of consumers in the credit market.
Ignorance about basic financial concepts can be linked to a lack of retirement
planning, a lack of participation in the stock market, and poor borrowing behaviour
(Nyamute & Maina, 2011:2).
Streeter (2003:4) adds that consumers tend to be confused and intimidated by the
complexity of the finance industry and they are embarrassed to admit that they
struggle to understand certain terminology or practices. This is supported by the
Australia and New Zealand Banking Group Limited (2005), which indicates that
consumers in most cases do not understand how financial products work, they do
not recognise when they should seek advice about a financial matter, or, in a small
number of instances, they are unable to identify a financial scam. Similar findings
might be possible or even worse in South Africa, taking into consideration the lower
literacy level in the country. The consumers with poor financial literacy will not be
able to select the most effective financial choices available to them, because the
subject is unknown to them and therefore seems threatening. Young people are
most at risk when it comes to poor, informal advice when choosing relatively
straightforward products as they will rely on their parents and/or friends for advice
(Atkinson & Kempson, 2004).
It is necessary for individuals to acquire knowledge about personal financial issues in
order to be able to evaluate the financial options available to them, manage their
finances effectively and gain financial security (Kotzè & Smit, 2008:42). Financial
literacy has been identified as the single most important factor to result in prudent
financial management (Anthes, 2004:52; Kotzè & Smit, 2008; Lusardi & Tufano,
2009). A study by Kidwell and Turrisi (2004:606) deduced that budgeting can change
spending patterns of individuals through the successful regulation of finances. As a
result, unnecessary spending is curbed, and budget maintenance is met with a

Lesolobe Moaisi Page 25
favourable attitude. This was confirmed by Kotzè and Smit (2008) who suggested
that groups who are more knowledgeable regulate their spending patterns and
decisions by keeping detailed financial records. It is for this reason that in the next
paragraph, the focus is turned to financial literacy as the major factor affecting
personal financial management.
2.2.1. Financial literacy
It is widely accepted that most consumers lack the financial literacy necessary to
make important financial decisions in their own interest. Clearly, the importance of
financial literacy cannot be underestimated, because a financially illiterate person
may be unable to budget appropriately to meet expenditures, be unable to identify
financial products or services that meet his/her needs, be unsure how to get and
assess independent financial advice, and finally they are more likely to fall victim to
abusive and exploitative practices and scams (Oseifuah, 2010). Related closely to
the above is the fact that the more knowledgeable an individual is concerning
personal financial issues, the less likely that individual would be to make inaccurate
financial decisions that could lead to financial problems, such as taking out
inadequate insurance, exceeding his or her income and making incorrect investment
decisions (Kotzè & Smit, 2008:42).
According to Basu (2005) and Oseifuah (2010:168), financial literacy is the ability to
make informed judgments and to take effective actions regarding the current and
future use and management of money. Financial literacy includes the ability to
understand financial choices. For example, the ability to compare offers before
applying for a credit card, having a current as well as a savings account, having a
bookkeeping system, planning for the future like saving or investing for long-term
goals such as education, a home and vacations (Nyamute & Maina, 2011:2).
According to Anthens (2004:50) and Nyamute and Maina (2011), it is therefore
implied that financial literacy also calls for wise spending, which entails preparing
budgets, tracking expenditures, paying bills on time, and ensuring that credit card
balances are paid in full each month. Financial literacy should therefore enable a
consumer to understand financial choices, plan for the future and spend wisely to
avoid over-indebtedness.

Lesolobe Moaisi Page 26
Lusardi and Tufano (2009) specifically focus on the term “debt literacy”, which is
described as the ability to calculate percentages, to calculate compound interest and
to understand repayment schedules. This implies the capacity of individuals to make
simple financial calculations on matters directly pertaining to the cost of debt
contracts (Disney & Gathergood, 2011:2). Only debt-literate consumers can take the
cost of debt into consideration, as a result taking precautionary measures to avoid
over-indebtedness.
2.2.2 Impact of financial literacy on consumer debt
Mounting personal debt has caused South Africans’ savings to become insufficient.
Deregulation in South Africa has led to virtually instant higher levels of debt for
consumers at around 78 per cent (South African Reserve Bank Quarterly Bulletin,
2010), with the consequent decrease in savings from 8 per cent in 1985 to 0.52 per
cent in 2006 (Kane-Berman & Tempest, 2007:87). This is confirmed by Kotzè and
Smit (2008:37) who argue that debt levels for South African consumers are higher
than ever while saving statistics are declining.
In recent years, the results of various research studies have also shown that
households which demonstrate low levels of financial literacy do not plan for
retirement (Lusardi & Tufano, 2009), borrow at high-interest rates (Kotzè & Smit,
2008), and acquire fewer assets (Oseifuah, 2010). People with low financial literacy
are also more likely to have problems with debt (Lusardi & Tufano, 2009). They are
less likely to participate in the stock market and less likely to choose investment
products with lower fees (Oseifuah, 2010:166).
Kidwell and Turrisi (2004:601) further point out the strong link between the
accumulation of personal debt and a distinct lack of skills in money management.
Excessively high debt levels, low saving rates, becoming targets of investment fraud,
delinquency on credit cards and bankruptcy have all been found to be related to
financial illiteracy among individuals (Kotzè & Smit, 2008:37). This is supported by
Gathergood (2012 592) who also found a positive relationship between financial
illiteracy and over-indebtedness. Individuals with poorer levels of debt literacy

Lesolobe Moaisi Page 27
underestimate the cost of consumer credit repayments, they are more likely to use
high-cost credit and they are also more likely to over-borrow and so are more likely
to fall into arrears with their debt (Lusardi & Tufano, 2009).
Atkinson and Kempson (2004:2) found that young people in Britain aged 18 to 24 are
increasingly over-borrowed, leading to financial difficulties because of financial
illiteracy. This is supported by Lorgat (2003:6) and Kotzè and Smit (2008:41) who
argue that workers find themselves in financial crises owing to the need to spend
their income on costly goods, such as branded clothes and cell phones, for the
purpose of fitting into a society where these goods have become a necessity rather
than a luxury. Garðarsdóttir and Dittmar (2012:472) add materialism as another
factor that causes consumers to disregard basic financial management skills and
ultimately becoming over-indebted. Anthes (2004:52) supports this viewpoint by
referring to the “instant gratification mentality” that lures individuals into spending
more on what they want and do not necessarily need.
Over the past two decades, consumer debt has grown faster than the household
income (Pressman & Scott, 2010:10). According to Dutt (2003:2), the accumulation
of consumer debt will, at least in the long run, have a negative effect on economic
growth by reducing savings and investment. This will in the end affect the
consumer’s standard of living, which might, in turn, lead to poverty. Disney and
Gathergood (2011:6) further indicate that households with lower levels of literacy
(typically when young) accrue less wealth, are likely to over-borrow and enter later
life with lower wealth. It is for these reasons that consumers need to be debt-literate
to manage their debt effectively. The remainder of this chapter will therefore focus on
consumer indebtedness in detail.
2.3 WHAT IS CONSUMER INDEBTEDNESS?
The Opinion Research Corporation (ORC Macro (2001:14) describes debt as
follows:
Debt is a common instrument used to maintain a stable level of consumption,
compatible with its lifetime resources, over different stages of the individual or

Lesolobe Moaisi Page 28
family's lifecycle. Being indebted, formally or via informal family channels, is
normal consumer behaviour and a certain level of debt is inevitable for the
majority of households, particularly at the earlier stages of their lifecycle.
“Household debt” includes mortgage debt on all residences and real estate, while
“consumer debt” covers debt outstanding on credit cards, personal and home equity
lines of credit, secured and unsecured loans from banks and other institutions
(Chawla & Uppal, 2012). InvestorWord (2011) however defines consumer debt as
“debt incurred for consumable or depreciating assets that aren’t considered
investments. This includes items bought through credit card, store card-financed
consumer purchases, car loans, and purchases through family loans”. Consumer
debt does not include mortgages, home or business equity loans, home or business
equity lines of credit, or stock margin accounts (Accountingglossary, 2011).
INSOL International (2001:1) on the other hand adds to the investorWord comments
by defining a consumer debtor as a debtor whose liabilities are incurred primarily for
private, family or household purposes and not as a result of carrying on business,
either on the debtor’s own account or in partnership with others, or arising from
guarantees given on behalf of limited liability entities. This implies that a consumer
debtor’s liabilities should relate primarily to personal bank overdrafts, personal loans
from any financial institution, personal credit cards and hire purchase relating to
consumables that support personal life style.
Literature reveals that there is a direct link between debt and credit as it could
represent two sides of the same coin. This is explained eloquently by Finlay (2009:3)
who states that credit is that which is provided and debt is that which is owed. Credit
can therefore be defined as “money, goods or services provided to an individual in
lieu of payment” (Finlay, 2009:4). This could imply that the definition of debt is a
mirror image of credit definition. Credit will always result in debt and could lead to
over-indebtedness if taken excessively.
The Bureau of Market Research (2009:6) opts to define over‐indebtedness as
consumers spending more than 25% of their gross monthly income on unsecured

Lesolobe Moaisi Page 29
repayments, consumers spending more than 50% of their gross monthly income on
total borrowing repayments, consumers with four or more credit repayments and
consumers who are in arrears with credit commitments for more than three months.
The Public Service Commission (2007) uses subjective measures only to define
over-indebtedness as the inability to meet periodic instalment obligations and being
faced with a debt spiral, that is, failure to meet interest payment obligations.
However, it is difficult to quantify the definition as it is subjective to individual
consumers. The definition used by the Bureau for Market Research (2009) is very
comprehensive and will be used in this study to define over-indebtedness.
2.4 THE RISING CONSUMER DEBT
Many studies (Akhaabi, 2010; Hurwitz & Luiz, 2007; Mlandu, 2005; Worthington,
2006) have shown that debt has become an integral part of everyday life. Today
there are very few goods or services that cannot be bought on credit terms or
retailers who do not cater for credit facilities (Finlay 2009). Towards the end of the
2000s, the American public had a combined personal debt of more than $2.5 trillion,
mainly in the form of credit cards, personal loans and hire-purchase agreements
(Federal Reserve Board 2008 in Finlay, 2009).
The Australian society has also reported some uneasiness about the growth of
household debt. From December 1992 to December 2002, the ratio of total
household debt to income rose from a level that was relatively low at 56% to one that
is in the upper range for comparable economies of 125% (Worthington, 2006). This
represents an average annual growth rate of 13.9% over the decade and 14.7% over
the past five years. The credit card debt to income ratio in Australia grew by 17.4%
over the decade and 20.9% over the past five years (Worthington, 2006). This clearly
shows that household debt in Australia is growing rapidly and need appropriate
interventions urgently.
The less developed countries are also experiencing increase household debt. In
Botswana, the rising level of debt have also been alarming, with the bank credit
alone rising from P5 billion in 2001 to P17 billion in 2009(Pula (P) is Botswana
currency), while the popularity of the unregulated micro-finance houses among the

Lesolobe Moaisi Page 30
poorer consumer is increasing (Iyanda & Biza-Khupe, 2011). Even though Iyanda
and Biza-Khupe (2011) do not quantify the usage of unregulated micro-finance
institutions, the usage might not be different from that of the South African
population.
Daniel‘s (2001:18) analysis of household debt in South Africa showed that
indebtedness generally increased while cash-flow generally decreased. In South
Africa, a clear inverse relationship between the ratios of household debt to personal
disposable income, and between household saving in relation to the personal
disposable income of households can be discerned from the beginning of the 1980s
(Prinsloo, 2002:72). The deterioration in the debt-savings ratio of households at the
beginning of the 1980s coincided with the greater use of credit by households.
Growth in all the categories of household credit such as mortgages, overdrafts
and other loans, instalment sales, leases and credit cards was rising between
January 2004 and September 2006. The fastest growth occurred in credit cards
(138%) and leases (123%), followed by mortgages (87%) and instalment sales
(81%) while growth in overdrafts and other loans (36%) was the lowest relative to
the other categories of household credit (National Credit Regulator, 2006:1).
The twelve-month growth in credit extension to households increased by 6.1% in
January 2012 (South African Reserve Bank, 2012:41).
The report from the National Credit Regulator (2011) also indicates that household
debt is continually growing. The report indicates an upwards trend in consumer credit
between September 2011 and December 2011 as follows:
- unsecured credit increased to R21.21 billion (a quarter-on-quarter increase of
24.69%);
- credit facilities, which consist mainly of credit cards, store cards and bank
overdrafts, increased from R14.88 billion to R16.60 billion (quarter-on-quarter
increase of 11.52%);
- short-term credit increased from R1.75 billion to R1.85 billion (a quarter-on-
quarter increase of 5.87%).

Lesolobe Moaisi Page 31
According to the Department of Trade and Industry (dti) (2006:40), the definition of
unsecured credit and short-term credit covers consumer credit.
Even though consumer debt has been increasing, studies have shown that growth in
North West Province has been among the lowest in the country. Daniels (2001:12)
contends that North West Province is the province with the lowest levels of
indebtedness at 39% while the Western Cape is the highest at 97%. These figures,
however, include mortgage debt. The fourth quarter report of the National Credit
Regulator (2011:6) categorises North West Province as the province with the third
least debt levels after Northern Cape and Limpopo. Statistics SA (2004:58) indicates
that North West Province comprises 6.9% of the country’s formal employment
opportunities, and 7.7% of the country’s informal employment opportunities, which
might be linked to the low levels of indebtedness. Ardington et al. (2004:621) and
Daniels (2001) found that poor households had low levels of indebtedness, which
could perhaps be partly explained by a lack of access to financial instruments in the
formal banking sector, corroborated by low levels of collateral among the poor.
Even though the level of indebtedness in North West Province is low due to the
social characteristics of the province, the current study focused on the permanently
formally employed population in the province. Previous studies have shown that this
focus group could easily be granted credit due to their employment status. As
consumers, they could incur debt for a wide variety of reasons as discussed below.
2.5 WHY DO PEOPLE TAKE HOUSEHOLD DEBT
Studies have different views regarding the drivers of consumer debt. Some studies
(Jacobs & Smit, 2010; Núñez et al., 2008) only covered consumer debt while others
(Weller, 2007) included mortgage debt to present household debt instead. The
increase in consumer debt is driven by conspicuous consumption, impulse buying,
institutional supply of credit, consumer irrationality as well as the consumer life cycle
(Akhaabi, 2010:54). Jacobs and Smit (2010), on the other hand, assert that
materialism among low-income consumers with a disposable income of less than
R7 000 per month drives consumer indebtedness. Public servants earning a gross

Lesolobe Moaisi Page 32
income of less than R7 000 per month are below level 5 salary level (PERSAL
system, 1990).
Weller (2007), on the other hand, argues that the growth in household debt is largely
channelled for home purchase and home improvement, followed by car purchase;
and that the desire for instant gratification is a small contributory factor. This is
supported by Hurwitz and Luiz (2007:120) and Núñez et al. (2008:27) who argue that
the reasons for borrowing among the urban working class in South Africa are mainly
for renovation of a house and funeral arrangements. The figure below indicates
some of the main reasons for South Africans taking on debt.
Figure 2.1: Reasons for borrowing – purpose of pers onal loans
Source: Adapted from Hurwitz and Luiz (2007:120)
It is clear from the figure above that most consumers take on debt mainly to pay off
existing debt and for family emergencies. Mlandu (2005) agrees with Hurwitz and
Luiz (2007), namely that when asking the respondents about the reasons for taking
on loans, most of them indicate that they take credit on to improve their homes,
purchase a house, for emergency services (death in the family), debt consolidation,
or study loans.

Lesolobe Moaisi Page 33
It is evident from studies on drivers for household debt that consumers have almost
similar reasons for taking on debt. The most prominent reasons given are for family
emergencies and house renovation. The type of debt taken on by households could
also provide some insight on the usage.
2.6 CLASSIFICATION OF CONSUMER DEBT
Different literature examines household debt portfolios according to the type of credit
incurred. The two major components of household sector debt are customarily
classified into household credit and mortgage advances (South African Reserve
Bank, 2010). Household or consumer credit is, in turn, subdivided into open
accounts, personal loans at banks, other personal loans, credit card facilities,
instalment sale transactions and lease agreements (Prinsloo, 2002:64). Van der Walt
and Prinsloo(1995) explain open accounts as all outstanding debits to credit
providers and the amount payable for the purchase of goods and services that will
be paid in full at a predetermined future date or in instalments over time.
Nyaruwata and Leibbrandt (2009), on the other hand, categorise consumer debt into
personal loan from bank, personal loans from micro-lenders, mashonisa, study loans
from banks, study loans from the academic institution, loans from friends and family
members, car finance, credit cards, store cards, hire purchase (see also Finlay,
2009).
Núñez et al. (2008:25) contend that the most common sources of loan to households
in South Africa are formal sources such as the bank. Figure 2.2 below indicates
some of the sources of credit identified by Núñez et al. (2008).

Lesolobe Moaisi Page 34
Figure 2.2: Loan sources
Source: Adapted from Núñez et al. (2008:25)
The figure above indicates that banks are the biggest credit providers followed by the
mashonisa. The number of credit accounts however indicates a different picture. The
National Credit Regulator examined the number of accounts issued by credit
providers. Figure 2.3 below indicates the number of accounts per classification.
Figure 2.3: Number of accounts (as a percentage of the total)
Source: National Credit Regulator, (2009:8)

Lesolobe Moaisi Page 35
Figure 2.3 above indicates that the majority of consumers (36.6%) use store cards
as a method of payment. Although mortgage (6.0%) and motor vehicle debt (5.5%) is
by far the biggest contributors in terms of value to household debt, few consumer
have access to those types of credit.
The discussion below will cover the types of consumer debt that are presumably
relevant to most consumers and to a large extent reflect the largest items in a typical
consumer’s debt portfolio.
2.6.1 Personal loans
Finlay (2009:16) describes an unsecured personal loan as a loan advanced with no
guaranteed security in the case of default. However, the lender may be able to
recover unpaid debts via a court order, possibly leading to repossession of the
borrower’s assets. The typical idea of such contracts is to lend a specified amount at
a specified fixed interest rate with specified maturity and to prescribe a precise
repayment pattern (Van der Walt & Prinsloo, 1995). Bertola and Houchguertel (2005)
contest that, because a personal loan is normally unsecured, the costs of application
are potentially high and the interest rate charged is often higher than with instalment
credit of similar size.
In 2008, almost 89% of personal loans were for amounts between R 1000 and
R25 000 (National Credit Regulator, 2009:20). Paulse (2012) indicates that personal
loans and advances have been increasing since 2005 in South Africa. Data from the
SARB indicates that personal loans amounted to R145 468 000 in January 2012
compared to R39 262 210 in January 2005 and R28 380 020 in January 2000.
Although the figures relate only to personal credit from the banks, it clearly shows a
steady increase in the value of personal loan debt among consumers.
2.6.2 Other personal loans
Financial institutions and other credit extension institutions offer variety personal
loans. One of these personal loans is a payday loan or payday lending, which Finlay
(2009:24) describes as a short-term loan to cover borrowers until they receive their
next pay cheque, and the loan is repaid in full with interest. Payday lending is also

Lesolobe Moaisi Page 36
commonly considered to be predatory lending as the practice typically involves high
interest rates, excessive fees, deceptive and aggressive marketing, and a general
lack of concern for the borrower’s ability to repay (McCaulley, 2011).
Payday loans have similar characteristics as the instant loans, which are usually for
a short time and popular among young adults (Autio, Wilska, Kaartinen &
Lähteenmaa, 2009:408; Bertola & Houchguertel, 2005). Buckland and Martin
(2005:170) argue that young people take instant loans for essentials, such as food,
rent and transportation expenditure, and also for ‘having fun’, for example, partying,
leisure activities and travelling. Mashigo (2006) argues that these loans are usually
provided by family and friends, and could be very expensive when provided by
mashonisa.
It is common knowledge that consumers will sometimes borrow money from a friend
or relative. Very few studies have been conducted on this type of credit.
Dictionary.com (2012) defines a relative as a person who is connected with another
or others by blood or marriage. Bertola and Houchguertel (2005) contend that
borrowing from one’s nearest kin may offer particular advantages over bank lending
as it may reduce interest charged. Mashigo (2006) maintains that this type of credit
is more common in poor households than in households with high incomes because
of a lack of access to financial services, such as overdraft facilities. This type of
informal lending also depends on access to and pricing in formal lending markets
and cultural factors (Bertola & Houchguertel, 2005).
On the other hand, Núñez et al. (2008:3) argue that loans from mashonisa are
frequently linked to unexpected household expenses (emergencies, food and
transport) and that due to the nature of its uses, the loans are mostly unplanned. The
marginalisation of poor households by the formal financial institutions results in the
households utilising the informal financial services of the abusive moneylenders who
place the households in debt spirals (Mashigo, 2006). The costs and interest rates of
these loans are considerably higher than those of housing loans or normal credit
cards, at an average of 24% (Autio et al., 2009:408).

Lesolobe Moaisi Page 37
2.6.3 Overdrafts
Overdraft facilities are available to the holders of current accounts at banks. These
facilities enable clients to withdraw funds from such accounts over and above the
amounts deposited into the account (Van der Walt & Prinsloo, 1995:2). Overdrafts
are usually associated with short-term lending, particularly at month-end prior to a
salary being paid into the individual’s account (Finlay, 2009:23).
Van der Walt and Prinsloo (1995) further argue that the conditions for the repayment
of overdrawn accounts are flexible and arranged at the discretion of the banks and
with the client’s need and financial capabilities in mind.
In January 2012, the SARB reported that the amount outstanding from overdraft in
South Africa is R27 494 000. This is an increase from the R20 763 360 registered in
January 2005 (Paulse, 2012).
2.6.4 Educational loans
College or graduate students who cannot afford education costs are likely to
generate debt to cover the costs and expect a higher return in earnings after
graduation that will allow for repayment (Jiang, 2007:84). In South Africa,
government provides the bigger chunk of student loans with the remaining portion
provided by financial institutions (Nyaruwata & Leibbrandt, 2009). Education loans
therefore allow consumers to incur debt even before having an employment income.
With many households being unable to afford tertiary education, there is an increase
of graduates and first-time employees who are indebted.
Education loans are one of the fastest growing consumer debt categories. In the US,
the 2010 data indicated that for the first time, outstanding student loan debt
exceeded outstanding credit card debt (Kantrowitz, 2010). The average amount of
student loan debt in 2008 was $23 200, which is an increase of over 70% in ten
years and an average increase of over $10 000 (Scott & Pressman, 2011:340).
Government plays an active role in providing financial assistance to students in
further education and higher education institutions. In 2010, government through

Lesolobe Moaisi Page 38
various government departments, allocated R3 154 697 292 for bursaries and loans
to students National Student Financial Aid Scheme (NSFAS), 2011:4). NSFAS
(2011:13) further indicates that student debt reported in 2010 stood at R895
704 000, while student loan repayments stood at R5 110 610. However, 40% of this
loan may be converted into a bursary depending on academic performance (NSFAS,
2011:14).
Government study loans often entail promoting education and increasing access to
employment and thus a better standard of leaving (Bertola & Houchguertel, 2005).
Hyounjin Yi (2010:55) argues that young people with educational loans are less likely
to own a house and they delay having children and the decision to get married. This
could imply that debt could delay the consumer’s progress in life as a result of
servicing the debt obligations.
2.6.5 Credit cards
A credit card account allows a customer to purchase goods and services from any
merchant who has entered into an arrangement with the card issuer (Finlay,
2009:18). Credit cards have become a vital component of personal money
management and consumer life-style management (Wickramasinghe &
Gurugamage, 2009). Jiang (2007:17) defines credit card debt as the total amount
owed on all credit cards after the most recent payments, which will have to be
carried over to the next period and be charged with interest at the end of the billing
cycle. The outstanding debit balance at the end of each calendar month, and not the
total credit available, is taken into account when calculating the total consumer credit
(Van der Walt & Prinsloo, 1995:3).
Consumers use credit cards as a payment device and a source of revolving credit
(Starvins, 2000). There are two types of credit card users, convenience (transactor)
users and revolvers (Lee & Hogarth, 1999). Convenience users tend to use credit
cards as an easy mode of payment and to typically pay their balance in full upon
receiving the account statement (Jiang, 2007:49), while revolvers, on the other hand,
use the card principally as a mode of financing and elect to pay interest charges on

Lesolobe Moaisi Page 39
the unpaid balance (Lee & Kwon, 2002). Consumers can also freely switch roles
between revolvers and transactors (Jiang, 2007).
Wickramsinghe and Gurugamage (2009:444) add that credit cards help consumers
to access a level of participation in contemporary consumer culture that is different
from what would be possible in its absence. Consumers could use credit card as a
mode of short-term financing and realise savings that may result by buying now
rather than later. Credit card therefore seems to offer much in reducing financial
stress, as it provide the flexibility to maintain basic social and consumption activities
(Worthington, 2006:15). It is this convenience that could cause over-reliance on
credit cards resulting in credit card over-indebtedness.
Credit card accounts form a substantial and growing share of consumer debt. In the
United States, more than 75 per cent of adults have at least one credit card with an
average of 4.2 cards per cardholder (Wang, 2006:23). It is also one of the major
forms of payment, as credit cards were used for 21.7 billion transactions in the US in
2006, which accounted for 23.3% of non-cash payments (Hyounjin Yi, 2010:21).
Credit card debt levels relative to income are highest among low-income families
(Centre for American Progress, 2006). Low-income families owed the equivalent of
9.5% of their income on credit cards, while middle-class families owed 5.2%, and
high-income families owed 2.3% (Centre for American Progress, 2006).
Credit card debt in South Africa has also been increasing. In 2002, it was estimated
that there were 4.9 million credit cards (held by individuals) with outstanding
balances of R13.6 billion, while by mid-2008, this had increased to 6 million accounts
with outstanding balances of R36.8 billion (National Credit Regulator, 2009:16). In
2002, the SARB, as reported by Paulse (2012), indicated that in January 2000, about
R10.9 billion was outstanding from households’ credit. This increased to R21.6 billion
in 2005 and to R60 billion in January 2012. This indicates that the usage of credit
card in South Africa has been increasing rapidly.

Lesolobe Moaisi Page 40
2.6.6 Store cards
A store card is one of the payment systems widely used throughout the world and
which also leads to indebtedness. Although a store card is similar to a bank credit
card, it is more easily obtained than a bank credit card because customers’ financial
status is not necessarily reviewed with the same severity during application
(Worthington, 1996), thus overspending seems almost inevitable (Erasmus & Lebani,
2008:211). Liberal credit limits allocated to holders of store cards encourage
spending and provide fertile grounds for overspending (Kaynak, Kucukermiroglo &
Ozmen, 1995) as consumers who would not necessary be eligible for credit, are
granted store cards.
Erasmus and Lebani (2007:60) contend that store cards serve two distinct purposes:
- as a convenient transactional medium, they substitute cheques and cash; and
- as a source of revolving credit, they enable purchases that can otherwise not be
afforded.
Because of store card’s purpose as revolving credit, consumers in lower-income
groups find it highly appealing (Lee & Kwon, 2002).
Holders of store cards enjoy additional benefits that may appear more rewarding
than the credit facility itself, e.g. special discounts, promotional vouchers and club
membership that even grants insurance cover and legal representation (Erasmus &
Lebani, 2008:213). Obtaining a store card consequently makes perfect sense to the
extent that non-holders may get the idea that they lose out when they pay cash
(Chakravorti, 2003).
Retailers provide store cards to customers to enable them to buy on credit. This is
for customers a convenient way of paying as they can purchase even without cash
but create debt that will need to be serviced in future.
2.6.7 Hire purchase
Bertola and Houchguertel (2005:12) describe hire purchase, which is often called
‘instalment sale agreement’, as a transaction in terms of which goods or services are
provided to the buyer, but where the purchase price is paid in instalments over a

Lesolobe Moaisi Page 41
period in the future. This type of credit is used almost exclusively to finance the
purchase of durable consumer goods such as cars and household utilities like sofas,
television sets and other household items (Finlay, 2009:17). Bertola and
Houchguertel (2005) argue that this kind of consumer credit is cheaper that taking
out personal loans.
Pressman and Scott (2010:10) contend that hire purchase is the only consumer debt
that has not experienced rapid growth in the past number of decades, although it still
increased by 34% between 1989 and 2007. The argument was that the relatively
small growth rate in this category can probably be ascribed to the fact that many
items previously bought using an instalment loan can now be charged with a credit
card.
In January 2012, growth in the instalment sale credit category came to 7.2%, the
highest growth rate since December 2008 (South African Reserve Bank, 2012:41).
The report from the National Credit Regulator (2009) indicated that furniture credit
outstanding was at R12.1 billion, representing 3.3 million accounts, while the debt
outstanding from motor vehicle finance was R176 billion, representing 1.77 million
accounts. The growth in instalment sale credit continued to benefit from lively
consumer demand for motor vehicles in an environment of low interest rates. This is
supported by an increase in the sales of private cars in South Africa (South African
Reserve Bank, 2012). In April 2011, 26 327 passenger cars were purchased against
29 517 of the same in April 2012 (National Association of Automobile Manufactures
of South Africa (NAAMSA), 2012). In the US, roughly 40 per cent of households had
motor vehicle debt in 2007 compared to 25 per cent in 1983 and 20 per cent in 1962
(Pressman & Scott, 2010:9).
2.7 MEASURING CONSUMER DEBT
The task of monitoring consumer debt is complicated because there are several
ways to measure the debt burden. These measures are usually calculated as a
ratio comparing the amount of consumer debt with a measure of a consumer’s
ability to repay, such as household income or assets. The most commonly used

Lesolobe Moaisi Page 42
measures of ability to repay are disposable income, which is the after-tax
spendable income (Garner, 1996:65).
The measures of consumer debt can be classified into the following general models
of consumer indebtedness (Opinion Research Corporation, 2001:62):
• The administrative model examines all cases where non-payment of debts
have been registered officially or declared before a court.
• The objective (or quantitative) model devises quantitative measures that try to
capture the net indebtedness or the debt service burden of households (e.g. debt
to assets or debt to income) and then establishes threshold levels of the ratios
that are regarded as abnormally high, putting consumers in danger of becoming
over-indebted.
• The subjective model where over-indebted consumers are classified as those
who consider themselves to be over-indebted.
Raijas, Lehtinen, and Leskinen (2010:211) contend that payment default of a
consumer’s credit debt is the first public sign for creditors that the debtor has
financial difficulties. It is regarded as a very important signal of the consumer’s
inability to repay a loan. Analysts sometimes look at more direct measures of
household financial distress, such as delinquency rates or the number of personal
bankruptcies (Greninger, Hampton, Kitt & Achacoso, 1996:61). The National credit
regulator has been using this method to measure the consumer credit default rate.
This is regarded as an administrative measure of consumer debt.
Another measure of consumer indebtedness is using a subjective view of asking a
critical question of whether the respondent feels that she or he is coping with her or
his debts (Raijas et al., 2010:218). The Euro-Barometer survey (Raijas et al., 2010,
citing the European Commission (EC), 2008) measured the level of over-
indebtedness across all European Union (EU) member states by asking a sample of
respondents in each state whether they had had difficulty paying all their bills at the
end of the month, and 13% admitted to having had difficulties with their payments.
Hurwitz and Luiz (2007) used the same measure of consumer debt and reported that
40% of the respondents indicated that their debt levels fell within an acceptable

Lesolobe Moaisi Page 43
range. Most of the surveys, such as those by Statistics South Africa (2008) namely
the Income and Expenditure Surveys, used this method of measuring consumer
indebtedness. The weakness with the subjective model of measuring consumer
indebtedness is that consumers might not be aware that they are on the verge of or
already over-indebted and that the researcher has to rely on the response provided.
The objective or quantitative measure of consumer indebtedness is the mostly used
model as demonstrated by most studies. The debt–income ratio can be measured
using outstanding debt or current monthly debt service payment (Hyounjin Yi,
2010:8).
The ratio of the total outstanding debt to income was used by Daniels (2001) and
National Credit regulator quarterly reports (2010; 2011). This method typically uses
information from credit providers’ database to get the information on the debt
outstanding on the instalment of the loan. To determine debt relative to income,
Hurwitz and Luiz (2007) used the National Loans Register (NLR) and Consumer
Credit Association (CCA) database to obtain information about the cumulative value
of current instalments owed to lenders and retailers at that stage, where it was found
that 60% of the consumers were indebted beyond 30% of their gross income, 28% of
the consumers to more than 100% of their gross personal monthly income, 10% to
200% or more, and 6% beyond 300%. Daniels’s study included mortgage debt.
One of the most widely cited measures is the ratio of consumer debt payment to
disposable income. Debt service payments include payments for both principal and
interest on outstanding consumer debt (Garner, 1996). Greninger et al. (1996:64)
used this measure as non-mortgage debt payments to after-tax income, which
indicates a danger point when the ratio is above 20% of total debt payments to after-
tax income. Zhao (2003:178) used the debt repayment to income after-tax ratio to
gauge household debt status also using a threshold of 20% to indicate over-
indebtedness while Jacobs and Smit (2010:29) used debt repayments in excess of
the accepted level of 30% of gross monthly income. The Micro Finance Regulatory
Council of South Africa (MFRC) identifies clients as over-indebted if they are using a
Lesolobe Moaisi Page 44
loan to pay off other loans or allocating more than 25% of their gross monthly income
or 50% of the net monthly income to loan repayment (Núñez et al., 2008:10).
Other studies, such as that by Nyaruwata and Leibbrandt (2009), used both the
outstanding debt and monthly repayment to measure the indebtedness level, and
found that the ratio of outstanding debt to yearly income was lower than the monthly
ratio of payment to monthly income. Garner (1996:45) at the same time found that
consumer debt service payments as a fraction of disposable income rose to 11.1% in
the second quarter of 1996, while ratio of consumer debt to disposable income was
at 20.7% for the same period. Using both ratios might produce different results.
In most cases, it is common knowledge that consumers do not know the updated
amount outstanding but accurately know how much they pay monthly. Interest on
outstanding debt has an impact on the principal amount, and thus the consumer
would have to get a monthly balance to know the outstanding debt. The current
study thus focused on the monthly payment rather than the outstanding debt to
determine the consumer debt level among public servants.
2.8 CONSUMER DEBT AND DEMOGRAPHIC VARIABLES
Various studies examined the relation between consumer debt and demographic
variables. The most common demographic variables in most studies are age,
gender, marital status, educational level and number of family members (Lea,
Webley & Walker, 1995). Studies have already found different results among
different demographic variables and inconsistent reports on a specific variable.
Parker and Chatterjee (2009:181) argue that there is no significant relationship in
terms of gender, family income and/or level of education, while Lusardi and Tufano
(2009:23) contend that low levels of debt literacy are the norm, and understanding of
the basic mechanics of debt is limited, especially among the elderly, women, certain
minorities and people with low incomes and little wealth. The following are some of
the findings by different studies per variable.

Lesolobe Moaisi Page 45
2.8.1 Age and consumer debt
Consumer debt is the typical humped shape implied by the simple life-cycle
hypothesis: debt increases among younger age groups, peaks at middle age and
then tapers off among older age groups (Jiang, 2007:28). This theory is supported by
the Public Service Commission (2007) findings as indicated in Figure 2.4 below:
Figure 2.4: Amounts paid to micro-lenders during th e 2006/2007 financial year
according to age group
Source: Adapted from Public Service Commission (2007:16)
Figure 2.4 show that employees in the age groups 40–49 and 50–59 paid the highest
amounts to micro-lenders during the 2006/2007 financial year. This could imply that
middle-aged consumers are highly indebted as compared to other groups.
In spite of life-cycle hypothesis, younger families are more likely to be in debt than
older families (Curtis, 1962:47; Livingstone & Lunt, 1992:127; Van der Walt &
Prinsloo, 1995). Jiang (2007:84) reiterates by saying that, as older households do
not necessarily have a large income after retirement, they usually rely on their
savings/wealth accumulated over time and would therefore be less likely to borrow
large amounts. Younger borrowers will more likely be short-term borrowers and
consumption-oriented, while older consumers would be slightly more inclined to use
credit for purposes that may improve income-generation opportunities, such as
education, or to buy an asset (Hurwitz & Luiz, 2007:120).

Lesolobe Moaisi Page 46
Interestingly, the study by Parker and Chatterjee (2009:180) compared the consumer
susceptibility between consumers in the US and Singapore, and found that for
consumers in Singapore, credit susceptibility increases with age while in the US,
younger consumers are more prone to credit use. The contrast reported by different
studies makes it difficult to come to a conclusion, but the life-cycle hypothesis gives
sense as some debt incurred by the middle-aged is related to taking care of the
children.
2.8.2 Gender
Women tend to be more risk-averse when making financial decisions while men are
more likely to handle their finances adequately (Prince, 1993). In this respect, an
interesting result comes from a qualitative study by Thorne (2010) where it was
found that married women play the main part in handling financial affairs in case the
household’s debt situation becomes severe, while their husbands tend to be
irresponsible or reluctant. However, Thorne’s findings were based on 19 interviews
only. Higher cautiousness and responsibility of women when dealing with household
finances and debt can be reflected by higher debt burdens of women compared to
men (Keese, 2012:4; Lea et al., 1995:691).
Erasmus and Lebani (2008) indicated that females are likely to own more store cards
than males. This confirms the findings of a UK study (Opinion Research Council
International, 2004:4) where it was reported that women will more likely own store
cards while men mostly use bank credit cards.
Contrary to other studies, Jacobs and Smit (2010:25) and Ardington et al. (2004:621)
argue that males tend to have higher levels of indebtedness than females. This is
supported by Daniels (2001:10) who contends that male-headed households are at
least twice as indebted as female-headed households. The Public Service
Commission (2007) indicated that 53% of public servants who make payments to
micro-lenders through the PERSAL system were males, while 47% were females.
The figure below supports the notion that males are more highly indebted than
females.

Lesolobe Moaisi Page 47
Figure 2.5: Total outstanding debt/yearly income an d monthly payment/income
by gender
Source: Adapted from Nyaruwata and Leibbrandt (2009:8)
Figure 2.5 underscores that male-headed households have both a higher
outstanding balance to yearly income ratio and last payment to monthly income ratio
than females.
2.8.3 Education and consumer debt
Highly educated consumers are likely to have more debt than less educated
consumers. This is supported by Curtis (1962:49) who asserts that advanced
education means more familiarity with the advantages of credit, increases in the
appetite for material and nonmaterial goods, and improves the chances of being
granted a loan. Consumers with higher education levels are more deeply indebted
due to income differences driving greater access to credit (Hurwitz & Luiz,
2007:120).
On the other hand, other studies contend that highly educated consumers have low
consumer debt. Education has a positive influence on financial literacy, thus the
ability to manage debt (Keese, 2012:3). Consumers with college or
graduate/professional degree could be more knowledgeable about money
management and more cautious about the appropriateness of their debt position
(Jiang, 2007:84). Educated consumers are better informed about the credit
conditions and could reduce the risk of facing over-indebtedness. In addition, less

Lesolobe Moaisi Page 48
literate households use higher cost credit lines disproportionately, have higher debt–
payments ratios to given levels of debt and have higher arrears (Disney &
Gathergood, 2011:21). On the contrary, the debt and education level relationship
may not appear to be strictly linear. That is, the highly educated group may not
necessarily have a lower debt burden than the intermediately educated (Jiang, 2007:
85).
Contrary to other reports, Livingstone and Lunt (1992) found no positive relation
between personal debt and level of education. Households headed by someone with
a post-school qualification or professional degree is in a similar debt burden position
as someone with or without a high school qualification, everything else being
constant (Zhao, 2003:184).
2.8.4 Income and consumer debt
Various studies have been done to examine whether income determines the level of
indebtedness among consumers. The results are inconsistent as some had positive
relations, negative relations or even no relations at all. Some of the studies reviewed
are discussed below.
Consumer indebtedness increases as income increases (Daniel, 2001:11). It is
expected that an increase in income would result in an increase in credit access
(Jacobs & Smit, 2010:26). Higher-income consumers have access to ‘big ticket’
items such as vehicle finance, and so their total outstanding debt forms a higher
proportion of their annual income than low-income consumers who emerge as
typically indebted to around 10–15% of their annual income (Hurwitz & Luis, 2007).
Zhao (2003:88) argues that households with steady and affluent incomes are
perceived as less risky borrowers and they are more likely to be granted the full
amount of loan while, on the contrary, low-income households could be prohibited
from obtaining large loans and hence they have less debt. Daniels (2001:6) argues
that the lower levels of debt among lower-income groups could partly be explained
by the lack of access to financial instruments in the formal banking sector.

Lesolobe Moaisi Page 49
However, Keese (2012:3) argues that higher-income households have low debt
levels. Debtors are more likely to be in low-income groups than in higher-income
groups (Lea et al., 1995:691). This was confirmed by the Human Sciences Research
Council (2003), which indicated that debt levels were rising faster in the lower-
income categories than in the higher ones (Jacobs & Smith, 2010). Credit card debt
and non-bank debt such as store cards are still the forms of debt that are highly
prevalent amongst low-income households (Barba & Pivetti, 2009). Lack of access to
formal financial services by poor households makes them look for alternative
sources of finance and they heavily depend on their local informal moneylenders
who are regarded as responsive to their financial needs (Mashigo, 2006:10).
The increases in consumer debt provide consumers, especially poor ones, with a
safety net which allows them to keep up their spending when their income falls (Bird
et al., 1999). In some instances, low-income consumers’ borrowing may be the only
way of covering essential living expenses when, for example, a washing machine
breaks, a child falls ill or the rent needs to be paid (Autio et al., 2009:408).
Furthermore, high-income consumers generally have low emolument (garnishee)
attachment orders. This is supported by the University of Pretoria Law Clinic
(2008:12), which found that the percentage of employees attached through
emolument orders generally decreases as income increases.
Several other studies contend that middle-income consumers are the one hard-hit by
consumer debt than any other income group. This is supported by Scott and
Pressman (2011:333) who assert that many middle-class households have relied on
consumer credit, such as credit cards and motor vehicle loans, to maintain their
standard of living. Their income cannot meet the desired standard of living and
hence resort to credit. The Public Service Commission report (2007) as reflected in
Figure 2.6 below supports this view.

Lesolobe Moaisi Page 50
Figure 2.6: Number of public servants who made paym ents to micro-lenders,
reflected according to salary level
Source: Adapted from PSC (2007:20)
Figure 2.6 above indicates that in 2007 there were more middle-income public
servants who paid micro-lenders through PERSAL system that any other group in
the public service. In 2011, the annual income at salary level 5 was R101 007 while
at level 11 it was R434 505 (PERSAL system, 1990). Figure 2.6 also supports the
life-cycle hypothesis as explained in section 2.7.1.
Livingstone and Lunt (1992:28) could however not establish whether higher income
was seen to result in increased borrowing as consumers in debt did not differ in the
amount of disposable income from those not in debt. Statistics SA (2012) released a
monthly report on the number of civil summonses for debt outstanding to credit
providers. The report reflects no difference in consumers’ income level. In February
2012, there were 63 515 civil summonses for debt issued to private persons
(Statistics SA, 2012).

Lesolobe Moaisi Page 51
2.9 GARNISHEE ORDERS
Over-indebtedness and the causes thereof have become an increasingly important
social challenge to individuals employed in both the private and public sectors. The
National Credit Act of 2005 plays a major part in ensuring that responsible credit will
be extended in future and further provides a remedy in the form of Debt Review (or
commonly known as Debt Counselling) in the event of a consumer becoming over-
indebted (Department of Trade and Industry, 2006).
A garnishee order, used interchangeably with “emolument attachment order” (Public
service commission, 2007) is issued when a consumer defaults on paying the debt
obligation. The Public Service Commission (2007:VI) defines a garnishee order as
“Court order for collecting a civil judgment”. FIHRST Management Services (2010:7)
elaborates this definition of garnishee order by describing it as debt enforcement
proceedings in terms of which the employee agrees to repay the amount of credit
extended by the credit provider, together with interest, costs and fees, in instalments,
over a period of time, as well as the process to be followed where the employee has
not met the commitments in terms of the agreement. A garnishee (emoluments
attachment) order can be obtained where the court has so authorised or the
judgment debtor has consented thereto (Department of Trade and Industry, 2006).
There was an increase in the number of impaired credit records in South Africa. The
University of Pretoria Law Clinic (2008:4) reports that, at the end of September 2007,
there were 16.9 million credit active consumers, of which 6.38 million or 37.7% had
an impaired credit record. It further reports that in May 2008 alone 105 427
summonses were issued for debt and 54 755 judgments were granted.
Garnishee orders are also prevalent among public servants in South Africa. The
Public Service Commission (2007:xi) report indicates the following:
… During 2006/2007 there were 216 857 public servants who made garnishee
related payments through PERSAL system. This constitutes 20% of the total
population of the Public Service and is a source of concern to the PSC. The
astronomical debt of R1.01 billion emanating from garnishee orders not only
reflects the extent of indebtedness but also clearly demonstrates the need to
Lesolobe Moaisi Page 52
create financial management awareness amongst employees in the Public
Service.
2.10 WHO IS A PUBLIC SERVANT?
It is common knowledge that a public servant is an employee of the state. The Public
Service Commission (2002) explains a public servant as an employee who promotes
the unity and wellbeing of the nation in performing the official duties. It is common
knowledge that an employee should serve the public in an unbiased and impartial
manner in order to create confidence in the public service and in turn earn a decent
income compatible with the duties.
In South Africa, public servants earn a decent salary, which is way above the poverty
line of R367 per month (SAFM, 2012) and the World Bank poverty line of $1.00 per
day (Bird et al., 1999). Public servant working for the provincial departments have
salaries classified according levels, with level one being the lowest-paid employees
while the highest level (15) is that for the heads of departments (PERSAL system,
1990). In 2011, public servants salary levels in the North West Department of Health
department ranged from the lowest at R55 350 while the highest was at R1 245 490
(PERSAL system, 1990).
The Bureau of Market Research’s (2009) describes the emerging middle-class
income groups as those earning between R50k to R300k per annum. This suggests
that most public servants are in the middle-income class in South Africa. The
generally accepted definition of the middle class in South Africa is the definition by
the South African Advertising Research Foundation (SAARF) Living Standards
Measure (LSM) as those falling between LSM 5 and LSM 8 (Mazibuko et al., 2009).
The middle class is characterised by its drawing its primary income (directly or
indirectly) from non-manual employment, as ‘white-collar employees’, managers,
self-employed business persons, or professionals (Southhall, n.d:1). This supports
the notion that most public servants are in the middle-class category. The SAARF
(2011) guideline indicates that most public servants are at Living Standards Measure
(LSM level 5 (R4 165) to LSM 10 (R29 512) per month, thus earning adequately to
maintain their life styles. With stable and adequate income, public servants are prone
Lesolobe Moaisi Page 53
to debt due to the ease with which they can access credit (Public Service
Commission, 2007).
2.11 EFFECT OF CONSUMER DEBT
Financial pressure and especially debt can be a major source of stress in the
workplace (Cox, Hooker, Markwick & Reilly, 2009). Barnard, Peters and Mueller
(2010:2) argue that employees’ debt-related problems become the organisation’s
problems because such strain affects employees’ productivity and their ability to
function optimally.
High spending habits of government servants could also lead to a tendency of
corruption (Duasa, 2008). Spending in this case includes payments of personal debt
which, according to Duasa (2008), is the main component of total spending and thus
also the main contributor to the tendency of corruption among government
employees.
The Public Service Commission (2007) highlights several other factors implicating
public service due to the effect of debt on the employees. The following factors are
mentioned in the report:
- administrative burden – the state has to administer, through its PERSAL
system, the payment of garnishee order and loans from micro-lenders;
- ill-health due to financial distress – the report state that persons who are
affected by micro-lending debt and especially garnishee orders will tend to get
sick more often than persons not affected by such a problem;
- low productivity – due to employees not in a good state of health or mind,
absenteeism or below standard performance will follow;
- irregular remunerative work outside the public serv ice – report suggests that
indebtedness can, among others, lead to employees taking on additional work
outside the public service; and
- ethical considerations – employees not conducting themselves in a manner
that promote ethics or ethical principles.
Lesolobe Moaisi Page 54
Keese and Schmitz (2010) argue that over-indebted individuals are more likely to
have bad health as both physical health and mental health deteriorate with the debt
burden. Approximately 15% of workers experience stress from poor financial
behaviours to the extent that it negatively impacts their productivity (Garman et al.,
1996). The study further indicates that poor financial behaviours result in extremely
high costs incurred by employers, including absenteeism, tardiness, fighting with co-
workers and supervisors, sabotaging the work of co-workers, job stress, reduced
employee productivity, lowered employee morale, accidents and increased risk
taking.
Contrary to other studies, Worthington (2006) contends that financial stress is very
much a function of the demographic and socioeconomic characteristics of
households and, to a lesser extent, debt. This was supported by Bridges and Disney
(2010) following their examination of the relationship between depression and debt
among families. This latter report indicated that there is little evidence that adverse
financial shocks have any direct effect on psychological wellbeing of an individual.
2.12 CONCLUSION
This chapter covered the role of personal financial management on personal debt.
This included the effect of financial literacy on consumer indebtedness. Financial
literacy is one of the important factors in personal financial management and
ultimately over-indebtedness.
The chapter also discussed the definition of consumer indebtedness and identified
elements to use when measuring over-indebtedness. The status of household
indebtedness internationally and in South Africa was also examined. Studies have
shown as in the case of the SARB (2012) that household debt is rising.
Consumers incur debt for a variety of reasons. The most prominent reason among
the poor is emergencies and settling other debt, while among the middle- and high-
income group it is mortgage debt (Hurwitz & Luiz, 2007:108).
Lesolobe Moaisi Page 55
Classification of debt or examination of the debt portfolio ensures that the researcher
was able to identify the most prominent composition of consumer debt. In this
chapter, a debt portfolio was noted to comprise of personal loans from banks, other
personal loans from other service providers, overdrafts, educational loans, credit
cards, store cards and hire purchases. Such debt portfolio entails the most common
types of consumer debt (Nyaruwata & Leibbrandt, 2009).
Household debt can be measured using the administrative model, objective
(quantitative) model and subjective model (Opinion Research Corporation, 2001:62).
Most studies reviewed in this chapter used the objective model for measuring
consumer debt.
This chapter also covered the relationship between different demographic variables
and household debt, and obtained varying results. Demographic variables such as
age, gender and education were discussed. The chapter also discussed the
relationship between income and household debt.
A garnishee order is issued when a consumer defaults on the debt payment
obligation. This is usually a sign of over-indebtedness. The effect of over-
indebtedness could result in bad health of the consumer and low productivity in
terms of the employer (Keese & Schmitz, 2010).
The literature helped to ensure that the current study focused on consumer debt and
also served as a basis for the questionnaire design. In Chapter 3, the research
methodology of the study is discussed.

Lesolobe Moaisi Page 56
CHAPTER THREE
RESEARCH METHODOLOGY
3.1 INTRODUCTION
This chapter outlines the research methods that were used in the study. In this
chapter, the researcher discusses the nature of the study, research methods and
designs. The sampling method and sampling procedure that were applied during the
study are also covered in this chapter. In addition, the chapter focuses on the
instrument that the researcher used to collect data, the sampling procedure that was
employed and the sampling technique. The plan for collection and analysis of data
are also discussed.
3.2 RESEARCH METHODOLOGY
Research methodology should be seen as a system through which a researcher is
able to collect, analyse and interpret data in order that the research aims and
objectives could be achieved (Nkatini, 2005:29). Tustin et al. (2005:82) add to the
above sentiments by defining the research design as the plan to be followed to
realise the research objectives or hypothesis. According to Wisker (2001:137), each
study dictates the kind of research methodology the researcher should use to
underpin the work and methods to use in order to collect data. At present, there are
two well-known and recognised approaches to research, namely the quantitative and
qualitative paradigms (De Vos, Strydom, Fouche & Delport, 2005:730). According to
Phenya (2011:44), both methods involve similar processes in terms of the formation
of the hypothesis, review of the related literature, collection and analysis of the data
but there are certain distinctions, which will be outlined below. Quantitative research
is any type of research that produces findings arrived at by statistical procedures or
other means of quantification (Strauss & Carbin, 1998). The ultimate goal is to learn
about a large population by surveying a sample of that population (Leedy & Ormrod,
2010:187). Lunenburg and Irby (2008:89) further argue that qualitative research
emphasises understanding by closely examining people’s words, actions, and
records as opposed to quantitative research approach that investigates such words
and actions, and records at a mathematically significant level.
Lesolobe Moaisi Page 57
The current study used a quantitative research approach to gather relevant data.
Leedy and Ormrod (2010:182) state that quantitative research involves either
identifying the characteristics of the phenomenon or exploring the correlation
between two or more phenomena. The reason for choosing a quantitative research
methodology was firstly the nature of the study, which dealt mostly with numbers,
measurement, analysis and intension while ensuring that the results could be
generalised to the entire department of health in the North West Province.
There are four research designs in quantitative research. The most appropriate
design for the study is discussed below.
3.3 STUDY DESIGN
Design refers here to the basic methods of collecting evidence: surveys, interviews,
experiments, observations, archival research and a combination of these methods
(Vogt, Gardner & Haeffele, 2012:3). This is supported by Welman and Kruger
(1999:46) who define the research design as the plan according to which the study
obtains research participants and collects information from them. Four different
approaches described by Lunenburg and Irby (2008:30) are correlation research,
experimental research, descriptive research and causal research design methods.
According to Leedy and Ormrod (2010:182), all these approaches yield quantitative
information that can be analysed through a statistics approach.
The current study used the descriptive quantitative survey research method. Leedy
and Ormrod (2010:182) argue that this type of research involves either identifying
the characteristics of an observed phenomenon or exploring possible correlations
between two or more phenomena. The aim was to learn about a population by
surveying a sample of that population and getting to know their characteristics and
attitudes. The researcher then drew inferences about the public servants in the
department of health from the responses of a sample. According to Welman and
Kruger (1999:84), if there is a great degree of regularity and orderliness in the
phenomenon being studied, this method can be used.
Lesolobe Moaisi Page 58
The study quantified the amount of money the respondents spend servicing
consumer debt, which determines the level of indebtedness of the population.
Welman and Kruger (1999:47) state that the research design should specify the
number of groups that should be used and the way this population should be
selected. These will be fully discussed in subsequent sections.
3.4 POPULATION AND SAMPLE FRAME
According to De Vos et al. (2005:194), a population is a set of elements on which the
research focuses and to which the results obtained by testing the sample should be
generalised. To this, Welman, Kruger and Mitchel (2005:52) add that a population
encompasses the total collection of all units of analysis about which the researcher
wishes to draw a specific conclusion.
The population in the study was all permanently employed public servants within the
provincial office of the department of health. The sampling frame was the list of
employees reflected in the PERSAL system (human resource electronic database)
for the provincial office of the department of health. At the time of the research, there
were 469 employees registered on the PERSAL system as the provincial health
department employees (PERSAL system, 2011). The employees are categorised as
36 senior managers, 83 middle managers, 236 technical/professional employees
and 114 lower-level employees. The vacancy rate of the provincial office as at
November 2012 was 27.2%. This is the population from which the sample was
drawn.
3.5 SAMPLING
A sample can be viewed as a subset of measurements drawn from a population
under the study (De Vos et al., 2005:195; Tustin et al., 2005:337).
One should distinguish between two broad types of sampling, namely probability and
non-probability sampling. With probability sampling, each element in the population
has a known, non-zero probability of being included in the sample (Tustin et al.,
2005:344). In the case of non-probability sampling, one cannot specify the probability
of each element to be included in the sample. Welman et al. (2005:56) mention the

Lesolobe Moaisi Page 59
following examples of probability sampling: simple random sampling, stratified
random sampling, systematic random sampling and cluster sampling, while
accidental sampling, quota sampling, purposive sampling, snowball sampling, self-
selection sampling and convenience sampling are highlighted as examples of non-
probability sampling.
The study used the non-probability quota sampling method. The quota sampling
method selects respondents in the same proportions that they are found in the
general population, but not in a random fashion (Leedy & Ormrod, 2010:212). It also
regulates the size of each category within the sample and, in most cases, in a
convenient way. Vogt et al. (2012:127) indicate that the researcher gets a
representation of each category, which enhances the credibility of non-probability
sampling. This approximates the results of probability sampling at less cost and less
hassle than strictly probability sampling (Bernard, 2000:175).
The researcher ensured that the sample covered all the categories of employees in
the provincial office, namely senior managers, middle managers, professional-level
employees and lower-level employees. The researcher also conveniently ensured
appropriate gender proportion of the employees. The study units were selected
proportionally according to the population but in a convenient way. Employees who
show interest in participating in the study and within the categories mentioned were
chosen. Employees were visited in their offices and as per category of the position in
the workplace. This ensured that each category of employees was covered and also
ensured that a sample size for the study was attained. Only those who their
workstations were within the provincial offices and who were permanently employed
by the department of health were included in the sample.
According to Gay and Arasian (2003:113), when selecting a sample, the researcher
should consider the following:
- if the population has fewer than 100 people, the entire population should be
surveyed;
- if the population is approximately 500 people or units, 50% should be sampled;
and

Lesolobe Moaisi Page 60
- if the population is approximately 1 500 people or units, 20% thereof should be
sampled.
Given the above guideline and that the study population was 469, a study sample
size of 235 employees was used and categorised according to the proportion of each
level in the total study population. The sample was categorised into 18 senior
managers, 42 middle managers, 118 professional employees and 57 lower-level
employees. The sample size used took into consideration the time, cost and capacity
to collect the necessary information.
3.6 METHOD OF DATA COLLECTION
The study used a self-administered questionnaire to collect data. Tustin et al.
(2005:185) describe a self-administered questionnaire as a fairly structured paper
questionnaire, which is sent to a targeted population and where a personal interview
is not required. Data collected through such written communication requires
respondents to record in writing their responses on the research questionnaire. The
purpose of this was to promote confidentiality and to encourage honesty as much as
possible. The questionnaire did not require the participants to write their names or
anything that could link them to the questionnaire which thus promoted honesty. The
questionnaire was meant to be anonymous.
The questionnaire was not mailed to the targeted population but delivered to the
offices of the sampled population as they were all in one specified building. Bernard
(2000:231) describes this as a drop-and-collect technique where a researcher leaves
a questionnaire with a respondent and then goes back later to pick it up. The office
door number was used to follow up on the submission of the questionnaire. Each
participant was requested to respond within five working days after receiving a
questionnaire and to put the questionnaire in a sealed box that was dedicated for the
completed questionnaires. This was done to promote honesty in responses as the
researcher was not able to link a response to an individual. Honesty in filling out the
questionnaire promoted accuracy and reliability of the data collected.
Lesolobe Moaisi Page 61
For data on the garnishee order, the researcher sourced data from the PERSAL
system. This was the secondary data source to investigate the objective of garnishee
orders by public servants. Secondary data is also known as historical data and is
defined as existing data that can be used in solving the research problem in question
(Saunders, Lewis & Thornhill, 1997:158). Secondary data also provided information
in terms of the extent to which public servants had been served with garnishee
orders as a result of consumer indebtedness.
3.7 STRUCTURE OF THE QUESTIONNAIRE
According to Tustin et al. (2005:387), there are four main purposes of questionnaire
design in the data collection process, namely;
- to collect relevant data;
- to make data comparable;
- minimise biases; and
- to motivate the respondent to participate in the survey.
These are the principles on which the questionnaire used in the study was based.
Bernard (2000:241) argues that the research questionnaire should be simple, clear
and unambiguous. This ensures that the respondents’ interpretations of the
questions are similar thus leading to the same results.
The questionnaire was divided into four sections (see Annexure B):
Section A: Demographics
In section A, closed-ended questions and responses were used to collect information
such as gender, age and marital status in order to be able to describe the group of
people who had completed the questionnaires. This information was also used to
classify consumer debt.
Section B: Information on personal income
In section B, four close-ended questions were used. The questions covered data
elements to determine the salary level at which the consumer was, and which had to
determine the annual income as retrieved from the PERSAL system. The questions
Lesolobe Moaisi Page 62
were also intended to determine the income levels of the public servants and their
sources of income other than their public service remuneration. This was to
determine total income from all sources.
Section C: Information on consumer debt
This section was intended to determine the different kinds of debt the consumer is
exposed to and the amount spent on these debts on a monthly basis. The
information had to assist in determining the level of indebtedness of public servants.
Section D: Personal expenditure
This section was intended to collect data on the consumables items on which
individuals spend their income on a monthly basis. This information was used to
determine the debt-to-expenditure ratio.
In order to ensure the reliability and validity of the questionnaire, pretesting was done
before the questionnaire could be used in the study. The section below discusses
how the questionnaire was piloted.
3.8 PILOTING
Welman et al. (2005:148) maintain that the purpose of a pilot study is to detect
possible flaws in the measurement procedures, to identify unclear or ambiguously
formulated items, and to notice non-verbal behaviour which may signify discomfort.
In addition, Welman and Kruger (1999:146) argue that piloting is useful if the
researcher has compiled the measuring instrument specifically for the purpose of the
research project. Furthermore, Tustin et al. (2005:413) note that piloting is essential
to ensure that data collected will be relevant and accurate, to eliminate
misinterpretations and that the respondent will participate and co-operate fully.
The researcher developed a data collection tool specific for the research which
needed to be tested before it could be applied. In this case, piloting of the
questionnaire was conducted at the sub-district office of the department of health in
Mafikeng. Fifteen questionnaires were issued and only ten questionnaires were
received back from the participants. It followed from the pilot study that respondents

Lesolobe Moaisi Page 63
understood the questions and that most of the questions could be used as
measurement units of the data collection instrument for the study. However, certain
questions such as A1 and A2 of question 12 were modified. No question was deleted
from the initial questionnaire due to the piloting exercise.
3.9 RESPONSE RATE
The response rate refers to the percentage of the total number of respondents who
complete and return the questionnaire (Tustin et al., 2005:193). Leedy and Ormrod
(2010:198) say that the best mechanism to improve response rate is the power of
persuasion entailed in the covering letter. The letter should entail the aim of the
study and the benefit the respondent could gain from the research. After piloting of
the questionnaire for the current research, it was slightly modified for use in the
study. The researcher printed 235 research questionnaires which were distributed
among employees within the provincial department of health. Only permanent
employees were targeted for the survey.
A high response rate was expected due to anonymity of the survey and because the
respondent were supposed to drop the response in a sealed box where it was
difficult to identify those who participated. Bernard (2000:249) indicates that
professionals are more likely to respond to a questionnaire which is consistent with
the study population. Each respondent was given one questionnaire and if the
respondent misplaced it, the questionnaire was not replaced.
3.10 VALIDITY
Welman and Kruger (1999:138) argue that validity is taken into account to ensure
that the instrument measures what it is supposed to measure. This is to ensure that
the instrument is relevant to what the study seeks to assess and that it is appropriate
to answer the research questions.
The first kind of validity is construct validity. Construct validity of a measuring
instrument refers to the degree to which the instrument measures the intended
construct rather than an irrelevant construct (Bernard, 2000:47). The researcher
aligned the flow of questions with the objectives of the study. The questionnaire was
Lesolobe Moaisi Page 64
also needed to be scrutinised by experts in the field of research together with a
statistician. Changes were made to structure the checklist and phrasing of questions
identified as inappropriate.
3.11 RELIABILITY
Reliability is described as the extent to which obtained scores may be generalised to
different measuring occasions, measurement/test forms and measurement/test
administrators (Welman & Kruger, 1999:143). In addition, Bernard (2000:47) defines
reliability as the degree to which an instrument measures the same way each time it
is used under the same conditions and on the same subjects. The instrument, given
the same conditions, should be able to obtain the same information whenever it is
used.
The researcher conducted pre-testing of a checklist among 15 individuals from the
Mahikeng health sub-district to measure the validity and reliability of the instrument.
This was done to assess whether the instrument would produce the same results
when it is administered and after data analysis and the extent to which the
researcher agreed on the scores for each participant, indicated reliability. In this
study, the focus was mostly on internal consistency that concerned the extent to
which items on the test or instrument were measuring the same thing (De Vos et al.,
2005:163).
The researcher tested for reliability by asking participants included in the pilot study
to write their comments on how they found answering the questionnaire on a
separate sheet of paper. The measuring instrument was pre-tested to ensure
reliability and it was also assessed by a statistician from the University of South
Africa (UNISA).
3.12 ETHICAL CONSIDERATIONS
Leedy and Ormrod (2010:101) attest that, whenever human beings or other
creatures with the potential to think, feel and experience physical or psychological
distress are the focus of the investigation, a closer look at the ethical implications of
what is being proposed is necessary. In this case, a questionnaire was used to

Lesolobe Moaisi Page 65
obtain information from human beings; therefore, there was a need to uphold a
particular standard and ethical principles. Most ethical issues in research fall in one
of the four categories: protection from harm, informed consent, right to privacy, and
honesty with professional colleagues (Leedy & Ormrod, 2010:101).
Protection from harm: The study did not contain anything that would harm the
participants physically or emotionally. Only a standard questionnaire was used to
obtain data and not any other measurement instruments.
Informed consent : Research participants should be told of the nature of the study to
be conducted and given the choice of either participating or not participating (De Vos
et al., 2005:68). A convenient method of data sampling was used to obtain
information only from those who agreed to participate. The participants were given a
covering letter which clearly explained the purpose of the study and the participants’
rights in the study.
Right to privacy : “Under no circumstances should a research report be presented in
such a way that others become aware of how a particular participants has responded
or behaved” (De Vos et al., 2005:68; Leedy & Ormrod, 2010:102). This entails
respecting all the participants. The questionnaire used in the current research, was
anonymous to enhance confidentiality and to protect all the participants of the study.
Questionnaires were only assigned codes after data collection. In this way, it was
impossible for information to be linked to a particular participant.
Honesty with professional colleagues : Even when the study is for academic
purposes, it should not misrepresent or intentionally mislead the participants about
the nature of the findings. Acknowledgement of the use of materials belonging to
other people is mandatory (Leedy & Ormrod, 2010). The researcher strived to
maintain research integrity throughout the research process and informed
participants through a covering letter about the purpose of the research.
3.13 STUDY LIMITATIONS
Lunenburg and Irby (2008:133) describe limitations of the study as factors that may
have an effect on the interpretation of the findings or on the generalisability of the
results. Researchers envisage some resistance from respondents to divulge
personal financial information accurately. However, the current research was

Lesolobe Moaisi Page 66
conducted anonymously in order to encourage honest responses from the
participants.
3.14 DATA ANALYSIS
Once data is collected, it is supposed to be analysed and interpreted in accordance
with the objectives of the study. Data analysis is a practice during which raw data is
ordered and organised so that useful information can be extracted from it (Smith,
2011). Makhubu (2010:46) argues that data analysis involves breaking up the data
into manageable themes, patterns, trends and relationships. This data is then
analysed to ensure that the primary objective of the study is achieved. In the current
study, a questionnaire was used to collect data and thus the descriptive data
analysis method was used. This technique represents the basic analysis of survey
data (Tustin et al., 2005:480). This entails the construction of tables and graphs that
show in absolute and relative terms how often the different values of the variable are
encountered in the sample (Tustin et al., 2005:523).
Inferential analysis was also be used in the study to estimate the population
parameters. Mangale (2012:49) argues that inferential statistics are concerned with
population and use sample data to draw conclusions. This implies utilising a
particular sample statistic to estimate the corresponding population parameter
(Tustin et al., 2005). The current study sought to determine the consumer debt level
of employees in the provincial department of health and therefore had to draw
inferences from the study sample.
Data was coded and analysed by computer using Microsoft Excel spreadsheets and
Excel formulas. Data is presented in graphic presentations such as bar graphs,
histograms, pie charts, etc. The researcher used the Statistical Package for Social
Sciences (SPSS) 20.0 version to analyse the data and to test statistical significance
of the results. This program was used because of the popularity of the software in
the academic field. According to Makhubu (2010:46), SPSS is a powerful tool
capable of conducting just about any type of data analysis used in social sciences,
the natural sciences and in the business world. In addition, the tool is user-friendly;
thus allowing the researcher to capture and analyse data efficiently and easily.
Lesolobe Moaisi Page 67
3.15. CONCLUSION
This chapter entailed among others the methodology and research design used in
the study.
Quantitative research methodology was used during the current research as it was
appropriate to the objectives of the study and the type of data to be collected and
analysed. A descriptive survey research design was also used in the study. The
research design addressed the following topics: population and sample frame, the
type of data and the techniques used to collect data and the manner in which data
was going to be analysed and interpreted. The method of collecting secondary data
was also discussed. Some key issues that emerged from the chapter included the
reliability and validity of the data and the ethical considerations when collecting data.
The next chapter addresses the analysis and interpretation of the data collected
through the primary data collection tool and data from the PERSAL system.
Lesolobe Moaisi Page 68
CHAPTER FOUR
ANALYSES AND INTERPRETATION OF THE RESULTS
4.1 INTRODUCTION
The previous chapter focused on the research design and methodology of the study.
In this chapter, more emphasis is placed on the implementation of Chapter three and
the interpretation of the data collected. The results of the questionnaire received
from the public servants working at the provincial office of the DoH in North West
Province were analysed and interpreted in accordance with the research objectives.
The data was analysed using Excel spreadsheets and formulas together with the
Statistical Package for the Social Sciences (SPSS). Frequency tables, pie charts,
histograms and other tools were used to analyse the data. The statistical tools were
in line with the type of data collected. Due to the number of respondents, answers on
open-ended questions that were the same or similar were grouped together.
A questionnaire was used to collect primary data from the sample of public servants
who participated in the study, while on the other hand secondary data was collected
from the PERSAL system to determine the extent of garnishee orders within the
provincial office. The questionnaire used was classified into the following sections:
Section A: Demographics
This section comprised closed-ended questions, which collected information such as
gender, age and marital status in order to be able to describe the group of people
who had completed the questionnaires.
Section B: Information on personal Income
This section comprised close-ended questions to cover data elements to determine
the salary level of consumers in order to determine the annual income as retrieved
from the PERSAL system. The section also collected data on the income levels of
the public servants and their sources of income other than their public service
remuneration.

Lesolobe Moaisi Page 69
Section C: Information on consumer debt
This section intended to collect data on the different kinds of debt the consumer is
exposed to and the amount spent on these debts on a monthly basis.
Section D: Personal expenditure
This section intended to collect data on the consumable items on which an individual
spends income on a monthly basis. The information was used to determine the debt-
to-expenditure ratio.
The sections highlighted from the questionnaire as indicated above were used to
analyse data collected.
4.2 DEMOGRAPHIC INFORMATION
The demographic profile was based on the descriptive statistics derived from the
survey. This section covered five questions which were subdivided into gender, age
group, marital status, highest education level achieved, and years of service. This
was done to ensure a deeper understanding of the sample used in the study. The
majority of respondents who participated in the study were female (66.9%) while
33.1% were male. This is indicated in Table 4.1 below and is in line with the
population of the study, which had a gender profile of 284 females and 185 males
(PERSAL system, 2011).
Table 4.1: Gender profile of participants
Gender Frequency Per cent Cumulative
percentage
Male 46 33.1 33.1
Female 93 66.9 100.0
Total 139 100.0
Looking at marital status, the study also indicated that 50% of the respondents were
single while 39% were married. Only 9% of the respondents were divorced and

Lesolobe Moaisi Page 70
those who had a life partner or were widowed contributed 1% each to the total
number of respondents.
The majority of respondents were between the ages of 26 and 30 years and formed
32% of the sample, followed by the group aged 31 to 35 years, and those between
41 and 45 years which formed 25% each of the sample. The age group below 25
years comprised only 6.5% of the participants, which represented the lowest number
of respondents. This is shown in Table 4.2 below.
Table 4.2: Age profile of participants
Frequency Per cent Cumulative
percentage
25 years and
below
9 6.5 6.5
26–30 32 23.0 29.5
31–35 25 18.0 47.5
36–40 17 12.2 59.7
41–45 25 18.0 77.7
46–50 17 12.2 89.9
Above 50 years 14 10.1 100.0
Total 139 100.0
The study also analysed the respondents’ period of employment and found that 86%
of the respondents had more than one year of service. Furthermore, 41% of the
respondents had been permanently employed for a period of between 6 and 20
years, while 18% had been employed for a period of more than 20 years. This
suggested that most of the respondents might have had an opportunity to incur debt
or might have been enticed to buy on credit because of their longer period of
permanent employment.
In order to provide appropriate technical support to health care institutions, the
department of health employs mostly tertiary qualified employees. This was reflected
by the education profile of the respondents. The majority (82%) of respondents had
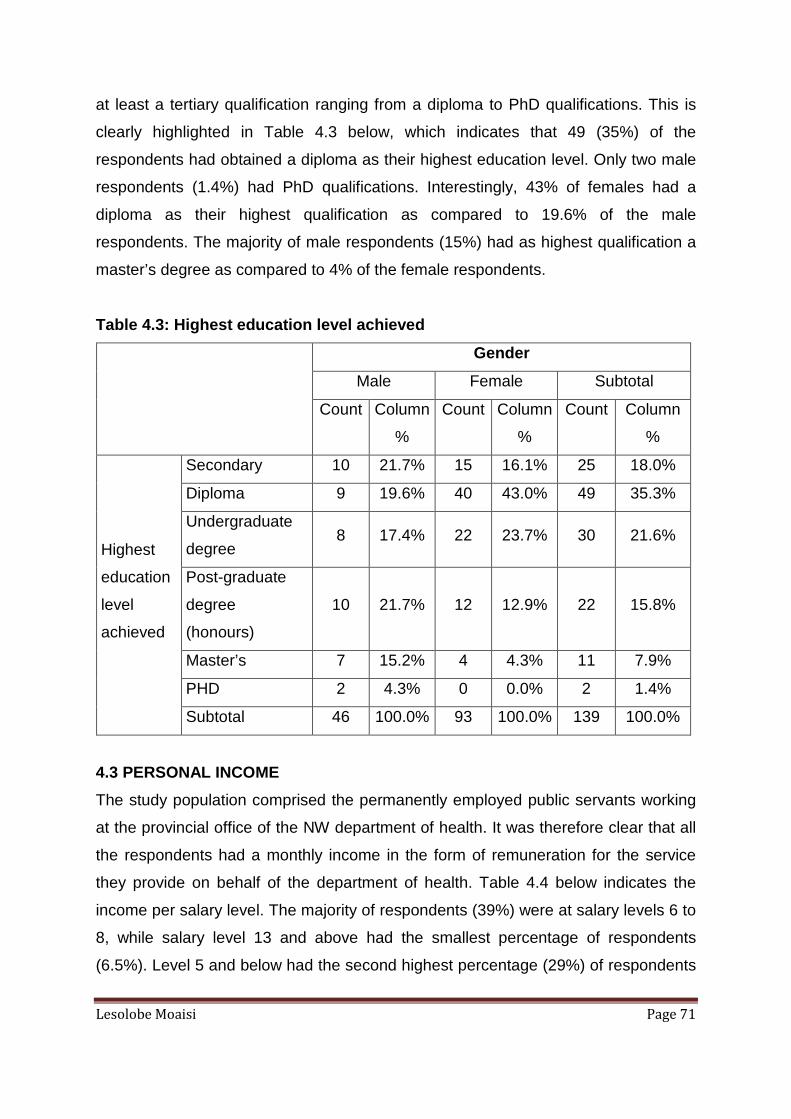
Lesolobe Moaisi Page 71
at least a tertiary qualification ranging from a diploma to PhD qualifications. This is
clearly highlighted in Table 4.3 below, which indicates that 49 (35%) of the
respondents had obtained a diploma as their highest education level. Only two male
respondents (1.4%) had PhD qualifications. Interestingly, 43% of females had a
diploma as their highest qualification as compared to 19.6% of the male
respondents. The majority of male respondents (15%) had as highest qualification a
master’s degree as compared to 4% of the female respondents.
Table 4.3: Highest education level achieved
Gender
Male Female Subtotal
Count Column
%
Count Column
%
Count Column
%
Highest
education
level
achieved
Secondary 10 21.7% 15 16.1% 25 18.0%
Diploma 9 19.6% 40 43.0% 49 35.3%
Undergraduate
degree 8 17.4% 22 23.7% 30 21.6%
Post-graduate
degree
(honours)
10 21.7% 12 12.9% 22 15.8%
Master’s 7 15.2% 4 4.3% 11 7.9%
PHD 2 4.3% 0 0.0% 2 1.4%
Subtotal 46 100.0% 93 100.0% 139 100.0%
4.3 PERSONAL INCOME
The study population comprised the permanently employed public servants working
at the provincial office of the NW department of health. It was therefore clear that all
the respondents had a monthly income in the form of remuneration for the service
they provide on behalf of the department of health. Table 4.4 below indicates the
income per salary level. The majority of respondents (39%) were at salary levels 6 to
8, while salary level 13 and above had the smallest percentage of respondents
(6.5%). Level 5 and below had the second highest percentage (29%) of respondents

Lesolobe Moaisi Page 72
in the survey. The respondents as shown in Table 4.4 reflected the demographics of
the study population as the majority of the public servants working for the provincial
office were at level 6 to 8 while senior managers who were at level 13 and above
made out the lowest number of the population (6.5%).
Table 4.4: Classification of respondents per income
Frequency Per cent Cumulative
percentage
Level 5 and below 40 28.8 28.8
Level 6–8 54 38.8 67.6
Level 9–12 36 25.9 93.5
Level 13 and
above
9 6.5 100.0
Total 139 100.0
The study assumed that the monthly income determines consumer spending
patterns as shown by Statistics South Africa (2008). The respondents’ income
variable was divided into five categories as shown in Table 4.5 below. The majority
of respondents (40%) earned an after-tax monthly income of between R5 000 and
R10 000, while surprisingly nine respondents (6.5%) earned between R15 000 and
R20 000. The reason behind the low number of respondents in this category was
unclear as the majority of employees within the provincial office ranged from salary
level 6–12, which included employees earning below R20 000. The respondents
earning between R10 000 and R15 000 was the second highest at twenty-eight per
cent. This suggested that the majority of respondents in the study were in the
middle-income group of the public service.

Lesolobe Moaisi Page 73
Table 4.5: Classification of respondents per monthl y remuneration
After-tax monthly
income Frequency Per cent
Cumulative
percentage
Less than R5 000 17 12.2 12.2
R5 001–R10 000 56 40.3 52.5
R10 001–R15 000 39 28.1 80.6
R15 001–R20 000 9 6.5 87.1
Above R20 000 18 12.9 100.0
Total 139 100.0
The respondents were not required to put the exact income they earn as a public
servant but had to indicate the range in the list indicated in the questionnaire within
which they fell. This was done to promote honesty and the response rate as personal
income is regarded as a personal matter. In order to determine the after-tax monthly
income in the study, a median of each income level category was determined. This is
demonstrated in Table 4.6 below. In this case, the median for income category less
below R5 000 was taken as R3 500, which was used to measure income for this
variable. The median income was then multiplied by the number of respondents in
each category to determine the total after-tax monthly income for that category. As
shown in Table 4.6, the total after-tax monthly income for respondents falling in the
category R5 001 to R10 000 was R420 000. The total monthly income for each
category was then added up to determine the grand total for the after-tax monthly
income of the respondents, which was R1 574 500. This represented the total
income the respondents received as public servants.

Lesolobe Moaisi Page 74
Table 4.6: Total after-tax monthly income from publ ic service
After-tax monthly
income categories
Frequency Average income
per category
Total after-tax
monthly income per
category
Below R5 000 17 R3 500.00 R59 500.00
R5 001–R10 000 56 R7 500.00 R420 000.00
R10 001–R15 000 39 R12 500.00 R487 500.00
R15 001–R20 000 9 R17 500.00 R157 500.00
Above R20 000 18 R25 000.00 R450 000.00
Total 139 R1 574 500.00
Table 4.6 indicates that the highest total for after-tax monthly income was recorded
by respondents earning income between R10 001 to R15 000. The reason behind
this high value was that 28% of respondents fell in this category. This was in line with
the findings of the Public Service Commission (2007:14), which indicated that public
servants on salary levels 6 to 8 pay the highest amount to micro-lenders. The
second highest was income level above R20 000. This was the highest-income
respondent who thus heavily influenced the total income of the category. The
respondents earning below R5 000 contributed the least value of after-tax monthly
income.
In addition to their monthly remuneration from the public service, employees
sometimes earned income from sources outside public service. Figure 4.1 below
shows that only ten of the 139 respondents (7%) had incomes outside their public
service remuneration. This could suggest that few employees conducted job
activities outside their public service function to earn income or have a source of
income from sources such as investment.

Lesolobe Moaisi Page 75
Figure 4.1: Additional monthly income from other so urces
The highest after-tax monthly income from other sources was R15 000 while the
lowest was R400. A total amount of R45 900 was earned by the respondents from
sources other than public service. The majority of the respondents (50%) mentioned
business as their source of income, while the sources of income for the other
respondents ranged from maintenance, spouse support and investment. Two
respondents did not indicate their sources of income. Four of the five respondents
earned an income above R20 000 from public service while no respondent earning
less than R5 000 had an income outside public service.
4.4 INFORMATION ON CONSUMER DEBT
It should be noted that data was collected in November 2012. This therefore implies
that the last month of payment which was used in this study was October 2012.
October 2012 was therefore used interchangeably with monthly debt payment as the
questionnaire indicates “last month debt payment”. This was done in order to relate
the analysis of the study with that which the questionnaire reflected.
The respondents were asked whether they paid debt obligations every month and
their responses are indicated in Figure 4.2. Five respondents indicated that they did
not pay monthly instalments to service debt while 134 respondents indicated that
they serviced debt monthly. This seems to suggest that the majority of respondents

Lesolobe Moaisi Page 76
were in debt (96%). The South African Reserve Bank (2002:63) defines debt as an
obligation or liability arising from borrowing money or taking goods or services “on
credit”, i.e. against an obligation to pay later.
Figure 4.2: Pay debt monthly
Although five respondents (4%) indicated to be debt-free, the analysis of monthly
payments indicated that eight respondents (6%) did not disclose their monthly debt
repayment. This could suggest that three respondents (2%) did not pay their debt
obligations monthly as per arrangement, and therefore they did not have means to
pay monthly. Only female respondents were among the eight who indicated not
paying monthly debt obligations. Five of the eight were earning between R10 001
and R15 000 while three were earning between R5 001 and R10 000.
Similarly with information on outstanding debt, ten respondents (7%) did not disclose
their outstanding debt during the period of the survey. This could mean that they
either chose not to disclose or they were completing their debt repayment instalment.
The analysis therefore indicated that there were two additional respondents in
addition to five who outright indicated to be debt-free and four who did not disclose
the monthly debt repayment, totalling ten respondents. The non-disclosure of some
respondents had been taken into consideration during the data analysis.
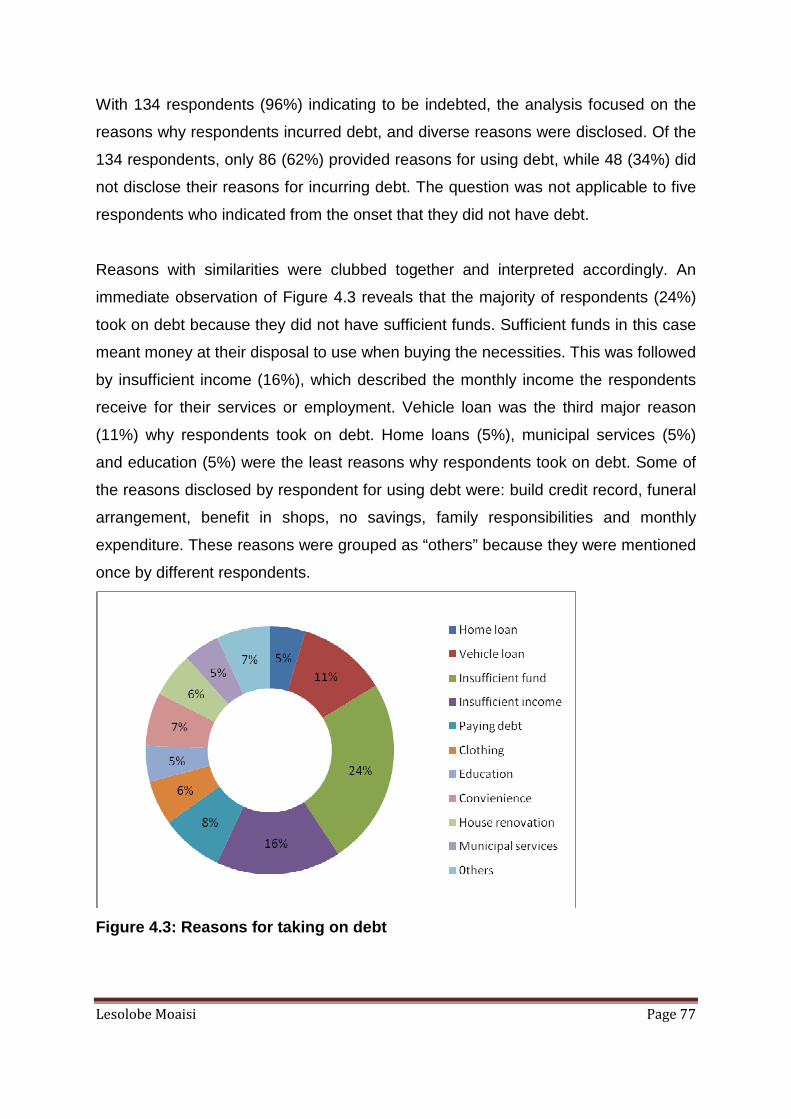
Lesolobe Moaisi Page 77
With 134 respondents (96%) indicating to be indebted, the analysis focused on the
reasons why respondents incurred debt, and diverse reasons were disclosed. Of the
134 respondents, only 86 (62%) provided reasons for using debt, while 48 (34%) did
not disclose their reasons for incurring debt. The question was not applicable to five
respondents who indicated from the onset that they did not have debt.
Reasons with similarities were clubbed together and interpreted accordingly. An
immediate observation of Figure 4.3 reveals that the majority of respondents (24%)
took on debt because they did not have sufficient funds. Sufficient funds in this case
meant money at their disposal to use when buying the necessities. This was followed
by insufficient income (16%), which described the monthly income the respondents
receive for their services or employment. Vehicle loan was the third major reason
(11%) why respondents took on debt. Home loans (5%), municipal services (5%)
and education (5%) were the least reasons why respondents took on debt. Some of
the reasons disclosed by respondent for using debt were: build credit record, funeral
arrangement, benefit in shops, no savings, family responsibilities and monthly
expenditure. These reasons were grouped as “others” because they were mentioned
once by different respondents.
Figure 4.3: Reasons for taking on debt

Lesolobe Moaisi Page 78
The results somehow contradicted findings by Hurwitz and Luiz (2007:120) and
Núñez et al. (2008:27) who argue that the reasons for borrowing among the urban
working class in South Africa are mainly for renovation of a house and funeral
arrangements. In the current study, these reasons were only mentioned once by the
respondents.
In examining the common types of debt which the respondents were exposed to,
store cards were the most common types of consumer debt to respondents. Putting
it differently, in measuring the proportion of each type of debt from twelve types
reflected in the questionnaire, store cards were the most common types of consumer
debt at 26%. This was followed by personal loans from the bank in the case of 18%
of the respondents. Loans from family members and from mashonisa (1%) were the
least consumer debts that were reported by the respondents. This is illustrated in
Figure 4.4 below. The category “others” as a type of debt in Figure 4.4 reported 7%
and covered debt that was not categorised, like municipal services and stokvel. The
study seemed to echo the National Credit Regulator (2009:3), which indicated that
the most common type of debt is store cards (35%) followed by credit cards (18%).
Figure 4.4 Percentage of types of consumer debt inc urred

Lesolobe Moaisi Page 79
Figure 4.4 also shows that vehicle loan debt is the fourth common type of debt (14%)
that was reported by the respondents. Figure 4.5 below, which indicates the value of
monthly consumer debt payment by the respondent, shows that 37% of this value is
attributed to vehicle loan debt payment. According to Nyaruwata and Leibbrandt
(2009:8), the monthly payment done by respondents is particularly useful when
attempting to determine the propensity of households to default on their debt as the
level of debt becomes unsustainable when monthly payments consume a
substantive proportion of household monthly income.
As advised by the statistician, twelve variables were used to measure consumer
indebtedness. This is shown by Table 4.7 which further explains Figure 4.4 more
closely by also indicating the number of respondents per variable on debt payment in
the last month. The table also indicates that most of the respondents pay store cards
first and then credit cards as part of monthly debt service. Vehicle loan payment
value is the highest, as shown by the mean at R2 344 and the maximum amount
paid monthly as R14 000. Payment to family members is shown as the lowest rand
mean value paid to service debt at R294. The table also indicates that the standard
deviation of vehicle loan payments to the mean is the highest among all debt
payment variables at R2 344, while study loan payment from other financial
institutions recorded the lowest deviation from the mean at R255. The wide variation
of individual respondents’ monthly debt payment might have influenced the higher
standard deviation on vehicle payment.
Table 4.7: Descriptive debt payment variables
N Mean
Standard
deviation
Mini
mum Maximum
Payment amount to bank on
study loan 5 820.20 325.369 250 1 051
Payment amount to other
institutions on study loan 9 637.33 255.092 300 1 000
Payment on personal loan
from banks 61 1 767.66 1 256.124 150 7 000
Payment on personal loan 14 1 965.36 1 479.253 200 6 000
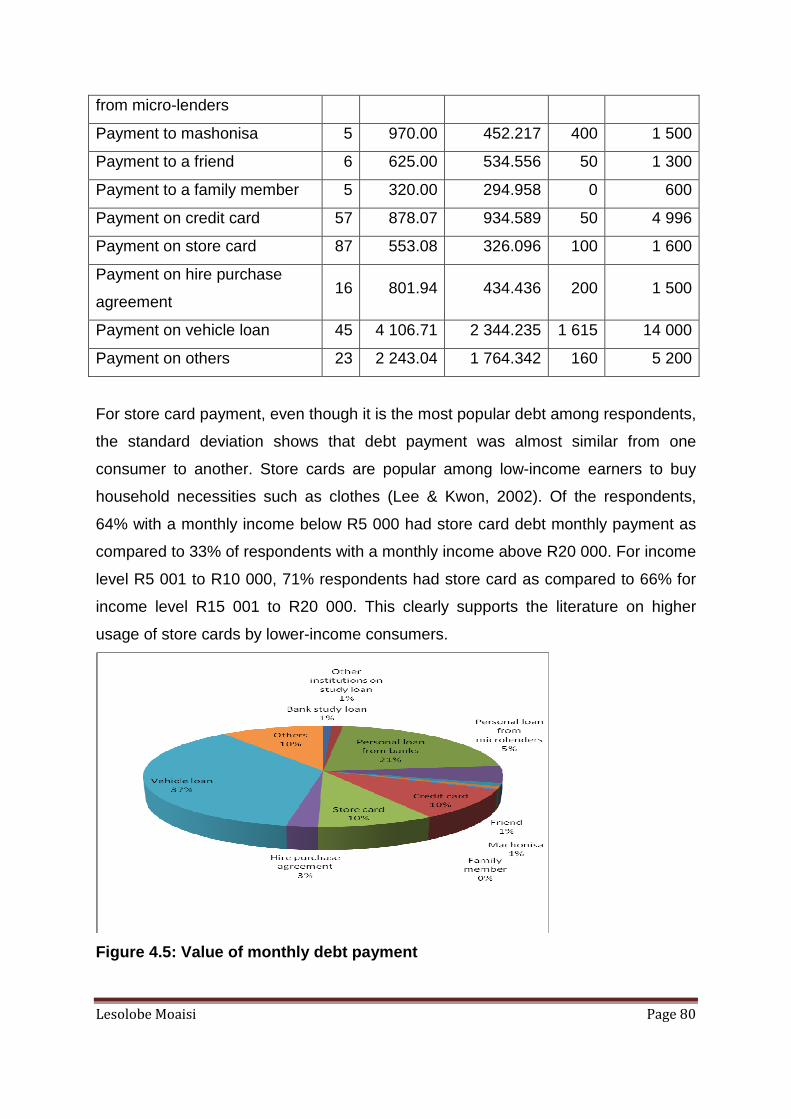
Lesolobe Moaisi Page 80
from micro-lenders
Payment to mashonisa 5 970.00 452.217 400 1 500
Payment to a friend 6 625.00 534.556 50 1 300
Payment to a family member 5 320.00 294.958 0 600
Payment on credit card 57 878.07 934.589 50 4 996
Payment on store card 87 553.08 326.096 100 1 600
Payment on hire purchase
agreement 16 801.94 434.436 200 1 500
Payment on vehicle loan 45 4 106.71 2 344.235 1 615 14 000
Payment on others 23 2 243.04 1 764.342 160 5 200
For store card payment, even though it is the most popular debt among respondents,
the standard deviation shows that debt payment was almost similar from one
consumer to another. Store cards are popular among low-income earners to buy
household necessities such as clothes (Lee & Kwon, 2002). Of the respondents,
64% with a monthly income below R5 000 had store card debt monthly payment as
compared to 33% of respondents with a monthly income above R20 000. For income
level R5 001 to R10 000, 71% respondents had store card as compared to 66% for
income level R15 001 to R20 000. This clearly supports the literature on higher
usage of store cards by lower-income consumers.
Figure 4.5: Value of monthly debt payment
Lesolobe Moaisi Page 81
The total value of vehicle monthly debt payment was R184 802.00 (37%) involving
forty-five (32%) of the 139 respondents. This was derived from the sum of all vehicle
loan monthly instalments disclosed by 32% of the respondents. None of the
respondents earning less than R5 000 per month was paying debt in terms of vehicle
loans. Personal loan from bank was the second highest value (21%) paid monthly to
service debt at R107 827.00. Personal loan is also the second most common type of
debt incurred by the respondents. Credit card repayment at R50 050.00 and store
card repayment at R48 118.00 each represented 10% of the value of the
respondents’ monthly debt payment. When comparing the findings of the current
study with those of the National Credit Regulator (2011), it was found that the motor
vehicle financing was the second highest amount paid by consumers on a monthly
basis after their mortgage bond repayment. These findings were similar to those in
this study except that the study did not include mortgage bond payment.
The total amount paid by the respondents on variable study loans to banks and other
financial institutions other than banks was R4 101 and R5 736 respectively. The two
variables represent 1% each to the total last month payment by the respondents.
Only five respondents made payments to their own bank for study loans while nine
made payments to their own study loan from institutions other than banks. The
lowest payment was made to family members at R1 600.
While in the case of the study by Hurwitz and Luiz (2007:119) almost a third of the
sample was indebted beyond 100% of the debt–income ratio, the current study
indicated that only six respondents were indebted beyond 100%. These respondents
were at the income range R15 001 to R20 000 (1 respondent) and five respondents
at income level below R5 000. Twenty respondents were indebted beyond 50%. The
majority of these respondents were in the low-income categories. This analysis
sought to demonstrate the extent of over-indebtedness among the respondents and
the burden they carry on a monthly basis which, if not managed well, could lead to
stress and other health complications to the extent that it negatively influences
productivity (Keese & Schmitz 2010:17). Even though some respondents were
severely indebted, fifty-two (37%) respondents were either not indebted or had a
debt–income ratio below 20%. This suggests that 37% of the respondents had
acceptable levels of debt (including eight debt-free respondents). When debt level
Lesolobe Moaisi Page 82
passes fifteen per cent, it will start requiring some attention (Greninger et al.,
1996:64). Only six (11%) of the 52 respondents were indebted beyond 15%.
The number of debt commitments a consumer has also indicates his or her
indebtedness. D’Alessio and Iezzi (2012:5) suggest that, if a consumer has four or
more credit commitments, it indicates over-indebtedness. The current study showed
that 22% of the respondents had four or more monthly debt commitments. Of those
who showed an indication of over-indebted, the majority (35%) earned between
R5 001 and R10 000, while very few (6%) earned between R15 001 and R20 000.
The number of respondents in the income category R15 001 to R20 000 participating
in the current survey were also fewer that most categories. This seems to suggest
that lower-income respondents are more likely to be over-indebted than high-income
respondents. As was indicated earlier, eight (5%) of the respondents did not have
any debt commitments.
The outstanding value of the consumer debt is the total value the respondents
reported to be remaining or owed on their total debt. The total outstanding amount of
consumer debt the respondents in the study indicated was R12 792 683.00. This
was the sum of all the individual respondents’ total outstanding debt value reported
in the questionnaire. The total outstanding debt on vehicle loan was R6 617 772.00,
which represented 52% of the outstanding debt followed by other debt at
R2 725 245.00 (21%) and personal loans at R1 870 109.00 (15%).
The outstanding debt on loans from a mashonisa (micro- money lender), friend or
family members were the lowest at R1 930 000.00, R155 000.00 and R600 000.00
respectively. This trend is almost similar to the one indicated in Figure 4.5 above
where the last monthly debt repayment to a mashonisa, friend or family member was
also the lowest. Figure 4.6 below indicates the outstanding value of consumer debt
as indicated by the respondents.

Lesolobe Moaisi Page 83
Figure 4.6: Outstanding value of consumer debt
The analysis reported in Figures 4.4, 4.5 and 4.6 indicated that debt on personal
loan featured prominently among the top three variables in all three figures. This
indicates the influence of personal loan debt on the total consumer debt of the
respondents. The analysis is also true for vehicle financing debt although it is not
that popular; the value of the debt takes up the biggest proportion of total consumer
debt reported by the respondents.
As indicated earlier, the income used in the analysis was the average after-tax
monthly income, which was derived from the median of the range indicated on the
questionnaire of monthly after-tax income. The respondents were categorised into
income levels as shown in Table 4.6 and Table 4.7 below. All the debt payments
done in October 2012 were added per income level to get the total sum of all the
debt instalments paid during the month. The highest total amount was recorded on
the respondents with income above R20 000, while the lowest was at the income
category of less than R5 000. The figures in the table correspond with the income
the respondent indicated.

Lesolobe Moaisi Page 84
Table 4.8: Descriptive data on consumer debt
Variables
Total last
month
payment on
consumer
debt
Mean last
month
consumer
debt
payment
Median Std
deviation
Average
total
monthly
after-tax
salary
Less than
R5 000 R40 332 R2 372 R2 100 R1 508 R59 500
R5 001–
R10 000 R129 683 R2 446 R2 008 R2 044 R420 000
R10 001–
R15 000 R119 985 R3 528 R3 500 R2 349 R487 500
R15 001–
R20 000 R69 451 R7 716 R4 601 R7 406 R157 500
Above R20 000 R143 319 R7 962 R8 150 R3 836 R450 000
Total R502 770 R1 574 500
Interestingly, as shown in Table 4.8, the mean of the debt payment shows different
results from the total debt payment. The income level above R20 000 reflected as
the highest to pay debt monthly at R143 319 when using the total last monthly
payment and the highest mean debt payment. The income level R5 001 to R10 000
had the second highest total debt payment but the second lowest mean debt
payment. This could be attributed to taking low value debt per individual while
respondents above R20 000 paid high value debt such as vehicle loan. The income
level R15 001 to R20 000 had the highest standard deviation at R7 406 as compared
to the lowest-income category of less than R5 000 at R1 508. This could imply that
the debt payment for income level R15 001 to R20 000 varies widely from one
consumer to another.
The number of respondents and the type of debt incurred under each income level
category affected the disjuncture between the total and mean debt payments
reported, i.e. two of the eight debt-free respondents earned between R5 001 and

Lesolobe Moaisi Page 85
R10 000 and only ten (18%) of the 56 respondents at this income level reported to
pay vehicle loan instalments.
Deeper analysis of debt payment per income category indicated that for income less
than R5 000, more payments were done on personal loans from banks at R14 756,
while there were no debt payments on vehicle loans and study loans from other
payments. Credit card payment had the highest mean and, as shown by the
standard deviation, there is a wider variation of credit card payment than any other
debt variables at this income level.
Income level R5 000 to R10 000 also indicated similar trends with income level less
than R5 000 having the highest total debt payment, namely the personal debt from
the bank at R39 274. In this category, total payment on vehicle loan was however
the second highest at R27 418 while payment on bank study loan was the lowest
total debt payment at R900. Payments by individual respondents varied more in the
variable payment to other loans than any other debt variable.
When focusing on income level R10 001 to R15 000, payment to vehicle loan
dominates all other variables at total payment of R51 534 followed by a personal
loan from a bank at R25 297. No debt payments were recorded for mashonisa and
family members. Debt payments for vehicle loans varied greatly from one consumer
to another at R1 944 than any other variable used in the study. Similar trends were
found for income level R15 001 to R20 000, where debt payment in terms of vehicle
loans was the highest at R32 150, followed by personal loans from the bank at
R11 400.
None of the respondents in income level above R20 000 indicated paying debt in
terms of the following variables: study loan from the bank, study loan from other
financial institutions, friend, mashonisa, family member and hire purchase
agreement. In this category, total debt payment to vehicle loan was the highest at
R73 700 followed by debt to others at R31 900. Mean payment of vehicle loans was
the highest at R5 254 also with the highest standard deviation of R1 640.

Lesolobe Moaisi Page 86
As indicated in Figure 4.4, the four most common types of debt paid by the
respondents were store cards, personal loans from banks, credit card repayments
and vehicle loans. In the same breath, the same variables contribute the highest
value of payment as shown in Figure 4.5. It is against the above background that
Table 4.9 reports on an attempt to isolate the four variables in order to analyse them
in more detail. The table indicates that the higher the income, the higher the debt
payment on vehicle loans. This is shown by the mean, median and the total debt
payments. The mean store card payment for all variables were the lowest and
ranged from R408 for income level R15 001–R20 000 and R587 for R10 001–
R15 000 as the highest. Interestingly, consumers at income level below R5 000 had
mean credit card debt of R2 382, which is higher than that for consumers earning
above R20 000, namely R1 030. It however needs to be noted that only three
respondents earning less than R5 000 pay credit card debt while 12 consumers
earning above R20 000 pay this type of debt.

Lesolobe Moaisi Page 87
Table 4.9: Four most common consumer debt variables
Sum Mean
Std
deviation
Media
n
Less than R5 000
Payment on personal loan from bank R14 756 1 475 473 1 331
Payment on credit card R7 146 2 382 2 303 1 500
Payment on store card R5 430 452 278 400
Payment on vehicle loan
R5 001–R10 000
Payment on personal loan from bank R39 274 1 510 827 1 450
Payment on credit card R13 648 758 786 500
Payment on store card R22 788 584 320 500
Payment on vehicle loan R27 418 2 741 924 2 500
R10 001–R15 000
Payment on personal loan from bank R25 297 1 806 1 543 1 085
Payment on credit card R11 186 588 651 480
Payment on store card R14 100 587 407 475
Payment on vehicle loan R51 534 3 435 1 944 3 000
R15 001–R20 000
Payment on personal loan from bank R11 400 3 800 2 884 3 000
Payment on credit card R5 700 1 140 1 059 700
Payment on store card R2 450 408 201 350
Payment on vehicle loan R32 150 5 358 4 304 4 050
Above R20 000
Payment on personal loan from bank R17 100 2 137 1 300 1 550
Payment on credit card R12 370 1 030 761 850
Payment on store card R3 350 558 91 500
Payment on vehicle loan R73 700 5 264 1 640 5 000
Tables 4.10 and 11 indicate debt payment by gender. The study shows that males
are more indebted than females and they also pay bigger amounts to service their
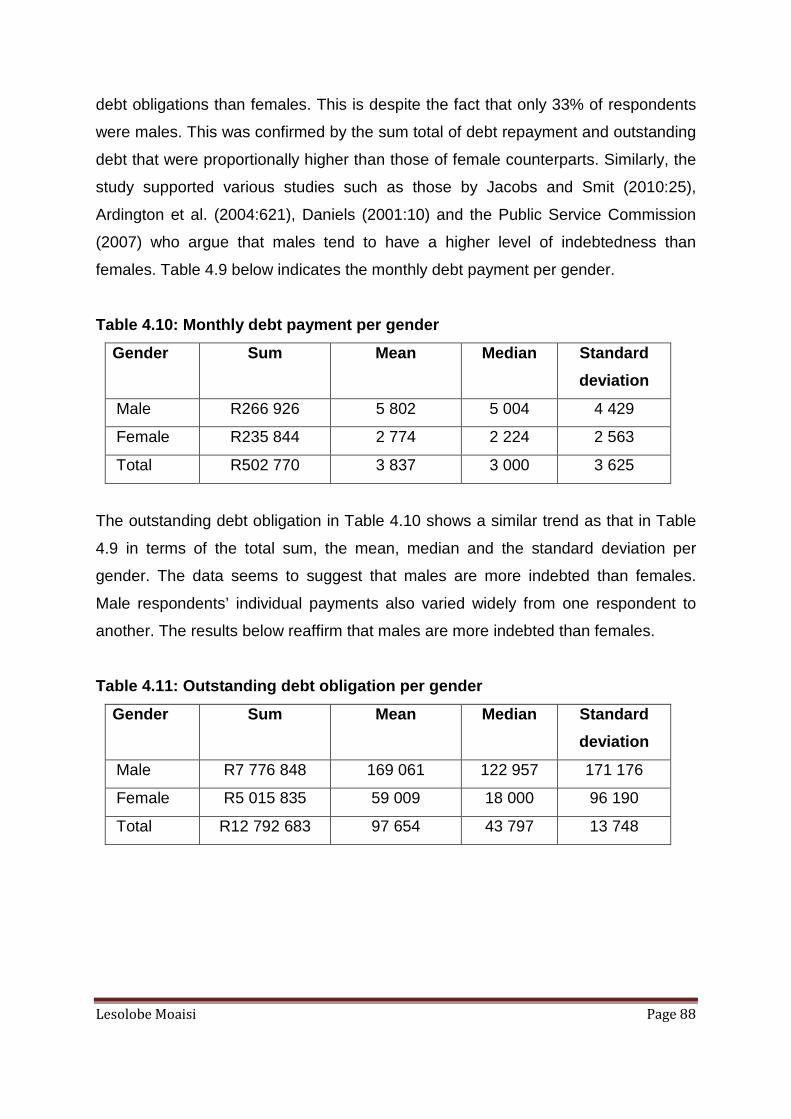
Lesolobe Moaisi Page 88
debt obligations than females. This is despite the fact that only 33% of respondents
were males. This was confirmed by the sum total of debt repayment and outstanding
debt that were proportionally higher than those of female counterparts. Similarly, the
study supported various studies such as those by Jacobs and Smit (2010:25),
Ardington et al. (2004:621), Daniels (2001:10) and the Public Service Commission
(2007) who argue that males tend to have a higher level of indebtedness than
females. Table 4.9 below indicates the monthly debt payment per gender.
Table 4.10: Monthly debt payment per gender
Gender Sum Mean Median Standard
deviation
Male R266 926 5 802 5 004 4 429
Female R235 844 2 774 2 224 2 563
Total R502 770 3 837 3 000 3 625
The outstanding debt obligation in Table 4.10 shows a similar trend as that in Table
4.9 in terms of the total sum, the mean, median and the standard deviation per
gender. The data seems to suggest that males are more indebted than females.
Male respondents’ individual payments also varied widely from one respondent to
another. The results below reaffirm that males are more indebted than females.
Table 4.11: Outstanding debt obligation per gender
Gender Sum Mean Median Standard
deviation
Male R7 776 848 169 061 122 957 171 176
Female R5 015 835 59 009 18 000 96 190
Total R12 792 683 97 654 43 797 13 748

Lesolobe Moaisi Page 89
4.5 AFTER-TAX MONTHLY INCOME LAST MONTH DEBT PAYMEN T RATIO
(DEBT–INCOME RATIO)
As shown in Table 4.6, the mean total after-tax monthly salaries were determined by
adding the range of the salary income variables and using its median, i.e. the income
used for income level R5 001 to R10 000 was R7 500.
In determining the debt–income ratio of the two categories, total monthly debt
payment and total average after-tax monthly salary indicated by the respondents
were used. Their calculations are highlighted as income reflected in Table 4.6 and
Figure 4.5 for debt payment. The debt–income ratio was calculated as indicated in
Table 4.11 below. The respondents with income less than R5 000 were shown to
have a debt–income ratio of 68%, which is the highest among all four categories.
The reasons could be low total after-tax monthly income among the four categories
in Table 4.6. The results in Table 4.11 seem to suggest that the respondents earning
less than R5 000 were highly indebted.
The respondents earning between R15 001 to R20 000 had the second highest
debt–income ratio at 44%. The respondents with income between R10 001 and
R15 000 had the lowest debt ratio at 25%. This could be due to highest total monthly
after-tax income attributed to this category. Five of the debt-free respondents also
fell within this category.

Lesolobe Moaisi Page 90
Table 4.12: Debt –income ratio per salary level
Variables
Total last
month
payment on
consumer debt
Average total
after-tax
monthly salary
Total last month
debt/total after-tax
monthly salary income
(debt –income ratio)
Less than R5 000 R40 332.00 R59 500.00 68%
R5 001–R10 000 R129 683.00 R420 000.00 31%
R10 001–R15 000 R119 985.00 R487 500.00 25%
R15 001–R20 000 R69 451.00 R157 500.00 44%
Above R20 000 R143 319.00 R450 000.00 32%
Total R502 770.00 R1 574 500.00 32%
The debt-income ratio is also reflected clearly in Figure 4.7 below where the graph
reflects a decrease in debt ratio as the income increases. Although there is an
increase at the monthly income category of R15 001 to R20 000, the overall trend
suggests a decline as income increases. The possible high debt ratio at the lower
level was highlighted by Mashigo (2006), who indicated that the debt spiral is mostly
prevalent among poor households.
Even though statisticians prefer mean debt payment to total debt payment when
calculating the debt–income ratio, some studies, such as Daniel (2001), also used
the total debt–income ratio to analyse the level of consumer indebtedness. Figure
4.8 below indicates that there were no major differences between mean debt–
income ratio and the total debt–income ratio and thus the study conservatively used
total debt to income ratio in the analysis. The highest debt–income ratio was found
for the respondents earning below R5 000 per month for both the mean and total
debt, while income level R10 001 to R15 000 was the lowest in both the mean and
total payment method of calculation. It should therefore not matter which method
was used between mean debt and total debt to calculate the debt–income ratio.

Lesolobe Moaisi Page 91
68%
31%25%
44%
68%
32%28%
44%
34%32%
0%
10%
20%
30%
40%
50%
60%
70%
80%
Less than R
5000
R 5001 - R10
000
R10 001 -
R15 000
R15 001 -
R20 000
Above R 20
000
Total debt
Income ratio
Mean debt
Income ratio
Figure 4.7: Comparing total debt-income ratio and t he mean ratio
As shown in Table 4.11, the aggregate total debt–income ratio of all the income
categories was at 32%. This is slightly less than the non-mortgage debt of 37%
indicated by the South African Reserve Bank (2012:70). The figures are above the
25% threshold indicated by the Bureau of Market Research (2009:6), which define
over‐indebtedness as consumers are spending more than 25% of their gross
monthly income on unsecured repayments and above 20% non-mortgage debt
payments to after-tax income. This debt–income ratio was supported by Greninger et
al. (1996:64) who used the non-mortgage debt payments to after-tax income, which
indicates the danger point of over-indebtedness when the ratio is above 20% of total
debt payments on after-tax income. The debt under the study was only consumer
debt and thus excluded mortgage debt. The 20% non-mortgage debt payment on
after-tax income was therefore applicable.

Lesolobe Moaisi Page 92
Figure 4.8: Proportion of indebted respondent by mo nthly after-tax income
4.6 PERSONAL EXPENDITURE
The monthly personal expenditure was measured using seventeen variables. All 139
respondents indicated monthly expenditure on two or more variables in the
questionnaire. A total amount of R802 571 expenditure on all variables was reported
by the respondents. Expenses on food items were recorded the highest at
R190 000 00 per month, which was equivalent to 24% of the total monthly
expenditure. This was followed by housing at 17%. Housing debt includes renting
and other payment such as renovation and home payments.
The lowest expenditure was on tobacco at R281 000. This represents expenses by
only five of the 139 respondents on this variable. Interestingly, the total expenditure
on reading material was the second lowest at R626 500. Figure 4.9 below indicates
the percentage of total monthly expenditure by variables.

Lesolobe Moaisi Page 93
Figure 4.9: Rand value of monthly personal expendit ure
The total monthly expenditure reported in the study was 37% higher than the total
debt paid in the previous month. This is shown by values in Figure 4.10 below. The
figure also indicates that 51% of the income was spent on monthly expenditure. As
shown in Table 4.8, 32% of the income was spent on servicing consumer debt. It
therefore implies that respondents spent 83% of their income every month to service
monthly expenses and debt obligations. Nyaruwata, G. (2009:5) mentions that one of
the over-indebtedness indicators is found where a consumer has a total combined
debt servicing and basic expenditure ratio of 70% or more of his or her disposable
income. The remaining amount (30%) is probably spent on mortgage debt, savings,
insurance, funeral covers and other commitments.

Lesolobe Moaisi Page 94
Figure 4.10: Total monthly debt payment to personal expenditure
4.7 GARNISHEE ORDER
Secondary data on garnishee orders was collected from the PERSAL system as
reflected for November 2012. Raw data was exported from the system and analysed
accordingly to try to reach the objective of the study. The aim was to determine the
number of department of health employees working at the provincial office who had
either garnishee or emolument orders; thus having court orders to pay the debt
obligation.
As explained in Chapter 2, the term “garnishee order” can be used interchangeably
with “emolument attachment order” (Public service commission, 2007) and it is
issued when a consumer defaults from paying the debt obligation. The Public
Service Commission (2007:IV) defines the garnishee order as “Court order for
collecting a civil judgment”. FIHRST Management Services (2010:7) elaborates on
this definition of a garnishee order by explaining it as debt enforcement proceedings
in terms of which the employee agrees to repay the amount of credit extended by the
credit provider, together with interest, costs and fees, in instalments over a period of
time, as well as the process to be followed where the employee has not met the
commitments in terms of the agreement.

Lesolobe Moaisi Page 95
The data from the PERSAL system indicated that sixty-two employees working at the
provincial office of the department of health had monthly deductions from their
salaries to pay their debt. This was out of the total of 469 permanently employed
employees. It could be argued therefore that 13% of the permanently employed staff
at the provincial health department in North West Province had been served with
judgement orders to pay their debt and thus could be over-indebted. This is almost
similar to the Consumer Credit Market report of the NCR (2012), which indicates that
13.9% of consumers have judgements or administrative orders against them.
The report indicates a lesser degree of cases of judgement orders than those
reflected by literature. The University of Pretoria Law Clinic (2008:4) contends that
there is an increase in the number of impaired credit records in South Africa as
37.7% of consumers have impaired credit records. The Public Service Commission
(2007:xi) indicates that 20% of public servants have garnishee orders served against
them. Even though the survey report indicates a smaller number of respondents with
garnishee orders, it is still a matter of concern.
Figure 4.11: Number of employees with garnishee ord ers per gender

Lesolobe Moaisi Page 96
Looking at garnishee order per salary level, the study found that more respondents
at salary levels 6 to 8 have garnishee orders issued to them. This is in line with the
Public Service Commission (2007:27), which highlighted that public servants on
salary levels 6 to 8 account for large number of payments towards garnishee debt.
This is supported by the fact that 118 employees (25%) on the provincial office’s
paying roll fall in this salary level range. The number of employees above level 13
was found to be the lowest with garnishee order, at less than 1%, which is also
consistent with the Public Service Commission (2007:28). This could indicate that
respondents at this salary level have enough monthly income to cover their monthly
debt obligations without persuasion by court order. Figure 4.12 below indicates the
number of garnishee orders per salary level.
Figure 4.12: Number of garnishee orders per salary level
4.8 CONCLUSION
This chapter covered the demographic information which highlighted that most of the
respondents (67%) were female. The respondent demographic information reflected
the population, which implied that quota sampling was successful to ensure
coverage of the whole spectrum of employees of the department of health at the
provincial office.

Lesolobe Moaisi Page 97
All the respondents (100%) had monthly income as intended by the survey and were
permanently employed by the health department. Most of the respondents (93%)
relied on the remuneration they received from the public service as their only
income. The survey also suggested that most of the respondents (96%) were
indebted and that consumer debt ranged from 25% for respondents earning income
between R10 001 and R15 000 while 68% for income below R5 000. The majority of
respondents (24%) used debt to cover for a lack of funds at their disposal while
shopping and when they have to resort to debt in order to augment what they have.
Consumers are unable to buy their necessities by paying cash and thus resort to
instalments which cause them to incur debt. Most respondents (26%) had store card
as a source of debt and paid the bulk of their monthly debt payment (47%) as vehicle
financing. The study also indicated that 32% of income was spent on servicing debt.
The monthly expenditure plays an important role in determining whether consumers
will be able to pay their debt obligation. The study found that 51% of the monthly
income was spent on the monthly expenditure such as personal necessities like
food, clothing, communication and others described in Figure 4.9. This could make it
difficult for consumers to cover other necessities like mortgage bonds, insurance,
health care, savings and investment, which were not covered by the study.
With all this expenses that the consumer have to incur, it sometimes becomes
difficult to meet the debt obligation. This prompts legal action by creditors to ensure
that they get what is due to them. The consumer ends up having a garnishee order
or emolument order against him or her for debt he or she could not service. As a
result, consumers have to be forced to settle debt, which could likely result in
another debt being incurred to cover the monthly shortage. It is therefore crucial that
consumers be aware of their debt status and when to stop incurring more debt.
Financial education and awareness of organisations that support consumers in debt
is important to manage financial problems. It is against this background that the next
chapter discusses some of the available and prominent institutions that can assist
consumers in debt. These institutions were established to harmonise the relationship
between a consumer and service/product provider and to empower consumers with
the necessary skills and knowledge of making an informed choice.

Lesolobe Moaisi Page 98
CHAPTER FIVE
PERSONAL FINANCIAL MANAGEMENT SERVICES IN SOUTH AFR ICA
5.1 INTRODUCTION
In response to the adverse effects which personal financial problems have on
consumers, employers and society in general, different intervention measures have
been devised and enforced in South Africa. These interventions could be enacted
either by government, the private sector or civil society groups. Crous (2008:4)
classifies these measures under regulatory, informative/educational and voluntary
approaches which, in turn, could target the reckless behaviour of the consumer or
marketer.
The aim of this chapter therefore is to provide the consumer and the employer with
information on different organisations and institutions across the country that could
assist in managing indebtedness. It also provides consumers with information about
regulatory organisations, especially government-initiated bodies that protect
consumers against credit-related industry players such as credit providers, credit
bureaux, debt counsellors and credit reviews.
The section also provides a consumer with information regarding possible financial
services organisation (NGOs) that provide information and guidance in terms of
financial literacy and personal financial management. The section below highlights
what literature emphasises on financial literacy.
5.2 FINANCIAL LITERACY PROGRAMMES
It has been implied (Oseifuah 2010:168) that, despite initiatives by government, the
financial industry, non-profit organisations, the housing sector, and private
companies to improve financial literacy, South Africans remain underserviced by
programmes offering financial education. Oseifuah (2010) also indicates that there is
a high level of confusion about financial matters, even among fully banked

Lesolobe Moaisi Page 99
individuals. This high level of confusion is an indication that there are still problems
with financial capacity building and that there is a need to provide more financial
literacy programmes in the working environment.
The aim of any financial literacy programme for adults should be to enable them,
individually and collectively, to understand and to question the way in which financial
institutions, government and personal and household decision-making connect to
shape numerous aspects of adults’ daily lives (Bond, 2000:72). Bond (2000) further
highlights that consumer education seems to improve the basic financial skills
required to raise awareness and understanding, which will lead to improved financial
decisions. Streeter (2003:4) views financial education as crucial in improving both
personal savings and more effective credit use.
Poor financial behaviours negatively impact both families and employers. Garman et
al. (1996:159) highlight the cost incurred by the employer, which results from poor
financial behaviour, including:
• absenteeism
• tardiness
• fighting with co-workers and supervisors
• sabotaging the work of co-workers
• job stress
• reduced employee productivity
• lowered employee morale
• loss of customers who seek better service
• loss of revenue from sales not made
• accidents and increased risk-taking
• disability and worker compensation claims
• substance abuse
• suicide and murder
• increased use of available health care resources by employee and relatives
• thefts from employers
• loss of security clearance
Lesolobe Moaisi Page 100
• lack of employee focus on the strategic goals of the employer
• greater use of employee assistance programme services, including those for
spouse and child abuse
• employer time to deal with poor financial behaviours of employees
• loss of trained personnel (both for workday losses due to temporary suspension
from duties as well as for termination of employment).
Some of the above factors are synonymous with the disciplinary cases indicated in
the North West department of health annual report (2012:137). This clearly indicates
the need for the department to instil intervention strategies that can curb the
problem. Even though no research has so far been conducted to relate these
misconducts to poor financial behaviour in the department, there is a need to ensure
that departmental employees acquire knowledge on personal financial management.
Research gives the impression that financial illiteracy can only be overcome when
implementing financial education programmes for all gender, age, income and
educational groups. Furthermore, Lorgat (2003:8) suggests that South African
individuals need financial education in the workplace to increase their financial
wellbeing. Joo (1998:284) supports this with his extensive research into workplace
financial education combined with financial counselling sessions. Joo (1998) also
indicates that financial counselling improves attitudes and behaviours related to
personal finances, which in turn leads to positive personal financial outcomes and an
improvement in overall financial wellbeing.
It is for these reasons that some of the organisations and institutions that provide
financial literacy and awareness on consumer rights in South Africa are briefly
discussed in this chapter. Some of the institutions have been created by law to
protect consumers and regulate financial services in the country. These financial
education and awareness suppliers are categorised into regulators, non-commercial
institutions, government departments, private institutions and education and training
institutions.
Lesolobe Moaisi Page 101
5.3 REGULATORS
Regulators in this case are institutions established by government to regulate the
financial services environment in the country. Some of the regulatory bodies more
important to consumer interest are discussed below:
5.3.1 National Credit Regulator (NCR)
The NCR was established by government to regulate the credit industry in South
Africa. The NCR is possibly the biggest public entity established under the National
Credit Act 34 of 2005 to ensure fair and adjust relations between the credit players
within the industry (De Villiers, 2010:1). It is tasked with carrying out education,
research, policy development, investigation of complaints, and ensuring the
enforcement of the National Credit Act (34 of 2005).
The NCR is also tasked with the registration of credit providers, credit bureaux and
debt counsellors and with the enforcement of compliance with the National Credit
Act.
The following services provided by the NCR, specifically for consumers, are briefly
discussed below:
1. Consumer education
The NCR provides the consumer with useful information such as about their rights
and consumer tips and they also provide the platform for consumers to challenge
their credit record. In addition, the NCR facilitates workshops for organisations
and entities at no cost as long as consumers would benefit from such activity.
Items covered by the workshop include debt management and other related topics
on personal financial management.
2. Provides database for debt councillor
The NCR describes a debt counsellor as someone who is registered with the
National Credit Regulator to assist consumers who are experiencing debt-related
problems and who are having difficulty making their current monthly payments by
providing them with the following services:
• budget advice;
Lesolobe Moaisi Page 102
• restructuring of consumer’s payments;
• negotiations with credit providers on behalf of a consumer;
• monitoring consumers’ payments; and
• after-care services.
According to the NCR database (National Credit Regulator, 2013), there are only
seven debt councillors in Mahikeng registered with the NCR. Consumers are
encouraged to use the accredited debt councillors by the NCR and can access the
list on the NCR website.
3. Provide consumer with database for credit provid ers
There are clear criteria for a credit provider to register with NCR and these are
stipulated in the National Credit Act 34 of 2005 (NCA). Consumers are supposed
to check with the NCR before they utilise the service of a particular credit provider.
The NCR database indicates that there are only fourteen registered credit
providers in Mahikeng (National Credit Regulator, 2013). These are the credit
providers a consumer could consult around Mahikeng when in need of micro-
financing. A consumer could also lodge a complaint against either one of the
registered credit providers if the consumer feels that he/she was unlawfully
treated.
4. Monitor credit issuing through credit bureaux
The National Credit Act 34 of 2005 defines a credit bureau as a person/body
whom a person engages for payment in the business of receiving reports on or
investigating credit applications, credit agreements, payment history or patterns
and/or consumer credit information. Credit bureaux monitor credit issuing and
keep record of credit ratings of consumers. In addition, the Act stipulates the rights
which consumers have with respect to accessing their own information, and also
play a pivotal role in the dispute-resolution process concerning the access to
credit information. The NCR database indicates that there are no registered credit
bureaux in Mahikeng; however, there are about twelve credit bureaux throughout
the country registered with the NCR and in the database (National Credit
Lesolobe Moaisi Page 103
Regulator, 2013). The nearest credit bureau is either in Pretoria or Johannesburg.
The consumer can access his or her credit information for free at least once a
year, thereafter he or she will be charged.
5.3.2 Credit Ombud
According to the Credit Ombud (2013), the Office of the Credit Ombud resolves
complaints from consumers and businesses that are negatively impacted by credit
bureau information or when a consumer has a dispute with a credit provider, debt
counsellor or payment distribution agent or credit bureau. This section will lean
towards the work of the Ombud relating to consumers.
From the consumer’s perspective, the National Credit Act 34 of 2005 indicates that
the credit ombud can only accept a complaint if the consumer has first lodged it with
the relevant credit provider and did not get a satisfactory response. Three different
types of complaints the Credit Ombud can resolve are:
− Credit bureau complaints
The National Credit Act 34 of 2005 stipulates that a consumer may have a complaint
about the credit bureau listing if, for instance, the application for credit is negatively
affected due to incorrect or unfair credit information listed on the consumer’s credit
profile. The consumer can also obtain a free copy of the credit bureau record
annually from anyone of the registered credit bureaux in the country.
− Credit agreement complaint
The NCA further stipulates that a consumer may have a complaint about one of the
non-bank credit providers such as micro-lenders, clothing and/or furniture stores in
terms of credit and certain motor insurance agreements. The complaint may further
relate to a wide range of issues, such as:
• incorrect balance;
• incorrect interest or fees being charged;
• a dispute about the terms of the agreement;

Lesolobe Moaisi Page 104
• issues relating to collection of an outstanding debt; and
• cancellation of the agreement or a breach of the terms of the agreement by one of
the parties.
− Debt counselling complaints
The complaint may be against the debt counsellor, the way in which monies are
distributed by the payment distribution agent, or the way in which the credit providers
– including the banks – are handling the agreement. A complaint could be lodged
with any one of the associations which are obliged to investigate complaints
involving debt counselling (e.g. National Debt Mediation Association, Debt
Counselling Association of South Africa and Payment Distribution Association of
South Africa).
In all types of complaints it is important for the consumer to first lodge a complaint
with the relevant body, give them sufficient time to respond (the NCA say 20 working
days) and if the consumer is not satisfied with the response, the consumer can then
lodge a complaint with the Credit Ombud.
The Credit Ombud is also able to provide capacity building workshops or
presentations to any meeting they are invited to. In this case, the department of
health could invite the Ombud to any meeting that could ensure that the employees
are enlightened about the service offered and knowledge on their rights as
consumers.
5.3.3 National Consumer Tribunal
The National Consumer Tribunal (NCT) is an independent body also established in
terms of the National Credit Act, whose aim is to achieve fairness and justice for
everyone in the consumer and credit market (National Consumer Tribunal, 2013).
The NCT achieves its aim by fairly and independently adjudicating on disputes about
consumer credit. The NCT hears all sides of an argument before making a decision.
The NCT website (2013) indicates that a decision made by the Tribunal has the
same status as one made by the High Court of South Africa. The NCT’s mandate
includes reviewing decisions made by the National Credit Regulator.
Lesolobe Moaisi Page 105
A credit provider and/or consumer may approach the NCT directly only once the
parties have attempted but failed to resolve the matters between themselves or
through alternative dispute resolution where the parties failed to resolve the matters
between themselves. If this fails the consumer must refer the matter to the consumer
court or alternative dispute resolution agent. In terms of the NCA, a consumer may
apply for various orders, including an order:
• to compel a credit provider to produce a statement of account;
• for a credit provider to compensate a consumer after the sale of surrendered
goods;
• for a pawnbroker to compensate a consumer for goods left with a pawnbroker;
• to review the sale of goods; and
• to review the decision of a debt counsellor not to issue a clearance certificate.
5.3.4 Micro Finance Regulatory Council (MFRC)
The MFRC is a non-profit organisation carrying out delegated regulatory functions on
micro-lenders, particularly to protect consumers against high interest rates
(Meagher. 2005:3). The key elements of MFRC’s mandate boil down to:
• formalise the micro-lending sector;
• provide consumer protection; and
• improve information and understanding.
I. Consumer protection
The MFRC provides a platform for complaints resolution and a mechanism for
borrowers to seek help. The MFRC also brings specialised resources to bear on the
enforcement of consumer protection. Other consumer protection concerns include
high rates, disclosure, abuses by agents and brokers, and reckless lending. More
recently, the MFRC has focused a great deal to prevent over-indebtedness and
reckless lending (Meagher, 2005:4).

Lesolobe Moaisi Page 106
II. Information
The MFRC’s information role addresses both the financial literacy of consumers and
policy-relevant knowledge of the micro-finance sector. With respect to financial
literacy, this has long been recognised as a major problem in poor households and
communities (Mashigo, 2006). The MFRC uses various financial education initiatives
such as multimedia campaigns aimed at informing consumers on their rights when
borrowing money, the role of the MFRC in the protection of borrower rights, and
prudent financial management. The council also provides training of educators and
advisors of intermediary organisations, which run educational programmes amongst
employees and in communities. It also has debt relief programmes aimed at
establishing a network of debt and financial counsellors and mediators across the
country.
5.4 NON-COMMERCIAL SECTOR
There are other service providers such as the NGOs, trade unions, funding agencies
and government departments who also empower consumers to make informed
decisions on personal financial matters, especially regarding debt management.
These sector provide educational workshops, financial literacy campaigns and
provide promotional materials such as booklets, pamphlets and leaflets. In some
cases, they buy a slot on the radio to ensure that personal financial management
education issues reach the majority of consumers. The following are some of the
organisations in this field and the ways they can assist consumers.
5.4.1 National Consumer Forum (NCF)
The National Consumer Forum is an independent, non-partisan and non-profit
organisation whose aim is to work for a fair, just and safe marketplace for all
consumers in the country and to empower the previously disadvantaged
communities (National Consumer Forum, 2013). It strives to ensure that:
• all consumers enjoy the benefits of a competitive and efficient economy;
• all consumers have a choice of quality and affordable services from the
private and public sector:
• consumers’ rights are respected by all;
Lesolobe Moaisi Page 107
• all consumers are knowledgeable; and
• previously disadvantaged consumers are empowered to play a meaningful
role in economy of the country.
The NCF, in partnership with the National Credit Regulator, the South African
Bureau of Standards and Metropolitan Life, is embarking on a programme of town
meetings to empower consumers who live in disadvantaged areas. The aim of these
monthly town meetings is to hear from the public about their challenges and
problems as consumers of products and services from government and business.
Among others, the focus of these town meetings is on –
• access to financial services;
• quality of products and services; and
• education of consumers regarding their rights and responsibilities.
The department, through its wellness unit, can enquire with NCF when they intend to
visit towns around the province. The schedule could be familiarised with employees
in the department so that they are afforded an opportunity to attend such meetings.
In this way, employees can improve their knowledge on consumer rights.
The NCF also have online consumer education programmes to provide valuable
knowledge that can empower consumers. In the financial services module, the
following topics are covered.
• Managing a family budget : This section of the website aims to provide some
advice on how to manage, plan and control a budget.
• Running a bank account: The section provides information and advice on a
number of issues linked to running a bank account, such as opening and closing-
down procedures, monthly statements, overdrafts, cheque clearings, etc. This
section of the website helps consumers to understand the detail behind their bank
accounts.
• Means of payment : The section looks at different types of payment, including
cash, bank cards, cheques, E-money and direct debit. Although these means of
payment sound familiar, very little is known about their rules, regulations and
risks. Although bank cards, cheques and cash are the most widely used means of
payment, there are other ways the consumers can pay for goods and services,
which are also considered in this section.

Lesolobe Moaisi Page 108
• Consumer credit: This section will help consumers to understand factors to
consider when taking out loan, cost of loans, where to get loans, which type of
loan is most appropriate, and how to pay back loans.
• Savings and investments : This section entails different issues on investment
such as whether to invest in a savings account, bonds, shares or a life insurance
policy. This section of the website allows the consumer to consider the options
available, so that the consumer can make the best choice based on the personal
means.
5.4.2 South African Savings Institute (SASI)
The South African Savings Institute is an independent non-profit organisation
dedicated to developing a robust culture of saving in South Africa. On their website
(2013), the institute indicates the following objectives with regard to education
campaigns:
• raising awareness about and inculcating a culture of saving for the festive
season;
• guiding consumers on how to avoid unnecessary consumption expenditure, so
as to meet the obligations that follow immediately after the festive season, e.g.
school requirements better;
• complimenting and consolidating previous messages by the institute, e.g. the
Teach Children to Save (TCTS) and the Varsity Savings Campaigns.
SASI mostly intensifies its awareness campaigns around the festive season to
promote responsive spending so that consumers do not ignore other obligations that
come just after the Christmas season. The institute also provides free educational
workshops on financial literacy in an effort to promote savings among South Africans
who can be invited by the department of health as part of its wellness programmes.
SASI can also be invited to departmental events that are conducted around festive
season, such as World AIDS Day, where employees and the community can benefit
from their exhibitions and/or stalls.
5.5 GOVERNMENT DEPARTMENTS
The North West Provincial government (NWPG) runs consumer affairs issues
through their Department of Economic Development, Environment, Conservation
Lesolobe Moaisi Page 109
and Tourism (DEDECT). The department has a unit, the Consumer Protector, whose
main objectives are to:
• improve consumer awareness and information and encourage responsible and
informed consumer choice and behaviour; and
• promote consumer confidence, empowerment and development of a culture of
consumer responsibility through individual and group education, vigilance,
advocacy and activism.
The Consumer Protector manages consumers’ complaints, provides consumer
education where consumers’ right are mostly emphasised (Department of Economic
Development, Environment, Conservation and Tourism, 2013).
There are five offices of the Consumer Protector in North West Province: one in each
district, while two are in Bojanala district (DEDECT, 2013). Employees of the
department of health may approach these offices when having complaints on
services or products offered, including from credit providers. In order to familiarise
the employees with the services offered by the office of the Consumer Protector, the
department of health can invite the office to its functions, such as Wellness Day, to
exhibit their services and to provide assistance to employees who might need help
and who, due to lack of information, cannot otherwise access such assistance.
Promotional materials, such as leaflets and pamphlets are made available at the
help desk and the reception counter of all the government offices, including the
department of health.
Government, through the National Department of Economic Development (NDED)
and the NCR, has earmarked some calendar days and months to increase
consumers’ awareness on issues related to consumerism. Some of the campaigns
are:
• “Spend Wisely campaign” in November/December, aimed at informing
consumers about debt management, pitfalls of over-indebtedness, redress

Lesolobe Moaisi Page 110
measures available to consumers who are over-indebted and rights afforded to
consumers;
• “Savings Month campaign” commemorated in July, which focuses on the
importance of saving, how to minimise exposure to debt and the importance of
financial planning; and
• “Know Your Consumer Rights campaign” in March to cover World Consumer
Rights Day on 15 March with an emphasis on redress options to consumers.
As part promoting financial wellness in the workplace, employees can be made
aware of these calendar events through departmental emails and website. Messages
on the theme for a specific campaign could be sent by email to all employees.
5.6 SUMMARY
This chapter sought provide information on how to expose consumers to different
institutions and organisations in the country that can assist them in terms of debt
management. In most cases, consumers are not well informed or they may be
unaware of the consequences of their actions regarding reckless financial
management. This leads to very detrimental effects on their lives, employment and
their families in general.
The chapter focused on key institutions and organisations that have services geared
towards assisting consumers to manage their finances prudently, to manage their
debt better, and to know their consumer rights. The chapter discussed the duties of
some of the regulatory bodies established mostly under the National Credit Act.
There are non-governmental organisations that, among other duties, also promote
an environment conducive to saving between service/product provider and
consumers. Through consumer education and campaigns consumers are made
aware of their consumer rights. These organisations are supported by service
providers, such as commercial banks, who also have their own initiatives to promote
consumer awareness and knowledge. Government departments also play an
important role regarding consumer rights and awareness of these rights. All these
institutions and organisations are only effective if consumers are aware of the
services they offer, take advantage of such services and use the acquired

Lesolobe Moaisi Page 111
knowledge to make an informed choice. It is for this purpose that marketing of these
organisations should be intensified.
The department of health, through it wellness programme unit, can also assist in
marketing these organisations and institutions to its employees and make personal
financial literacy information available through a variety of educational programmes
to keep their employees abreast of new developments on personal finance. In this
way, employee financial wellness workplace programmes could be strengthened.
This, in the end, will contribute to healthy employees’ thereby increasing productivity.
Specific recommendations and conclusion of the research report are presented in
the next chapter.

Lesolobe Moaisi Page 112
CHAPTER SIX SUMMARY, CONCLUSIONS AND RECOMMENDATION S
6.1 INTRODUCTION
The current study was conducted in an attempt to determine consumer debt levels of
the department of health employees at the provincial offices situated in Mahikeng,
North West Province. The study used two variables – income and debt – to measure
the level of indebtedness among public servants and used a debt–income ratio of
20% (Greninger et al., 1996:64) as a yardstick to measure the degree of
indebtedness. The study also focused on the permanently employed population to
gain an understanding of spending patterns and debt. Mortgage debt was
deliberately excluded from the study as it mostly overshadows other types of debt
(South African Reserve bank, 2012).
The primary objectives of the study were to determine the consumer debt level of the
Department of Health public servants in Mahikeng, North West Province, which was
subdivided into the following secondary objectives:
• to identify the most common types of consumer debt owed by public servants in
Mahikeng;
• to determine the monthly expenditure of public servants towards servicing debt;
• to determine the income and sources of income among public servants used to
service debt;
• to gain an understanding of the nature of consumer indebtedness and the extent
of the problem; and
• to investigate the extent to which public servants have been served with garnishee
orders as a result of consumer indebtedness.
The current chapter seeks to report on the conclusion of the study. It assesses
whether the objectives of the study were met, and the recommendations that are
necessary to address the problem identified by the survey. The interpretation and
analysis discussed in Chapter 4 will determine the conclusion of the study.
There are quarterly bulletins issued by the SARB, quarterly reports issued by the
NCR and many credit status-related studies are done in the country which covers the
country’s credit status and its demographics. The results of these reports and

Lesolobe Moaisi Page 113
bulletins mostly target the general population with different races, income classes
and geographic locations; thus, they present a generic report on credit use and
indebtedness in the country. It was thus important to conduct research on a specific
group to provide unique findings. This was then the motivation for conducting a study
among a permanently employed population with some degree of certainty in their job
security. Hence, the study focused on the department of health employees working
at the provincial office in Mahikeng.
6.2 SUMMARY
Chapter one outlined the plan that was necessary to carry out the research. The
chapter entailed the problem statement of the study and the rationale for carrying out
the study. The objectives were highlighted in the chapter together with the scope of
the study. Consumer indebtedness was defined, using various references from
literature together with the current status of consumer debt in the world and the
country. The chapter also highlighted the significance of the study. The methodology
used to conduct the study was also introduced. The chapter concluded by listing the
outlay of the subsequent chapters.
Chapter two covered the theoretical concepts relating to consumer debt. In the
current environment, it is rare for an individual to live without debt. An individual even
receives credit for taking debt, as the longer the credit record, the cheaper the cost
of debt. The chapter also covered in detail the definition of consumer indebtedness
and the way it is classified. A variety of literature converged to give the same
description of indebtedness or over-indebtedness, as indebtedness whose liabilities
are incurred primarily for private, family or household purposes and not as a result of
carrying on a business, either on the debtor’s own account or in partnership with
others, or arising from guarantees given on behalf of limited liability entities (INSOL
International, 2001:1). In simpler terms, debt is that which is owed. This implies that
a consumer is indebted when owing a credit provider. Debt is the opposite of credit.

Lesolobe Moaisi Page 114
Classification of debt includes, among others, debt from credit cards, store cards,
loans from banks and loans from credit providers. The chapter also indicated that
consumer debt is on a rise and could reach a catastrophic point if no steps are taken
by consumers, credit providers and the authorities.
The chapter also covered different methods of measuring debt. In determining the
level of indebtedness, consumer debt has to be categorised into whether the
consumer is over-indebted or when manageable healthy debt is incurred. Over-
indebtedness can be measured in different dimensions. The European Commission
(2008:48) put in place the following indicators for over-indebtedness:
- individuals spending more than 25% of their gross monthly income on
unsecured repayments;
- individuals who spend more than 50% of their gross monthly income on total
borrowing repayments (secured and unsecured);
- individuals with 4 or more credit commitments; as well as
- individuals in arrears on a credit commitment and/or domestic bill for more
than 3 months.
On the other hand, Greninger et al. (1996:64) and the Bureau of Market Research
(2009:6) used a threshold of 20% of the disposable income on non-mortgage debt to
indicate over-indebtedness. Nyaruwata (2009:5) measured over-indebtedness using
expenditure and debt where he indicated that a consumer could be over-indebted if
he or she has a total combined debt servicing and basic expenditure to disposable
income ratio of 70% or more.
Furthermore, the chapter covered literature on the link between consumer
indebtedness and demographic information. This included age, gender, educational
level and income.

Lesolobe Moaisi Page 115
Finally, the status of the garnishee order (or emolument order) in the country was
discussed. Even though the definitions for garnishee order and emolument orders
are different, the study used both terms to mean the same thing, as also done by the
Public Service Commission (2007).
Chapter three of the study covered in detail how the study was conducted. It
specified the research design and methodology of the study. The population of the
study was the employees of the provincial department of health offices in Mahikeng.
Data was collected in the form of a survey to collect macro-data on employees’
consumer indebtedness. The questionnaire used was structured to contain the
demographics, information on personal income, information of consumer debt,
monthly consumer expenditure and garnishee orders. Finally, ethics issues were
taken into consideration during data collection process were discussed.
Chapter four dealt with the interpretation and analysis of data collected through the
process explained in Chapter three. Data was analysed using the SPSS program
and results were presented by means of frequency tables, graphs, bar graphs and
pie charts. This entailed demographic information, income, expenditure on debt, total
monthly expenditure and garnishee orders. The results were finally interpreted to
determine the conclusion of the study.
Chapter five discussed the variety of organisations in the country that could assist
the consumer, employer and the general public on debt management. This
assistance is given to avoid negative effects of consumer debt, which might affect
the employee, the employer (in this case the DoH and the general population). The
DoH could put measures in place to assist employees with financial literacy and avail
themselves of the necessary information to curb over-indebtedness. Employees
could also make use of available information and acquire the necessary knowledge
on how to avoid over-indebtedness. Financial literacy in the workplace can liberate
the majority of employees. The chapter therefore listed several interventions and
services offered by public organisations established to assist consumers on
consumer issues.
Lesolobe Moaisi Page 116
Chapter six concludes by discussing the results of the study and it also proposes
some recommendations based on the research findings. The study limitations and a
suggestion on the need for future studies are also covered in this chapter.
6.3 CONCLUSIONS OF EACH RESEARCH OBJECTIVE
The primary objective of this study was to determine the consumer debt level of the
Department of Health public servants in Mahikeng, North West Province. It was
reported in this study that only eight out of 139 (6%) respondents did not have
monthly payments to service debt. It could therefore be concluded that 94% of the
respondents were in debt.
The primary objective was broken into five secondary objectives, which were
analysed as follows:
Secondary objective one : To identify the most common types of consumer debt
owed by public servants in Mahikeng.
Twelve types of debt were examined and, as indicated in Chapter four, the results
showed that debt from store cards is the most common type of debt being incurred.
This is followed by personal loans from banks and credit cards. The findings are in
line with findings by the National Credit Regulator (2009:08) which indicated that the
majority of consumers (36.6%) used store cards as a method of payment. The
results further indicated that 22% of the respondents had four or more consumer
debt payments per month. This was another indicator of over-indebtedness. With
96% of respondents being indebted and 74% having two or more debt commitments,
it could therefore be argued that public servants working at the provincial office of the
DoH were either on the brink of over-indebtedness or were over-indebted.
Lesolobe Moaisi Page 117
Secondary objective two : To determine the monthly expenditure of public servants
towards servicing debt.
The respondents spent a total of R502 772.00 in the month under the survey
(October 2012) to service debt from their total monthly income of R1 574 500. This
implied that 32% of income was spent on servicing non-mortgage debt. The findings
were slightly less serious than those indicated by the literature but are still a cause
for concern. At the time of his study, Daniel (2001:12) indicated that consumer
indebtedness in North West Province was 39%. From the indicators of over-
indebtedness discussed above, where 20% was indicated as a threshold, it could be
argued that public servants show some indications of over-indebtedness.
Secondary objective three : To determine the income and sources of income
among civil servants used to service debt.
Public servants are permanently employed by government; thus, they have a steady
income that they use to service debt. Only five per cent of respondents indicated to
have additional income, from different sources such as business, maintenance or
annuity. A total earning of the respondents from public service was R1 574 500 while
R45 900 was earned outside the public service. This represents only three per cent
of the total earnings as indicated by respondents. It could therefore be concluded
that public servants rely almost entirely on the public service remuneration to survive
and for debt repayment.
Secondary objective four : To gain an understanding of the nature of consumer
indebtedness and the extent of the problem.
The survey indicated that 96% of respondents were indebted. As indicated in
Chapter four, the respondents also perceived their income to be insufficient, thus
they supplemented it with credit to meet their required standard of leaving. The
survey also indicated that 63% of the respondents had a debt–income ratio above
20%. The reason behind debt intake is mostly a lack of funds and insufficient
income. The type of consumer debt common to the respondents was indicated as

Lesolobe Moaisi Page 118
store card debt (26%) followed by personal debt from banks (18%) while vehicle loan
debt consumed (37%), the highest rand value of total debt among respondents.
Personal loans from banks (21%) comprised the second highest value incurred by
the respondents. It could be argued therefore that most public servants were over-
indebted and could be trapped in a debt cycle if no additional income was provided
or personal financial management education.
Secondary objective five : To investigate the extent to which public servants have
been served with garnishee orders as a result of consumer indebtedness.
The study investigated cases of garnishee or emolument orders issued to public
servants working at the provincial department of health and found out that 13% of
the population had been served with garnishee orders. Most of the affected public
servants were from the middle-income population. The report seems to suggest that
public servants at the department of health were less affected by garnishee orders
as compared to what the Public Service Commission PSC (2007) report found where
it was indicated that 20% of public servants had been served with garnishee orders.
From the results of the survey it can thus be concluded that the majority (96%) of the
public servants working at the provincial office of the North West department of
health were indebted. The total debt–income ratio of the public servants at the North
West Provincial Department of health (63%) was above the threshold of 20%, which
indicates over-indebtedness. The conclusion of the study was that the public
servants working for the North West Department of health in Mahikeng might be
over-indebted.
6.4 RECOMMENDATIONS
As indicated in the literature review, an employee who is indebted negatively affects
the performance of the organisation, employees’ health and wellbeing and other
employees (Barnard et al., 2010:2; Garman et al., 1996; Keese & Schmitz, 2010).
The results of the study indicated over-indebtedness among public servants.

Lesolobe Moaisi Page 119
In light of the above findings, the following recommendations are therefore tabled:
• The department of health through its wellness programme directorate, needs to
institute systems to identify over-indebted employees and assist them to manage
the problem. All employees who are on the Employees Assistance programme
(programme assisting employees who have been referred by their managers or
who voluntarily requested assistance from the wellness programme directorate)
of the department of health, have to be assessed for over-indebtedness to
determine its effect on an employee’s challenges. Such assessment forms are
available at the NCR.
• The DoH should also initiate personal financial wellness programmes for its
employees in an effort to assist employees to manage their income more
efficiently. This will hopefully reduce employee’s indebtedness. The National
credit Regulator and National Consumer Commission (NCC) are two of the many
organisations that provide free workshops on personal financial management
and debt management. The NCR also provides free brochures through the
internet that could be made available to employees to help them understand
debt management better.
• Individual employees could also take responsibility of their debt situation by
making efforts to learn about the debt trap. The more knowledgeable the
individual about personal financial issues, the less likely that individual would be
to make inaccurate financial decisions that could lead to financial problems, such
as over-indebtedness. Over-indebtedness is mostly a result of reckless lending
and borrowing. It occurs when a borrower can no longer service all his or her
debts or where the level of debt servicing is depleting the available funds.
Employees should therefore be encouraged to limit their non-mortgage debt–
income ratio to less than 20% or their total debt–income ratio to less than 35% of
their disposable income. They should also limit the number of the credit account
to less than four. This will help them as the more the credit the more the cost of
taking credit, which also increases total debt.
• Employees should learn to draw up a personal budget. Budgeting can change
spending patterns of individuals through the successful control of finances. As a

Lesolobe Moaisi Page 120
result, unnecessary spending is curbed and budget maintenance is met with a
favourable attitude. This will help to determine the extent to which an employee
could use debt to meet the needs. Employees should also learn to commit to
items they can only afford, e.g. most of the respondents were paying for vehicle
debt despite the fact that it heavily impacted on their total debt status.
• Employees in the department of health should consider a secondary source of
income to boost their source of funding, thereby having more funds to reduce
taking on credit or to afford paying off more debt. They could also consider
starting small businesses that could provide additional funding. This should,
however, be in line with public service regulations and guidelines.
• The department should put mechanisms in place to monitor the performance,
behaviour and attendance of employees with judgement orders. This should be
done without infringing on their privacy. This would give the DoH a reason to put
them in the employee’s assistance programme.
• All employees with deductions of more than 30% of the disposable income
directly from the PERSAL system should be regarded as high-risk employees
and should be put on special monitoring by the human resource unit and
Employees Wellness Programme. This is necessary because other deductions
outside the employer that are done directly from the bank account could lead to
less or no income, which might lead to surviving through debt. Financial
management education and debt rehabilitation could assist these employees to
manage their income better.
6.5 LIMITATIONS AND SUGGESTIONS FOR FUTURE RESEARCH
Nyaruwata (2009) indicates that one of the limitations of studies that use the debt-to-
income ratio to measure indebtedness is that the ratio is an aggregate. As a result,
the ratio does not give any indication of the relative dispersion of indebtedness. This
is therefore one of the limitations of the study. The study also gives the status of
indebtedness at a particular point (cross-sectional); results might thus be affected by
the events at that point in time.
Even though the study used quota sampling, convenient sampling was also
employed; as such the results might not be representative. It should also be noted

Lesolobe Moaisi Page 121
that the process of data cleaning excluded some respondents who did not disclose
valuable information. This would have enhanced the credibility of the study as the
more respondents enrolled, the more the accuracy of the results.
The study took the form of a survey. As a result, the credibility of the report
depended on the honesty of the respondents. Even though the responses that were
not accurate where eliminated, the fact that the study relied on what the respondents
disclose, made it a limitation.
The following are the recommendations for further studies:
• The study focused on the administrative staff of the department of health. It
could easily be extended to different categories within the health professions
such as nurses, doctors and allied health professionals. A comparative study
could also be conducted among administrative staff and health care
professionals.
• Further research is necessary to determine spending and saving behaviour of
employees within the public service.
• The study could also be expanded to cover other public servants in different
geographic areas such as comparing public servants working in urban and rural
areas.
• In-depth qualitative research needs to be done on the impact of over-
indebtedness among public servants and the effects thereof on productivity.
6.6 SUMMARY OF THE CHAPTER
This chapter presented the main findings on consumer debt level of public servants
working at the provincial department of health in Mahikeng. Recommendations were
provided for further action by interested parties. The chapter also provided a
discussion of the findings and their limitations in light of earlier empirical studies and
suggested practical implications for further research for both academic researchers

Lesolobe Moaisi Page 122
and the public service. It is envisaged that the study will positively contribute to the
academic field of knowledge and provide new ideas to the public service that will
lead to solutions on some of the challenges on consumer indebtedness.

Lesolobe Moaisi Page 123
REFERENCE LIST
accountingglossary.net. 2011. Accounting glossary. Available from:
http://www.accountingglossary.net/definition/611 [Accessed 25 October 2011].
Akhaabi, H.T. 2010. Relative income and consumer debt: Evidence from the US
Survey of Consumer Finance. Unpublished PhD thesis. Walden University,
Minnesota.
Anthes, W.L. 2004. Financial illiteracy in America: A perfect storm, a perfect
opportunity. Journal of Financial Service Professionals, 58(6):49–56.
Ardington, C., Lam, D., Leibbrandt, M. & Levinsohn, J. 2004. Savings, insurance and
debt over the post-apartheid period: A review of recent research. The South
African Journal of Economics, 72(3):604–640.
Atkinson, A. & Kempson, E. 2004. Young people, money management, borrowing
and saving: A report to the Banking Code Standards Board. Available from:
http://www.pfrc.bris.ac.uk/Reports/BCSB_young_people.pdf [Accessed 19 June
2013].
Australia and New Zealand Banking Group Limited. 2005. Adult financial literacy,
personal debt and financial difficulty in Australia. Nielson.
Autio, M., Wilska, T.A., Kaartinen, R. & Lähteenmaa, J. 2009. The use of small
instant loans among young adults – a gateway to a consumer insolvency?
International Journal of Consumer Studies, 33(2009):407–415.
BancVue. 2010. Personal financial management, the rising tide of consumer
demand. BancVue Whitepaper. Available from:
http://www.bancvue.com/custom/bancvue/pdf/PFM _WP_FINAL_1215.pdf.
[Accessed 20 June 2013].

Lesolobe Moaisi Page 124
Barba, A. & Pivetti, M. 2009. Rising household debt: Its causes and macroeconomic
implications – a long-period analysis. Cambridge Journal of Economics,
33(2009):113–137.
Barnard, A., Peters, D. & Mueller, H. 2010. Financial health and sense of coherence.
SA Journal of Human Resource Management, 8(1):1–13.
Basu, S. 2005. White Paper: Financial literacy and the life cycle. White House
Conference on Aging. Available from:
http://www.fpanet.org/docs/assets/9D667EE5-1D09-67A1-
AC675583A9BCB0FF/WhitePaperonFinancialLiteracy.pdf [Accessed 19 June
2013].
Bernard, H.R. 2000. Social research methods. Thousand Oaks, CA: Sage.
Bertola, G. & Houchguertel, S. 2005. Household debt and credit. Luxembourg
Wealth Study. Perugia meeting, University of Perugia, Perugia, 27–29
January.
Bird, E., Hagstrom, P. & Wild, R. 1999. Credit card debts of the poor: High and
rising. Journal of Policy Analysis and Management, 18(1):125–133.
BMR (Bureau of Market Research). 2009. Consumer Financial Vulnerability Index for
South Africa. Pretoria: Unisa.
Bond, M. 2000. Understanding the benefits/wages connection: Financial literacy for
citizenship in a risk society. Studies in the Education of Adults, 32(1):63–77.
Bridges, S. & Disney, R. 2010. Debt and depression. Journal of Health Economics,
29(3):388–403.
Brito, D. & Peter, H. 1995. Consumer rationality and credit cards. Journal of Political
Economy, 103(1995):400–433.

Lesolobe Moaisi Page 125
Buckland, J. & Martin, T. 2005. Two-tier banking: the rise of fringe banks in
Winnipeg’s inner city. Canadian Journal of Urban Research, 14, 158–181.
Business Anti-corruption Portal. 2011. South Africa country profile. Available from:
http://www.business-anti-corruption.com/country-profiles/sub-saharan-
africa/south-africa/show-all/ [Accessed 23 February 2012].
CAP (Center for American Progress). 2006. Pushing the limit: Credit card debt
burdens American families. Unpublished working paper. Washington, DC.
Chakravorti, S. 2003. Theory of credit card networks: A survey of the literature.
Review of Network Economics, 2(2):1–19.
Chawla, R.K. & Uppal, S. 2012. Household debt in Canada. Available from:
http://www.statcan.gc.ca/pub/75-001-x/2012002/article/11636-eng.pdf
[Accessed 12 May 2012].
Cox, A., Hooker, H., Markwick, C. & Reilly, P. 2009. Financial well-being in the
workplace. Report 464. Brighton: Institute for Employment Studies.
Credit Ombud. 2013. About credit ombuds. Available from:
http://www.creditombud.org.za/about.htm [Accessed 10 April 2013].
Crous, E. 2008. Employee financial wellness: A corporate social responsibility.
Deutsche Gesellschaft für Technische Zusammenarbeit.
Curtis, W.W. 1962. An investigation of consumer debt portfolios. Unpublished PhD
thesis. University of Illinois, Urbana.
D’Alessio, G. & Iezzi, S. 2012. Household over-indebtedness. Paper presented at
the Sixth IFC Conference on Statistical Issues and Activities in a Changing
Environment, Bank for International Settlements, Basel, 28–29 August.
Lesolobe Moaisi Page 126
Dancey, K. 2012. Consumer financial education – a South African perspective.
Paper delivered at the 2nd Congress on Consumer Protection and Financial
Education, Bogota, Colombia, 16 April.
Daniels, R. 2001. Consumer indebtedness among urban South African households:
A descriptive overview. Unpublished working paper no. 1/55. Development
Policy Research Unit, University of Cape Town.
Daniels, R. 2003. Household indebtedness in South Africa in 1995 and 2000. Draft
Report 639 to the Micro Finance Regulatory Council. Pretoria: HSRC.
Debtsecret Admin. 2010. Understanding debt series. Part 1: The causes of debt.
Available from: http://www.debtsecrets.co.uk /debtsecrets.html [Accessed 25
October 2011].
DEDET (Department of Economic Development, Environment and Tourism). 2013.
North-West Province. Mahikeng.
De Villiers, D.V. 2010. A workable debt review process for South Africa. Unpublished
master’s thesis. University of Pretoria. Pretoria.
De Vos, A.S., Strydom, H., Fouche, C.B. & Delport, C.S.L. 2005. Research at grass
roots: For the social sciences and human service professions. Third edition.
Pretoria. Van Schaik.
Dictionary.com. 2012. Relative. Available from: http://dictionary.reference.
com/browse/relative [Accessed 27 April 2012].
Disney, R. & Gathergood, J. 2011. Financial literacy and indebtedness: New
evidence for UK consumers. Unpublished report from University of
Nottingham, Nottingham.

Lesolobe Moaisi Page 127
Disney, R. & Gathergood, J. 2012. Financial literacy and consumer credit use.
Working paper 12/01. Nottingham: Centre for Finance and Credit Markets.
Dowling, N.A., Corney, T. & Hoiles, L. 2009. Financial management practices and
money attitudes as determinants of financial problems and dissatisfaction in
young male Australian workers. Journal of Financial Counseling and Planning,
20(2):5–13.
DPSA (Department of Public Service and Administration). 1994. Public Service Act.
Pretoria.
dti (Department of Trade and Industry). 2006. The National Credit Act of 2005.
Pretoria.
Duasa, J. 2008. Tendency of corruption and its determinants among public servants:
a study on Malaysia. Unpublished working paper. Munich Personal RePEc
Archive.
Dutt, A. 2003. Consumer debt, growth and income distribution. Paper presented at
the seminar for the University of Notre Dame and the Indian Institute of
management, University of Notre Dame, 01 March.
Erasmus, A.C. & Lebani, L. 2007. Consumers’ use of and satisfaction with store
cards. Journal of Family Ecology and Consumer Sciences, 35(2007):59–70.
Erasmus, A.C. & Lebani, L. 2008. Store cards: Is it a matter of convenience or is the
facility used to sustain lavish consumption? International Journal of Consumer
Studies, 32(2008):211–221.
Eurodebt. 2011. Loss of income is the biggest cause of debt woes. Available from:
http://www.eurodebt.com/debt-reasons/ [Accessed 25 October 2011].

Lesolobe Moaisi Page 128
European Commission. 2008. Towards a common operational European definition of
over-indebtedness. Brussels.
FIHRST Management Services. 2010. The employer’s guide to garnishee orders.
Available from: http://fmsgarnisheemanagement.fihrst.com/Articles/
garnisheedocnew.pdf [Accessed 28 April 2012].
Finlay, S. 2009. Consumer credit fundamentals. 2nd ed. London: Palgrave
Macmillan.
Garman, E.T., Leech, I.E. & Grable, J.E. 1996. The negative impact of employee
poor personal financial. Association for Financial Counselling and Planning
Education, 7(1):157–168.
Garner, C.A. 1996. Can measures of the consumer debt burden reliably predict and
economic slowdown? Economic Review, Fourth quarter: 65–76.
Garðarsdóttir, R.B. & Dittmar, H. 2012. The relationship of materialism to debt and
financial well-being: The case of Iceland’s perceived prosperity. Journal of
Economic Psychology, 33:471–481.
Gathergood, J. 2012. Self-control, financial literacy and consumer over-
indebtedness. Journal of Economic Psychology, 33(2012):590–602.
Gay, L.P. & Arasian, P. 2003. Educational research: Competencies for analysis and
application. Seventh edition. Upper Saddle River, NJ: Pearson Education.
Greenspan, A. 2005. The importance of financial education today. Social Education,
69(2):64–65.

Lesolobe Moaisi Page 129
Greninger, S., Hampton, V., Kitt, K. & Achacoso, J. 1996. Ratios and benchmarks for
measuring the financial well-being of families and individuals. Financial
Services Review, 5(l):57–70.
Griffiths, M. 2007. Consumer debt in Australia: Why banks will not turn their backs on
profit. International Journal of Consumer Studies, 31(2007):230–236.
HSRC (Human Sciences Research Council). 2003. Household indebtedness in
South Africa in 1995 and 2000. Report prepared for the Micro Finance
Regulatory Council. Pretoria.
Hurwitz, I. & Luiz, J. 2007. Urban working class credit usage and over-indebtedness
in South Africa. Journal of Southern African Studies, 33(1):107–131.
Hyounjin Yi, M.A. 2010. Three essays in consumer finance: Debt stress, payments,
and student loans. Unpublished PhD thesis. The Ohio State University,
Columbus, OS.
INSOL International. 2001. Consumer debt report: Report on findings and
recommendation. London.
InvestorWords. 2011. Consumer debt. Available from: http://www.
investorwords.com/1058/consumer_debt.html [Accessed 25 October 2011].
Iyanda, O. & Biza-Khupe, S. 2011. Credit usage, hire purchase costs, and consumer
protection in retail institutions in Botswana. Unpublished working paper.
University of Botswana.
Jacobs, G. & Smit, E.M. 2010. Materialism and indebtedness of low income
consumers: Evidence from South Africa’s largest credit granting catalogue
retailer. South African Journal of Business Management, 41(4):11–33.

Lesolobe Moaisi Page 130
Jiang, S. 2007. An investigation of credit card holding, borrowing, and payoff.
Unpublished PhD thesis. Ohio State University, Columbus, OS.
Joo, S. 1998. Personal financial wellness and worker job productivity. Unpublished
PhD thesis. Virginia Polytechnic and State University, Blacksburg, VA.
Joo, S. & Grable, J.E. 2004. An exploratory framework of the determinants of
financial satisfaction. Journal of Family and Economic Issues, 25(1):25–50.
Joyce, K., Lisa H. & Rathakrishnan, S. 2011. The influence of image consciousness,
materialism and compulsive spending on credit card usage intentions among
youth. Young Consumers, 12(3):243–253.
Kane-Berman, J. & Tempest, J. 2007. South Africa survey 2006/2007.
Johannesburg: South African Institute of Race Relations.
Kantrowitz, M. 2010. Total college debt now exceeds total credit card debt. Available
from: www.fastweb.com/financial-aid/articles/2589-total-college-debt-now-
exceeds-total-credit-card-debt [Accessed 20 April 2012].
Kaynak, E., Kucukermiroglo, O. & Ozmen, A. 1995. Correlates of credit card
acceptance and usage in an advanced developing Middle Eastern country.
Journal of Services Marketing, 9(4):52–63.
Keese, M. 2012. Who feels constrained by high debt burdens? Subjective vs.
objective measures of household debt. Journal of Economic Psychology,
33:125–141.
Keese, M. & Schmitz, H. 2010. Broke, ill, and obese: The effect of household debt on
health. Paper presented at the 2nd annual meeting of the German Association
of Health Economists, University of Duisburg-Essen, Berlin, 1-2 March.
Kidwell, B. & Turrisi, R. 2004. An examination of money management tendencies.
Lesolobe Moaisi Page 131
Journal of Economic Psychology, 25, October: 601–616.
Kotzè , L. & Smit, A.v.A. 2008. Personal financial literacy and personal debt
management: The potential relationship with new venture creation. SAJESBM
NS 1(1):35–50.
Kuhn, K. 2010. Note on household wealth in South
Africa. South African Reserve Bank Quarterly Bulletin, September: 66–73.
Lea, S.E.G., Webley, P. & Walker, C.M. 1995. Psychological factors in consumer
debt: Money management, economic socialization, and credit use. Journal of
Economic Psychology, 16(1995):SAJESBM 681–701.
Lee, J. & Hogarth, J.M. 1999. Returns to information search: Consumer credit card
shopping decisions. Financial Counseling and Planning, 10(2):23–34.
Lee, J. & Kwon, K.N. 2002. Consumers’ use of credit cards: Store credit card usage
as an alternative payment and financing medium. The Journal of Consumer
Affairs, 36(2):239–262.
Leedy, P. & Ormrod, J. 2010. Practical research. 8th ed. Prentice Hall, NJ: Pearson
Education.
Livingstone, S.M. & Lunt, P.K. 1992. Predicting personal debt and debt repayment:
Psychological, social and economic determinants. Journal of Economic
Psychology, 13:111–134.
Lorgat, M. 2003. Enabling worker finances: The effects of rising costs of living and
debt on worker finances. Unpublished paper. South African Sociological
Association, Durban.
Lunenburg, F.C. & Irby, B.J. 2008. Writing a successful thesis or dissertation: Tips

Lesolobe Moaisi Page 132
and strategies for students in social and behavioural sciences. Thousand
Oaks, CA: Corwin.
Lusardi, A. & Mitchell, O.S. 2007. Financial literacy and retirement preparedness:
Evidence and implications for financial education. Business Economics,
42:35–44.
Lusardi, A. & Tufano, P. 2009. Debt literacy, financial experience and over
indebtedness. NBER working paper no. 14808. Cambridge, MA: The National
Bureau of Economic Research.
Makhubu, D.M. 2010. The effectiveness of records management and its importance
in improving service delivery. Unpublished MBA thesis. Management College
of South Africa, Johannesburg.
Mangale, N. 2012. Evaluation of the implementation of mother-to-child transmission
of HIV interventions in Mafikeng sub-district clinics. Unpublished MPH thesis.
University of Venda, Thohoyandou.
Mashigo, P. 2006. Debt spiral in the poor household in South Africa. The
International Indigenous Journal of Entrepreneurship, Advancement, Strategy
and Education, 2(1):n.p.
Mazibuko, L., Dlukulu, L., Qocha D., Mfetane, V., Thloaele, D. & Bopape, S. 2009.
An investigation into the indebtedness of consumers: A case study of the
South African middle class. Available from: http://atplay.biz/clients/iwfsa/wp-
content/uploads/Indebtedness-of-Consumers-SA-Middle-Class.pdf [Accessed
6 May 2012].
McCaulley, G. 2011. Payday lending in Missouri: Among the most abusive in the
nation. Center for Family Policy and Research, University of Missouri.
Columbia, MO.

Lesolobe Moaisi Page 133
Meagher, P. 2005. Microfinance regulation and supervision in South Africa. College
Park, MD:IRIS Center, University of Maryland.
Mlandu, N. 2007. The effectiveness of the National Credit Act (2005) in curbing
consumer indebtedness. Unpublished MBA thesis. University of Pretoria.
Pretoria.
Mountain State Centers for Independent Living. 2011. Budget. Available from:
http://mtstcil.org/skills/budget-12.html [Accessed 7 June 2011].
Muske, G. & Winter, M. 2004. Personal financial management education: An
alternative paradigm. Financial Counselling and Planning, 15(2):79–88.
NAAMSA (National Association of Automobile Manufactures of South Africa). 2012.
Passenger Market. Available from:
http://www.naamsa.co.za/flash/passenger.asp? [Accessed 12 May 2012].
NCES (National Centre for Education Statistics). 2009. Digest of education statistics
2008. Available from: http://nces.ed.gov/pubs2009/2009020.pdf [Accessed 23
April 2012].
NCF (National Consumer Forum). 2013. Placing consumer issues on the agenda.
Available from: http://ombudsman.ombudsmen.co.za/find-an-
ombudsman/index. php?option=com_ content&view article&id=79:national-
consumer-forum-ncf& catid=35:ombudsman-professional-
organisations&Itemid=65 [Accessed 15 April 2013].
NCR (National Credit Regulator). 2006. Credit extension to households. Financial
Economic Analysis Strategy. Pretoria.
NCR (National Credit Regulator). 2009. Pricing of and access to consumer credit: A
review of the impact of the National Credit Act one year after its
implementation. Pretoria.
Lesolobe Moaisi Page 134
NCR (National Credit Regulator). 2010. Consumer credit market report. Credit
Bureau Monitor, fourth quarter. Pretoria.
NCR (National Credit Regulator). 2011. Consumer credit market report. Credit
Bureau Monitor, fourth quarter. Pretoria.
NCR (National Credit Regulator). 2012. Consumer credit market report. Credit
Bureau Monitor, fourth quarter. Pretoria.
NCR (National Credit Regulator). 2013. About the NCR. Available from:
http://www.ncr.org.za/index.php?option=com_content&view=article&id=38
[Accessed 26 March 2013]
NCT (National Consumer Tribunal). 2013. Mandate and functional purpose.
Available from: http://www.thenct.org.za/mandate [Accessed 30 March 2013].
Nkatini, N.L. 2005. Glimpses of research: Guidelines on the writing of research
proposals, report, essays, dissertations and theses. Polokwane: JP
Publishers.
NSFAS (National Student Financial Aid Scheme). 2011. 2010/11 annual report.
Pretoria.
Núñez, L., Forrester, C. & De Wet, T. 2008. Sub-study on credit and savings.
Johannesburg: Centre for Social Development in Africa, University of
Johannesburg.
NWDoH (North West Department of Health). 2010/11. Annual report. Mahikeng.
NWDoH (North West Department of Health). 2012. Annual report. Mahikeng.
Nyamute, W. & Maina, J.K.M. 2011. Effect of financial literacy on personal financial
Lesolobe Moaisi Page 135
management practices. Unpublished report.
Nyaruwata, G. 2009. Addressing Over-Indebtedness in South Africa: What role
should supply-side and demand-side interventions play? Unpublished paper.
University of Cape Town. Cape Town.
Nyaruwata, G. & Leibbrandt, M. 2009. Personal debt and financial access: Analysis
of the NIDS Wave 1 Dataset. Discussion paper no. 8, National Income
Dynamics Study. Cape Town.
ORC (Opinion Research Corporation). 2001. Study of the problem of consumer
indebtedness. Brussels.
Opinion Research Council International. Portrait Report. 2004. Indicative findings.
London: Opinion Research Council International
Oseifuah, E.K. 2010. Financial literacy and youth entrepreneurship in South Africa.
African Journal of Economic and Management Studies, 1(2):164–182.
Parker, R. & Chatterjee, A. 2009. Consumer susceptibility to credit debt: Findings
from exploratory surveys. Journal for Global Business Issues, 3(2):179–184.
Paulse, S. Susana.Paulse@re SAJESBM reservebank.co.za. 14 May 2012. Re:
Credit split 199401-201203. E-mail to Moaisi, L. [email protected].
PERSAL system. 1990. ADABAS Version 1. [Computer software]. Pretoria: National
Treasury.
Persson M. 2008. Household indebtedness in Sweden and implications for financial
stability. BIS Papers 46:124–135.
Pham, T.H., Yap, H. & Dowling, N.A. 2012. The impact of financial management
practices and financial attitudes on the relationship between materialism and
compulsive buying. Journal of Economic Psychology 33(2012):461–470.

Lesolobe Moaisi Page 136
Phenya, A. 2011. An assessment of the financial management skills of small retail
business owners/managers in Dr JS Moroka Municipality. Unpublished
master’s thesis. Unisa, Pretoria.
Pressman, S. 2007. The decline of the middle class: An international perspective.
Journal of Economic Issues, XLI(1):181–200.
Pressman, S. & Scott, R.H. III. 2010. Consumer debt and poverty measurement.
Focus, 27(1):9–12.
Prince, M. 1993. Women, men and money styles. Journal of Economic Psychology,
14(1):175–182.
Prinsloo, J.W. 2002. Household debt, wealth and savings. South African Reserve
Bank Quarterly Bulletin, December:63–78.
Pritchard, J. N.d. Peer to peer lending cuts out the bank. Available from:
http://banking.about.com/od/peertopeerlending/a/peertopeerlend.htm
[Accessed 25 October 2011].
PSC (Public Service Commission). 2002. Code of conduct for public servants.
http://www.psc.gov.za/documents/docs/guidelines/codecon.pdf [Accessed 1
May 2012].
PSC (Public Service Commission). 2007. Report on the indebtedness of public
servants. Public Service Report. Pretoria.
Raijas, A., Lehtinen, A.R. & Leskinen, J. 2010. Over-indebtedness in the Finnish
consumer society. Journal of Consumer Policy, 33(2010):209–223.
Ritzer, G. 1995. Expressing America: A critique of the global credit card society.
Thousand Oaks, CA: Pine Forge Press.

Lesolobe Moaisi Page 137
SAARF (South African Advertising Research Foundation). 2012. SAARF
segmentation tools. Available from: http://www.saarf.co.za/lsm-
presentations/2012/ LSM%20 Presentation%20-%20February%202012.pdf
[Accessed 6 May 2012].
SAFM. 2012. AM Live. Off-air recording, audiotape, 2 March.
SARB (South African Reserve Bank). 2010. Note on Household Wealth in South Africa. Quarterly bulletin, Third Quarter: 66- 73.
SARB (South African Reserve Bank). 2012. Quarterly Bulletin no. 263. Pretoria.
SASI (South African Saving Institute). 2013. Who are we? Available from:
http://www.savingsinstitute.co.za/ [Accessed 1 April 2013].
Saunders, N.K., Lewis, P. & Thornhill, A. 1997. Research methods for business
students. Third edition. Hillsdale, NJ: Prentice-Hall.
Scott, R.H. III & Pressman, S. 2011. A double squeeze on the middle class. Journal
of Economic Issues, XLV(2):333–341.
Smith, S. 2011. What is data analysis? Wisegeek. Available from:
http://www.wisegeek.com/what-is-data-analysis.htm [Accessed 15 October
2011].
Southall, R. Nd. Political change and the black middle class in democratic South
Africa. Available from: http://ccs.ukzn.ac.za/files/Black% 20Middle%20
Class%20in% 20SA3.pdf [Accessed 21 April 2012].
Stango, V. & Zinman, J. 2007. Fuzzy math and red ink: When the opportunity cost of
consumption is not what it seems. Working paper. Dartmouth College.
Hanover, NH.

Lesolobe Moaisi Page 138
Starvins, J. 2000. Credit card borrowing, delinquency, and personal bankruptcy. New
England Economic Review, July/August: 15–30.
Statistics South Africa. 2004. Provincial profile. Report No. 00-91-06. Pretoria.
Statistic South Africa. 2008. Income and Expenditure survey. Statistical release
P0100. Pretoria.
Statistics South Africa. 2012. Statistics of civil cases for debt (preliminary).
Statistical release P0041. Pretoria.
Statistics South Africa. 2013. Quarterly Labour Force Survey (Quarter two).
Statistical release P0211. Pretoria.
Strauss, A. & Carbin, J. 1998. Basics of qualitative research: Techniques and
procedures for developing grounded theory. London. Sage.
Streeter, W.W. 2003. How’s your financial literacy? ABA Banking Journal, 95(10):4.
Swart, N. 2004. Personal financial management. Cape Town: Juta.
The Nation. 2010. Fair pay is one way to root out corruption. Available from:
http://www.nationmultimedia.com/home/2010/09/16/ opinion/Fair-pay-is-one-
way-to-root-out-corruption-30138051.html [Accessed 29 September 2011].
Thorne, D. 2010. Extreme financial strain: Emergent chores, gender inequality and
emotional distress. Journal of Family and Economic Issues, 31(2):185–197.
Tustin, D.H., Ligthelm, A.A., Martins, J.H. & Van Wyk, H. de J. 2005. Marketing
research in practice. Pretoria: University of South Africa.
University of Pretoria Law Clinic. 2008. The incidence of and the undesirable
Lesolobe Moaisi Page 139
practices relating to garnishee orders in South Africa. Pretoria: University of
Pretoria.
Van der Walt, B.E. & Prinsloo, J.W. 1995. The compilation and importance of debt in
South Africa. Pretoria: South African Reserve Bank.
Vogt, W.P., Gardner, D.C. & Haeffele, L.M. 2012. When to use what research
design. New York: Guilford Press.
Wang, J. 2006. Consumption of debt: An interpersonal relationship approach.
Unpublished PhD thesis. University of Arizona, Tucoson, A.
Weller, C.E. 2007. Need or want: What explains the run-up in consumer debt?
Journal of Economic Issues, 41:583–593.
Welman, C., Kruger, F. & Mitchel B. 2005. Research methodology. Third edition.
Cape Town: Oxford University Press.
Welman, J. & Kruger, S. 1999. Research methodology for the business and
administrative science. Cape Town: Oxford University Press.
Wickramasinghe, V. & Gurugamage, A. 2009. Consumer credit card ownership and
usage practices: Empirical evidence from Sri Lanka. International Journal of
Consumer Studies, 33(2009):1470–6423.
Wisker, G. 2001. The postgraduate research handbook: Succeed with your MA,
MPhil, EdD and PhD. New York: Palgrave.
Woolard, I. 2002. A comparison of wage levels and wage inequality in the public and
private sectors, 1995 and 2000. Working paper 02/62. Port Elizabeth:
University of Port Elizabeth.
Worthington, A.C. 2006. Debt as a source of financial stress in Australian

Lesolobe Moaisi Page 140
households. International Journal of Consumer Studies, 30(1):2–15.
Worthington, S. 1996. Smart cards and retailers, who stands to benefit? International
Journal of Retail and Distribution Management, 24(1996):31–41.
Zhao, J. 2003. Household debt service burden outlook: An exploration on the effect
of credit constraints. Unpublished PhD thesis. Graduate School of the Ohio
State University, Columbus, O.

Lesolobe Moaisi Page 141
ANNEXURES
Annexure A Consent form
Consumer debt level of the Department of Health pub lic servants in Mahikeng
Research conducted by:
Mr Lesolobe Moaisi
Tel/Cell: 082 801 2821
Dear Respondent
You are invited to participate in an academic research study conducted by Mr
Lesolobe Moaisi, a master’s student from the Department of Finance, Risk
Management and Banking, at the University of South Africa.
The purpose of the study is to determine the consumer debt level of the employees
of the department.
Please note the following:
� This study involves an anonymous questionnaire. Your name will not appear on
the questionnaire and the answers you give will be treated as strictly confidential.
You cannot be identified in person based on the answers you give.
� Your participation in this study is very important to us. You may, however, choose
not to participate and you may also stop participating at any time without any
negative consequences.
� Please answer the questions in the attached questionnaire as completely and
honestly as possible. This should not take more than 30 minutes of your time.
� The results of the study will be used for academic purposes only and might assist
to determine if the department should intensify personal financial management
programs through Employees ‘Wellness Sub-directorate.
Please sign the form to indicate that:
� You have read and understand the information provided above.
� You give your consent to participate in the study on a voluntary basis.

Lesolobe Moaisi Page 142
If you have any questions or concerns about completing the questionnaire or about
participating in this study, you may contact me at 018 387 5780 or at
Thank you
___________________ ________________
Respondent’s signature Date

Lesolobe Moaisi Page 143
Annexure B Questionnaire
Section A: Demographic information
Kindly tick where appropriate
1. Gender
Male 1
Female 2
2. Age
25 yrs and below 1
26–30 yrs 2
31–35 yrs 3
36–40 yrs 4
41–45 yrs 5
46–50 yrs 6
Above 50 yrs 7
3. Marital status
Single 1
Married 2
Life partner 3
Divorce 4
Widowed 5

Lesolobe Moaisi Page 144
4. What is the highest education level achieved?
Secondary 1
Diploma 2
Undergraduate degree 3
Postgraduate degree
(Hons)
4
Master’s 5
PhD 6
5. How long have you been permanently employed?
Less than 1 year 1
1–5 yrs 2
6–10 yrs 3
11–20 yrs 4
Above 20 yrs 5
Section B: Information on personal income
6. Salary level
Level 5 and below 1
Level 6–8 2
Level 9–12 3
Level 13 and
above
4
7. Current monthly income after tax from the department:
Less than R5 000 1
R5 001 – R10 000 2
R10 001 – R15 000 3
R15 001 – R20 000 4
Above R20 000 5

Lesolobe Moaisi Page 145
8. Do you have other monthly income in addition to your salary?
Yes 1 If yes go to question
9
No 2 If no go to question
10
9. What is the monthly income after tax from other sources?
Source(s) of income Monthly income after tax
1
2
3
Section C: Information on consumer debt
10. Do you currently pay monthly to service debt?
Yes 1
No 2
11. What are your two main reasons for using debt?
1. 1
2. 2
12. Please indicate which of the following debt you are currently servicing per
month:
Data on debt payment
Kindly circle
where
appropriate
How
much
was your
last
payment?
What is the
remaining
outstanding
balance on
your
account?
Question
number
Types of debt Yes No Rand Rand
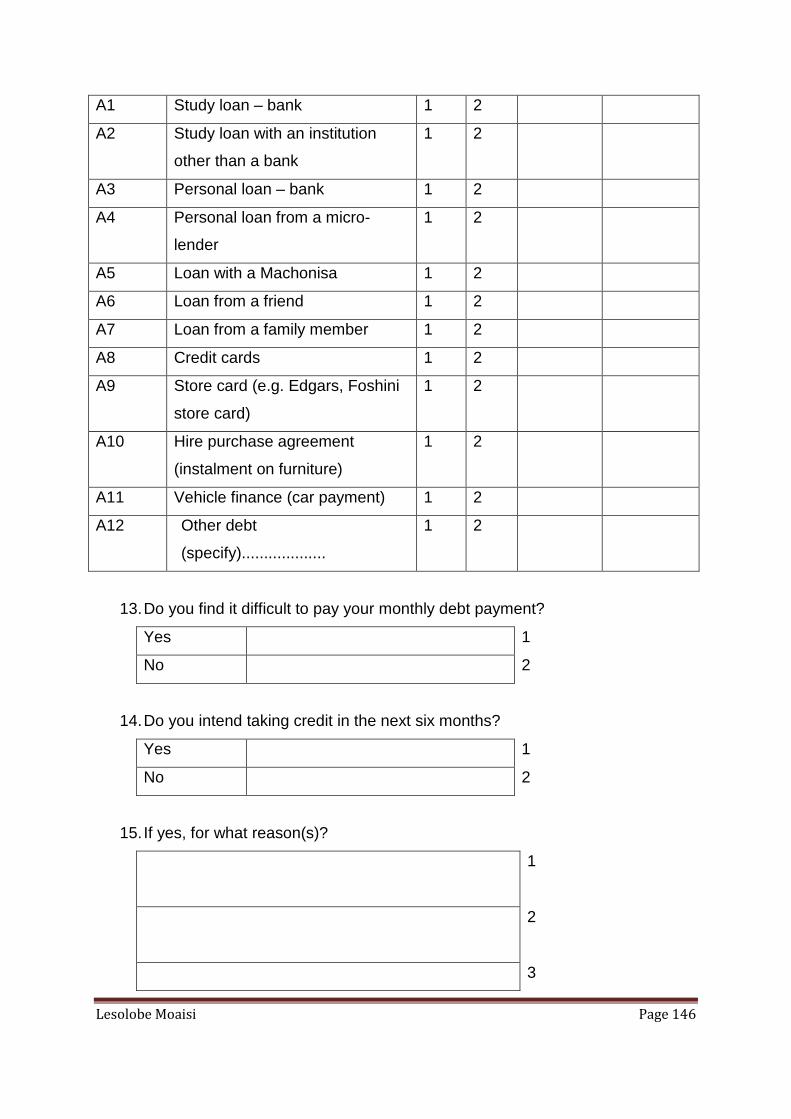
Lesolobe Moaisi Page 146
A1 Study loan – bank 1 2
A2 Study loan with an institution
other than a bank
1 2
A3 Personal loan – bank 1 2
A4 Personal loan from a micro-
lender
1 2
A5 Loan with a Machonisa 1 2
A6 Loan from a friend 1 2
A7 Loan from a family member 1 2
A8 Credit cards 1 2
A9 Store card (e.g. Edgars, Foshini
store card)
1 2
A10 Hire purchase agreement
(instalment on furniture)
1 2
A11 Vehicle finance (car payment) 1 2
A12 Other debt
(specify)...................
1 2
13. Do you find it difficult to pay your monthly debt payment?
Yes 1
No 2
14. Do you intend taking credit in the next six months?
Yes 1
No 2
15. If yes, for what reason(s)?
1
2
3

Lesolobe Moaisi Page 147
16. Does the department deduct your salary through PERSAL system to settle
your debt?
Yes 1
No 2
Section D: Information on personal expenditure
17. How much do you spend per month on the following items:
Expenditure per month
Do you spend on the
following?
Monthly
expenditure
Question
number
Item Yes No Rand
B1 Food 1 2
B2 Tobacco 1 2
B3 Clothing 1 2
B4 Housing (instalment/rent) 1 2
B5 Electricity and other power 1 2
B6 Municipal services 1 2
B7 Furniture and equipment 1 2
B8 Communications 1 2
B9 Reading materials 1 2
B10 Educations 1 2
B11 Household necessities 1 2
B12 Servants 1 2
B13 Medical services and
requirements
1 2
B14 Recreations and sports 1 2
B15 Entertainment 1 2
B16 Personal care 1 2

Lesolobe Moaisi Page 148
B17 Others 1 2
Thank you very much for filling out the questionnaire. Kindly ensure that you have
filled the questionnaire out in full. Remember, this is an anonymous questionnaire,
so you do not need to write down your name.