consumer choice and demand - mcrhrdi
TRANSCRIPT

1
Micro Economics
Of what use is it to us?
Special FC 2021

2
Consumer choice
Depends On:
Tastes and preferences
Some people like pink shirts, some like
black ones.
Some people prefer cheap old cars and
big houses.
Others prefer expensive new cars and
small houses, etc.

3
Opportunities (or Constraints)
The price of the commodity in
question
Prices of related commodities
Consumer income
Other factors (e.g., quality,
expectations, non-monetary costs)

4
Note that Tastes and Preferences
are not observable.
Prices and Incomes, however, are
observable.
5
So, while economists recognize that
tastes and preferences are important
determinants of the consumption
choices people make, we focus much
more on the impacts of Opportunities
(or Constraints) on economic
behavior.

6
Demand
Relates the price of a commodity to
the quantity purchased.
Price represents the opportunity cost
of consuming the commodity.
or
Price represents how much of other
commodities must be given up to
consume the commodity of interest.

7
Class Demand for Burgers
How many burgers will you want if the
burgers are free?
You might want to tell them that they
have to plan to eat whatever they take
before they leave the class.

8
Demand
How many if the price is
25?
50?
100?
200?
Graph the responses (Price on the
vertical axis, Quantity on the horizontal
axis)
9
Law of Demand
There is an inverse relationship
between the price and the quantity
demanded of a good.
As the price increases the quantity
demanded decreases.
Or, as the price decreases the quantity
demanded increases.
This is the Law of Demand

10
Law of Demand
In other words, the demand curve is
negatively sloped.
Depending on the size of your class
(and maybe the time of day), you
should get . . .

11
Law of Demand
0.00
0.50
1.00
1.50
2.00
0 5 10 15 20
Pri
ce p
er
un
it
Quantity
Demand
The Demand Curve for Burgers is Negatively
Sloped

12
An Important Distinction
Changes in Quantity Demanded
vs.
Changes in Demand

13
Changes in the Price of a Commodity
Say, Apples
If the price of apples increases, then
consumers will purchase fewer of them.
If price decreases, consumers will
purchase more apples.
Other factors held constant.
Factors that Affect Demand

14
Factors that Affect Demand
Changes in the Price of a Commodity
Change in Quantity Demanded
Movements along the demand curve for
apples result from changes in the price of
apples.
Such movements are referred to as
changes in quantity demanded.

15
The Demand for Apples
Price
An Increase in Quantity Demanded
D0
Q0
P0
P1 1
Q1
2

D0
The Demand for Apples
Q
(Kgs/week)
Price
A Decrease in Quantity Demanded
Q0
P0
P1 1
Q1
2
16

17
Factors that Affect Demand
Prices of Related Goods
Complements: Goods that are consumed together.
If apples are more enjoyable with oranges then the two are complements.
Cookies and milk.
Coffee and cream.
Movies and popcorn.
Mountain Bikes and Helmets
And so forth.

18
Factors that Affect Demand
Prices of Related Goods:
Complements (cont.)
If the price of oranges increases,
Less oranges will be demanded,
and
The demand for apples will decrease (it will shift to the left).
This shift is referred to as a change in demand.

The Demand for Apples
P0
D1
Q1 Q
(Kgs/week)
Price
A Decrease in Demand from an Increase
in the Price of a Complement
D0
Q0
19

20
Factors that Affect Demand
Prices of Related Goods
Substitutes: Goods that replace each other. Fuji apples and Gala or Red Delicious or
Pink Lady apples are substitutes.
Also,
Cap’n Crunch and Trix cereals.
Cans and bottles of Diet Pepsi.
Bikes and scooters
Toyotas and Hondas.
And so forth.

21
Factors that Affect Demand Prices of Related Goods:
Substitutes (cont.):
If the price of Gala apples increases,
Fewer Gala apples will be demanded,
and
The demand for Fuji apples will increase as some people switch from Gala to Fuji Apples (it will shift to the right).
Again, this shift is referred to as a change in demand.

The Demand for Fuji Apples
Q
(Pounds/week)
Price
($/Q)
An Increase in Demand from an
Increase in the Price of a Substitute
D0
Q0
P0
D1
Q1
22

23
Factors that Affect Demand
Income:
Income is held constant along a demand curve. What happens if income increases?
It depends on the good we are discussing.
Consider pizzas . . .
If my income increases, at any given price of these pizzas, I will now want to purchase more than I did before.

24
Factors that Affect Demand
Income:
Economists refer to goods like pizzas as “normal goods.”
When incomes increase, the demand for these goods increases. If income decreases . . .
This shift is referred to as a change in demand.

The Demand for pizzas
Q
Price
An Increase in Demand Resulting
from an Increase in Income
D0
Q0
P0
D1
Q1
25

26
Factors that Affect Demand
Income (cont.):
Alternatively, consider Top Ramen . . .
If my income increases, at any given price of Top Ramen, I will now want to purchase less than I did before.
Top Ramen is called an “inferior good.”
When incomes increase, the demand for these goods decreases. And vice versa.
Again, this shift is referred to as a change in demand.

The Demand for Top Ramen
Q
(Packages/wk)
Price
A Decrease in Demand Resulting
from an Increase in Income
D0
Q0
P0
D1
Q1
27
Summary
Key Concepts: Determinants of Consumer Choices
Demand curves
Law of demand
Factors that affect demand (price of the good of interest, incomes, prices of substitutes, prices of complements)
28

Summary An Important Distinction is:
Change in Quantity Demanded: A change in the price of a commodity causes a
movement along the demand curve, or a change in quantity demanded.
vs.
Change in Demand: An event other than a change in the price of a
commodity causes a shift in the demand curve, or a change in demand.
Incomes, prices of substitutes, prices of complements, etc.
29

The Theory of the Firm

The Theory of the Firm

Production Function
Production Function
States the relationship between inputs and outputs
Inputs – the factors of production classified as: Land – all natural resources of the earth – not just ‘terra
firma’!
Price paid to acquire land = Rent
Labour – all physical and mental human effort involved in production
Price paid to labour = Wages
Capital – buildings, machinery and equipment not used for its own sake but for the contribution it makes to production
Price paid for capital = Interest

Production Function
Inputs Process Output
Land
Labour
Capital
Product or
service generated
– value added

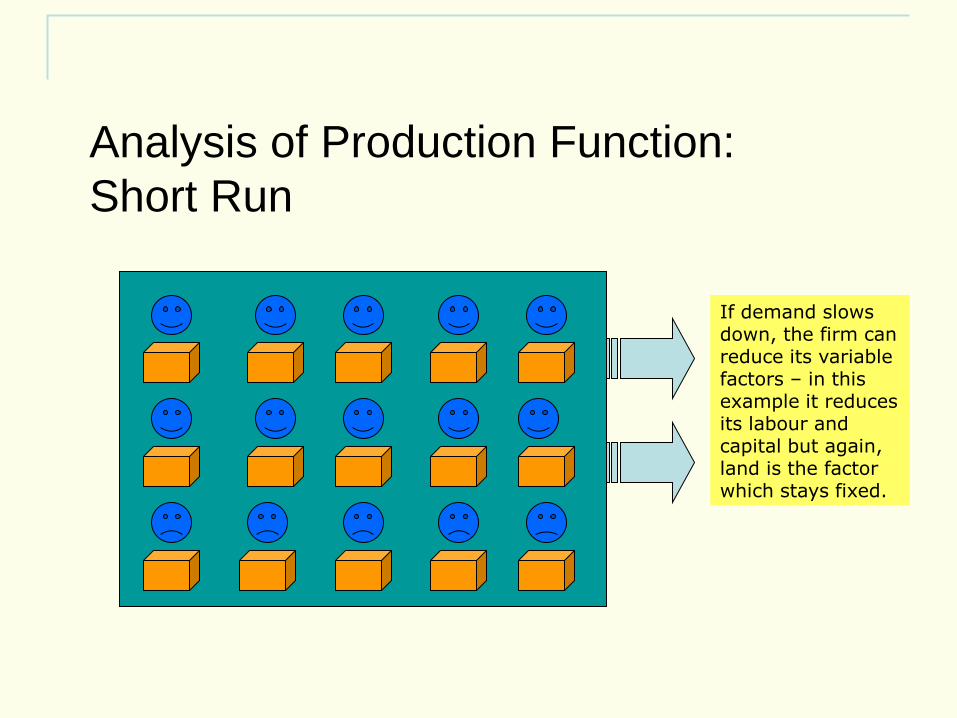
Analysis of Production Function:
Short Run
In the short run at least one factor fixed in supply but all other
factors capable of being changed
Reflects ways in which firms respond to changes
in output (demand)
Can increase or decrease output using more or less of some
factors but some likely to be easier
to change than others
Increase in total capacity only possible
in the long run

Analysis of Production Function:
Short Run
In times of rising sales (demand) firms can increase labour and capital but only up to a certain level – they will be limited by the amount of space. In this example, land is the fixed factor which cannot be altered in the short run.
Analysis of Production Function:
Short Run
If demand slows down, the firm can reduce its variable factors – in this example it reduces its labour and capital but again, land is the factor which stays fixed.

Analysis of Production Function:
Short Run
If demand slows down, the firm can reduce its variable factors – in this example, it reduces its labour and capital but again, land is the factor which stays fixed.

Analysing the Production Function:
Long Run
The long run is defined as the period of time taken to vary all factors of
production
By doing this, the firm is able to increase its total capacity – not
just short term capacity
Associated with a change in the scale of production
The period of time varies according to the firm
and the industry
In electricity supply, the time taken to build new capacity could be
many years; for a market stall holder, the ‘long run’ could be as little
as a few weeks or months!
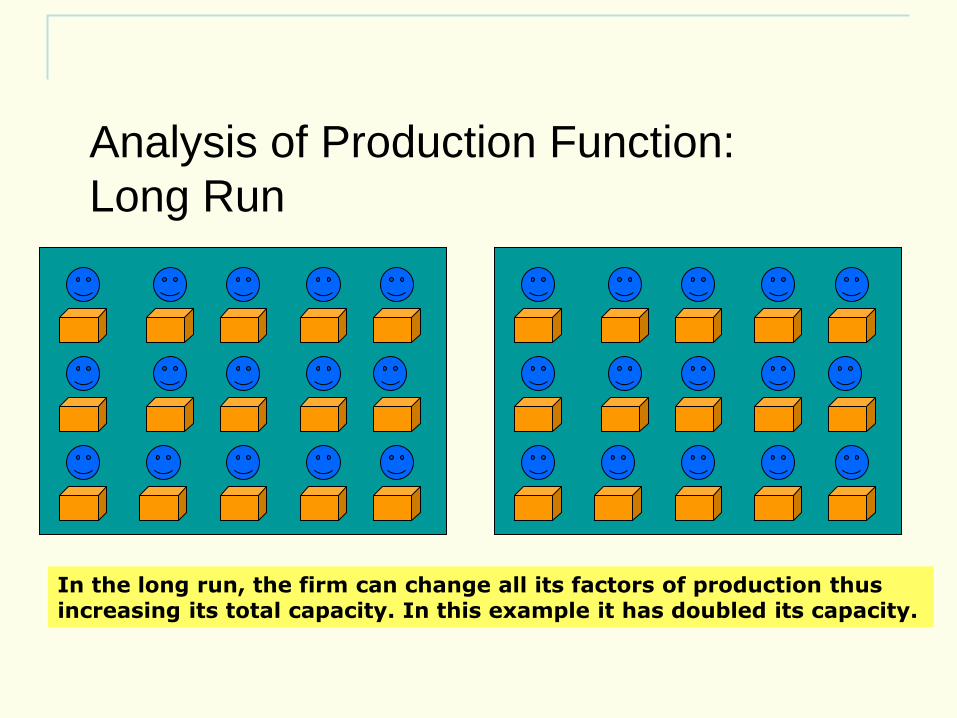
Analysis of Production Function:
Long Run
In the long run, the firm can change all its factors of production thus increasing its total capacity. In this example it has doubled its capacity.

Production Function
Mathematical representation
of the relationship:
Q = f (K, L, La)
Output (Q) is dependent upon the amount
of capital (K), Land (L) and Labour (La)
used

Costs

Costs
In buying factor inputs, the firm will incur costs
Costs are classified as: Fixed costs – costs that are not related directly to
production – rent, rates, insurance costs, admin costs. They can change but not in relation to output
Variable Costs – costs directly related to variations in output. Raw materials primarily

Costs
Total Cost - the sum of all costs incurred in production
TC = FC + VC
Average Cost – the cost per unit of output
AC = TC/Output
Marginal Cost – the cost of one more or one fewer units of production
MC = TCn – TCn-1 units

Costs
Short run – Diminishing marginal returns
results from adding successive quantities
of variable factors to a fixed factor
Long run – Increases in capacity can lead
to increasing, decreasing or constant
returns to scale

Revenue
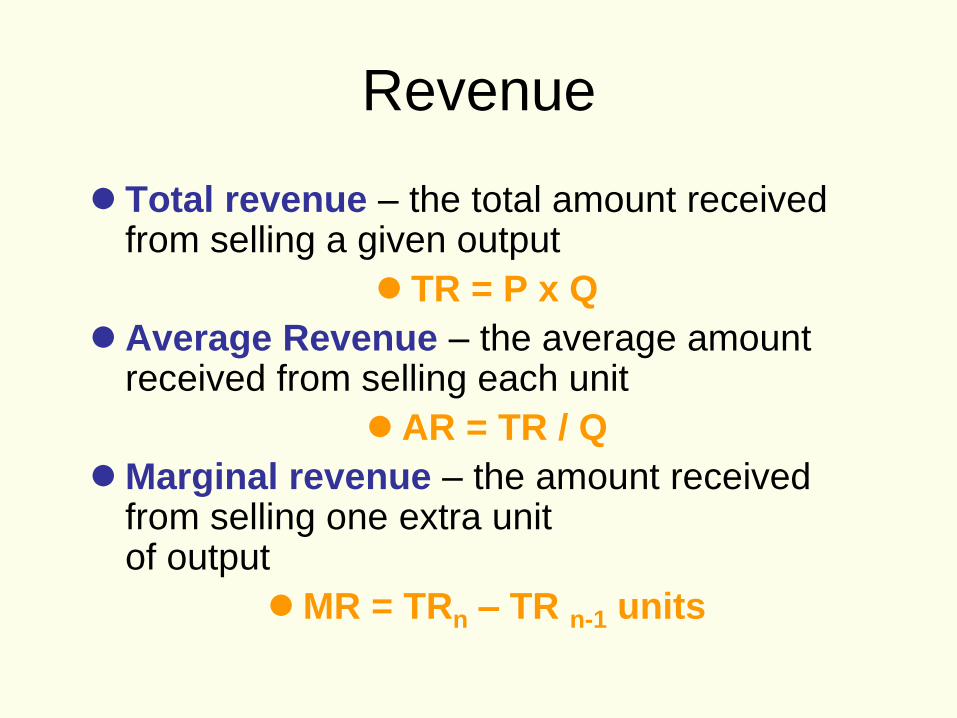
Revenue
Total revenue – the total amount received from selling a given output
TR = P x Q
Average Revenue – the average amount received from selling each unit
AR = TR / Q
Marginal revenue – the amount received from selling one extra unit of output
MR = TRn – TR n-1 units

Profit
Profit
Profit = TR – TC
The reward for enterprise
Profits help in the process of directing
resources to alternative uses in free
markets
Relating price to costs helps a firm to
assess profitability in production

Profit Normal Profit – the minimum amount
required to keep a firm in its current line of production
Abnormal or Supernormal profit – profit made over and above normal profit Abnormal profit may exist in situations where firms
have market power
Abnormal profits may indicate the existence of welfare losses
Could be taxed away without altering resource allocation

Profit
Sub-normal Profit – profit below normal
profit
Firms may not exit the market even if sub-
normal profits made if they are able to cover
variable costs
Cost of exit may be high
Sub-normal profit may be temporary (or
perceived as such!)

Profit
Assumption that firms aim to maximise
profit
May not always hold true –
there are other objectives