consumer behaviour in launceston – a survey design project · 3 abstract the current study was...
TRANSCRIPT
Market Research Report
CONSUMER BEHAVIOUR IN LAUNCESTON – A SURVEY
DESIGN PROJECT

2
Table of Contents
Abstract ........................................................................................................................... 3
Introduction ..................................................................................................................... 3
Method ............................................................................................................................ 4 Sample .................................................................................................................................... 5 Procedure ................................................................................................................................ 5 Measures ................................................................................................................................. 6
Results ............................................................................................................................. 6 Descriptive Statistics ................................................................................................................ 6 Inferential Statistics ............................................................................................................... 17
Age ............................................................................................................................................... 17 Gender ......................................................................................................................................... 20 Income Level ................................................................................................................................ 21 Age of Youngest Child .................................................................................................................. 23 Employment Status ..................................................................................................................... 23
Discussion ...................................................................................................................... 25 Age ........................................................................................................................................ 25 Gender .................................................................................................................................. 25 Income level .......................................................................................................................... 26 Age of Youngest Child ............................................................................................................ 26 Employment Status ................................................................................................................ 26 Other Findings ....................................................................................................................... 26
Conclusion ...................................................................................................................... 27
3
Abstract
The current study was designed to collect market data regarding Launceston consumer
behaviour habits. This study was conducted as part of an undergraduate business marketing
degree and was directed by Cityprom Launceston. The purpose of this research was to
identify key consumer behaviour information relating to Launceston Central Business
District (CBD) visitation, event/destination preferences, media usage, and online shopping
behaviour. This research was of a survey design, and was constructed on Survey Monkey.
The survey combined qualitative and quantitative data, and consisted of 32 questions of
varying format; including structured and unstructured question types. Surveys were
distributed via several mediums including Facebook, mall-intercept interviews,
call/email/SMS lists, and High School news sheets, and a number of sampling techniques
were utilised, including convenience sampling and quota sampling. The sample size for this
study was 382 participants. Key findings relate to the statistical effect of age, gender, income
level, age of youngest child, and employment status on various consumer behaviour
elements. A number of statistically significant relationships between these variables and
consumer behaviour elements were identified. Various conclusions were also drawn from
these findings, primarily relating to how to best use the identified demographic variables of
age, gender, and income level, as differentiating variables in future marketing efforts by
Cityprom or subsidiary businesses.
Introduction
The current study was conducted as part of an undergraduate research project in which
consumer behaviour data was gathered for the use of Cityprom Launceston and affiliated
businesses. The objective of the project was to conduct market research on key elements of
consumer behaviour in and around the Launceston region. It was intended that the findings be
used to assist Cityprom in measuring current activities, planning future activities, and to
better understand local market demands, preferences, and motives in consumer behaviour.
The primary elements of consumer behaviour that were identified and studied were; visitation
habits, purchase habits, event/destination attendance, media usage and responsiveness, and
online shopping habits. Data pertaining to the consumer behaviour habits of Launceston
consumers was primarily gathered by means of a survey, which was utilised as a method for

4
collecting a combination of qualitative and quantitative data from a large enough sample size
to obtain results that could be considered statistically significant. The sample size for this
study was 382 participants, which was also the amount calculated that would be required to
obtain results with a 95% confidence level (percentage that represents how often the true
percentage of the population who would pick an answer lies within the confidence interval)
and a confidence interval of 5 (also known as the margin of error, the plus-or-minus figure in
within which the data falls). This consequently suggests that there is 95% confidence that
results will fall within a range of +/-5 from the true population scores. The primary benefit
from this research for Cityprom relates to the larger scale of the study. With a much larger
sample size than that of studies that had previously been conducted by Cityprom, the results
are able to provide greater insights from data with heightened external validity.
Method
The research design selected was a survey method. This method was used as it allows a large
sample size to be examined, which in turn increases the representativeness of the Launceston
population. The survey was of moderate length, with 32 questions that consisted of a
combination of quantitative and qualitative data, so as to allow for information to be provided
that could easily be analysed and quantified, but also data that describes with greater detail
the opinions and views of respondents. I used a combination of multiple choice, short answer
and Likert Scale type items. These surveys were placed on an online survey distribution site,
Survey Monkey, which allows for the distribution of surveys and a low-detailed analysis of
results.
Respondents were given incentive to participate by offering a $200 voucher to one
respondent. In order to offer this prize, contact details were required from respondents. So, in
order to maintain anonymity of responses but also collect contact details, a link was added at
the end of the survey taking the participant to an alternate survey that just had contact
information. This allowed for the collection of every respondent’s contact information
without sacrificing the benefit of participant anonymity. Upon completion of surveys, data
was coded and inputted into IBM SPSS and various data analyses were conducted using
SPSS Statistics software.
5
Sample
The sampling method used throughout this research was most reflective of convenience
sampling, as respondents were generally gathered via Cityprom’s business network resources
in the form of their contact lists and Facebook ‘fans’. While allowing a greater response rate,
this caused a limitation in the study. As a result of Cityprom’s network not perfectly
reflective of the Launceston population as a whole, a slightly uneven representation of some
demographic factors arose. Males and people under the age of 18 were somewhat
underrepresented, however income, employment status, and age of youngest child were
evenly dispersed. A minority of responses were gathered via face-to-face surveying and high
school news sheets, which followed a quota sampling method. This method was implemented
in an effort to minimise some of the disproportionate demographic variables that arose,
namely an under-representation of males, those under 18 years of age, and those over 65
years of age.
The goal sample size was 382, which was calculated using the following equation, based on
an estimated Launceston population of 86,188:
with the following correction for a finite population:
(Where SS = Sample Size, Z = Given z value for 95% confidence, p = Percentage of
Population, C = Confidence Interval, Pop = Population).
Procedure
A number of distribution avenues were utilised. The majority of respondents were contacted
via several posts advertising the survey on Cityprom’s Facebook page, and subsequent
promotions of these posts. Surveys were also distributed via Cityprom’s email, SMS and call
lists, high-school news sheets, and mall-intercept style interviews. Surveys were most often
of a ‘self-completion’ design, with respondents completing surveys without direct
supervision from researchers. This ensured the maximisation of time-efficiency and a greater
likelihood of honest responses, but limited the study in that respondents may not have
followed procedure correctly or understood all instructions. A minority of responses were

6
gathered via mall-intercept style interviews, which were supervisory in nature, and were
beneficial in that they allowed for the usage of quota sampling to target specific
demographics that developed underrepresentation from the initial convenience sampling
method.
Measures
The survey comprised of a combination of open-ended, unstructured questions, structured
dichotomous questions, structured multiple choice questions, and structured scale-type
questions (primarily Likert Scales). A range of question styles was used to obtain a
combination of qualitative and quantitate data addressing the range of consumer behaviour
elements. Written response questions were used to allow for elaboration on opinions and
views, while quantitative questions were utilised to allow for statistical analysis of data.
Results
Descriptive Statistics
For the presentation of descriptive statistics, results from each survey question will be
presented alongside each question. Questions 3, 8, 10, 11, 14, 24, 26, 27 and 30 have been
intentionally excluded as they either produced ambiguous results, or too vast a range of
responses to analyse.
Q1. Age
Age of respondents was reasonably evenly distributed between 18-25 (15.22%), 26-35
(22.05%), 36-45 (26.77%), 46-55 (22.31%), and 56-64 (9.19%), but notable
underrepresentation was apparent in the <18 (2.1%) and 65+ (2.36%) age categories.
Q2. What is your gender?
There was a clear overrepresentation of females in the current study, with females
representing 81.94% of responses compared to the 18.06% representation of males.
Q4. What is the age of your youngest child?

7
A diverse range of family situations regarding age of youngest child was represented. Those
with no children made up 33.33% of responses, a youngest child aged 0-5 years comprised
23.54%, a youngest child aged 6-11 years comprised 12.17%, a youngest child aged 12-17
years comprised 8.99%, and a youngest child aged over 18 years comprised 21.96%.
Q5. What is your current employment status?
The majority of respondents (63.95%) identified as ‘employed’. This is considerably higher
than those who were considered ‘student’ (7.89%), ‘self-employed’ (11.05%), ‘unemployed’
(10.79%), or ‘retired’ (6.32%).
Q6. In which Weekly Personal Income (or Annual Personal Income) group do you belong?
The distribution of the Weekly Personal Income of respondents is demonstrated in the
following chart.

8
Q7. What are your reasons for visiting the Launceston Central Business District (CBD)?
The vast majority of respondents list ‘shopping’ as a reason they visit the CBD, with 90.05%
selecting this option. This was followed in popularity by ‘socialising’ (44.76%), ‘work’
(40.31%), and ‘hospitality’ (39.79%). Other options can be seen below.

9
Q9. What deters you from you visiting the Launceston CBD?
The most frequently selected elements that deter CBD visitation were parking expenses
(70.32%), anti-social behaviour (47.06%), and lack of interest in stores (28.07%). Other
elements can be seen below.
Q12. How frequently do you visit the Launceston CBD?
Visit frequency is displayed in the following table.
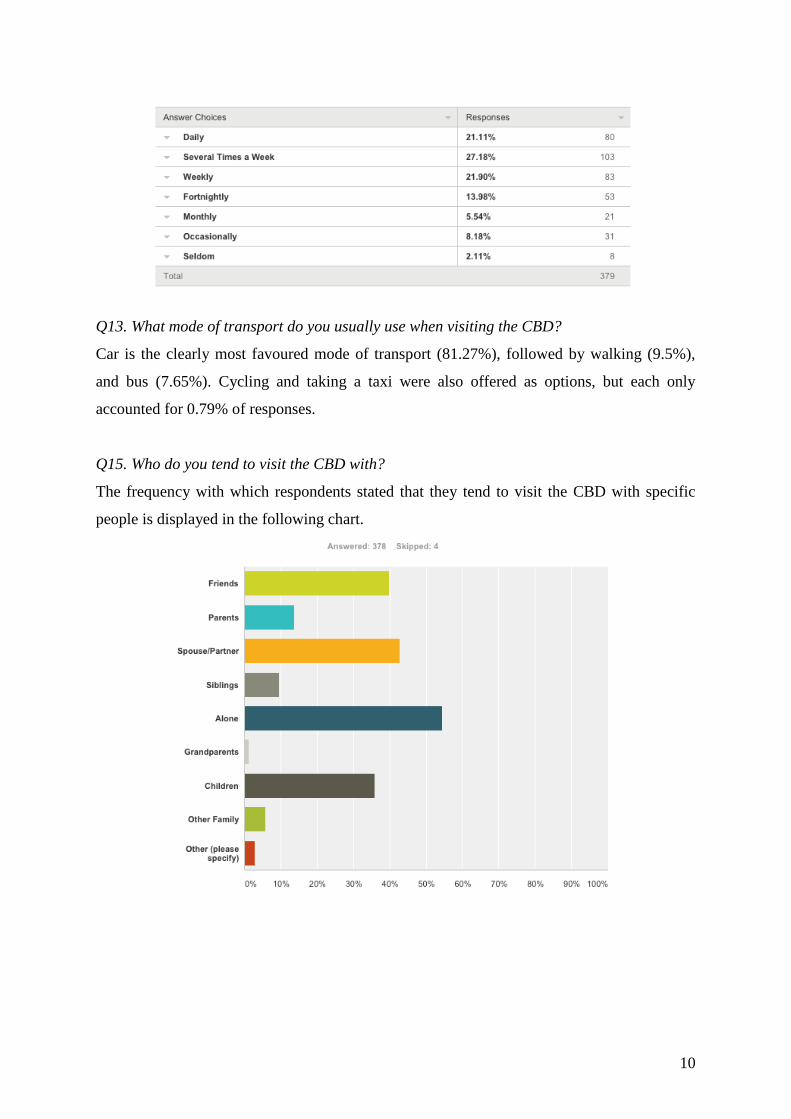
10
Q13. What mode of transport do you usually use when visiting the CBD?
Car is the clearly most favoured mode of transport (81.27%), followed by walking (9.5%),
and bus (7.65%). Cycling and taking a taxi were also offered as options, but each only
accounted for 0.79% of responses.
Q15. Who do you tend to visit the CBD with?
The frequency with which respondents stated that they tend to visit the CBD with specific
people is displayed in the following chart.

11
Q16. When you visit the CBD, you are likely to visit with different numbers of people during
different visits. How would you describe the frequency with which, during these visits, you
are with the following numbers of people?
Evidently, the frequency with which respondents visited the CBD with other people generally
decreased with each additional person that was added. This is apparent in the following chart.
Q17. How would you rate the following aspects of the Launceston CBD?
Ratings of various aspects of the CBD are displayed below. Generally, most ratings fell
around 3 (average), but parking costs (2.14/5) were rated the lowest, while access and
signage were rated the highest (3.26/5 and 3.25/5 respectively).
Q18. Which other locations in Launceston and surrounding areas do you go for shopping?

12
Of the locations mentioned by respondents, the most frequently mentioned were Kings
Meadows, Prospect, and Mowbray.
Q19. Which of the following types of products have you purchased from stores in the
Launceston CBD in the last 12 months?
The frequency with which various products were purchased in the last 12 months is displayed
below. The consider proportion of respondents stating to have purchased women’s clothing in
the last 12 months is likely to be a consequence of the overrepresentation of females in this
study.
Other products frequently mentioned include books, food, music and pharmacy items.
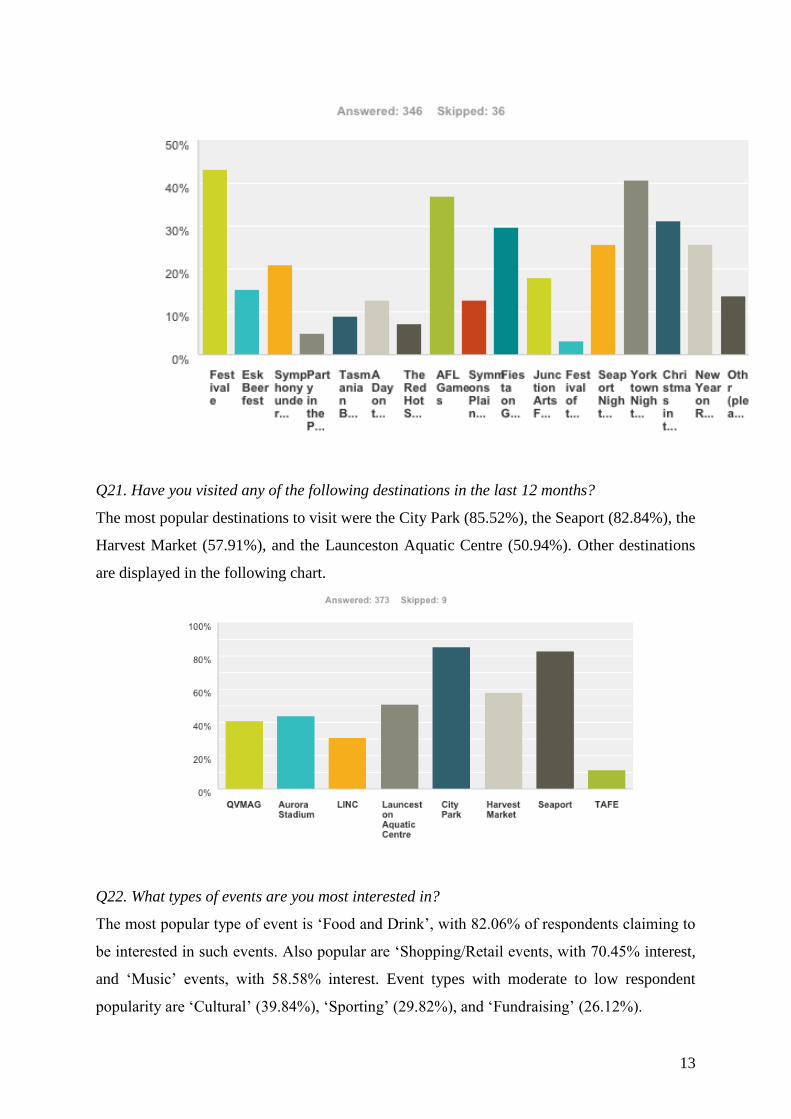
Q20. Which Launceston (and surrounding areas) events have you attended in the last 12
months?
The popularity of Launceston events is displayed below. Festive is the most popular event,
with an attendance rating of 43.35% of respondents. Other popular events include the
Yorktown Night Market (40.75%), AFL Games (36.99%), and Christmas in the City
(31.21%).
13
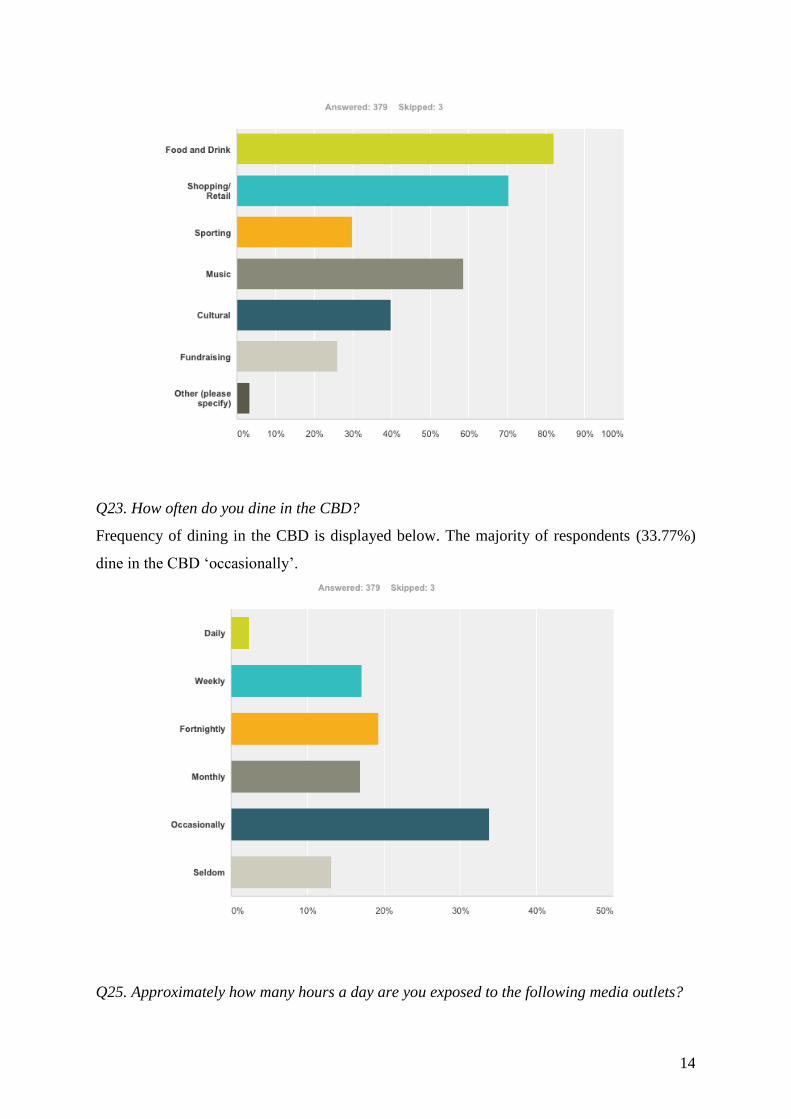
Q21. Have you visited any of the following destinations in the last 12 months?
The most popular destinations to visit were the City Park (85.52%), the Seaport (82.84%), the
Harvest Market (57.91%), and the Launceston Aquatic Centre (50.94%). Other destinations
are displayed in the following chart.
Q22. What types of events are you most interested in?
The most popular type of event is ‘Food and Drink’, with 82.06% of respondents claiming to
be interested in such events. Also popular are ‘Shopping/Retail events, with 70.45% interest,
and ‘Music’ events, with 58.58% interest. Event types with moderate to low respondent
popularity are ‘Cultural’ (39.84%), ‘Sporting’ (29.82%), and ‘Fundraising’ (26.12%).
14
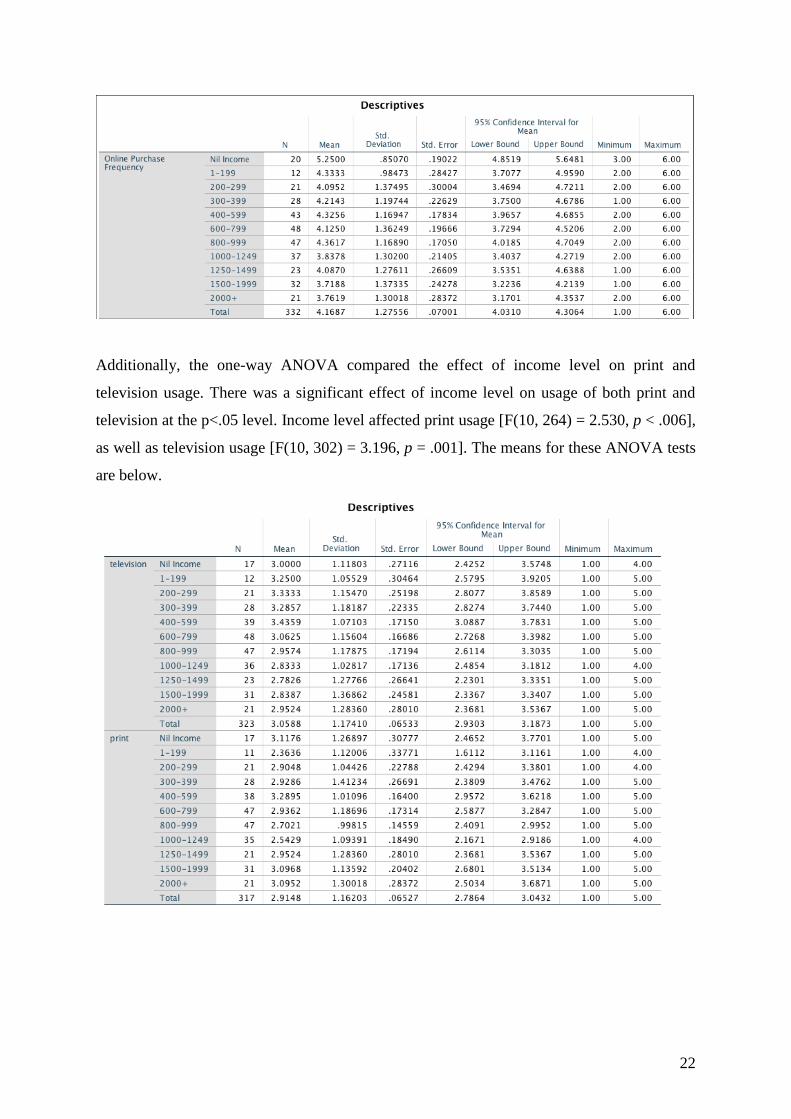
Q23. How often do you dine in the CBD?
Frequency of dining in the CBD is displayed below. The majority of respondents (33.77%)
dine in the CBD ‘occasionally’.
Q25. Approximately how many hours a day are you exposed to the following media outlets?

15
The following table displays the average number of hours per day respondents are exposed to
various media outlets.
Note- this data is coded as follows;
1.00 = “0 Hours” 6.00 = “2.5 Hours”
2.00 = “0.5 Hours” 7.00 = “3 Hours”
3.00 = “1 Hour” 8.00 = “3.5 Hours”
4.00 = “1.5 Hours” 9.00 = “4 Hours”
5.00 = “2 Hours” 10.00 = “4.5 Hours”
Therefore, the average exposure to radio is approximately 2 hours, television is 3 hours, print
is just under 1 hour, internet is just over 3.5 hours, and social media is just over 3 hours.
The following table suggests that these differences between means are statistically
significant.
Q28. How would you rate your responsiveness to advertising via these outlets?
Generally, respondents rated their responsiveness to social media as higher than their
responsiveness to other outlets. This is displayed in the following chart.

16
Q29. How frequently do you purchase products online?
The majority (37.87%) of respondents claimed that they purchase products online
‘occasionally’. Only 0.80% of respondents purchase products online daily. This is displayed
in the following chart.

17
Q31. What are the benefits of purchasing products online?
The most commonly mentioned benefits of purchasing products online include cheaper
prices, more choice, and convenience.
Q32. What are the benefits of purchasing products in-store?
The most commonly mentioned benefits of purchasing products in-store include
feeling/seeing the product, instant gratification, personal service, and supporting local
businesses.
Inferential Statistics
A number of statically analyses and tests were ran on the data to identify any relationships
between the variables. They will be described in terms of the the survey’s demographic
variables used to differentiate respondents.
Age
An Independent-Samples T-test was used to determine if there was a relationship between
age and ratings on other variables. For these tests, the two samples were defined at those aged
up to 35, and those aged over 35.
This test determined that older respondents were less likely (M=.200, SD=.401) than younger
respondents (M=.322, SD=.468) to visit the CBD to access professional services, t (378)
=2.618, p=.009. This suggests that younger people tend to visit the CBD for professional
services more than older persons.
Additionally, older respondents were less likely than younger respondents to signify interest
in cultural events (M=.317, SD=.467) compared to (M=.434, SD=.497).
There was also a statistically significant relationship between age and dining frequency.
Older respondents rated their frequency of dining (M=3.687, SD=1.448) as lower than that of
younger respondents (M=4.225, SD= 1.306).
Additionally, a one-way between-subjects ANOVA was conducted to compare the effect of
age on online shopping frequency. There was a significant effect of age on online shopping

18
frequency at the p<.05 level [F(6, 365) = 3.103, p = .006]. The means for each age group are
displayed below.
The one-way between-subjects ANOVA also compared the effect of age on CBD visitation
for nightlife. There was a significant effect of age on nightlife ratings at the p<.05 level [F(6,
371) = 2.237, p = .032]. The means for each age group are displayed below.
The one-way ANOVA also compared the effect of age on interest in sporting and music
events. There was a significant effect of age on interest in both sporting and music events at
the p<.05 level. Age affected interest in sporting events [F(6, 365) = 1.934, p = .010], as well
as in music events [F(6, 366) = 3.302 p = .004]. The means for each age group are displayed
below.

19
Additionally, the one-way ANOVA compared the effect of age responsiveness to print and
social media advertising. There was a significant effect of age on responsiveness to both print
and social media advertising at the p<.05 level. Age affected print responsiveness [F(6, 348)
= 4.417, p < .001], as well as social media responsiveness [F(6, 356) = 2.976 p = .008]. The
means for each age group are displayed below.

20
Finally, a Pearson’s bivariate correlation analysis determined that there was a moderate
negative correlation between age and social media usage, r (337) = -.316, p < .001. A weak
negative correlation between age and internet usage was also identified, r (330) = -.223, p <
.001. This suggest that older respondents tend to use social media and the internet less than
younger respondents.
There was also a weak positive correlation identified between age and print advertising
responsiveness, r (353) = .240, p < .001, and a weak negative correlation between age and
social media advertising responsiveness, r (361) = -.176 p = .001. this suggests that older
persons are likely to be more responsive to print advertising than younger respondents, but
less responsive to social media advertising.
Gender
An Independent Samples T-Test was conducted to compare the mean ratings of variables for
males compared to females. Unless otherwise stated, for these findings, the mean score
represents the proportion of each gender that selected ‘yes’ to the variable in question. This
analysis found the following;
Visiting the CBD for health and beauty was less frequent for males (M=.0735, SD=.263) as
compared to females (M= .2981, SD=.458), t (378) =-3.901, p < .001.
Purchasing electrical appliance responses were higher for males (M=.6377, SD=.484) than
females (M= .4887, SD=.500), t (376) =2.248, p = .025.
Purchasing sporting goods responses were higher for males (M=.4928, SD=.504) than
females (M= .3495, SD=.478), t (376) =2.230, p = .026.
Males (M=.4412, SD=.500) are less interested in shopping events than females (M=.7720,
SD=.420), t (373) = -5.665, p < .001.
Males (M=.6029, SD=.403) are more interested in sporting events than females (M=.2361,
SD=.425), t (371) = 6.241, p < .001.

21
Music events are more favoured by males (M=.7059, SD=.459) than by females (M=.5588,
SD=.497), t (372) = 2.236, p = .026.
Fundraising events are less favoured by males (M=.1493, SD=.359) than by females
(M=.2834, SD=.451), t (372) = -2.279, p = .023.
Television usage was lower for males (M=5.8065, SD=3.657) than for females (M=7.7324,
SD=3.809), t (350) = -2.598, p = .003. These mean scores represent the mean number of
hours spent per day exposed to television coded as follows;
1.00 = “0 Hours” 6.00 = “2.5 Hours”
2.00 = “0.5 Hours” 7.00 = “3 Hours”
3.00 = “1 Hour” 8.00 = “3.5 Hours”
4.00 = “1.5 Hours” 9.00 = “4 Hours”
5.00 = “2 Hours” 10.00 = “4.5 Hours”
Television advertising responsiveness was also lower for males (M=2.6716, SD=1.211) than
for females (M=3.1233, SD=1.157), t (350) = -2.598, p = .003. These mean scores represent
the mean rating of responsiveness on a 1-5 Likert scale.
Income Level
A Pearson bivariate correlation analysis was used to identify a number of relationships
between income level and other variables. There was a weak negative correlation between
income level and online shopping frequency, r (330) = -.211, p < .001. There was also a weak
negative correlation between income level and visitation frequency, r (333) = -.118, p = .031.
Finally, there was a weak negative correlation between income level and television usage, r
(321) = -.125, p < .024.
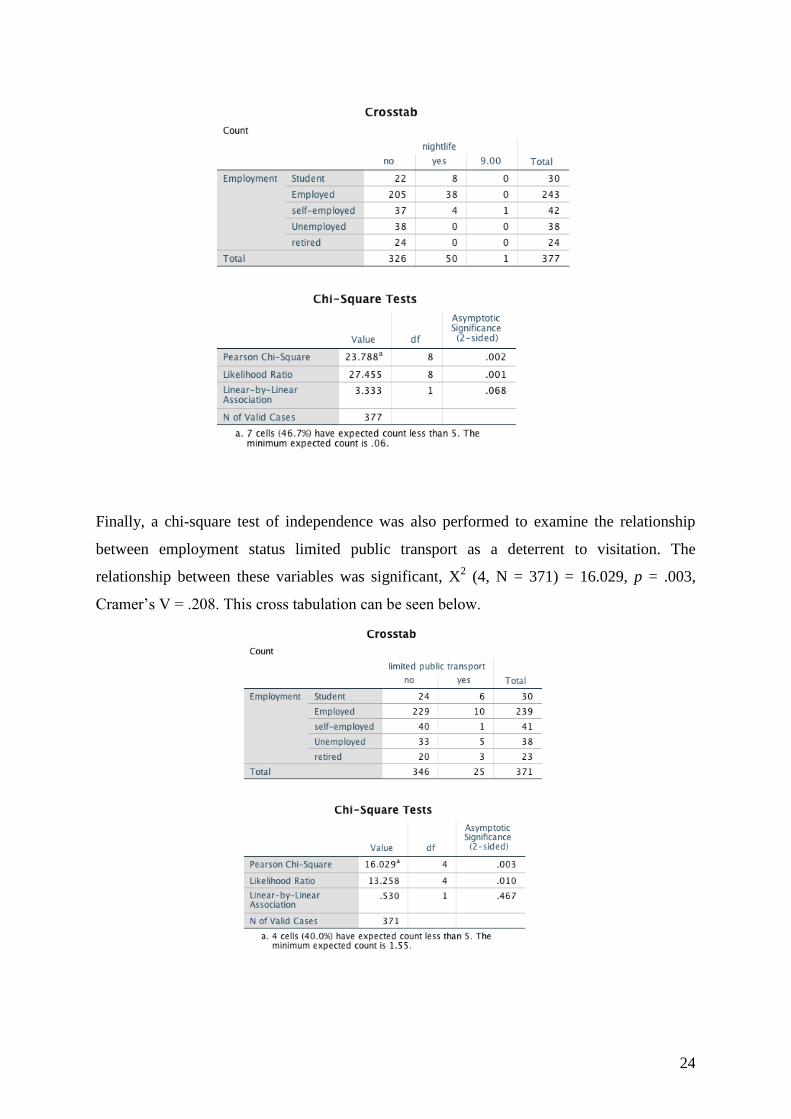
A one-way between-subjects ANOVA was also conducted to compare the effect of income
level on other variables to obtain support for the Pearson correlation findings. There was a
significant effect of income level on online shopping frequency at the p<.05 level [F(10, 321)
= 2.641, p = .004]. The means for each income level group are below.
22
Additionally, the one-way ANOVA compared the effect of income level on print and
television usage. There was a significant effect of income level on usage of both print and
television at the p<.05 level. Income level affected print usage [F(10, 264) = 2.530, p < .006],
as well as television usage [F(10, 302) = 3.196, p = .001]. The means for these ANOVA tests
are below.

23
Age of Youngest Child
A Pearson bivariate correlation analysis was used to identify a number of relationships
between age of youngest child and other variables. There was a weak negative correlation
between age of youngest child and visitation of the CBD for the purpose of shopping, r (248)
= -.242, p < .001. there was also a weak positive correlation between age of youngest child
and visitation of the CBD ‘by yourself’, r (238) = .267, p < .001, and a weak negative
correlation between age of youngest child and visitation of the CBD with 2-3 other people, r
(220) = -.217, p = .001.
Employment Status
From a cross tabulations analysis of the data, there were a number of statically significant
relationships identified between employment status and other variables. A chi-square test of
independence was performed to examine the relationship between employment status and
visitation frequency. The relationship between these variables was significant, X2 (28, N =
377) = 50.037, p = .006, Cramer’s V = .182. This cross tabulation can be seen below.
A chi-square test of independence was also performed to examine the relationship between
employment status and nightlife visitation. The relationship between these variables was
significant, X2 (8, N = 377) = 23.788, p = .002, Cramer’s V = .178. This cross tabulation can
be seen below.
24
Finally, a chi-square test of independence was also performed to examine the relationship
between employment status limited public transport as a deterrent to visitation. The
relationship between these variables was significant, X2 (4, N = 371) = 16.029, p = .003,
Cramer’s V = .208. This cross tabulation can be seen below.
25
Discussion
A number of important relationships have been identified between variables, they can be
categorised as relating to age, gender, income level, age of youngest child, and employment
status. For the discussion of findings, these categories will serve as sections
Age
Statistical analysis identified several variables that held a relationship with the age of
respondents. It was found that when categorised into two independent samples of ‘young’
and ‘old’, significant differences in means were found regarding usage of professional
services in the CBD, interest in cultural events, and frequency of dining. Further ANOVA
testing identified an effect of age on interest in music and sporting events, as well as on
responsiveness to print and social media advertising. This information is likely to be
beneficial in determining how to best market different event type and advertise to
differentiated target audiences based on age. These finding are also supported by Pearson
correlation evidence that suggests that age is negatively correlated with internet and social
media usage, as well as responsiveness to social media advertising.
Gender
A number of variables were identified to have statistically different mean scores between
males and females. These include health and beauty visitation, the purchase of sporting goods
and electric appliances, interest in sporting, shopping, fundraising, and music events, as well
as television usage and television advertising responsiveness. These identified variables may
provide insight into a number of product types that could successfully use gender as a
differentiation factor. Additionally, events have been identified which have a varying level of
interest based on gender. Thus, gender could be successfully used as a differentiation factor
in targeting the market. A trend towards differing television usage and responsiveness
between genders also provides information regarding how to best advertise gender-
differentiated events and products.

26
Income level
From analysis of varying income levels, several related variables have been identified. These
include online shopping frequency, CBD visitation frequency, and television usage. A
significant effect of income on print and television usage was also identified. These finding
may help in effectively targeting high or low income earners depending on the particular
product/event that is being marketed.
Age of Youngest Child
Age of youngest child was identified to be correlated with shopping frequency and the
number of people that respondents visited the CBD with. The statistically significance of
these finding suggests that consumers with young children may be an untapped segment of
the market that may be accessed if businesses work to make their stores/events more child
friendly or accessible.
Employment Status
Statistical analysis of the data identified a relationship between respondent employment
status and visitation frequency, nightlife visitation, and limited public transport as a deterrent
to visitation. These findings provide understanding of the effects of different employment
statuses on consumer behaviour.
Other Findings
A number of further findings can be gathered from the descriptive statistics. The most
frequently identified deterrents to CBD visitation were parking costs and anti-social
behaviour. These are likely to be important elements to draw attention to improving in order
to increase visitation. Parking expenses were also identified as the lowest rated element of
the CBD.
The types of events that are most popular are food/drink and shopping/retail, which are
currently very frequently held event types. The third highest interest score of the different
types of events was achieved by ‘music events’. This may present as an opportunity for an
event type to increase focus on. This is similar for cultural events.
27
Additionally, social media was identified as having a higher responsiveness than any other
media outlet. This presents an opportunity as increased advertising efforts via social media
may be beneficial in targeting a greater number of consumers. However, it must be noted
that, since the survey was predominantly advertised on social media, it would be expected
that those who took the survey are likely to be more responsive to social media. This possible
non-response bias must be considered when interpreting all results from the data relating to
media usage and responsiveness.
Conclusion
Using an in-depth survey research design, a substantial body of data has been gathered
providing information regarding consumer behaviour habits in Launceston. This survey,
designed to collect a combination of qualitative and quantitative data, consisted of
unstructured and structured questions; of which some were multiple choice, some
dichotomous, and some presented on scales. Through survey distribution via a number of
outlets including Facebook and subsequent post promotions, personal interviews, contact lists
and high school news sheets, the goal sample size of 382 respondents was reached. This
provided a plethora of data that was coded and inputted into SPSS for further data analysis.
This data, relating to CBD visitation habits, purchase habits, event/destination preferences,
media preferences, and online behaviour, was analysed using a number of statistical tests.
Through a range of Independent Sample T-Tests, Cross Tabulations, one-way ANOVAs,
Pearson Bivariate Correlation tests, and Chi-Square Tests of Independence, a number of
relationships between variables have been identified, providing a degree of organisation to
the data. This data has been reported and interpreted, and various threats and opportunities
have been briefly identified based on findings. Ultimately, this research study has provided
an overview and insight into how Launceston consumers behave in relation to the identified
behaviour variables.