consumer and market insights: prepared meals market in romania
TRANSCRIPT

1 1 1 1
Consumer and Market Insights: Prepared Meals Market in Romania
CS2004MF July 2015
Sample pages
Single User Price: US$1272

2 2 2
Summary
•The Romanian GDP growth revived during 2009-2014 as a result of structural measures and sound macro-economic
policies. Rise in GDP per capita would increase opportunities for packaged goods market. Prepared Meals consumption in
Romania is forecast to register growth at a CAGR of 7.5% during 2014-2019.
•Ready Meals with a 66.8% market share volume was the largest segment in the Prepared Meals category in 2014 and is
forecast to grow at a CAGR of 7.5% during 2014-2019.
•Bag/Sachet, the most commonly used container type accounted for 30.9% of the market share in 2014., followed by Tub
container type.
•The Romanian Prepared Meals market is competitive and a few of the players present are Contec Foods, Unilever PLC, Dr
August Oetker KG, Mandy Co, SC Scandia Food S.R.L
•The growing number of employed women and their increasingly busy lifestyles have spurred the demand for Prepared
Meals in recent years. For a work-life balance, many consumers resort to Prepared Meals so they can spend more time on
other more favorable activities
•The internet penetration rate in Romania is increasing along with mobile internet usage. This has encouraged
manufacturers to use digital social media platform to improve their reach among Romanian consumers. Prepared Meals
companies such as Mandy, have dedicated Facebook and Twitter accounts to promote products by engaging consumers in
conversations and posting interactive content such as links to their product commercials, and use of hash tags.
Scope
This report brings together multiple data sources to provide a comprehensive overview of the Prepared Meals sector in
Romania as part of our global coverage of the sector. This report draws on market data, analyzing value and volume data
and category and channel distribution breakdown, also highlighting which categories are witnessing the highest growth.
Brand analysis is also provided. It contains top line foodservice transaction figures highlighting where the most opportunistic
channels are for industry players in the country.
•The overall market value and volume data included in the report is for the period 2014-2019.
•This report provides information on three categories including Meal Kits, Pizza and Ready Meals.
•The report provides more extensive brand share coverage. Brand share data is also validated by inputs from industry
experts.
•The Distribution data included in the report covers 11 distribution channels including Cash & Carries & Warehouse Clubs,
“Dollar Stores”, Variety Stores & General Merchandise Retailers, Hypermarkets & Supermarkets, Convenience Stores
•Detailed packaging analysis is also provided, analyzing category trends and also packaging material and type.
3 3 3
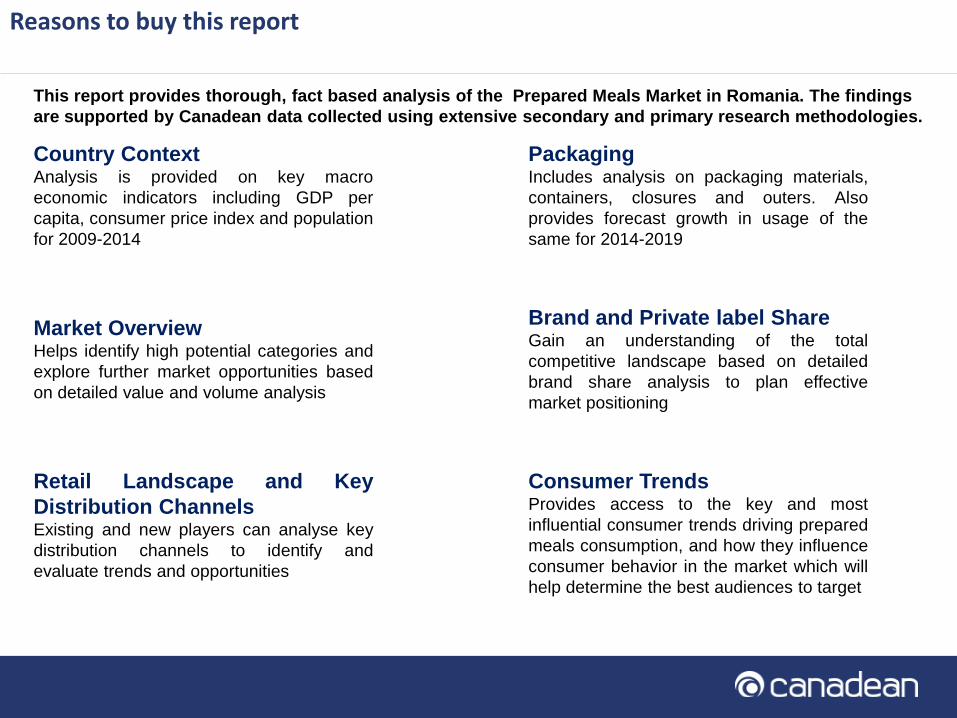
This report provides thorough, fact based analysis of the Prepared Meals Market in Romania. The findings
are supported by Canadean data collected using extensive secondary and primary research methodologies.
Reasons to buy this report
Country Context Analysis is provided on key macro
economic indicators including GDP per
capita, consumer price index and population
for 2009-2014
Market Overview Helps identify high potential categories and
explore further market opportunities based
on detailed value and volume analysis
Retail Landscape and Key
Distribution Channels Existing and new players can analyse key
distribution channels to identify and
evaluate trends and opportunities
Packaging Includes analysis on packaging materials,
containers, closures and outers. Also
provides forecast growth in usage of the
same for 2014-2019
Brand and Private label Share Gain an understanding of the total
competitive landscape based on detailed
brand share analysis to plan effective
market positioning
Consumer Trends Provides access to the key and most
influential consumer trends driving prepared
meals consumption, and how they influence
consumer behavior in the market which will
help determine the best audiences to target

4 4 4
Romania's Prepared Meals market is forecast to register moderate growth in value terms during 2014-2019
Market value of Romania’s Prepared Meals
market, 2009-2019
Market volume of Romania's Prepared Meals
market, (Millions of Kg), 2009-2019
CAGR 2009-2014 X.X%
CAGR 2014-2019 X.X%
•The Prepared Meals market in Romania registered high growth in value terms during 2009-2014. It grew at a
CAGR of X.X% in local currency terms during 2009-2014 and is forecast to grow at a slightly higher CAGR of
X.X% during 2014-2019.
•The volume consumption of Prepared Meals grew at a high CAGR of X.X% during 2009-2014 and is forecast to
register growth at a CAGR of X.X% during 2014-2019.
RON million US$ million
2009 XXX.X XXX.X
2014 XXX.X XXX.X
2019 XXXX.X XXX.X
CAGR 2009-2014 X.X% X.X%
CAGR 2014-2019 X.X% X.X%

5 5 5
The Ready Meals category is forecast to register fastest growth in value terms during 2014-2019
Market value of categories in Romania's Prepared Meals market
The Ready Meals category valued at RON XXX.Xmillion (US$XXX.X million) accounted for the largest value
consumption with XX.X% of the Prepared Meals market share in 2014. It will also register the fastest CAGR of
X.X% in local currency terms, during 2014-2019 and will be followed by the Meal Kits category with a CAGR of
X.X%.

6 6 6
Leading distribution channels–Overall Food
Prepared Meals as a percentage of overall Food:
Prepared Meals accounted for X.X% of food retail sales in
Romania in 2013.
Hypermarkets & Supermarkets, the leading distribution
channel in Romania’s food market accounted for XX.X%
of food retail sales in 2013 and was followed by
Convenience Stores with a XX.X% share. Hypermarkets
& Supermarkets also registered the fastest growth at a
CAGR of X.X% in local currency terms, during 2010-2013
followed by Food & Drinks Specialists with a CAGR of
X.X%.
Hypermarkets & Supermarkets is the leading distribution channel in
Romania’s Food market
Leading distribution channels in Romania’s Prepared Meals market, 2014
Leading distribution channels – Prepared Meals
Hypermarkets & Supermarkets, the leading distribution
channel in Romania’s Prepared Meals market
accounted for XX.X% of Prepared Meals distribution in
2014 and was followed by Convenience Stores with a
XX.X% share. Food & Drinks Specialists registered the
fastest growth at a CAGR of X.X% in local currency
terms during 2011-2014.
XX%
XX%
X% X%
Hypermarkets & Supermarkets
Convenience Stores
Food & Drinks Specialists
Others

7 7 7
Paper & Board is the most used packaging material while Tub is the most commonly used container type
Tub is the most commonly used container type in Ice
Cream market and accounted for XX.X% of the market
share in 2014
.
Paper & Board is majorly preferred for packaging
Artisanal Ice Cream in 2014.
Tub is mostly used for the packaging of Artisanal Ice
Cream and Impulse Ice Cream - Single Serve in 2014.
Key Packaging Materials Key Packaging Materials by category
Key Container Types Key Container Types by category
Paper & Board is the most used packaging material in
the Ice Cream market in Romania with XX.X% share in
2014.
Overview of Romania’s Prepared Meals market by type of packaging in 2014

8 8 8
This report features data derived from market data.
Market Data
In order to create the data for all reports in this series and ensure their robustness, a comprehensive and empirically robust research
methodology has been adopted. This combines both a large-scale program of industry research with the results of extensive primary
industry interviewing and calling. Furthermore, all definitions are standardized across products and countries to ensure comparability.
The two main research methods, secondary research and primary research (the program of interviewing industry contacts), are brought
together and because both sets of research processes have been designed in conjunction with each other they can be combined and
consolidated into the final, integrated data sets.
The secondary research process involves covering publicly available sources, trade associations, specialist databases, company annual
reports, and industry publications. Primary research involves a major program of interviewing leading industry executives for each category
covered in each country – all with local country experts; typically brand, product and marketing managers for major brands within each
country. These processes help analysts in capturing both qualitative and quantitative information about the market.
The final stage of the process is the triangulation of inputs obtained from all the research methods with the analyst’s own understanding of
the market in order to finalize the data. Once the data is finalized, it goes through various top level quality checks prior to publishing.
Methodology

9 9 9 20/07/2015 9 20-Jul-15 9 20-Jul-15 9 20-Jul-15 9
Related Reports
•Consumer and Market Insights: Prepared Meals Market in Poland
•Consumer and Market Insights: Prepared Meals Market in Sweden
•Consumer and Market Insights: Prepared Meals Market in Netherlands
•Consumer and Market Insights: Prepared Meals Market in Canada
•Consumer and Market Insights: Prepared Meals Market in Japan
•Consumer and Market Insights: Prepared Meals Market in South Africa

10 10 10 20/07/2015 10 20-Jul-15 10 20-Jul-15 10 20-Jul-15 10
Table of Contents
Introduction
• Report introduction and definitions
Market Overview
• Macroeconomic indicators – Population and age structure, GDP and Consumer Price Index
• National retail and foodservice figures – Key Takeouts
• Market value and volume for the Romania’s Prepared Meals market
• Historical and projected consumption in the Romania’s Prepared Meals market
• Degree of trade up/down-trade in the Romania’s Prepared Meals market
• Volume of Romania’s Prepared Meals market by category
• Historical and forecast value of Romania’s Prepared Meals market by category
• Winners and losers in the Romania’s Prepared Meals market
• Segment share of the category and change in market share in the Romania’s Prepared Meals market
• Category level pricing in the Romania’s Prepared Meals market
Retailer and packaging
• Leading retailers in the Romania’s Food market
• Leading distribution channels in the Romania’s Prepared Meals market
• Leading distribution channels by category in the Romania’s Prepared Meals market
• Romania’s Prepared Meals market by type of packaging material/container
• Romania’s Prepared Meals market by type of packaging closure/outer
• Romania’s Prepared Meals market by type of packaging, forecasted
• Leading brands in the Ireland’s Prepared Meals market by category

11 11 11 20/07/2015 11 20-Jul-15 11 20-Jul-15 11 20-Jul-15 11
Table of Contents
Consumer trend analysis
• Canadean’s consumer trend framework and explanation of the sub-trends
• For key trends in the Romania’s Prepared Meals market
• How the trend is influencing consumption in the Romania’s Prepared Meals market
• How to target the trend in the Romania’s Prepared Meals market
• How the trend will evolve in the Romania’s Prepared Meals market
• Key target demographic and the rate and which the trend will evolve
• Key drivers in the market that will increasingly influence consumption
Innovation examples
• New product examples launched in the Romania’s Prepared Meals market
Appendix
• Country context
• Sector overview
• Category data
• Segment data
• Packaging data
• Category definitions
• Segment definitions
• Channel definitions
• Methodology
• About Canadean

12 12 12
List of Figures
Figure 1: Macro economic analysis: GDP per capita, Population , CPI(2009-2014), Age Profile (2014)
Figure 2: Foodservice transactions by sectors, profit and cost, 2014
Figure 3: Market value (RON, USD) and volume analysis, 2009-2019
Figure 4: Consumers purchase behavior - Trading up/down, 2014
Figure 5: Market volume share analysis by categories, 2014
Figure 6: Growth analysis by category, 2009-2019
Figure 7: Change in market share by category, 2014-2019
Figure 8: Leading distribution channels, overall food, 2010-2013
Figure 9: Leading distribution channels by category, 2014
Figure 10: Packaging analysis – key packaging material, type, closure and outer, 2014
Figure 11: Growth in key packaging material, type, closure and outer, 2014-2019
Figure 12: Brand share growth, 2011-2014
Figure 13: Brand share analysis by categories, 2014
Figure 14: Examples - new product development
Table of Contents

13 13 13
List of tables
Table 1: Country indicators – overall food value and volume, 2014
Table 2: Market value analysis in RON and USD, 2009-2019
Table 3: Market volume growth analysis, 2014-2019
Table 4: Average prices (RON) by category, 2014
Table 5: Segment level analysis by category, 2014
Table 6: Leading retailers and store count
Table 7: Leading brands by category, 2014
Table of Contents