construction work done australia preliminary · vat value added tax tau ... mar qtr 17 091.5 3...
TRANSCRIPT

(a) Reference year for Chain Volume Measures is 2010-11.
–0.9–0.350 773.5Total construction
–2.1–0.230 598.9Engineering
–3.4–1.38 201.5 Non-residential
4.3–0.111 973.1 Residential
1.0–0.620 174.6Building
Value of work done
S E A S O N A L L Y A D J U S T E D E S T I M A T E S (a)
–1.1–1.050 715.9Total construction
–2.6–1.530 457.9Engineering
–2.1–0.58 263.3 Non-residential
3.80.112 029.2 Residential
1.3–0.120 291.5Building
Value of work doneT R E N D E S T I M A T E S (a)
% change% change$m
Jun qtr 12 toJun qtr 13
Mar qtr 13 toJun qtr 13Jun qtr 13
K E Y F I G U R E S
V A L U E O F W O R K D O N E , C H A I N V O L U M E M E A S U R E S
T O T A L C O N S T R U C T I O N
! The trend estimate for total construction work done fell 1.0% in the June quarter 2013.
! The seasonally adjusted estimate for total construction work done fell 0.3%, to
$50,773.5m in the June quarter.
B U I L D I N G W O R K D O N E
! The trend estimate for total building work done fell 0.1% in the June quarter.
! The trend estimate for non-residential building work done fell 0.5% in the June quarter.
! The seasonally adjusted estimate of total building work done fell 0.6%, to $20,174.6m, in
the June quarter.
E N G I N E E R I N G W O R K D O N E
! The trend estimate for engineering work done fell 1.5% in the June quarter.
! The seasonally adjusted estimate for engineering work done fell 0.2%, to $30,598.9m, in
the June quarter.
K E Y P O I N T S
E M B A R G O : 1 1 . 3 0 A M ( C A N B E R R A T I M E ) W E D 2 8 A U G 2 0 1 3
CONSTRUCTION WORK DONEA U S T R A L I A
P R E L I M I N A R Y
8755.0J U N E Q U A R T E R 2 0 1 3
For further informationabout these and relatedstatistics, contact theNational Information andReferral Service on1300 135 070.
Value of construction work done Chain Volume MeasuresTrend estimates
Jun2005
Jun2007
Jun2009
Jun2011
Jun2013
$m
9000
14000
19000
24000
29000
34000Total buildingEngineering Construction
Value of building work doneChain Volume MeasuresTrend estimates
Jun2005
Jun2007
Jun2009
Jun2011
Jun2013
$m
6000
8000
10000
12000
14000Residential buildingNon-Residential building
I N Q U I R I E S
w w w . a b s . g o v . a u

26 February 2014December 2013
27 November 2013September 2013
RELEASE DATEISSUE (Quarter)FO R T H C O M I N G I S S U E S
Trend estimates should be used with caution due to the volatility caused by large
engineering projects. For more details on trend estimates, please see paragraphs 24 to 26
of the explanatory notes.
DA T A NO T E S
There are no changes in this issue.CH A N G E S IN TH I S I S S U E
This publication provides an early indication of trends in building and engineering
construction activity. The data are estimates based on a response rate of approximately
85% of the value of both building and engineering work done during the quarter. More
comprehensive and updated results will be released in Engineering Construction
Activity, Australia (cat.no. 8762.0) on 2 October 2013 and in Building Activity, Australia
(cat. no. 8752.0) on 11 October 2013.
AB O U T TH I S I S S U E
Western AustraliaWA
VictoriaVic.
value added taxVAT
type of activity unitTAU
TasmaniaTas.
South AustraliaSA
QueenslandQld
quarterqtr
Northern TerritoryNT
New South WalesNSW
goods and services taxGST
AustraliaAust.
Australian Taxation OfficeATO
Australian and New Zealand Standard Industrial ClassificationANZSIC
Australian Capital TerritoryACT
Australian Bureau of StatisticsABS
Australian Business NumberABN
million dollars$mAB B R E V I A T I O N S
B r i a n P i n k
Au s t r a l i a n S t a t i s t i c i a n
2 A B S • CO N S T R U C T I O N W O R K D O N E • 8 7 5 5 . 0 • J U N 2 0 1 3
N O T E S
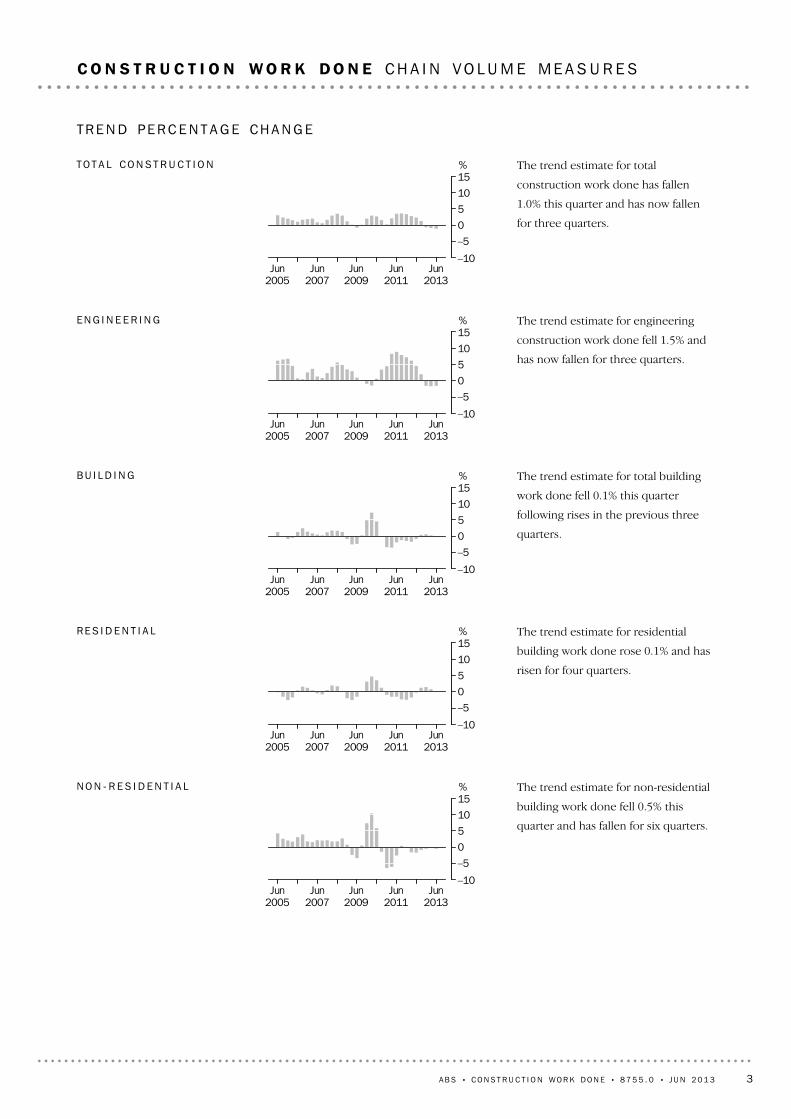
The trend estimate for non-residential
building work done fell 0.5% this
quarter and has fallen for six quarters.
Jun2005
Jun2007
Jun2009
Jun2011
Jun2013
%
–10
–5
0
5
10
15NO N - R E S I D E N T I A L
The trend estimate for residential
building work done rose 0.1% and has
risen for four quarters.
Jun2005
Jun2007
Jun2009
Jun2011
Jun2013
%
–10
–5
0
5
10
15RE S I D E N T I A L
The trend estimate for total building
work done fell 0.1% this quarter
following rises in the previous three
quarters.
Jun2005
Jun2007
Jun2009
Jun2011
Jun2013
%
–10
–5
0
5
10
15BU I L D I N G
The trend estimate for engineering
construction work done fell 1.5% and
has now fallen for three quarters.
Jun2005
Jun2007
Jun2009
Jun2011
Jun2013
%
–10
–5
0
5
10
15EN G I N E E R I N G
The trend estimate for total
construction work done has fallen
1.0% this quarter and has now fallen
for three quarters.
Jun2005
Jun2007
Jun2009
Jun2011
Jun2013
%
–10
–5
0
5
10
15TO T A L CO N S T R U C T I O N
TR E N D PE R C E N T A G E CH A N G E
A B S • CO N S T R U C T I O N W O R K D O N E • 8 7 5 5 . 0 • J U N 2 0 1 3 3
C O N S T R U C T I O N W O R K D O N E CH A I N V O L U M E ME A S U R E S

Construction work done in the
Northern Territory fell in June after
rises in the previous eight quarters.
Construction work done in the
Australian Capital Territory has fallen
for five quarters.Jun2005
Jun2007
Jun2009
Jun2011
Jun2013
$m
0
400
800
1200
1600Northern TerritoryAustralian Capital Territory
NO R T H E R N TE R R I T O R Y
AU S T R A L I A N CA P I T A L
TE R R I T O R Y
Construction work done in South
Australia has fallen after rises in the
previous four quarters.
Construction work done in Tasmania is
now showing a fall for three quarters.Jun
2005Jun
2007Jun
2009Jun
2011Jun
2013
$m
0
750
1500
2250
3000South AustraliaTasmania
SO U T H AU S T R A L I A
TA S M A N I A
Construction work done in
Queensland is now showing a fall for
two quarters.
Construction work done in Western
Australia was flat after falls in the
previous two quarters.Jun2005
Jun2007
Jun2009
Jun2011
Jun2013
$m
3000
6000
9000
12000
15000QueenslandWestern Australia
QU E E N S L A N D
WE S T E R N AU S T R A L I A
Construction work done in New South
Wales has fallen for two quarters.
Construction work done in Victoria has
fallen for three quarters.
Jun2005
Jun2007
Jun2009
Jun2011
Jun2013
$m
20004000600080001000012000
New South WalesVictoria
NE W SO U T H WA L E S
V I C T O R I A
CH A I N VO L U M E ME A S U R E S — T R E N D ES T I M A T E S
4 A B S • CO N S T R U C T I O N W O R K D O N E • 8 7 5 5 . 0 • J U N 2 0 1 3
C O N S T R U C T I O N W O R K D O N E S T A T E S A N D T E R R I T O R I E S

20Relative standard errors, building work done16 . . . . . . . . . . . . . . . . . . . .20Relative standard errors, states and territories15 . . . . . . . . . . . . . . . . . . .19
Value of building work done, current prices, change from previous
period
14. . . . . . . . . . . . . . . . . . . . . . . . . . . . . . . . . . . . . . . . . . . .
18Value of building work done, current prices13 . . . . . . . . . . . . . . . . . . . . .17
Value of building work done, chain volume measures, change from
previous period
12. . . . . . . . . . . . . . . . . . . . . . . . . . . . . . . . . . . . . .
16Value of building work done, chain volume measures11 . . . . . . . . . . . . . . .15
Construction work done, states and territories, current prices, original,
change from previous period
10. . . . . . . . . . . . . . . . . . . . . . . . . . . . . .
14Construction work done, states and territories, current prices, original9 . . . .13Construction work done, current prices, change from previous period8 . . . .12Construction work done, current prices7 . . . . . . . . . . . . . . . . . . . . . . .11
Construction work done, states and territories, chain volume
measures, original, change from previous period
6. . . . . . . . . . . . . . . . .
10
Construction work done, states and territories, chain volume
measures, original
5. . . . . . . . . . . . . . . . . . . . . . . . . . . . . . . . . . . . .
9
Construction work done, states and territories, chain volume
measures, change from previous period
4. . . . . . . . . . . . . . . . . . . . . . . .
8Construction work done, states and territories, chain volume measures3 . . . . .7
Construction work done, chain volume measures, change from
previous period
2. . . . . . . . . . . . . . . . . . . . . . . . . . . . . . . . . . . . . . .
6Construction work done, chain volume measures1 . . . . . . . . . . . . . . . . . .TA B L E S
page
A B S • CO N S T R U C T I O N W O R K D O N E • 8 7 5 5 . 0 • J U N 2 0 1 3 5
L I S T O F T A B L E S

(a) Reference year for Chain Volume Measures is 2010-11. Refer to paragraphs 27-31 of the Explanatory Notes.
50 715.910 060.940 661.730 457.97 579.122 883.420 291.52 486.417 807.6Jun Qtr51 250.410 162.541 086.330 933.67 644.023 289.120 315.92 518.017 796.8Mar Qtr
201351 681.910 338.541 341.331 431.87 762.023 669.020 249.72 575.717 672.5Dec Qtr52 018.410 576.441 441.631 903.97 897.024 006.920 114.52 679.517 434.7Sep Qtr51 302.210 839.740 462.531 271.87 962.623 309.220 030.32 877.117 153.3Jun Qtr50 100.511 026.439 074.429 891.57 908.221 983.420 209.43 117.717 091.5Mar Qtr
2012
TR E N D
50 773.510 045.240 727.430 598.97 553.123 045.820 174.62 492.017 681.7Jun Qtr50 945.710 109.140 835.830 648.77 579.423 069.320 297.12 529.817 766.5Mar Qtr
201351 954.510 460.541 493.431 448.67 908.023 540.720 505.92 552.517 952.7Dec Qtr52 042.210 332.341 709.432 109.77 666.624 443.119 932.62 665.717 266.3Sep Qtr51 230.011 063.340 167.131 259.98 191.423 068.519 970.12 871.817 098.6Jun Qtr50 876.310 986.439 890.030 562.87 869.122 693.620 313.53 117.217 196.4Mar Qtr
2012
SE A S O N A L L Y AD J U S T E D
52 148.811 064.841 084.031 919.18 530.123 389.020 229.72 534.717 695.0Jun Qtr47 053.89 439.537 614.328 525.87 061.121 464.718 528.12 378.416 149.6Mar Qtr
201354 073.310 549.943 523.432 632.87 882.324 750.521 440.52 667.618 772.9Dec Qtr52 470.79 880.342 590.431 742.47 234.924 507.620 728.32 645.518 082.8Sep Qtr52 862.112 119.240 742.932 833.79 193.723 640.020 028.42 925.517 102.9Jun Qtr46 929.810 268.036 661.828 388.97 333.621 055.318 540.92 934.415 606.5Mar Qtr
2012205 746.640 934.6164 812.1124 820.130 708.394 111.880 926.510 226.370 700.32012–13198 088.244 547.2153 541.0116 307.231 658.384 648.981 781.012 888.868 892.12011–12173 661.049 144.2124 516.886 047.530 904.955 142.687 613.518 239.369 374.22010–11
OR I G I N A L
$m$m$m$m$m$m$m$m$m
TotalPublicPrivateTotalPublicPrivateTotalPublicPrivate
CONSTRUCTION WORK DONEENGINEERING WORK DONEBUILDING WORK DONE
Per i od
CONSTRUCT ION WORK DONE, Cha in volume measures (a )1
6 A B S • CO N S T R U C T I O N W O R K D O N E • 8 7 5 5 . 0 • J U N 2 0 1 3

(a) Reference year for Chain Volume Measures is 2010-11. Refer to paragraphs 27-31 of the ExplanatoryNotes.
–1.0–1.0–1.0–1.5–0.8–1.7–0.1–1.30.1Jun Qtr–0.8–1.7–0.6–1.6–1.5–1.60.3–2.20.7Mar Qtr
2013–0.6–2.2–0.2–1.5–1.7–1.40.7–3.91.4Dec Qtr1.4–2.42.42.0–0.83.00.4–6.91.6Sep Qtr2.4–1.73.64.60.76.0–0.9–7.70.4Jun Qtr2.9–1.64.26.20.58.4–1.7–6.5–0.7Mar Qtr
2012
TR E N D
–0.3–0.6–0.3–0.2–0.3–0.1–0.6–1.5–0.5Jun Qtr–1.9–3.4–1.6–2.5–4.2–2.0–1.0–0.9–1.0Mar Qtr
2013–0.21.2–0.5–2.13.1–3.72.9–4.24.0Dec Qtr1.6–6.63.82.7–6.46.0–0.2–7.21.0Sep Qtr0.70.70.72.34.11.7–1.7–7.9–0.6Jun Qtr8.4–1.811.515.10.821.0–0.4–7.91.1Mar Qtr
2012
SE A S O N A L L Y AD J U S T E D
10.817.29.211.920.89.09.26.69.6Jun Qtr–13.0–10.5–13.6–12.6–10.4–13.3–13.6–10.8–14.0Mar Qtr
20133.16.82.22.88.91.03.40.83.8Dec Qtr
–0.7–18.54.5–3.3–21.33.73.5–9.65.7Sep Qtr12.618.011.115.725.412.38.0–0.39.6Jun Qtr–4.1–9.2–2.62.7–5.76.0–13.0–17.0–12.2Mar Qtr
20123.9–8.17.37.3–3.011.2–1.0–20.72.62012–13
14.1–9.423.335.22.453.5–6.7–29.3–0.72011–126.93.48.411.61.318.12.77.11.52010–11
OR I G I N A L
%%%%%%%%%
TotalPublicPrivateTotalPublicPrivateTotalPublicPrivate
CONSTRUCTIONWORK DONE
ENGINEERINGWORK DONEBUILDING WORK DONE
Per i od
CONSTRUCT ION WORK DONE, Cha in volume measures (a ) —Change from prev ious per iod2
A B S • CO N S T R U C T I O N W O R K D O N E • 8 7 5 5 . 0 • J U N 2 0 1 3 7

(a) Reference year for Chain Volume Measures is 2010-11. See paragraphs 27-31 of the Explanatory Notes.
50 715.9752.81 320.7506.113 358.72 489.213 410.98 467.410 348.1Jun Qtr51 250.4762.41 333.7528.013 357.42 510.313 450.08 694.010 584.3Mar Qtr
201351 681.9796.11 307.2557.313 489.62 507.413 450.38 857.810 764.2Dec Qtr52 018.4852.51 192.2574.414 044.82 489.713 294.98 920.010 715.5Sep Qtr51 302.2901.11 017.2567.814 038.32 470.713 067.88 916.610 355.2Jun Qtr50 100.5906.8869.3549.713 550.02 448.012 800.28 979.99 993.6Mar Qtr
2012
TR E N D
50 773.5749.91 310.4495.013 725.12 510.313 089.88 377.110 414.7Jun Qtr50 945.7752.21 218.1505.413 194.62 518.213 783.08 594.310 316.4Mar Qtr
201351 954.5817.91 523.1609.613 068.82 434.313 411.29 143.710 997.0Dec Qtr52 042.2788.71 082.4517.414 425.82 649.513 082.28 778.510 879.2Sep Qtr51 230.0968.01 041.0624.413 792.82 302.313 422.38 841.210 231.3Jun Qtr50 876.3901.1810.2515.514 658.52 546.812 385.39 072.49 877.5Mar Qtr
2012
SE A S O N A L L Y AD J U S T E D
52 148.8774.61 313.0526.913 835.92 751.213 603.28 519.810 824.2Jun Qtr47 053.8688.11 066.3472.512 425.12 367.912 581.17 762.29 690.5Mar Qtr
201354 073.3841.31 673.6639.013 738.42 495.513 804.29 584.611 296.8Dec Qtr52 470.7811.31 077.0489.514 417.72 486.413 325.99 030.010 833.0Sep Qtr52 862.1996.01 051.5659.714 051.72 516.613 890.59 032.510 663.6Jun Qtr46 929.8824.3719.2482.413 781.22 390.911 276.78 196.79 258.4Mar Qtr
2012205 746.63 115.25 129.92 128.054 417.110 101.053 314.334 896.642 644.62012–13198 088.23 562.13 304.52 233.852 968.19 782.550 192.736 063.139 981.42011–12173 661.03 491.12 145.32 518.038 007.810 183.041 714.635 729.339 871.92010–11
OR I G I N A L
$m$m$m$m$m$m$m$m$m
Aust.ACTNTTas.WASAQldVic.NSW
Per i od
CONSTRUCT ION WORK DONE, States and ter r i to r ies —Chain vo lume measures (a )3
8 A B S • CO N S T R U C T I O N W O R K D O N E • 8 7 5 5 . 0 • J U N 2 0 1 3

— nil or rounded to zero (including null cells)(a) Reference year for Chain Volume Measures is 2010-11. See paragraphs 27-31 of the
Explanatory Notes.
–1.0–1.3–1.0–4.2—–0.8–0.3–2.6–2.2Jun Qtr–0.8–4.22.0–5.3–1.00.1—–1.8–1.7Mar Qtr
2013–0.6–6.69.6–3.0–4.00.71.2–0.70.5Dec Qtr1.4–5.417.21.2—0.81.7—3.5Sep Qtr2.4–0.617.03.33.60.92.1–0.73.6Jun Qtr2.94.214.81.46.4–1.63.1–0.91.3Mar Qtr
2012
TR E N D
–0.3–0.37.6–2.14.0–0.3–5.0–2.51.0Jun Qtr–1.9–8.0–20.0–17.11.03.42.8–6.0–6.2Mar Qtr
2013–0.23.740.717.8–9.4–8.12.54.21.1Dec Qtr1.6–18.54.0–17.14.615.1–2.5–0.76.3Sep Qtr0.77.428.521.1–5.9–9.68.4–2.53.6Jun Qtr8.44.8–4.1–6.737.53.4–3.30.6–0.4Mar Qtr
2012
SE A S O N A L L Y AD J U S T E D
10.812.623.111.511.416.28.19.811.7Jun Qtr–13.0–18.2–36.3–26.1–9.6–5.1–8.9–19.0–14.2Mar Qtr
20133.13.755.430.5–4.70.43.66.14.3Dec Qtr
–0.7–18.62.4–25.82.6–1.2–4.1—1.6Sep Qtr12.620.846.236.82.05.323.210.215.2Jun Qtr–4.1–6.5–21.8–15.922.5–5.8–14.4–13.2–9.0Mar Qtr
20123.9–12.555.2–4.72.73.36.2–3.26.72012–13
14.12.054.0–11.339.4–3.920.30.90.32011–126.921.5–5.0–1.27.7—9.16.76.12010–11
OR I G I N A L
%%%%%%%%%
Aust.ACTNTTas.WASAQldVic.NSW
Per i od
CONSTRUCT ION WORK DONE, States and Ter r i to r ies —Chain vo lume measures (a ) —Change
from prev ious per iod4
A B S • CO N S T R U C T I O N W O R K D O N E • 8 7 5 5 . 0 • J U N 2 0 1 3 9

(a) Reference year for Chain Volume Measures is 2010-11. Refer to paragraphs 27-31 of the Explanatory Notes.
52 148.8774.61 313.0526.913 835.92 751.213 603.28 519.810 824.2Jun Qtr47 053.8688.11 066.3472.512 425.12 367.912 581.17 762.29 690.5Mar Qtr
201354 073.3841.31 673.6639.013 738.42 495.513 804.29 584.611 296.8Dec Qtr52 470.7811.31 077.0489.514 417.72 486.413 325.99 030.010 833.0Sep Qtr52 862.1996.01 051.5659.714 051.72 516.613 890.59 032.510 663.6Jun Qtr46 929.8824.3719.2482.413 781.22 390.911 276.78 196.79 258.4Mar Qtr
2012205 746.63 115.25 129.92 128.054 417.110 101.053 314.334 896.642 644.62012–13198 088.23 562.13 304.52 233.852 968.19 782.550 192.736 063.139 981.42011–12173 661.03 491.12 145.32 518.038 007.810 183.041 714.635 729.339 871.92010–11
CO N S T R U C T I O N WO R K DO N E
31 919.1203.2848.7275.810 824.71 572.59 827.72 537.65 828.9Jun Qtr28 525.8159.8691.5244.39 488.31 353.29 157.52 272.95 158.2Mar Qtr
201332 632.8184.81 283.9362.210 750.31 391.09 751.62 881.26 027.9Dec Qtr31 742.4168.0634.0196.111 284.41 375.69 505.92 660.15 918.4Sep Qtr32 833.7225.6637.8368.311 154.21 322.09 955.72 939.16 231.1Jun Qtr28 388.9169.2404.0202.610 748.41 148.87 667.32 784.85 263.8Mar Qtr
2012124 820.1715.73 458.01 078.342 347.75 692.338 242.710 351.822 933.52012–13116 307.2789.31 885.5975.340 459.84 784.134 202.211 519.221 691.82011–12
86 047.5768.9927.8959.825 189.44 669.823 872.911 188.918 469.92010–11
EN G I N E E R I N G WO R K DO N E
20 229.7571.4464.4251.13 011.21 178.73 775.45 982.24 995.3Jun Qtr18 528.1528.3374.8228.32 936.81 014.73 423.65 489.24 532.3Mar Qtr
201321 440.5656.5389.7276.92 988.11 104.54 052.56 703.45 268.9Dec Qtr20 728.3643.2443.0293.53 133.31 110.83 820.06 369.94 914.6Sep Qtr20 028.4770.5413.8291.42 897.51 194.63 934.86 093.44 432.5Jun Qtr18 540.9655.1315.2279.73 032.81 242.23 609.45 411.93 994.6Mar Qtr
201280 926.52 399.51 671.81 049.712 069.44 408.715 071.624 544.819 711.12012–1381 781.02 772.81 419.11 258.512 508.34 998.415 990.524 543.918 289.62011–1287 613.52 722.21 217.51 558.212 818.55 513.217 841.724 540.321 402.02010–11
BU I L D I N G WO R K DO N E
$m$m$m$m$m$m$m$m$m
Aust.ACTNTTas.WASAQldVic.NSW
Per i od
CONSTRUCT ION WORK DONE, States and ter r i to r ies —Chain vo lume measures (a ) : Or ig ina l5
10 A B S • CO N S T R U C T I O N W O R K D O N E • 8 7 5 5 . 0 • J U N 2 0 1 3

— nil or rounded to zero (including null cells)(a) Reference year for Chain Volume Measures is 2010-11. Refer to paragraphs 27-31 of the
Explanatory Notes.
10.812.623.111.511.416.28.19.811.7Jun Qtr–13.0–18.2–36.3–26.1–9.6–5.1–8.9–19.0–14.2Mar Qtr
20133.13.755.430.5–4.70.43.66.14.3Dec Qtr
–0.7–18.62.4–25.82.6–1.2–4.1—1.6Sep Qtr12.620.846.236.82.05.323.210.215.2Jun Qtr–4.1–6.5–21.8–15.922.5–5.8–14.4–13.2–9.0Mar Qtr
20123.9–12.555.2–4.72.73.36.2–3.26.72012–13
14.12.054.0–11.339.4–3.920.30.90.32011–126.921.5–5.0–1.27.7—9.16.76.12010–11
CO N S T R U C T I O N WO R K DO N E
11.927.122.712.914.116.27.311.613.0Jun Qtr–12.6–13.5–46.1–32.6–11.7–2.7–6.1–21.1–14.4Mar Qtr
20132.810.0102.584.7–4.71.12.68.31.8Dec Qtr
–3.3–25.5–0.6–46.81.24.1–4.5–9.5–5.0Sep Qtr15.733.357.981.73.815.129.85.518.4Jun Qtr
2.7–14.2–27.1–9.133.8–6.7–15.0–9.5–0.6Mar Qtr2012
7.3–9.383.410.64.719.011.8–10.15.72012–1335.22.6103.21.660.62.443.33.017.42011–1211.685.8–21.6–3.46.3–2.420.614.312.02010–11
EN G I N E E R I N G WO R K DO N E
9.28.223.910.02.516.210.39.010.2Jun Qtr–13.6–19.5–3.8–17.5–1.7–8.1–15.5–18.1–14.0Mar Qtr
20133.42.1–12.0–5.7–4.6–0.66.15.27.2Dec Qtr3.5–16.57.10.78.1–7.0–2.94.510.9Sep Qtr8.017.631.34.2–4.5–3.89.012.611.0Jun Qtr
–13.0–4.3–13.8–20.2–5.7–5.0–12.9–15.0–18.0Mar Qtr2012
–1.0–13.517.8–16.6–3.5–11.8–5.7—7.82012–13–6.71.916.5–19.2–2.4–9.3–10.4—–14.52011–122.710.713.50.310.52.2–3.33.41.52010–11
BU I L D I N G WO R K DO N E
%%%%%%%%%
Aust.ACTNTTas.WASAQldVic.NSW
Per i od
CONSTRUCT ION WORK DONE, States and ter r i to r ies —Chain vo lume measures (a ) :
Or ig ina l —Change from prev ious per iod6
A B S • CO N S T R U C T I O N W O R K D O N E • 8 7 5 5 . 0 • J U N 2 0 1 3 11

52 443.410 623.041 820.331 750.78 130.923 619.820 692.62 492.218 200.5Jun Qtr52 754.210 693.342 060.932 142.48 173.323 969.120 611.72 520.018 091.7Mar Qtr
201353 017.810 839.142 178.732 556.18 261.724 294.420 461.62 577.317 884.3Dec Qtr53 255.611 048.442 207.232 989.28 365.024 624.120 266.42 683.417 583.0Sep Qtr52 453.511 263.441 190.132 292.68 378.023 914.620 160.92 885.317 275.5Jun Qtr51 072.411 366.139 706.330 731.68 237.522 494.220 340.83 128.617 212.2Mar Qtr
2012
TR E N D
52 530.310 613.841 916.531 928.88 111.423 817.420 601.52 502.318 099.1Jun Qtr52 542.810 645.541 897.331 966.18 115.623 850.420 576.72 529.918 046.9Mar Qtr
201353 621.110 949.842 671.332 920.38 399.824 520.520 700.92 550.018 150.8Dec Qtr53 360.210 793.842 566.533 258.68 122.225 136.420 101.72 671.617 430.0Sep Qtr52 460.611 523.140 937.532 364.28 638.923 725.320 096.42 884.217 212.2Jun Qtr51 783.511 311.040 472.531 359.28 189.923 169.320 424.33 121.117 303.2Mar Qtr
2012
SE A S O N A L L Y AD J U S T E D
53 979.711 703.642 276.133 331.39 153.524 177.820 648.42 550.118 098.3Jun Qtr48 526.69 941.838 584.829 748.87 559.522 189.318 777.92 382.316 395.5Mar Qtr
201355 743.911 039.844 704.134 104.48 370.225 734.221 639.52 669.518 970.0Dec Qtr53 730.210 326.843 403.332 830.67 671.225 159.420 899.62 655.618 244.0Sep Qtr54 095.912 641.641 454.333 943.99 705.324 238.720 152.02 936.317 215.6Jun Qtr47 706.210 583.937 122.229 065.17 646.921 418.218 641.02 937.015 704.0Mar Qtr
2012211 980.443 012.0168 968.4130 015.132 754.597 260.781 965.210 257.571 707.72012–13201 250.545 815.0155 435.4118 897.832 876.786 021.182 352.612 938.469 414.32011–12173 661.049 144.2124 516.886 047.530 904.955 142.687 613.518 239.369 374.22010–11
OR I G I N A L
$m$m$m$m$m$m$m$m$m
TotalPublicPrivateTotalPublicPrivateTotalPublicPrivate
CONSTRUCTION WORK DONEENGINEERING WORK DONEBUILDING WORK DONE
Per i od
CONSTRUCT ION WORK DONE, Cur rent pr i ces7
12 A B S • CO N S T R U C T I O N W O R K D O N E • 8 7 5 5 . 0 • J U N 2 0 1 3

— nil or rounded to zero (including null cells)
–0.6–0.7–0.6–1.2–0.5–1.50.4–1.10.6Jun Qtr–0.5–1.3–0.3–1.3–1.1–1.30.7–2.21.2Mar Qtr
2013–0.4–1.9–0.1–1.3–1.2–1.31.0–4.01.7Dec Qtr1.5–1.92.52.2–0.23.00.5–7.01.8Sep Qtr2.7–0.93.75.11.76.3–0.9–7.80.4Jun Qtr3.3–0.74.57.01.79.1–1.8–6.6–0.8Mar Qtr
2012
TR E N D
—–0.3—–0.1–0.1–0.10.1–1.10.3Jun Qtr–2.0–2.8–1.8–2.9–3.4–2.7–0.6–0.8–0.6Mar Qtr
20130.51.40.2–1.03.4–2.53.0–4.64.1Dec Qtr1.7–6.34.02.8–6.05.9—–7.41.3Sep Qtr1.31.91.13.25.52.4–1.6–7.6–0.5Jun Qtr8.6–1.111.615.52.021.3–0.7–8.30.8Mar Qtr
2012
SE A S O N A L L Y AD J U S T E D
11.217.79.612.021.19.010.07.010.4Jun Qtr–12.9–9.9–13.7–12.8–9.7–13.8–13.2–10.8–13.6Mar Qtr
20133.76.93.03.99.12.33.50.54.0Dec Qtr
–0.7–18.34.7–3.3–21.03.83.7–9.66.0Sep Qtr13.419.411.716.826.913.28.1—9.6Jun Qtr–4.0–8.6–2.63.1–4.76.2–13.3–17.4–12.4Mar Qtr
20125.3–6.18.79.4–0.413.1–0.5–20.73.32012–13
15.9–6.824.838.26.456.0–6.0–29.10.12011–129.05.910.313.24.219.05.19.04.12010–11
OR I G I N A L
%%%%%%%%%
TotalPublicPrivateTotalPublicPrivateTotalPublicPrivate
CONSTRUCTIONWORK DONE
ENGINEERINGWORK DONEBUILDING WORK DONE
Per i od
CONSTRUCT ION WORK DONE, Cur ren t pr ices —Change from prev ious per iod8
A B S • CO N S T R U C T I O N W O R K D O N E • 8 7 5 5 . 0 • J U N 2 0 1 3 13
53 979.7798.21 344.3538.214 272.22 857.714 016.38 763.511 389.3Jun Qtr48 526.6705.21 094.5482.612 795.62 447.712 929.67 913.410 158.0Mar Qtr
201355 743.9857.81 729.2653.514 189.92 567.214 240.99 711.011 794.3Dec Qtr53 730.2824.81 100.4494.914 739.92 544.113 653.39 114.411 258.3Sep Qtr54 095.91 012.21 072.1678.314 370.92 568.714 194.49 154.111 045.3Jun Qtr47 706.2836.5729.0490.813 975.22 421.211 432.08 305.69 515.9Mar Qtr
2012211 980.43 185.95 268.52 169.355 997.610 416.754 840.135 502.444 599.92012–13201 250.53 617.93 350.42 274.153 660.09 889.050 845.536 567.541 046.12011–12173 661.03 491.12 145.32 518.038 007.810 183.041 714.635 729.339 871.92010–11
CO N S T R U C T I O N WO R K DO N E
33 331.3223.6873.3295.011 206.61 670.410 169.52 707.46 185.6Jun Qtr29 748.8176.0718.7261.69 832.11 427.19 456.12 421.05 456.2Mar Qtr
201334 104.4200.41 337.8384.211 187.11 459.810 133.13 045.56 356.5Dec Qtr32 830.6180.5657.9207.111 589.21 433.49 774.92 790.56 197.2Sep Qtr33 943.9241.6654.6388.511 463.71 375.610 229.23 087.06 503.7Jun Qtr29 065.1178.7412.8211.110 938.31 187.77 796.62 899.25 440.7Mar Qtr
2012130 015.1780.53 587.71 147.843 815.05 990.739 533.710 964.424 195.52012–13118 897.8829.81 925.41 015.941 148.24 922.534 740.811 928.922 386.32011–12
86 047.5768.9927.8959.825 189.44 669.823 872.911 188.918 469.92010–11
EN G I N E E R I N G WO R K DO N E
20 648.4574.6471.1243.23 065.61 187.33 846.76 056.15 203.7Jun Qtr18 777.9529.2375.8221.02 963.51 020.63 473.55 492.44 701.8Mar Qtr
201321 639.5657.3391.4269.43 002.81 107.44 107.86 665.55 437.8Dec Qtr20 899.6644.3442.4287.83 150.71 110.83 878.46 324.05 061.2Sep Qtr20 152.0770.6417.5289.82 907.21 193.13 965.26 067.04 541.6Jun Qtr18 641.0657.9316.1279.63 036.81 233.53 635.55 406.44 075.2Mar Qtr
201281 965.22 405.51 680.81 021.512 182.64 426.015 306.524 538.020 404.42012–1382 352.62 788.11 424.91 258.212 511.84 966.516 104.724 638.618 659.82011–1287 613.52 722.21 217.51 558.212 818.55 513.217 841.724 540.321 402.02010–11
BU I L D I N G WO R K DO N E
$m$m$m$m$m$m$m$m$m
Aust.ACTNTTas.WASAQldVic.NSW
Per i od
CONSTRUCT ION WORK DONE, States and ter r i to r ies —Curren t pr ices : Or ig ina l9
14 A B S • CO N S T R U C T I O N W O R K D O N E • 8 7 5 5 . 0 • J U N 2 0 1 3

— nil or rounded to zero (including null cells)
11.213.222.811.511.516.78.410.712.1Jun Qtr–12.9–17.8–36.7–26.2–9.8–4.7–9.2–18.5–13.9Mar Qtr
20133.74.057.132.0–3.70.94.36.54.8Dec Qtr
–0.7–18.52.6–27.02.6–1.0–3.8–0.41.9Sep Qtr13.421.047.138.22.86.124.210.216.1Jun Qtr–4.0–6.5–21.7–15.922.8–5.5–14.1–13.5–8.6Mar Qtr
20125.3–11.957.3–4.64.45.37.9–2.98.72012–13
15.93.656.2–9.741.2–2.921.92.32.92011–129.024.6–3.02.28.31.810.011.58.42010–11
CO N S T R U C T I O N WO R K DO N E
12.027.021.512.814.017.07.511.813.4Jun Qtr–12.8–12.2–46.3–31.9–12.1–2.2–6.7–20.5–14.2Mar Qtr
20133.911.1103.385.5–3.51.83.79.12.6Dec Qtr
–3.3–25.30.5–46.71.14.2–4.4–9.6–4.7Sep Qtr16.835.258.684.04.815.831.26.519.5Jun Qtr
3.1–13.6–27.0–8.934.0–6.1–14.7–8.5—Mar Qtr2012
9.4–5.986.313.06.521.713.8–8.18.12012–1338.27.9107.55.863.45.445.56.621.22011–1213.290.2–20.7–0.47.4–0.621.917.314.12010–11
EN G I N E E R I N G WO R K DO N E
10.08.625.310.13.416.310.710.310.7Jun Qtr–13.2–19.5–4.0–18.0–1.3–7.8–15.4–17.6–13.5Mar Qtr
20133.52.0–11.5–6.4–4.7–0.35.95.47.4Dec Qtr3.7–16.46.0–0.78.4–6.9–2.24.211.4Sep Qtr8.117.132.03.6–4.3–3.39.112.211.4Jun Qtr
–13.3–4.4–13.7–20.5–5.5–4.9–13.0–15.9–17.9Mar Qtr2012
–0.5–13.718.0–18.8–2.6–10.9–5.0–0.49.32012–13–6.02.417.0–19.3–2.4–9.9–9.70.4–12.82011–125.113.516.93.810.23.9–2.79.03.82010–11
BU I L D I N G WO R K DO N E
%%%%%%%%%
Aust.ACTNTTas.WASAQldVic.NSW
Per i od
CONSTRUCT ION WORK DONE, States and ter r i to r ies —Curren t pr ices : Or ig ina l —Change
from prev ious per iod10
A B S • CO N S T R U C T I O N W O R K D O N E • 8 7 5 5 . 0 • J U N 2 0 1 3 15

(a) Reference year for chain volume measures is 2010-11. Refer to paragraphs 27-31 of the Explanatory Notes.
20 291.517 807.68 263.35 980.012 029.211 827.61 716.21 675.610 313.210 152.2Jun Qtr20 315.917 796.88 300.85 998.312 015.011 798.51 711.61 671.710 303.410 126.8Mar Qtr
201320 249.717 672.58 326.65 979.811 922.611 692.71 718.01 677.710 204.510 014.9Dec Qtr20 114.517 434.78 370.85 940.711 743.711 494.11 738.11 696.510 005.69 797.6Sep Qtr20 030.317 153.38 437.75 847.911 592.711 305.41 781.01 734.59 811.79 570.9Jun Qtr20 209.417 091.58 580.85 800.011 628.411 291.61 841.71 787.79 786.79 503.9Mar Qtr
2012
TR E N D
20 174.617 681.78 201.55 908.211 973.111 773.51 753.71 711.710 219.410 061.8Jun Qtr20 297.117 766.58 311.75 993.111 985.311 773.41 658.91 620.610 326.410 152.8Mar Qtr
201320 505.917 952.78 430.16 120.912 075.811 831.91 748.21 707.310 327.610 124.6Dec Qtr19 932.617 266.38 216.95 787.611 715.711 478.71 734.41 693.69 981.39 785.0Sep Qtr19 970.117 098.68 486.95 890.911 483.211 207.71 767.81 720.59 715.39 487.1Jun Qtr20 313.517 196.48 648.85 894.311 664.711 302.11 840.81 789.99 823.99 512.2Mar Qtr
2012
SE A S O N A L L Y AD J U S T E D
20 229.717 695.08 242.65 923.111 987.211 771.91 739.81 687.010 247.410 084.9Jun Qtr18 528.116 149.67 529.25 340.110 998.810 809.61 449.51 414.29 549.49 395.4Mar Qtr
201321 440.518 772.98 878.06 461.812 562.512 311.11 911.61 874.810 650.910 436.3Dec Qtr20 728.318 082.88 457.56 045.112 270.812 037.71 809.41 773.610 461.410 264.1Sep Qtr20 028.417 102.98 557.55 931.111 471.011 171.81 750.41 688.99 720.69 482.8Jun Qtr18 540.915 606.57 881.95 271.810 659.010 334.81 609.11 560.89 049.98 774.0Mar Qtr
201280 926.570 700.333 107.223 770.047 819.346 930.26 910.36 749.540 909.040 180.72012–1381 781.068 892.134 660.323 258.647 120.745 633.67 511.27 277.939 609.538 355.72011–1287 613.569 374.237 058.921 982.250 554.647 392.07 804.57 506.842 750.139 885.32010–11
OR I G I N A L
$m$m$m$m$m$m$m$m$m$m
TotalPrivateTotalPrivateTotalPrivateTotalPrivateTotalPrivate
TOTAL BUILDINGNON-RESIDENTIALBUILDING
RESIDENTIALBUILDING
ALTERATIONSAND ADDITIONS
NEW RESIDENTIALBUILDING
Per i od
VALUE OF BUILD ING WORK DONE, Cha in volume measures (a )11
16 A B S • CO N S T R U C T I O N W O R K D O N E • 8 7 5 5 . 0 • J U N 2 0 1 3

— nil or rounded to zero (including null cells)(a) Reference year for chain volume measures is 2010-11.Refer to paragraphs 27-31 of the Explanatory Notes.
–0.10.1–0.5–0.30.10.20.30.20.10.3Jun Qtr0.30.7–0.30.30.80.9–0.4–0.41.01.1Mar Qtr
20130.71.4–0.50.71.51.7–1.2–1.12.02.2Dec Qtr0.41.6–0.81.61.31.7–2.4–2.22.02.4Sep Qtr
–0.90.4–1.70.8–0.30.1–3.3–3.00.30.7Jun Qtr–1.7–0.7–1.60.4–1.7–1.3–4.0–3.7–1.3–0.8Mar Qtr
2012
TR E N D
–0.6–0.5–1.3–1.4–0.1—5.75.6–1.0–0.9Jun Qtr–1.0–1.0–1.4–2.1–0.7–0.5–5.1–5.1—0.3Mar Qtr
20132.94.02.65.83.13.10.80.83.53.5Dec Qtr
–0.21.0–3.2–1.82.02.4–1.9–1.62.73.1Sep Qtr–1.7–0.6–1.9–0.1–1.6–0.8–4.0–3.9–1.1–0.3Jun Qtr–0.41.11.16.1–1.5–1.3–4.1–3.4–1.0–0.9Mar Qtr
2012
SE A S O N A L L Y AD J U S T E D
9.29.69.510.99.08.920.019.37.37.3Jun Qtr–13.6–14.0–15.2–17.4–12.4–12.2–24.2–24.6–10.3–10.0Mar Qtr
20133.43.85.06.92.42.35.65.71.81.7Dec Qtr3.55.7–1.21.97.07.83.45.07.68.2Sep Qtr8.09.68.612.57.68.18.88.27.48.1Jun Qtr
–13.0–12.2–12.5–10.3–13.3–13.1–23.0–23.1–11.3–11.1Mar Qtr2012
–1.02.6–4.52.21.52.8–8.0–7.33.34.82012–13–6.7–0.7–6.55.8–6.8–3.7–3.8–3.0–7.3–3.82011–122.71.50.9–0.54.02.56.45.13.52.02010–11
OR I G I N A L
%%%%%%%%%%
TotalPrivateTotalPrivateTotalPrivateTotalPrivateTotalPrivate
TOTALBUILDING
NON-RESIDENTIALBUILDING
RESIDENTIALBUILDING
ALTERATIONSANDADDITIONS
NEWRESIDENTIALBUILDING
Per i od
VALUE OF BUILD ING WORK DONE, Cha in volume measures (a ) —Change from prev ious
per iod12
A B S • CO N S T R U C T I O N W O R K D O N E • 8 7 5 5 . 0 • J U N 2 0 1 3 17

20 692.618 200.58 276.25 990.612 416.412 209.91 795.01 753.610 621.410 456.3Jun Qtr20 611.718 091.78 299.75 999.012 312.012 092.81 772.91 732.910 539.110 359.9Mar Qtr
201320 461.617 884.38 324.05 978.612 137.611 905.81 762.91 722.610 374.710 183.1Dec Qtr20 266.417 583.08 376.65 945.111 889.811 637.91 770.21 728.010 119.69 909.9Sep Qtr20 160.917 275.58 460.95 865.811 700.011 409.71 807.11 759.09 892.99 650.7Jun Qtr20 340.817 212.28 617.05 828.211 723.811 384.01 865.61 809.49 858.29 574.5Mar Qtr
2012
TR E N D
20 601.518 099.18 228.25 929.512 373.312 169.61 838.31 795.010 535.010 374.6Jun Qtr20 576.718 046.98 301.35 986.412 275.412 060.51 718.11 679.710 557.310 380.8Mar Qtr
201320 700.918 150.88 419.86 115.812 281.112 035.01 789.71 749.310 491.310 285.8Dec Qtr20 101.717 430.08 224.35 790.811 877.411 639.31 769.61 728.510 107.89 910.8Sep Qtr20 096.417 212.28 522.95 918.611 573.511 293.61 791.41 741.99 782.09 551.7Jun Qtr20 424.317 303.28 665.15 909.311 759.311 393.91 865.21 812.19 894.19 581.8Mar Qtr
2012
SE A S O N A L L Y AD J U S T E D
20 648.418 098.38 280.65 952.612 367.712 145.71 822.51 767.510 545.210 378.2Jun Qtr18 777.916 395.57 530.05 341.411 247.811 054.11 500.21 464.49 747.69 589.7Mar Qtr
201321 639.518 970.08 879.26 465.212 760.212 504.81 956.01 919.110 804.310 585.7Dec Qtr20 899.618 244.08 476.56 056.612 423.012 187.41 845.01 808.410 578.010 378.9Sep Qtr20 152.017 215.68 581.35 947.011 570.711 268.61 776.41 713.69 794.39 555.0Jun Qtr18 641.015 704.07 887.75 276.210 753.310 427.81 632.71 583.49 120.78 844.3Mar Qtr
201281 965.271 707.733 166.523 815.848 798.847 891.97 123.76 959.441 675.140 932.52012–1382 352.669 414.334 793.123 351.247 559.546 063.17 617.97 380.539 941.638 682.62011–1287 613.569 374.237 058.921 982.250 554.647 392.07 804.57 506.842 750.139 885.32010–11
OR I G I N A L
$m$m$m$m$m$m$m$m$m$m
TotalPrivateTotalPrivateTotalPrivateTotalPrivateTotalPrivate
TOTAL BUILDINGNON-RESIDENTIALBUILDING
RESIDENTIALBUILDING
ALTERATIONSAND ADDITIONS
NEW RESIDENTIALBUILDING
Per i od
VALUE OF BUILD ING WORK DONE, Cur ren t pr ices13
18 A B S • CO N S T R U C T I O N W O R K D O N E • 8 7 5 5 . 0 • J U N 2 0 1 3
— nil or rounded to zero (including null cells)
0.40.6–0.3–0.10.81.01.21.20.80.9Jun Qtr0.71.2–0.30.31.41.60.60.61.61.7Mar Qtr
20131.01.7–0.60.62.12.3–0.4–0.32.52.8Dec Qtr0.51.8–1.01.41.62.0–2.0–1.82.32.7Sep Qtr
–0.90.4–1.80.6–0.20.2–3.1–2.80.40.8Jun Qtr–1.8–0.8–1.70.2–1.8–1.4–4.0–3.7–1.4–0.9Mar Qtr
2012
TR E N D
0.10.3–0.9–0.90.80.97.06.9–0.2–0.1Jun Qtr–0.6–0.6–1.4–2.1—0.2–4.0–4.00.60.9Mar Qtr
20133.04.12.45.63.43.41.11.23.83.8Dec Qtr—1.3–3.5–2.22.63.1–1.2–0.83.33.8Sep Qtr
–1.6–0.5–1.60.2–1.6–0.9–4.0–3.9–1.1–0.3Jun Qtr–0.70.80.65.5–1.6–1.4–4.0–3.4–1.1–1.0Mar Qtr
2012
SE A S O N A L L Y AD J U S T E D
10.010.410.011.410.09.921.520.78.28.2Jun Qtr–13.2–13.6–15.2–17.4–11.9–11.6–23.3–23.7–9.8–9.4Mar Qtr
20133.54.04.86.72.72.66.06.12.12.0Dec Qtr3.76.0–1.21.87.48.23.95.58.08.6Sep Qtr8.19.68.812.77.68.18.88.27.48.0Jun Qtr
–13.3–12.4–13.1–10.9–13.4–13.2–23.0–23.0–11.4–11.2Mar Qtr2012
–0.53.3–4.72.02.64.0–6.5–5.74.35.82012–13–6.00.1–6.16.2–5.9–2.8–2.4–1.7–6.6–3.02011–125.14.12.81.56.85.49.58.16.44.92010–11
OR I G I N A L
%%%%%%%%%%
TotalPrivateTotalPrivateTotalPrivateTotalPrivateTotalPrivate
TOTALBUILDING
NON-RESIDENTIALBUILDING
RESIDENTIALBUILDING
ALTERATIONSANDADDITIONS
NEWRESIDENTIALBUILDING
Per i od
VALUE OF BUILD ING WORK DONE, Cur ren t pr ices —Change from prev ious per iod14
A B S • CO N S T R U C T I O N W O R K D O N E • 8 7 5 5 . 0 • J U N 2 0 1 3 19
1.12.41.03.30.83.52.35.80.91.83.5Construction work done1.73.11.710.51.26.12.89.80.64.86.3Engineering work done0.91.51.02.10.92.71.52.12.81.51.7Building work done
JU N E QU A R T E R 20 1 3
0.91.70.92.32.27.31.94.10.71.62.8Construction work done1.32.21.46.53.313.32.46.90.63.55.0Engineering work done0.81.30.92.21.42.51.82.32.11.71.5Building work done
MA R C H QU A R T E R 20 1 3
TotalPublicPrivate
Aust.ACTNTTas.WASAQldVic.NSW
RELAT IVE STANDARD ERRORS, States and Ter r i to r ies15
0.91.0Total building1.72.2Non-residential building0.90.9Residential building1.71.8Alterations and additions1.01.0New residential building
JU N E QU A R T E R 20 1 3
0.80.9Total building1.31.8Non-residential building1.01.1Residential building1.71.8Alterations and additions1.21.2New residential building
MA R C H QU A R T E R 20 1 3
%%
TotalPrivate
RELAT IVE STANDARD ERRORS, Bui ld ing work done —Aust ra l ia16
20 A B S • CO N S T R U C T I O N W O R K D O N E • 8 7 5 5 . 0 • J U N 2 0 1 3

6 In the Engineering Construction Survey, the statistical unit used to represent
businesses, and for which statistics are reported, is the Australian Business Number
(ABN) unit, in most cases. The ABN unit is the business unit which has registered for an
ABN, and thus appears on the Australian Taxation Office (ATO) administered Australian
Business Register. This unit is suitable for Australian Bureau of Statistics statistical needs
when the business is simple in structure. For more significant and diverse businesses
where the ABN unit is not suitable for Australian Bureau of Statistics statistical needs, the
statistical unit used is the Type of Activity Unit (TAU). A TAU is comprised of one or
more business entities, sub-entities or branches of a business entity within an enterprise
group that can report production and employment data for similar economic activities.
When a minimum set of data items is available, a TAU is created which covers all the
operations within an industry subdivision – and the TAU is classified to the relevant
ST A T I S T I C A L UN I T
2 The scope of the Building Activity Survey is all approved building activity involving
the construction of new buildings or structural alterations, extensions or other additions
made to existing buildings. Maintenance work is excluded but major repairs involving
partial demolition and reconstruction are included.
3 As of the September quarter 2012, the survey consists of:
! an indirect, modelled component comprising residential building work with
approval values from $10,000 to less than $50,000 and non-residential building work
with approval values from $50,000 to less than $250,000. The contributions from
these building jobs are modelled based on their building approval details.
! a direct collection of all identified building work having approval values of
$5,000,000 or more.
! a sample survey, selected from other identified building work.
4 For any particular quarter the Building Activity Survey includes newly selected jobs
appearing in the survey for the first time and all incomplete building jobs which were
selected in previous quarters. New selections are drawn from building jobs approved in
the 3 month period prior to the last month in the quarter (e.g. up to the end of August
for new selections in the September quarter survey) using the rules presented in
paragraph 3, and any jobs otherwise identified to have commenced with approval values
in excess of $5 million, irrespective of the approval month. This may result in some jobs
both approved and commencing in the last month of the quarter being shown as
commencements in the following quarter.
5 The scope of the Engineering Construction Survey is all engineering construction
activity undertaken in Australia. This incorporates all construction activity except the
construction of new buildings or structural alterations, extensions or other additions
made to existing buildings. Maintenance work is excluded but major repairs involving
partial demolition and reconstruction are included. Since Engineering Construction
Survey and Building Activity Survey are activity-based, there are a number of conceptual
differences with other ABS surveys. For more information, see feature article "Mining
Investment in ABS Publications" which was released with publication Private New Capital
Expenditure and Expected Expenditure, Australia, March 2012 (cat. no. 5625.0).
SC O P E AN D CO V E R A G E
1 This publication contains preliminary estimates of building and engineering
construction work done during the current quarter and revised estimates for the
previous two quarters. The estimates of building work done and engineering work done
are from the quarterly Building Activity Survey and the quarterly Engineering
Construction Survey respectively. Estimates of work done are based upon a response
from each survey of approximately 80% of the value of work done during the current
quarter. More comprehensive and updated results will be available shortly in Building
Activity, Australia (cat. no. 8752.0) and Engineering Construction Activity, Australia
(cat. no. 8762.0).
I N T R O D U C T I O N
A B S • CO N S T R U C T I O N W O R K D O N E • 8 7 5 5 . 0 • J U N 2 0 1 3 21
E X P L A N A T O R Y N O T E S

9 Statistics on the value of work (current prices) show residential building work done
on a GST inclusive basis and non-residential work and engineering construction work
done on a GST exclusive basis. This approach is consistent with that adopted in the
Australian National Accounts which is based on the conceptual framework described in
the 2008 edition of the international statistical standard System of National Accounts
(SNA08).
10 SNA08 requires value added taxes (VAT), such as the GST, to be recorded on a net
basis where:
(a) both outputs of goods and services and imports are valued excluding invoiced
VAT
(b) purchases of goods and services are recorded including non-deductible VAT.
11 Under the net system, VAT is recorded as being payable by purchasers, not sellers,
and then only by those purchasers who are not able to deduct it. Almost all VAT is
therefore recorded in the SNA08 as being paid on final uses – mainly on household
consumption. Small amounts of VAT, may however, be paid by businesses in respect of
certain kinds of purchases on which VAT may not be deductible.
12 The ABS records value of work done inclusive of GST in respect of residential
construction and exclusive of GST in respect of non-residential construction and
engineering construction. Purchasers of residential structures are unable to deduct GST
from the purchase price. For non-residential structures and engineering construction,
the reverse is true in most circumstances.
13 Total construction work is derived by adding total building work and total
engineering construction work. To derive total building activity it is appropriate to add
the residential and non-residential components. Valuation of the components of the
total is consistent, since, for both components, the value of work done is recorded
inclusive of non-deductible GST paid by the purchaser. As such, total building activity
and total construction includes the non-deductible GST payable on residential building.
TR E A T M E N T OF TH E GS T
8 Data on the value of work done on the construction of new residential buildings,
alterations and additions to residential buildings, private sector non-residential buildings
and the value of engineering construction activity are the major sources of data which
are used to compile the national accounts estimates for private gross fixed capital
formation on dwellings, and other buildings and structures. However, there are some
adjustments to the survey data which are made in the process of compiling these
national accounts series. Allowances are made for the value of activity which is out of
scope of the Building Activity Survey and the Engineering Construction Survey. Such
activity includes work done on projects which fall below the size cut-offs used for the
Building Activity survey and also the value of building work done which is undertaken
without obtaining a building permit, either because such a permit is not required or
because the requisite permit is not obtained. The national accounts estimates also make
allowances for purchases (less sales) of buildings and other structures from (to) the
public sector.
RE L A T I O N S H I P W I T H
NA T I O N A L AC C O U N T S
subdivision of the Australian and New Zealand Standard Industrial Classification
(ANZSIC). Where a business cannot supply adequate data for each industry, a TAU is
formed which contains activity in more than one industry subdivision and the TAU is
classified to the predominant ANZSIC subdivision.
7 Further details about the ABS economic statistical units used in the Engineering
Construction Survey, and in other ABS economic surveys (both sample surveys and
censuses), can be found in Chapter 2 of the Standard Economic Sector Classifications of
Australia (SESCA) 2008 (cat. no. 1218.0).
ST A T I S T I C A L UN I T continued
22 A B S • CO N S T R U C T I O N W O R K D O N E • 8 7 5 5 . 0 • J U N 2 0 1 3
E X P L A N A T O R Y N O T E S continued

19 In the seasonally adjusted series, account has been taken of normal seasonal
factors, ‘trading day’ effects arising from the varying numbers of working days in a
quarter and the effect of movement in the date of Easter which may, in successive years,
affect figures for different quarters.
20 Since seasonally adjusted statistics reflect both irregular and trend movements, an
upward or downward movement in a seasonally adjusted series does not necessarily
indicate a change of trend. Particular care should therefore be taken in interpreting
individual quarter-to-quarter movements.
21 The seasonally adjusted estimates in this publication are produced by the
concurrent seasonal adjustment method which takes account of the latest available
original estimates. The concurrent method improves the estimation of seasonal factors
and, therefore, the seasonally adjusted and trend estimates of the current and previous
quarters.
22 A more detailed review of concurrent seasonal factors will be conducted annually,
generally prior to the release of data for the December quarter.
23 The revision properties of the seasonally adjusted and trend estimates have been
improved by the use of autoregressive integrated moving average (ARIMA) modelling.
ARIMA modelling relies on the characteristics of the series being analysed to project
future period data. The ARIMA model is assessed as part of the annual reanalysis. For
SE A S O N A L AD J U S T M E N T
17 The estimates of both building activity and engineering activity are based on sample
surveys. Because data are not collected for all building jobs nor for all engineering jobs,
the published estimates are subject to sampling variability. Relative standard errors give a
measure of this variability and therefore indicate the degree of confidence that can be
attached to the data.
18 Estimates presented in the tables are subject to sampling error arising from the
inclusion of a sample only; that is, they may differ from the figures that would have been
obtained if all eligible building jobs and engineering businesses had been included in the
surveys. The likely differences due to the sampling process can be characterised by the
standard error (SE) of the estimate. To more easily determine the relative quality of an
estimate or to compare the quality of different estimates, the relative standard error
(RSE), which is obtained by expressing the SE as a percentage of the corresponding
estimate, is commonly used. There are about two chances in three that an estimate from
a sample of a group will differ by less than one RSE of the figure that would have been
obtained if the entire group were surveyed, and about nineteen chances in twenty that
the difference will be less than two RSEs of the estimate. Estimated RSEs for the value of
work done in this quarter are given in tables 15 and 16 of this publication.
RE L I A B I L I T Y OF TH E
ES T I M A T E S
15 Ownership. The ownership of a building is classified as either private sector or
public sector, according to the sector of the intended owner of the completed building
as evident at the time of approval. Engineering projects are classified as either private
sector or public sector according to the expected ownership of the project at the time of
completion.
16 Building jobs are classified both by the Type of building ('residential' and
'non-residential') and by the Type of work involved ('new' and 'alterations and additions').
For residential buildings these classifications are used in conjunction with each other.
The classes are defined in the Glossary.
CL A S S I F I C A T I O N
14 As estimates for engineering work are provided on a GST exclusive basis, and the
majority of construction materials used were exempt from Wholesale Sales Tax, the
introduction of the GST had little direct effect on the estimates of engineering
construction.
TR E A T M E N T OF TH E GS T
continued
A B S • CO N S T R U C T I O N W O R K D O N E • 8 7 5 5 . 0 • J U N 2 0 1 3 23
E X P L A N A T O R Y N O T E S continued

33 All tables in this publication, plus some additional state and territory series are
available in electronic form on the ABS web site.
RE L A T E D PR O D U C T S
32 ABS publications draw extensively on information provided freely by individuals,
businesses, governments and other organisations. Their continued cooperation is very
much appreciated: without it, the wide range of statistics published by the ABS would
not be available. Information received by the ABS is treated in strict confidence as
required by the Census and Statistics Act 1905.
AC K N O W L E D G M E N T
27 Chain volume estimates of the value of work done are presented in original,
seasonally adjusted and trend terms.
28 While current price estimates of value of work done reflect both price and volume
changes, chain volume estimates measure changes in value after the direct effects of
price changes have been eliminated and therefore only reflect volume changes. The
direct impact of the GST is a price change, and hence is removed from chain volume
estimates. The deflators used to revalue the current price estimates in this publication
are derived from the same price data underlying the deflators compiled for the dwellings
and new other building components, and the new engineering construction component,
of the national accounts aggregate ‘Gross fixed capital formation’.
29 The chain volume measures of work done appearing in this publication are annually
reweighted chain Laspeyres indexes referenced to current price values in a chosen
reference year. The reference year is updated annually in the September quarter
publication. Each year’s data in the value of work done series are based on the prices of
the previous year, except for the quarters of the latest incomplete year which are based
upon the current reference year. Comparability with previous years is achieved by linking
(or chaining) the series together to form a continuous time series.
30 Chain volume measures do not, in general, sum exactly to the extrapolated total
value of the components. Further information on the nature and concepts of chain
volume measures is contained in the ABS Information Paper: Australian National
Accounts, Introduction of Chain Volume and Price Indexes (cat. no. 5248.0).
31 The factors used to seasonally adjust the chain volume series are identical to those
used to adjust the corresponding current price series.
CH A I N VO L U M E ME A S U R E S
24 Seasonally adjusted series can be smoothed to reduce the impact of the irregular
component in the adjusted series. This smoothed seasonally adjusted series is called a
trend estimate.
25 The trend estimates are derived by applying a 7-term Henderson moving average to
the seasonally adjusted series. The 7-term Henderson average (like all Henderson
averages) is symmetric but, as the end of a time series is approached, asymmetric forms
of the average are applied. Unlike weights of the standard 7-term Henderson moving
average, the weights employed here have been tailored to suit the particular
characteristics of individual series.
26 While the smoothing technique described in paragraphs 24 and 25 enables trend
estimates to be produced for recent quarters, it does result in revisions to the estimates
for the most recent three quarters as additional observations become available. There
may also be revisions because of changes in the original data. For further information,
see Information Paper: A Guide to Interpreting Time Series—Monitoring Trends, 2003
(cat. no. 1349.0) or contact Time Series Analysis Section on (02) 6252 6345 or email
TR E N D ES T I M A T E S
more information on the details of ARIMA modelling see feature article: Use of ARIMA
modelling to reduce revisions in the October 2004 issue of Australian Economic
Indicators (cat. no. 1350.0).
SE A S O N A L AD J U S T M E N T
continued
24 A B S • CO N S T R U C T I O N W O R K D O N E • 8 7 5 5 . 0 • J U N 2 0 1 3
E X P L A N A T O R Y N O T E S continued

35 As well as the statistics included in this and related publications, the ABS may have
other relevant data available on request. Inquiries should be made to the National
Information and Referral Service on 1300 135 070.
AB S DA T A AV A I L A B L E ON
RE Q U E S T
34 Users may also wish to refer to the following publications:
Building Activity, Australia, cat. no. 8752.0
Building Approvals, Australia, cat. no. 8731.0
Engineering Construction Activity, Australia, cat. no. 8762.0
House Price Indexes: Eight Capital Cities, cat. no. 6416.0
Housing Finance, Australia, cat. no. 5609.0
Private Sector Construction Industry, Australia, cat. no. 8772.0
Producer Price Indexes, Australia, cat. no. 6427.0.
RE L A T E D PR O D U C T S continued
A B S • CO N S T R U C T I O N W O R K D O N E • 8 7 5 5 . 0 • J U N 2 0 1 3 25
E X P L A N A T O R Y N O T E S continued

..Datacube16Relative standard errors, building work done, Australia
..Datacube15Relative standard errors, states and territories
..n.a.14Value of building work done, current prices, change from previous periodSeptember 1958713Value of building work done, current prices, states and territories
March 1957613Value of building work done, current prices, Australia..n.a.12Value of building work done, chain volume measures, change from previous period
September 1974511Value of building work done, chain volume measures, states and territories, seasonally adjustedSeptember 1974411Value of building work done, chain volume measures, states and territories, originalSeptember 1974311Value of building work done, chain volume measures
..n.a.10Construction work done, states and territories, current prices, original, change from previous periodMarch 195799Construction work done, states and territories, current prices, original
..n.a.8Construction work done, current prices, change from previous periodMarch 195727Construction work done, current prices
..n.a.6Construction work done, states and territories, chain volume measures, original, change from
previous period
September 197485Construction work done, states and territories, chain volume measures, original..n.a.4
Construction work done, states and territories, chain volume measures, change from previousperiod
September 198683Construction work done, states and territories, chain volume measures..n.a.2Construction work done, chain volume measures, change from previous period
September 197411Construction work done, chain volume measures
Start
date
Electronic
table no.
Publication
table no.
WORK DONE
The following tables are available electronically via the ABS web site. Not all series in the
table go back to the earliest start date.E L E C T R O N I C T A B L E S
26 A B S • CO N S T R U C T I O N W O R K D O N E • 8 7 5 5 . 0 • J U N 2 0 1 3
A P P E N D I X L I S T O F E L E C T R O N I C T A B L E S
The Type of Work classification refers to building activity approved to be carried out andType of work
Buildings are classified as either:Residential buildingA residential building is a building consisting of one or more dwelling units.
Residential buildings can be either houses or other residential buildings.A house is a detached building primarily used for long term residential
purposes. It consists of one dwelling unit. For instance, detached 'granny flats'and detached dwelling units (e.g. caretaker's residences) associated with anon-residential building are defined as houses. Also includes 'cottages','bungalows' and rectories.
An other residential building is a building other than a house primarily used forlong-term residential purposes. An other residential building contains morethan one dwelling unit. Other residential buildings are coded to the followingcategories: semidetached, row or terrace house or townhouse with onestorey; semidetached, row or terrace house or townhouse with two or morestoreys; flat, unit or apartment in a building of one or two storeys; flat, unit orapartment in a building of three storeys; flat, unit or apartment in a building offour or more storeys; flat, unit or apartment attached to a house;other/number of storeys unknown.
Non-residential buildingA non-residential building is primarily intended for purposes other than long term
residential purposes. Note that, on occasions, one or more dwelling units may becreated through non-residential building activity. The value of these dwelling unitscannot be separated out from that of the non-residential building which they arepart of, therefore the value associated with these remain in the appropriatenon-residential category.
Non-residential building's are further classified by their functional use at time ofapproval.
Type of building
Refer to Type of Building.Residential building
Refer to Type of Building.Non-residential building
Refer to Type of Work.New
The Value of engineering work done including only work carried out during the quarterEngineering work done
A dwelling unit is a self-contained suite of rooms, including cooking and bathing facilitiesand intended for long-term residential use. Units (whether self-contained or not) withinbuildings offering institutional care, such as hospitals, or temporary accommodationsuch as motels, hostels and holiday apartments, are not defined as dwelling units. Thevalue of units of this type is included in non-residential building.
Dwelling unit
The sum of building work done and engineering work done.Construction work done
The Value of building work done including only work carried out during the quarterBuilding work done
A building is a rigid, fixed and permanent structure which has a roof. Its intendedpurpose is primarily to house people, plant, machinery, vehicles, goods or livestock. Anintegral feature of a building's design, to satisfy its intended use, is the provision forregular access by persons.
Building
Refer to Type of work. The term 'Alterations and additions' in tables 11, 12, 13, 14 and16 refers to alterations and additions to residential buildings only.
Alterations and additions
A B S • CO N S T R U C T I O N W O R K D O N E • 8 7 5 5 . 0 • J U N 2 0 1 3 27
G L O S S A R Y

The value of engineering work done for the private sector consists of the value of workdone on prime contracts, plus speculative contracts, plus work done on own account.The value of engineering work done for the public sector is the work done by theorganisation's own workforce and subcontractors. In each case, the value excludes thecost of land and repair and maintenance activity, as well as the value of any transfers ofexisting assets, the value of installed machinery and equipment not integral to thestructure and the expenses for relocation of utility services. However, a contract for theinstallation of machinery and equipment which is an integral part of a constructionproject is included.
Value of engineering workdone
Includes the costs of materials fixed in place, labour, and architects fees. It excludes thevalue of land and landscaping and non-building components such as fencing, paving,roadworks, tennis courts, outdoor pools and car parks.
Value of building work done
consists of:Alterations and additions
Building activity carried out on existing buildings excluding conversions.Includes adding to or diminishing floor area, altering the structural design of abuilding and affixing rigid components which are integral to the functioning ofthe building. Total alterations and additions includes the conversion ofnon-residential buildings to residential buildings.
NewBuilding activity which will result in the creation of a building which previously
did not exist.
Type of work continued
28 A B S • CO N S T R U C T I O N W O R K D O N E • 8 7 5 5 . 0 • J U N 2 0 1 3
G L O S S A R Y continued


www.abs.gov.auWEB ADDRESS
All statistics on the ABS website can be downloaded freeof charge.
F R E E A C C E S S T O S T A T I S T I C S
Client Services, ABS, GPO Box 796, Sydney NSW 2001POST
1300 135 211FAX
1300 135 070PHONE
Our consultants can help you access the full range ofinformation published by the ABS that is available free ofcharge from our website. Information tailored to yourneeds can also be requested as a 'user pays' service.Specialists are on hand to help you with analytical ormethodological advice.
I N F O R M A T I O N A N D R E F E R R A L S E R V I C E
www.abs.gov.au the ABS website is the best place fordata from our publications and information about the ABS.
INTERNET
F O R M O R E I N F O R M A T I O N . . .
© Commonwealth of Australia 2013Produced by the Australian Bureau of Statistics
87
55
.0
•
CO
NS
TR
UC
TI
ON
W
OR
K
DO
NE
, A
US
TR
AL
IA
, P
RE
LI
MI
NA
RY
•
Ju
ne
Qu
ar
te
r 2
01
3
ISSN 1445–6966