construction of mitigation scenarios post …€¦ · construction of mitigation scenarios post...
TRANSCRIPT
CONSTRUCTION OF MITIGATION SCENARIOS POST 2020
1. General Background2. Types of goals and iNDC3. National baseline
Partnership for Market Readiness Technical Workshop‘Upstream Policy Analysis for INDCs: Approaches, Challenges,
Opportunities’ Barcelona, May 29th, 2015

1 – GENERAL BACKGROUND


Emisiones de GEI (IPCC, Fifth AR, 2014)

Emisiones de GEI Colombia – año 2010 (Ideam, BUR, 2014)
219.558 Gg CO2 eq

Macroeconomic assumptions
Baselines and sectoral mitigation options.
(Using sectorial models)SBT’s
Agriculture and FOLUPowerCoal, Oi and Natural GasTransportationHouseholds IndustryWaste
Sectoral expertsDecision takers
GovernmentAcademy
PASGovernment(Ministries) Involved agents
Intersectoral relationshipsMacroeconomic assumptions
(Hybrid BU-TD models)
Information for the
Colombian INDC
Sectoral expertsGovernment
Academy
Ongoing work
Co-benefit analysisOther analysis

Baseline 2010- 2040:
Baseline

2- TYPE OF GOALS AND iNDC

Goals for emission mitigation
• Absolut
• Peak
• Baseline
• Carbon intensity
• Single year
• Multiple year
• Peak and decline

iNDC proposals
• Some Annex 1 countries : Absolute goal
– Swiss: reduction of 50% of its reported emissions on 1990 in 2030.
– Noway: reduction of 40% of its reported emissions on 1990 in 2030.
– United States: reduction of 26-28% of its reported emissions on 2005
in 2030. (17% in 2020)
– Russia: reduction of 25-30% of its reported emissions on 1990 in
2030.

iNDC proposals
• Non-Annex 1 countries: Baseline and carbon intensity
– México: two goals by 2030: (i) unconditioned abatement of 25% of its
GHG (22% of GHG and 3% of other pollutants) with respect to its
baseline, (ii) abatement of 25% of its GHG (36% of GHG and 3% of
other pollutants) with respect to its baseline conditioned to market
mechanisms, international cooperartion, funding, technology transfer.
– Chile: reduction of carbon intensity 30-35% with respect to 2007 by
2025; 40-45% by 2030. This goal does not include the FOLU related
emissions.
– Perú
– Brasil

3 – NATIONAL BASELINEIN REVIEW AND CONSTRUCTION
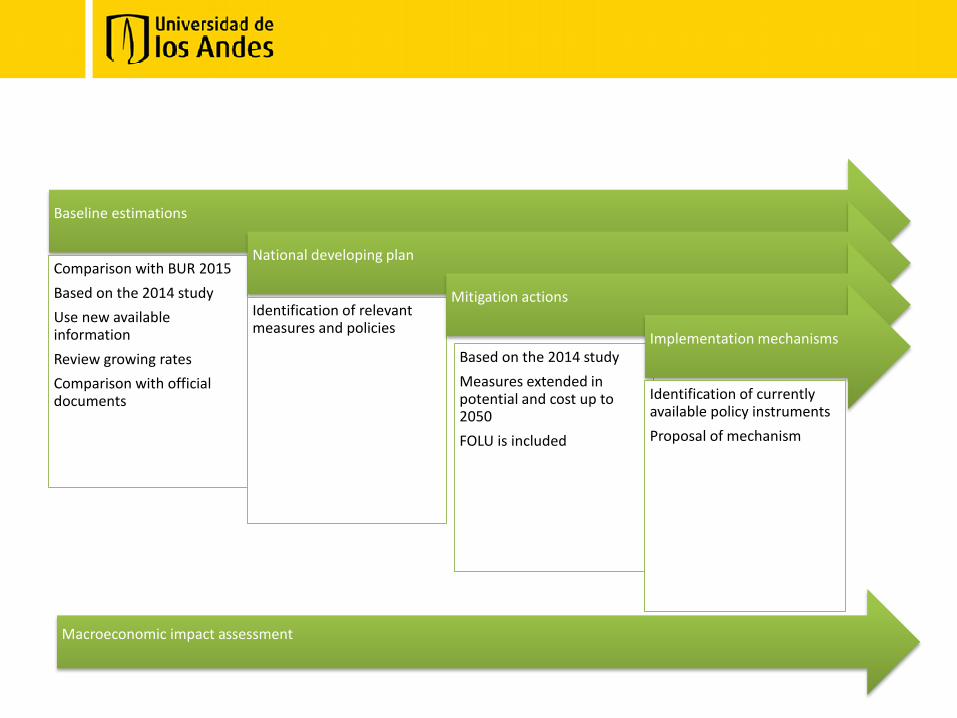
Baseline estimations
Comparison with BUR 2015
Based on the 2014 study
Use new availableinformation
Review growing rates
Comparison with officialdocuments
National developing plan
Identification of relevantmeasures and policies
Mitigation actions
Based on the 2014 study
Measures extended in potential and cost up to2050
FOLU is included
Implementation mechanisms
Identification of currentlyavailable policy instruments
Proposal of mechanism
Macroeconomic impact assessment

National baseline(Mton CO2 eq)
0
100
200
300
400
500
600
2000 2005 2010 2015 2020 2025 2030 2035 2040 2045 2050
BAU RBS (Combinado)
CAGR
Variables macro
PIB 3.9%
Pob. 1.0%
PIB/hab. 3.1%
In revision-Do not divulgate
ton CO2eq/ hab
BAU
2010 4,8
2030 6,0
2050 8.1
kg CO2eq/USD$
BAU
2010 0.436
2030 0.293
2050 0.212

Baseline - Energy
0
20
40
60
80
100
120
140
160
180
20
10
20
11
20
12
20
13
20
14
20
15
20
16
20
17
20
18
20
19
20
20
20
21
20
22
20
23
20
24
20
25
20
26
20
27
20
28
20
29
20
30
20
31
20
32
20
33
20
34
20
35
20
36
20
37
20
38
20
39
20
40
20
41
20
42
20
43
20
44
20
45
20
46
20
47
20
48
20
49
20
50
Mill
on
es C
O2
eq
EMISSIONS 2010-2050
Demanda Generación de Electricidad Refinerias Otras industrias Energéticas

Baseline - Energy
0
20
40
60
80
100
120
140
160
180
20
10
20
11
20
12
20
13
20
14
20
15
20
16
20
17
20
18
20
19
20
20
20
21
20
22
20
23
20
24
20
25
20
26
20
27
20
28
20
29
20
30
20
31
20
32
20
33
20
34
20
35
20
36
20
37
20
38
20
39
20
40
20
41
20
42
20
43
20
44
20
45
20
46
20
47
20
48
20
49
20
50
Mill
on
es C
O2
eq
EMISSIONS 2010-2050
Otros Sectores Transporte base UPME Generación de Electricidad Refinerias Otras industrias Energéticas

Baseline - Energy
• Energy demand growth according to PEN : Ideario Energético 2050 (UPME, 2015).
0
20
40
60
80
100
120
140
160
180
20
10
20
12
20
14
20
16
20
18
20
20
20
22
20
24
20
26
20
28
20
30
20
32
20
34
20
36
20
38
20
40
20
42
20
44
20
46
20
48
20
50
Mill
on
es C
O2
eq
Total emissions 2010-2050

Mitigation Options PND - Energy• Diversification of the power mix with non-hydro technologies according to
OECD OECD recomendation to integrate low carbon solutions.
• Renewable Portfolio for power genration (UPME, Plan de expansión de G y T)
– 10,5% capacity 2015 – 2028.
– Generation: 2,5% -7,5%.
• Power generation schemes with FRNC, hybrid systems and energy efficiency for the NIA. Bussiness schemes with public and privated investment (as exclusive service zones)
• Energy efficiency in the final consumption sector (no specific goals)
• Diversification of the transport’s energy mix
• Use of coal gas methane .
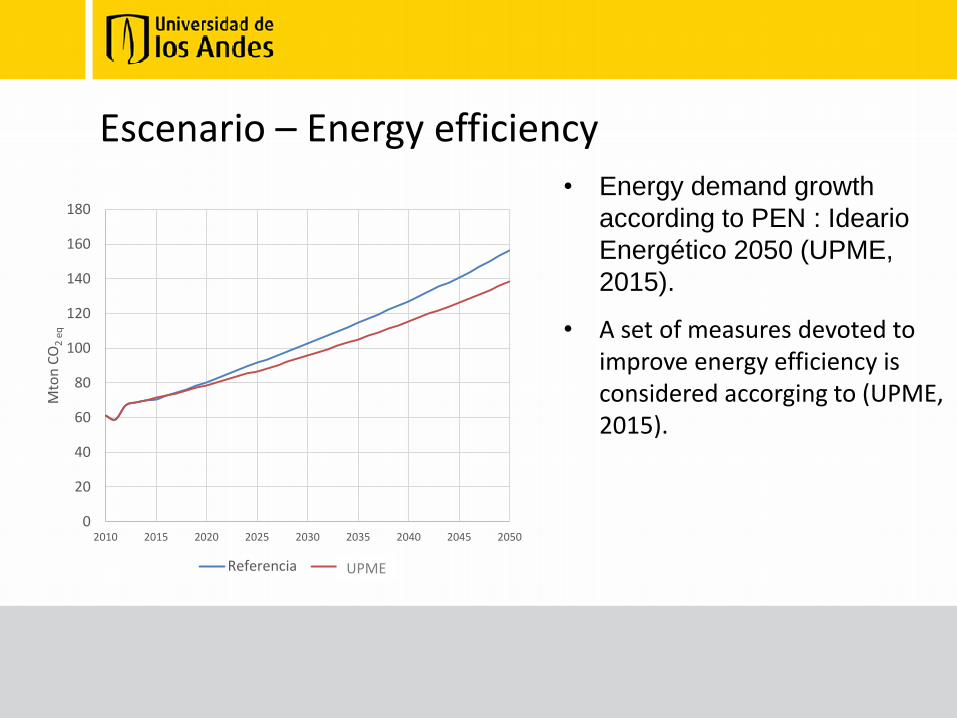
Escenario – Energy efficiency
• Energy demand growth
according to PEN : Ideario
Energético 2050 (UPME,
2015).
• A set of measures devoted to improve energy efficiency is considered accorging to (UPME, 2015).
0
20
40
60
80
100
120
140
160
180
2010 2015 2020 2025 2030 2035 2040 2045 2050
Mto
nC
O2
eq
Referencia PNDUPME

Proposed instruments- Energy
• Carbon tax and royalties investment for carbon storage by reforestation in the case of the coal mining. Do not reduce employment.
• Incentives aditional to to th fiscal ones (net rent deduction, acelerated depreciation, VAT deduction)deducción de renta líquida, depreciación acelerada, deducción de IVA ) contempled in the 1715 law (Law for increase the RNW, DG and DSM).
• Funding of renwable energies and DSM: FENOGE and other such as Bancoldex and ANDI-UPME agreement.
• Resources for R+D+I– Carbon Capture and Sequestration (CCS), with international support.
– Adoption, adaptation and development of Smart grids/cities technologies,

Proposed instruments- Energy
• Financial funds (investment subsidies) to increase electricity coverage with hybrid solutions, and the substitution of wood to LPG.
• Regulation flatten the playing field for new technologies and sources. Regulation-free zones.
• Technical standards and regulations (RETIQ, …)
• Education on Energy use

Current status
• In January, the analytical team from Los Andes began work on thescenarios and calculations to establish a national target (Phase III). Thiswork is based on aggregated scenarios that take into account outcomesfrom previous phases.
• A workshop was held on March 13th in Bogota with the aim of presentingprogress so far, including the required-by-science and equity scenarios, baselines and methodological approaches for the following steps.
• Final sectoral meetings are currently undergoing in order to define themitigation escenarios

Sector
Subsector
$33,34
-$50,77
-$176,75
5,85
Antesde2015 2016-2020 2021-2025 2026-2030 2031-2040 2041-2050
Potencial 0,00 0,05 0,49 0,79 1,97 2,55
InversiónVPN $0,00 $9,84 $23,50 $0,00 $0,00 $0,00
InversiónCAE $0,00 $2,60 $6,20 $0,00 $0,00 $0,00
AOMVPN $0,00 -$10,51 -$112,67 -$142,36 -$176,06 -$88,20
AOMCAE $0,00 -$2,77 -$29,72 -$37,55 -$28,65 -$14,35
Otrosimpactos
económicos2
Sustitucióndebombillosincandescentes
Energía
Residencial
Consiste en reemplazar la totalidad de los bombillos incandescentes utilizados en las viviendas urbanas por bombillos más eficientes que
continúencumpliendoconlasnecesidadesdeiluminación.
InversiónVPN(MillonesUSD) Períodooañodeiniciode
implementación2019-2025
AOMCAE(MillonesUSD)
Elementoshabilitantes 2
Costoefectividad(USD/TonCO2eq)Temporalidaddelosimpactos Cortoplazo
Potencialdereducción(MtonCO2eq)
Cobeneficios 0Disminucióndelademandadeenergíaeléctrica.
Reduccióndelgastodelosusuariosenelserviciodeenergíaeléctrica.
AumentodecompetitividadenelmercadodebombillosLFC.
Viabilidaddeimplementación
Riesgo 2Se requiere la creación de un centro de tratamiento y disposición de los residuos
tóxicosdebombillosLFC.
PolíticasinvolucradasPortafoliosdegeneracióneléctrica
MecanismosdeMedición,ReporteyVerificación
MecanismosfinancierosLamedidaesconsistenteconlasmetasdelProure.
InstrumentosregulatoriosResolución 182544 de 2010en la cual se restringe la fabricación y uso de bombillos incandescentes en
elpaís.
AgentesinvolucradosMinisterio de Minas y Energía, Ministerio de Hacienda, Ministerio de Vivienda, UPME, Fabricantes y
comercializadoresdebombillos,Usuariosresidenciales.
-2
-1
0
1
2 Costoefec vidad
Potencialdereducción
Cobenefici os
Riesgo Temporalidadimpactos
Elementoshabilitantes
Inversión
0,0
0,1
0,1
0,2
0,2
0,3
0,3$(300)
$(250)
$(200)
$(150)
$(100)
$(50)
$-
$50
2010 2015 2020 2025 2030 2035 2040 2045 2050
MtonCO2eq
MillonesUSD
2010
Potencial Inversión CostosAOM


Baseline- Transportation
• Info updated 2011-2014– Motorization rates
– Trips in urban public transport systems (compliance with sectoral targets)
• Comparison and corrections with respect to emissions reported in BUR (for 2010)– Internationa emissions
– Accounting for biomass emissions
• Comparison with UPME scenarios
– Uniandes 2010 - 2040
– UPME 2012 - 2030

Baseline- Transportation
– Reference scenario (Uniandes): Defined as the most probable. Assumptions made by sectorl experts (SBTs).
– Baseline Escenario (UPME): tendencial + improvements in technologies and energy mix changes.
– Difference of 25 million tons of CO2 2012-2030.
20
25
30
35
40
45
50
2010 2015 2020 2025 2030
Emis
ion
es C
O2
(mill
on
es t
on
elad
as)
Referencia UPME - Base

Baseline- Transportation
20
25
30
35
40
45
50
2010 2015 2020 2025 2030
Emis
ion
es C
O2
(mill
on
es t
on
elad
as)
Referencia UPME - Base
Assumptions Uniandes & UPME
Same assumptions
‐ Scrappage‐ Technological improvement‐ More NG in the heavy vehicles
Diferentassumptions
‐ Average age of the fleet‐ Motorization rates and fleet growth‐ Urban travel: metropolitan areas and
modal split

Additional options
• Interurban passenger transportation– Impact of the 4G
concessions?
• Taxis
Proposed instruments – Transport (PND)
• Revision of the subsidy scheme applied to diesel and petrol.
• Measures to facilitate conversion to autogas, the compressed natural gas (CNG), electric mobility (especially in mass transit) and the use of biofuels.
• Reducing barriers to access to electricity and autogas technology, creating symmetrical to NGV conditions.

Baseline- AFOLU
FOLU– National scenario like the Amazon
2013 – 2017 scenario (Historical average period 2000-20012 + 10%) Then only average from 2000 to 2012.
– Land Use Changes have the same proportion of coverage presented in the BUR.
Agricultural– It grows proportionally with the
number of cattle in the country.
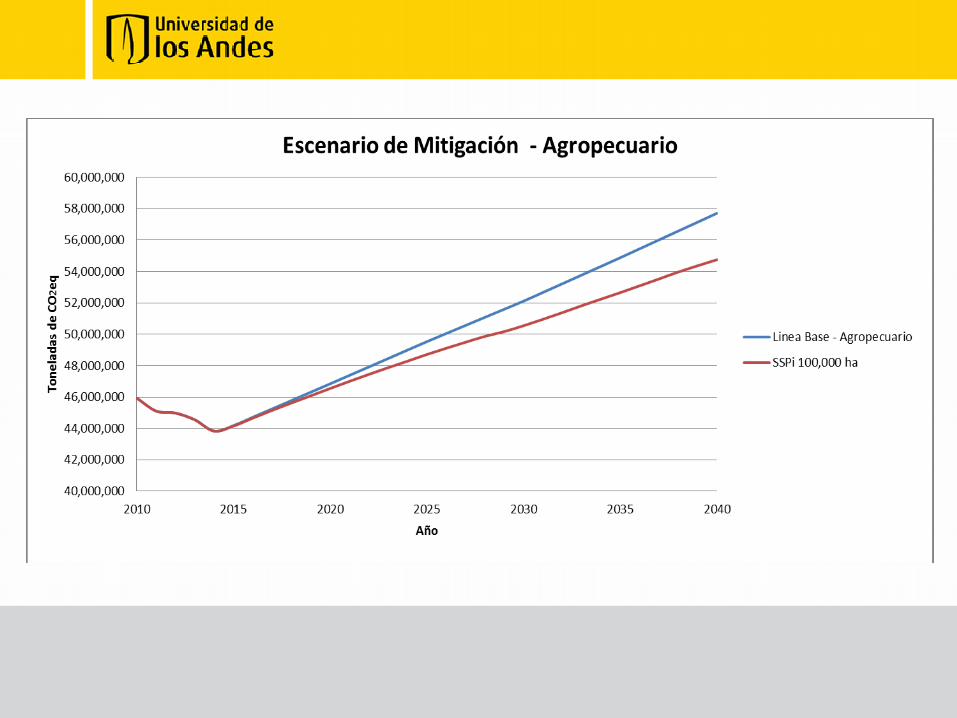

25,000 ha/año
5,000 ha/año
205,000 ha/año

Proposed instruments - Agriculture• Avocado and Mango plantations
– Financial and economic: credit accompanied by technical assistance for corporatisation (associativity and marketing).
• Best practices fertilization of rice and extension program for best practices in the potato crop– Financial and economic: credit Finagro.
– Voluntary type: education about the benefits of proper fertilization.
• Pasture rehabilitation in the Orinoco− Financial and economic: credit.
− Voluntary type: education about the benefits of technology.
• Microlevelling the land in rice cultivation− Financial type: subsidy.
• Biodigesters for drying coffee− Financial and economic: credit.
− Voluntary type: education about the benefits of technology.

Proposed instruments – Land Use Changes• Rational grazing in the Orinoco flood
• Voluntary type: education about the benefits of adequate pasture rotation.
• Amazon introduced pastures in Plana and the Rolling Amazon• Voluntary type: education about the benefits of the measure.
• Intensive silvopastoral systems• Voluntary action type (lifestyle changes).
• Information: education, research, technical assistance, dissemination.
• Forest plantations• Direct instruments: the Government must provide security for investment, leverage
investment, support until the returns on investment, risk management (climate and forest fires) are met; possible environmental licensing requirement for large plantations.
• Financial and economic instruments: credit and promotion Forestry Incentive Certificate (CIF).
• Public goods: improved production and marketing infrastructure. Research and technical assistance.
Baseline- Waste
• Currently in revision
– Methodology for establishing the base line of the sector.
– Official data and fundamentals of input assumptions to the models.

PND mitigation options - Waste
• Suitable delivery systems of public toilet service and disposal activities and use.
• Decrease in waste generation and increase recycling and recovery rates.
• Development of legal, institutional and technical management of risks to health and the environment related to chemicals framework.
• Increased waste through the closure and decommissioning of inadequate disposal sites.
• Oriented productive sectors in order to identify opportunities for using and recycling materials (waste as inputs), by the environmental authorities.

PND mitigation options - Wastewater
• Desarrollo de sistemas integrales sostenibles en el programa de manejo y saneamiento de vertimientos en distintas cuencas.
• Definición de políticas de drenaje urbano.
• Aumento del acceso de agua potable y manejo de aguas residuales en zonas rurales.

Other mitigation options PND
• Reducing consumption of substances that deplete the ozone layer.– Promote use of alternatives that do not affect the ozone layer and have low global
warming potential.
– Reducing consumption of exhausting ozone products.
• Integrated pollution management, with emphasis on conversion to cleaner technologies:– Program pollution and efficient use of water recuros.
– Process monitoring and surveillance of water quality.
– Establishing water quality objectives and permissible limits for discharges into the sea.

Proposed instruments - Solid waste (Three actors)
• Users– Taxes for waste disposal according to the amount
– Excise tax on specific products
– Instruments deposit / refund
• Manufacturers / Producers / Importers– Tax to materials
– Extended producer responsibility• Implementation systems own waste management company
• Hiring third parties who are responsible for waste management
• Municipal finance systems of solid waste management
• Administrators of treatment facilities– Use / Biogas burning mandatory
– Implementation of goals in landfill biogas
– Incentives for implementation of solid waste to reduce the amount dumped in landfills