construction cost 2013 - ahfc cost survey ... anchorage experienced the greatest percentage decline...
TRANSCRIPT

Source: Alaska Dept. of Labor and Workforce Development, Research and Analysis Section. ‐ 1 ‐
Construction Cost Survey
2013
Prepared for
Alaska Housing Finance Corporation Dan Fauske
Chief Executive Officer/Executive Director
Prepared by
Alaska Department of Labor and Workforce Development Research and Analysis Section
Sean Parnell, Governor
Dianne Blumer, Commissioner Dan Robinson, Research and Analysis Chief
Rob Kreiger, Economist
Karinne Wiebold, Economist Nicole M. Dusenberry, Research Analyst

Source: Alaska Dept. of Labor and Workforce Development, Research and Analysis Section. ‐ 2 ‐
Alaska Construction Cost Survey 2013
Introduction In January 2013, the twenty‐first annual survey of building supply, concrete, and shipping companies was conducted to determine the cost of a market basket of construction materials in communities throughout Alaska. The survey simulates contractor pricing for a market basket of materials used in the construction of a model home. The market basket represents approximately 30 percent of the materials used in the construction of the model home; however, it does not represent 30 percent of the total cost to build the model home. Figure 1 shows the floor plan of the model house used in this survey. The market basket provides a benchmark for comparing costs between the urban communities of Anchorage, Fairbanks, Juneau, Kenai, Ketchikan, Kodiak, Sitka, and Wasilla, as well as the rural communities of Barrow, Bethel, and Nome. In addition to the materials included in the market basket, suppliers also report the cost of doors and windows for the model home, while shipping companies provide the cost of transporting the market basket materials from Seattle to each community. A complete list of the market basket items and their specifications is included in Table 1. Construction techniques, building requirements, and styles vary greatly from region to region. For this reason, not all of the materials surveyed are necessarily used in all areas. Beginning in 2003, Barrow, Bethel, and Nome substituted metal roofing, which is more common in rural areas, in their respective market baskets for the asphalt shingles used in urban areas. Costs for the three rural areas surveyed exclude concrete and rebar since pilings support houses above permafrost in these locations instead of slab foundations. Unless otherwise specified, the market basket prices quoted exclude concrete, rebar, doors, and windows.
Comparing 2013 to 2012
Alaska Market Baskets
Seven of the 11 surveyed locations experienced increases in the overall cost of market basket materials. Increases ranged from 6 percent in Kodiak to 21 percent in Juneau. Bethel experienced a 7 percent drop, both Wasilla and Barrow fell 5 percent, and Nome decreased by less than 1 percent.
Seattle Market Basket
Eleven out of 15 individual core items increased in cost this year and Seattle’s overall total reached $21,500. This is an 11 percent increase ($2,057) over last year and a 19 percent increase ($3,423) from two years ago. The five most expensive items in Seattle increased this year by a combined $1,517.

Source: Alaska Dept. of Labor and Workforce Development, Research and Analysis Section. ‐ 3 ‐
Concrete
In 2013, the price of concrete rose in five areas, fell in two, and remained level in one. Increases ranged from 1 percent (Juneau) to 13 percent (Kenai). Prices declined by 5 percent in Wasilla and 3 percent in Ketchikan. Concrete prices held steady in Sitka at $5,940.
Wasilla was the least expensive location for concrete this year ($3,188), followed closely by Fairbanks ($3,304). Kodiak continues to top the list at $7,020, with Sitka and Juneau next in line with $5,940 and $5,475, respectively.
Rebar
In 2013, the price of rebar increased in six of the eight urban locations. Price increases ranged from 2 percent in Kenai to 51 percent in Anchorage. In Ketchikan and Kodiak, prices fell by 1 percent and 4 percent, respectively.
In the two most expensive areas, Sitka ($1,115) and Fairbanks ($1,027), the cost of rebar exceeded a thousand dollars.
The price for rebar in Anchorage rose 51 percent this year (to $991), pushing it from the lowest‐cost position into the third most expensive place.
Juneau and Kodiak, both at $724, currently have the least expensive price for rebar; 35 percent less than the most expensive location (Sitka).
The price of rebar in Seattle dropped $90, or 12 percent, to $690. No surveyed community in Alaska had a lower price.
Doors and Windows
The total cost of doors and windows increased in six of eleven locations in 2013. The percentage increases ranged from less than 1 percent in Juneau to 55 percent in Fairbanks.
Kodiak remained the most expensive surveyed location for doors and windows at $5,335, followed closely by Bethel at $5,323. Four of the eleven locations reached the $5,000 threshold.
Anchorage experienced the greatest percentage decline in the price of doors and windows, with prices falling 31 percent, or $1,323, year over year and making Anchorage the least expensive of the surveyed places at $3,004. Prices in Kodiak fell as well, by $1,390 or 21 percent, but that loss was not enough to keep Kodiak from ranking most expensive again in 2013.
After two consecutive years of significant price drops, Fairbanks was the least expensive of the surveyed areas in 2012. However, in 2013, prices increased dramatically ($1,752 or 55 percent). Fairbanks now rests in the middle of the price spectrum in fifth position.
Shipping Costs from Seattle
In 2013 transportation costs fell in 5 of 11 areas. The percentage decreases ranged from less than 1 percent in Juneau and Wasilla to 27 percent in Kodiak.

Source: Alaska Dept. of Labor and Workforce Development, Research and Analysis Section. ‐ 4 ‐
In Sitka, the costs of transporting building materials went up the most, increasing by 10 percent, or $723.
The net effect of shipping costs to all locations combined in 2013 was a decrease of $1,432 ‐ much less than the increase of $8,191 that occurred in 2012.
Construction Costs Around the State Building materials cost more in rural areas than urban areas, and more in northern Alaska than in Southcentral and Southeast Alaska. The main reason for this cost differential is the added expense of transportation – generally speaking, the further a community is from Seattle, the more expensive the price of building materials. The lack of infrastructure in rural areas requires materials to be barged or flown to the different areas and contributes to higher prices.
Statewide, the market basket cost ranged from a low of $23,854 in Anchorage to a high of $51,041 in Barrow.
After seven consecutive years as the most expensive urban location, Ketchikan overtook Kodiak this year, with a market basket cost of $27,828.
Prices decreased in all three rural locations (Barrow, Bethel, and Nome). The greatest decline was in Bethel, were prices fell seven percent, or $2,759.
The disparity between the most expensive urban location (Ketchikan) and the least expensive rural location (Bethel) shrank to $10,571, a third smaller than the year prior.
The cost of plain sheetrock in Bethel fell by $2,715; this was the greatest dollar value decrease for a single item among any Alaska location. This drop in the cost of sheetrock in Bethel nearly makes up for the 2012 increase of $2,908.
Juneau experienced the greatest price increase in 2013, with higher prices for 14 of 15 items resulting in an overall rise of 21 percent or $4,531.
Thirteen out of fifteen market basket items decreased in Wasilla resulting in a 5 percent drop in the market basket cost this year.
The cost of wood products went up considerably in many areas in 2012. Trusses increased over $1,400 in both Juneau and Barrow; underlayment went up over $500 in five locations, topping at an increase of $892 in Sitka; CDX increased by 19 to 46 percent in every urban community except Wasilla; and 2X4 studs went up in every urban location with the greatest increase in Anchorage at 49 percent. Wood price increases could be linked to a nationwide uptick in home construction after several years of stagnation, as well as rebuilding efforts in the wake of natural disasters such as super storm Sandy.

Source: Alaska Dept. of Labor and Workforce Development, Research and Analysis Section. ‐ 5 ‐
Alaska Suppliers Comparison Index Fluctuations in cost can best be examined in terms of the yearly change each area experiences in relation to a point of reference. One way to do this is to establish an index comparing each community’s market basket cost to a benchmark. The Alaska Suppliers Comparison Index uses the largest city in Alaska, Anchorage, as its benchmark. To create this index, Anchorage’s market basket cost is given an index value of 100. Dividing the average cost for a survey area by the Anchorage value ($23,854) produces the index value for that community.
The Anchorage market basket cost increased $2,330, or 11 percent in 2013. Areas with a price increase greater than 11 percent saw their index value rise; areas with a smaller price increase saw their index value fall.
The most significant index value change occurred in Barrow, where market basket prices fell 5 percent in 2013. Barrow’s index value fell 35 points, from 249 in 2012 to 214 in 2013, narrowing the spread from the Anchorage market basket cost.
In 2013, all urban locations had index values equal to or exceeding Anchorage‐ index values range from 100 (Wasilla) to 117 (Ketchikan).
Rural locations index values ranged from 161 in Bethel to 214 in Barrow; all three rural index values fell in 2013, as prices in the rural areas declined in both real terms and relative to Anchorage.
Construction Costs in Alaska vs. Seattle Suppliers from Seattle, Washington and the surrounding metropolitan area are included in the Alaska Construction Cost Survey as some contractors acquire their materials from outside Alaska. For Alaska suppliers, the market basket price already includes the cost of shipping the goods to the worksite in their community. Transportation costs are added to Seattle’s market basket total to estimate what local contractors would pay if they bought directly from Seattle suppliers and shipped their materials north to Alaska. Seattle prices cannot accurately be compared to prices in the three rural areas because the Seattle market basket and the total calculated shipping costs include asphalt shingles rather than metal roofing. For this reason, the following points pertain to the seven participating urban communities only.
The Seattle market basket increased 11 percent to $21,500. For the fifth consecutive year, builders in all urban Alaska locations, except Ketchikan, would save by purchasing the market basket items locally instead of buying in Seattle and having them shipped north.
The added cost for Ketchikan builders purchasing locally grew to $3,287 in 2013, from $2,327 in 2012. The savings for all other locations purchasing locally ranged from $332 (Juneau) to $5,938 (Wasilla).
Wasilla’s drop in the price of core market basket materials affected the amount of local purchase savings, increasing savings by $3,314. All of Alaska’s urban locations, except Wasilla and Ketchikan, experienced a decrease in their local/Seattle pricing spread ranging from a drop of $341 in Anchorage to $2,558 in Kodiak.

Source: Alaska Dept. of Labor and Workforce Development, Research and Analysis Section. ‐ 6 ‐
Transportation Index for Market Basket from Seattle One of the primary factors determining differences in building costs in Alaska is transportation. The cost of transporting materials from Seattle is directly related to the distance from Seattle to the surveyed communities. The Transportation Index uses basic market basket items rather than substituted items to compare the different communities. Metal roofing is lighter than asphalt shingles and, unlike shingles, can be shipped inside or outside a container. In the rural areas where metal roofing is substituted, the cost of shipping the roofing materials could be as much as two‐thirds less than asphalt shingles. Like the Alaska Suppliers Comparison Index, the Transportation Index assigns Anchorage an index value of 100. Dividing the average value for a survey area by the Anchorage shipping cost ($7,416) produces the index value for that community.
Shipping costs to Anchorage decreased $68, or 1 percent, in 2013. Areas with cost decreases of more than 1 percent have lower index values in 2013 than in 2012. Areas with cost increases, or decreases of less than 1 percent, have higher index values in 2013.
Transportation costs fell in 5 of 11 communities in 2013. Four communities ‐ Anchorage, Fairbanks, Juneau and Wasilla ‐ each fell by 1 percent or less; Kodiak, on the other hand, dropped by 27 percent.
Only two surveyed communities had transportation index values less than 100 in 2013; Juneau (68) and Ketchikan (41).
Sitka and Ketchikan had the highest percentage increases this year, resulting in shipping costs that were $723 more in Sitka and $158 more in Ketchikan than the year before.
Ketchikan is the closest city in proximity to Seattle of the 11 communities surveyed and as a result, shipping costs to Ketchikan are the lowest. This year’s shipping costs of $3,041, and corresponding index value of 41, were less than half that of Anchorage’s. On the opposite end of the scale, shipping costs to Barrow, the furthest location from Seattle, were $31,617. This figure is more than four times the cost of shipping to Anchorage and over ten times the cost of shipping to Ketchikan.
Alaska Construction Cost Survey Methodology The Alaska Department of Labor and Workforce Development’s Research and Analysis Section conducts the Alaska Construction Cost Survey annually on behalf of the Alaska Housing Finance Corporation. Twenty‐six local suppliers in Alaska and eight in Washington participated in this year’s survey. Alaska participants represent eleven unique firms, as some companies have stores in multiple locations. Similarly, Washington participants represent four unique firms. In addition, 14 concrete suppliers and six shipping companies participated in this year’s survey. When surveyed, building suppliers are asked what discounts, if any, they provide to contractors when purchasing a “package” of building materials sufficient to build a single family home. If a discount is

Source: Alaska Dept. of Labor and Workforce Development, Research and Analysis Section. ‐ 7 ‐
given, it is then factored into the market basket prices that the supplier reported. The same is true for concrete suppliers. To determine the cost of transportation, carriers are given the weight (approximately 49,000 pounds) and the volume (about 2,000 cubic feet) of the materials. These measurements generally require a 20‐foot platform and a 20‐foot container for all of the materials. Another assumption is that all of the fees for required services are included in the reported cost of the shipment. These services include loading/unloading, protection and fastening of goods, and delivery to the building site. The shippers’ market basket includes asphalt shingles rather than metal roofing. To reflect the vendors’ respective market shares, respondents’ values are weighted by the size of the respective firms. For Alaska businesses, size is based on the reported number of employees from the Alaska Department of Labor and Workforce Development’s employment security tax wage database for the second quarter of 2012. America’s Labor Market Information System provided 2013 employee counts for Seattle suppliers. Changes in the makeup of the market basket make year‐to‐year comparisons difficult. In 2001, cedar bevel siding was replaced with T1‐11 siding. This lowered not only the cost of the market basket, but also the transportation costs. In 2002, Barrow did not report prices for asphalt shingles because most new construction on the North Slope incorporates metal roofing materials instead. This affected both the transportation costs and the market basket total. As noted previously, in 2003, metal roofing was substituted for asphalt shingles in the three rural areas.

Average Price for Construction Materials Table 6-1
Alaska Suppliers2013
Market Basket Items Quantity Units Size Length Anchorage Fairbanks Juneau Kenai Ketchikan Kodiak Sitka Wasilla Barrow Bethel Nome
BCI 60 Series 768 ft 14" 2,825 $2,844 $3,665 $3,790 $2,450 $2,895 $3,126 $2,845 $4,160 $4,678 $4,756
2-4-1 T&G FF Underlay 4' x 8' 62 pcs 1 1/8" 2,401 2,879 2,879 3,102 3,164 3,247 3,719 2,415 6,200 3,171 4,628
T-111 8" Center Groove 4' x 10' Siding 60 pcs 5/8" 2,990 2,994 3,600 3,535 2,851 3,540 4,139 4,031 5,400 5,153 4,857
CDX 4' x 8' #53 106 pcs 5/8" 2,413 2,673 2,646 2,979 3,084 3,143 3,285 2,348 5,830 3,957 4,383
Studs #2 & btr Kiln-dried 164 pcs 2" x 4" 92 5/8" 497 505 516 539 603 609 540 516 1,476 843 884
Studs #2 & btr #14 Kiln-dried 263 pcs 2" x 6" 92 5/8" 1,205 1,199 1,186 1,287 1,505 1,464 1,265 1,255 2,630 2,107 2,246
4' x 12' Plain Sheetrock #84 95 pcs 1/2" 1,999 2,302 1,800 1,755 1,836 1,928 1,187 1,665 5,700 2,614 3,501
4' x 12' Type X Sheetrock #109 68 pcs 5/8" 1,525 1,775 1,569 1,486 1,550 1,700 1,359 1,397 4,760 3,691 3,057
Fiberglass Bat Insulation (2,560 sq ft) 40 bags R-38" x 24"64 sq ft 2,582 2,590 2,623 2,436 3,081 2,400 2,680 2,218 4,000 3,499 3,507
Fiberglass Bat Insulation (2,034 sq ft) 30 bags R-21" x 15"68 sq ft 1,487 1,482 1,508 1,511 1,718 1,680 1,770 1,417 2,400 2,125 2,217
NMB Electric Wire 3 boxes 250' 249 410 291 262 390 275 315 232 360 458 348
Single Breaker 15 pcs 15 Amp 100 125 80 114 100 83 94 103 195 208 122
Copper Pipe Type 'M' 150 ft 3/4" 318 321 386 336 623 293 375 296 375 561 675
ABS Pipe 100 ft 3" 221 214 202 245 286 265 250 194 400 388 427
3 Tab Shingles Brown 102 bundles 3,042 3,431 3,272 3,983 4,587 3,754 3,439 2,930 N/A N/A N/A
Metal Roofing 3,215 sq ft 3' x 20' N/A N/A N/A N/A N/A N/A N/A N/A 7,155 4,946 6,269
Total (Without Concrete & Rebar) $23,854 $25,744 $26,223 $27,360 $27,828 $27,276 $27,543 $23,862 $51,041 $38,399 $41,877
Concrete 30 yds 3,677 3,304 5,475 3,930 5,250 7,020 5,940 3,188
#4 Rebar 93 pcs 1/2" 20' 991 1,027 724 794 846 724 1,115 737
Total (With Concrete & Rebar) $28,522 $30,075 $32,422 $32,084 $33,924 $35,020 $34,598 $27,787
Source: Alaska Department of Labor and Workforce Development, Research and Analysis Section, Construction Cost Survey 2013
Weighted average using 2012 Q2 ODB202 or 2013 ALMIS Employer Database (1st Edition) number of employees where applicable
Totals may not sum due to rounding
N/A = Not Applicable
Urban Rural *
* Rural areas exclude
concrete & rebar

Average Price for Doors & Windows Table 6-2
Alaska Suppliers2013
Market Basket Items Quantity Units Size Anchorage Fairbanks Juneau Kenai Ketchikan Kodiak Sitka Wasilla Barrow Bethel Nome
R7 Metal Insulated Doors with 6" Jamb 2 pcs 3' $389 $481 $383 $517 $543 $701 $618 $396 $700 $728 $898
Low E Argon Windows with R > 2.8 Vinyl Casements 3 pcs 2.6' x 3' $583 $753 $794 $547 $897 $840 $618 $470 $900 $1,091 $818
Low E Argon Windows with R > 2.8 Vinyl Casements, 5.7 E-Gress 6 pcs 2.6' x 4' $1,328 $1,771 $1,806 $1,409 $1,962 $1,794 $1,554 $1,298 $2,100 $2,650 $1,885
Low E Argon Windows with R > 2.8 Vinyl Casements, 5.7 E-Gress 2 pcs 8.0' x 4' $704 $1,917 $1,503 $939 $1,789 $2,000 $1,242 $972 $1,300 $854 $859
Total Cost of Doors & Windows $3,004 $4,922 $4,486 $3,412 $5,191 $5,335 $4,032 $3,136 $5,000 $5,323 $4,460
Source: Alaska Department of Labor and Workforce Development, Research and Analysis Section, Construction Cost Survey 2013
Weighted average using 2012 Q2 ODB202 or 2013 ALMIS Employer Database (1st Edition) number of employees where applicable
Totals may not sum due to rounding
Urban Rural

Average Price for Construction Materials Table 6-3
Seattle Suppliers (without Concrete, Doors & Windows)2013
Market Basket Items Quantity Units Size Length Seattle Area
BCI 60 Series 768 ft 14" $2,520
2-4-1 T&G FF Underlay 4' x 8' 62 pcs 1 1/8" 2,769
T-111 8" Center Groove 4' x 10' Siding 60 pcs 5/8" 3,003
CDX 4' x 8' #53 106 pcs 5/8" 2,490
Studs #2 & btr Kiln-dried 164 pcs 2" x 4" 92 5/8" 453
Studs #2 & btr #14 Kiln-dried 263 pcs 2" x 6" 92 5/8" 1,089
4' x 12' Plain Sheetrock #84 95 pcs 1/2" 1,232
4' x 12' Type X Sheetrock #109 68 pcs 5/8" 1,122
3 Tab Shingles Brown 102 bundles 2,254
Fiberglass Bat Insulation (2,560 sq ft) 40 bags R-38" x 24" 64 sq ft 2,401
Fiberglass Bat Insulation (2,034 sq ft) 30 bags R-21" x 15" 68 sq ft 1,432
NMB Electric Wire 3 boxes 250' 250
Single Breaker 15 pcs 15 Amp 66
Copper Pipe Type 'M' 150 ft 3/4" 264
ABS Pipe 100 ft 3" 155
Total (Without Rebar) $21,500
#4 Rebar 93 pcs 1/2" 20' 690
Total (With Rebar) $22,190
Source: Alaska Department of Labor and Workforce Development, Research and Analysis Section, Construction Cost Survey 2013
Weighted average using 2012 Q2 ODB202 or 2013 ALMIS Employer Database (1st Edition) number of employees where applicable
Totals may not sum due to rounding

Transportation Cost of Market Basket Table 6-4
Shipping & Handling (Without Concrete, Rebar, Doors, & Windows)2013
Destination Seattle Transportation Index
Ketchikan $3,041 41
Juneau 5,055 68
Sitka 8,149 110
Anchorage 7,416 100
Wasilla 8,300 112
Kenai 9,432 127
Fairbanks 9,279 125
Kodiak 8,376 113
Bethel 13,392 181
Nome 16,879 228
Barrow 31,617 426
Source: Alaska Department of Labor and Workforce Development, Research and Analysis Section, Construction Cost Survey,
2013
Weighted average using 2012 Q2 ODB202 or 2013 ALMIS Employer Database (1st Edition) number of employees where
applicable

Artist Rendering of Model Home
Source: Alaska Department of Labor and Workforce Development, Research and Analysis Section, Construction Cost Survey, 2013
Note: 1/ Seattle prices include asphalt shingles. 2/ Rural areas include metal roofing instead of asphalt shingles.

Floor Plan of Model Home
Source: Alaska Department of Labor and Workforce Development, Research and Analysis Section, Construction Cost Survey, 2013
Note: 1/ Seattle prices include asphalt shingles. 2/ Rural areas include metal roofing instead of asphalt shingles.

Average Cost of Market Basket, 2013 Urban & Rural Residential Construction (Without Concrete, Rebar, Doors, & Windows)
Alaska and Seattle Suppliers
Source: Alaska Department of Labor and Workforce Development, Research and Analysis Section, Construction Cost Survey, 2013
Note: 1/ Rural areas include metal roofing instead of asphalt shingles.

Alaska Suppliers Comparison Index Urban & Rural Residential Construction (Without Concrete, Rebar, Doors, & Windows)
Index by Community with Anchorage as Baseline
Source: Alaska Department of Labor and Workforce Development, Research and Analysis Section, Construction Cost Survey, 2013
Note: 1/ Rural areas include metal roofing instead of asphalt shingles.

Transportation Index for Market Basket from Seattle Urban & Rural Residential Construction (Without Concrete, Rebar, Doors, & Windows)
Index by Community with Anchorage as Baseline
Source: Alaska Department of Labor and Workforce Development, Research and Analysis Section, Construction Cost Survey, 2013
Note: 1/ Rural areas include metal roofing instead of asphalt shingles.
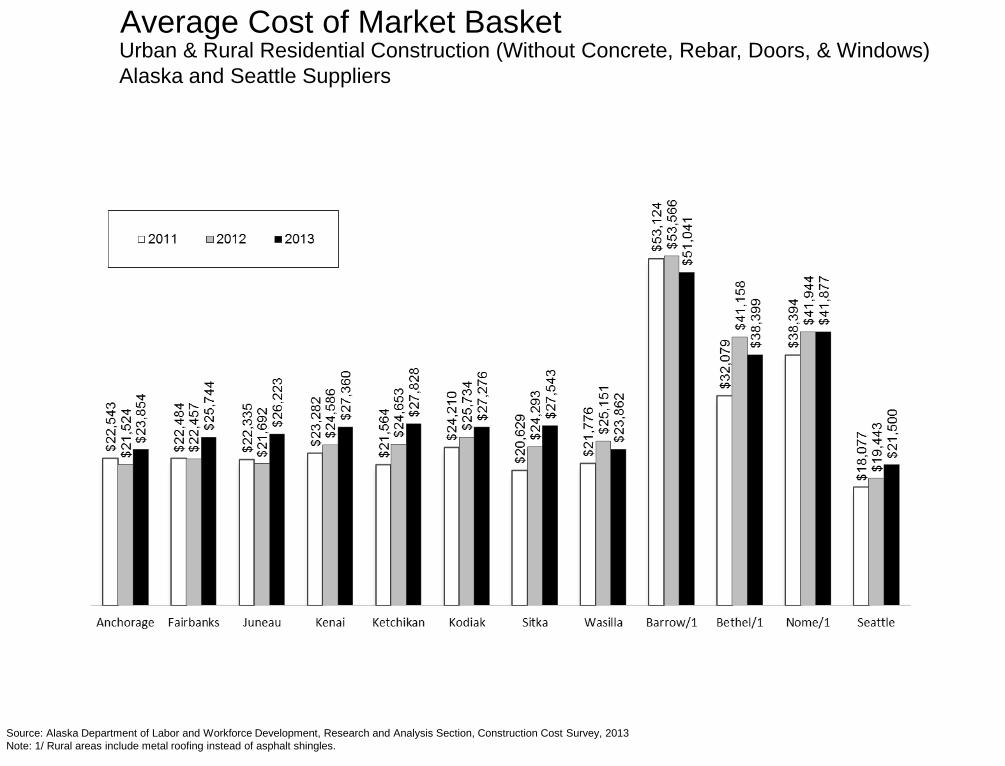
Average Cost of Market Basket Urban & Rural Residential Construction (Without Concrete, Rebar, Doors, & Windows)
Alaska and Seattle Suppliers
Source: Alaska Department of Labor and Workforce Development, Research and Analysis Section, Construction Cost Survey, 2013
Note: 1/ Rural areas include metal roofing instead of asphalt shingles.

Average Cost of Market Basket, 2013 Alaska & Seattle Suppliers (Without Concrete, Rebar, Doors, & Windows)
Source: Alaska Department of Labor and Workforce Development, Research and Analysis Section, Construction Cost Survey, 2013
Note: 1/ Rural areas include metal roofing instead of asphalt shingles. 2/ Seattle prices include asphalt shingles and shipping to Alaska locations.