construction and annotation of a high density snp linkage ... · 2 the atlantic salmon (salmo...
TRANSCRIPT

1
Construction and annotation of a high density SNP linkage map of 1
the Atlantic salmon (Salmo salar) genome 2
Hsin Y. Tsai1†
, Diego Robledo1,2†
, Natalie R. Lowe1, Michael Bekaert
3, John B 3
Taggart3, James E Bron
3† and Ross D Houston
1* 4
5
1 The Roslin Institute and Royal (Dick) School of Veterinary Studies, University of 6
Edinburgh, Midlothian EH25 9RG, UK 7
2 Departamento de Genética, Facultad de Biología, Universidad de Santiago de 8
Compostela, Santiago de Compostela 15782, Spain 9
3 Institute of Aquaculture, School of Natural Sciences, University of Stirling, 10
Stirling FK9 4LA, UK 11
12
* Corresponding author: [email protected] 13
† These authors contributed equally to this manuscript 14
G3: Genes|Genomes|Genetics Early Online, published on May 18, 2016 as doi:10.1534/g3.116.029009
© The Author(s) 2013. Published by the Genetics Society of America.

2
Abstract 15
Background 16
High density linkage maps are useful tools for fine-scale mapping of quantitative trait 17
loci, and characterisation of the recombination landscape of a species’ genome. 18
Genomic resources for Atlantic salmon (Salmo salar) include a well-assembled 19
reference genome and high density SNP arrays. Our aim was to create a high density 20
linkage map, and to align it with the reference genome assembly. 21
Results 22
Over 96 K SNPs were mapped and ordered on the 29 salmon linkage groups using a 23
pedigreed population comprising 622 fish from 60 nuclear families, all genotyped with 24
the ‘ssalar01’ high density SNP array. The number of SNPs per group showed a high 25
positive correlation with physical chromosome length (r = 0.95). While the order of 26
markers on the genetic and physical maps was generally consistent, areas of discrepancy 27
were identified. Approximately 6.5 % of the previously unmapped reference genome 28
sequence was assigned to chromosomes using the linkage map. Male recombination rate 29
was lower than females across the vast majority of the genome, but with a notable peak 30
in sub-telomeric regions. Finally, using RNA-Seq data to annotate the reference genome, 31
the mapped SNPs were categorised according to their predicted function, including 32
annotation of ~ 2.5 K putative non-synonymous variants. 33
Conclusions: The highest density SNP linkage map for any salmonid species has been 34
created, annotated, and integrated with the Atlantic salmon reference genome assembly. 35
This map highlights the marked heterochiasmy of salmon, and provides a useful 36
resource for salmonid genetics and genomics research. 37

3
Keywords: Salmo salar, linkage map, SNP array, recombination, RNA-Seq 38

4
Introduction 39
Linkage maps are valuable tools for the investigation of the genetic basis of complex 40
traits in farmed animal species. For several decades, linkage maps have enabled the 41
mapping of quantitative trait loci (QTL), and formed the basis of attempts at positional 42
cloning of these QTL in both terrestrial (Goddard and Hayes 2009) and aquatic farmed 43
species (Danzmann and Gharbi 2001). High throughput sequencing technologies have 44
now expedited the discovery of millions of single nucleotide polymorphism (SNP) 45
markers (Liu 2010). These SNPs form the basis of modern, high-resolution genetics 46
studies, and underpin genomic selection for faster genetic improvement in terrestrial 47
livestock and, laterally, aquaculture breeding programmes (Meuwissen et al. 2001; 48
Goddard et al. 2010; Sonesson 2010; Yáñez et al. 2014; Yáñez et al. 2015). Scoring of 49
genome-wide SNPs in large populations is achieved either through genotyping by 50
sequencing (Davey et al. 2011), or by creation and application of SNP arrays (e.g. 51
Houston et al. 2014; Yáñez et al. 2016). High density linkage maps based on these SNP 52
datasets can aid in high resolution mapping of loci underpinning complex traits in 53
farmed animals (e.g. Shi et al. 2014; Wang et al. 2015) , improvements in assembly of 54
reference sequences (Fierst 2015), and knowledge of the recombination landscape of the 55
genome (e.g. Groenen et al. 2009; Tortereau et al. 2012). 56
57
Reference genome assemblies are now available for several aquaculture species, 58
including Atlantic salmon (Davidson et al. 2010; Lien et al. 2016). Once anchored and 59
annotated, these genome assemblies provide invaluable physical maps of the genome. 60
Due to a recent whole genome duplication, and the relatively high frequency of long 61
and diverse repeat elements (de Boer et al. 2007; Davidson et al. 2010; Lien et al. 62
2016), assembly of the Atlantic salmon genome has been challenging, with ~ 22 % of 63
5
the current assembly (NCBI GCA_000233375.4) yet to be assigned to chromosome. 64
Salmonid species exhibit marked heterochiasmy, with males showing very low 65
recombination rates across much of the genome, but with much higher recombination 66
rates thought to occur in telomeric regions (e.g. Sakamoto et al. 2000; Lien et al. 2011; 67
Miller et al. 2011; Brieuc et al. 2014; Gonen et al. 2014). This phenomenon may be 68
related to the pairing and recombination between homeologous regions of the genome, 69
particularly in males (Wright Jr. et al. 1983; Allendorf 1984; Allendorf et al. 2015). 70
Several high density SNP arrays exist for Atlantic salmon (Houston et al. 2014; Yáñez 71
et al. 2016), and integrated linkage maps based on those arrays would facilitate detailed 72
interrogation of the unusual recombination landscape. Further, while the high density 73
SNP arrays have been applied for GWAS and genomic prediction (Ødegård et al. 2014; 74
Correa et al. 2015; Tsai et al. 2015; Tsai et al. 2016), such studies would be enhanced 75
by annotation of the SNPs according to their genomic position, nearby genes, and their 76
predicted effects. 77
78
Therefore, the purposes of this study were: (i) to construct a linkage map of the SNPs 79
contained on the publicly available high density Affymetrix Atlantic salmon SNP array 80
‘ssalar01’ (Houston et al. 2014); (ii) to align and compare the linkage map to the latest 81
Atlantic salmon reference genome assembly (Genbank assembly accession 82
GCA_000233375.4); (iii) to assign previously unmapped reference genome contigs and 83
genes to chromosomes; (iv) to investigate and compare patterns of male and female 84
recombination across the genome; and (v) to annotate the SNPs according to their 85
position relative to putative genes, including prediction of variant effects. 86
87
Materials and Methods 88

6
Animals 89
The population used for the linkage analysis was a subset of those described in Gharbi 90
et al. (Gharbi et al. 2015), purchased from Landcatch Natural Selection (LNS, Ormsary, 91
UK). The juvenile fish used in the current study were from the 2007 year group of the 92
LNS broodstock and were from 60 full sibling families (28 sires and 60 dams) 93
comprising at least six progeny per family. The trial (which focussed on resistance to 94
sea lice) was performed by Marine Environmental Research Laboratory (Machrihanish, 95
UK) and under approval of ethics review committee in the University of Stirling 96
(Stirling, UK). Full details of the trial and the population used have been described 97
previously (Houston et al. 2014; Gharbi et al. 2015; Tsai et al. 2015; Tsai et al. 2016). 98
SNP Array Genotyping 99
Genomic DNA from each sample was extracted (Qiagen, Crawley, UK) and genotyped 100
for the ‘ssalar01’ Affymetrix Axiom SNP array containing ~ 132 K validated SNPs. 101
Details of the creation and testing of the SNP array are given in Houston et al. (2014). 102
Details of the quality control filtering of the genotypes are given in Tsai et al. (2015). 103
Briefly, the Plink software was used to filter the validated SNPs by removing 104
individuals and SNPs with excessive (> 1%) Mendelian errors, and SNPs with minor 105
allele frequency (MAF) < 0.05 in this dataset. In total, 111,908 SNPs were retained for 106
622 fish (534 offspring, 28 sires and 60 dams). Details of all the SNP markers are 107
available at dbSNP (Sherry et al. 2001) (NCBI ss# 947429275 - 947844429.) 108
Linkage analysis 109
Lep-Map2 (Rastas et al. 2016) was used to construct the linkage maps. The ‘Filtering’ 110
function was applied to the initial input dataset, with ‘MAFLimit’ set at 0.05 (consistent 111
with filtering described above), and ‘dataTolerance’ set at 0.001 to remove markers 112

7
exhibiting significant segregation distortion. The ‘SeparateChromosomes’ function was 113
applied to cluster markers into linkage groups, with the LOD threshold of 36 applied 114
(chosen because this is the level at which 29 groups were formed, consistent with the 115
expected karyotype of European Atlantic salmon). The function ‘JoinSingles’ was 116
applied to assign additional single SNPs to existing linkage groups. Subsequently, the 117
function ‘OrderMarkers’ was applied to estimate the marker order within each linkage 118
group. Using parallelised computing, this step was repeated several times to assess 119
consistency of marker order between replicates. Sex-specific linkage maps were 120
generated because of the known difference in recombination rate between male and 121
female Atlantic salmon (Gilbey et al. 2004; Moen et al. 2004; Lien et al. 2011; Gonen 122
et al. 2014). To compare the genetic and physical maps, the flanking sequence for each 123
SNP locus (35 bp either side) was aligned with the Atlantic salmon reference genome 124
assembly (Genbank assembly GCA_000233375.4) (Davidson et al. 2010), and only 125
complete and exact matches to the reference genome (e-value = 3 x 10-29
) were retained. 126
In cases where the SNP flanking sequence aligned exactly with > 1 genomic region, the 127
alignment corresponding to the chromosome that was consistent with the linkage 128
mapping of the SNP was retained. 129
RNA sequencing 130
Atlantic salmon fry samples from two different families from the Scottish breeding 131
nucleus of Landcatch Natural Selection Ltd were selected for RNA sequencing, 132
corresponding to families ‘B’ and ‘S’ in Houston et al. (2010) (Houston et al. 2010). 133
Full details of the library preparation and sequencing are given in Houston et al. 2014 134
(Houston et al. 2014) (although for the current study, only two of the three families 135
previously sequenced were used for assembling the transcriptome. This was because the 136
third family ‘C’ had large variation in sequence coverage between samples). Briefly, a 137

8
total of 48 individual fry were homogenised in 5 mL TRI Reagent (Sigma, USA) using 138
a Polytron mechanical homogeniser (Kinemetica, Switzerland). The RNA was isolated 139
from 1 mL of the homogenate, using 0.5 vol. RNA precipitation solution (1.2 mol/L 140
sodium chloride; 0.8 mol/L sodium citrate sesquihydrate) and 0.5 vol. isopropanol. 141
Following re-suspension in nuclease-free water, the RNA was purified using the 142
RNeasy Mini kit (Qiagen, UK). The RNA integrity numbers from the Bioanalyzer 2100 143
(Agilent, USA) were all over 9.9. Thereafter, the Illumina Truseq RNA Sample 144
Preparation kit v1 protocol was followed directly, using 4 μg of RNA per sample as 145
starting material. Libraries were checked for quality and quantified using the 146
Bioanalyzer 2100 (Agilent, USA), before being sequenced in barcoded pools of 12 147
individual fish on the Illumina Hiseq 2000 instrument (100 base paired-end sequencing, 148
v3 chemistry) and all sequence data were deposited in the European Nucleotide Archive 149
under accession number ERP003968. 150
Transcriptome assembly 151
The quality of the sequencing output was assessed using FastQC 152
(http://www.bioinformatics.babraham.ac.uk/projects/fastqc/; version 0.11.2). Quality 153
filtering and removal of residual adaptor sequences was conducted on read pairs using 154
Trimmomatic v.0.32 (Bolger et al. 2014). Specifically, residual Illumina specific 155
adaptors were clipped from the reads, leading and trailing bases with a Phred score less 156
than 15 were removed, and the read trimmed if a sliding window average Phred score 157
over four bases was less than 20. Only paired-end reads where both sequences had a 158
length greater than 36 bases post-filtering were retained. The most recent salmon 159
genome assembly (ICSASG_v2, ncbi assembly GCA_000233375.4) was used as a 160
reference for read mapping. Filtered reads were mapped to the genome using Tophat2 v. 161
2.0.12 (Kim et al. 2013) that leverages the short read aligner Bowtie2 v.2.2.3 162

9
(Langmead and Salzberg 2012), allowing a maximum of two mismatches. Using 163
Cuffdiff v.2.2.1 (Trapnell et al. 2012), the aligned reads were merged into a 164
transcriptome assembly. The transcriptome was annotated against NCBI’s non-165
redundant protein and nucleic acid databases using local Blast v.2.3.0+ (Altschul et al. 166
1997) with a cut-off e-value of 10-5
. The completeness of the salmon transcriptome was 167
evaluated using Blast searches with a cut-off e-value of10-25
against a set of 248 core 168
eukaryotic genes (Parra et al. 2007). 169
SNP annotation 170
For every gene, the most highly expressed transcript variant was selected to identify 171
candidate coding regions using Transdecoder v.2.0.1 172
(http://transdecoder.sourceforge.net/). Open Reading Frames (ORF) were predicted for 173
every transcript, requiring a minimum of 100 amino acids (to reduce the number of 174
potential false positives). All the predicted proteins were aligned against the manually 175
curated UniRef90 database using local Blast v.2.3.0+ (Altschul et al. 1997) with a cut-176
off e-value of 10-5
, discarding ORFs without positive matches. Finally, the longest ORF 177
was selected as the canonical protein for each transcript. The final set of coding regions 178
was used to build a genome annotation file which was used to predict the functional 179
significance of all the SNPs on the ‘ssalar01’ SNP array using SnpEff v.4.2 (Cingolani 180
et al. 2012). 181
182
Results and Discussion 183
Linkage map construction 184
A pedigreed population of 622 individual Atlantic salmon (534 offspring, 28 sires and 185
60 dams) were successfully genotyped using the high density Affymetrix SNP array 186

10
‘ssalar01’ (Houston et al. 2014). SNPs were assigned to putative linkage groups and 187
then ordered on each linkage group using Lep-Map2 (Rastas et al. 2016). A total of 188
111,908 SNPs were retained following QC filtering, of which 96,396 (86%) were 189
assigned and ordered on the 29 linkage groups (which correspond to the karyotype of 190
European Atlantic salmon). The number of SNPs per chromosome varied from 1128 to 191
6080, and was positively correlated with the number of SNPs per chromosome in 192
previously published Atlantic salmon SNP linkage maps of Lien et al. (2011) (r = 0.94), 193
and Gonen et al. (2014) (r = 0.87). The flanking sequences of the SNPs on the linkage 194
map were aligned to the salmon reference genome assembly (GCA_000233375.4) to 195
determine their putative physical position (File S1). There was a high positive 196
correlation between the genetic map position and the reference sequence position of the 197
SNPs (Table 1), and the number of SNPs per chromosome was dependent on 198
chromosome sequence length (Figure 1). SNP density for the successfully genotyped 199
and mapped markers from the ‘ssalar1’ array is relatively constant across the genome, 200
with an average of 1 SNP per ~ 23 kb in the assembled chromosomes, and 1 SNP per 201
0.05 cM (male) and 0.07 cM (female) in the full linkage map. 202
203
The most recent Atlantic salmon reference genome assembly (GCA_000233375.4) 204
contains 2,240 MB of sequence contigs anchored to chromosomes (78 % of total 205
assembly), and 647 MB of contigs that are not yet assigned to chromosome (22 % of 206
total assembly). Linkage mapping using high density SNP arrays was applied to 207
orientate reference genome contigs and scaffolds, and identify putative misassemblies in 208
the recently-published salmon genome paper (Lien et al. 2016). However, those linkage 209
maps are unpublished. In the current study, a total of 4,581 previously unassigned 210
contigs comprising 41.9 MB of sequence were tentatively mapped to the 29 salmon 211

11
chromosomes (Table 1, File S2). While additional experiments would be required to 212
confirm the correct position of these genome contigs, this linkage map has enabled an 213
additional ~ 1 % of the entire reference genome assembly to be tentatively mapped to 214
chromosomes, corresponding to ~ 6.5 % of the previously unassigned genome assembly. 215
These contigs were spread across all 29 chromosome pairs (Table 1; details given in 216
File S1). Novel potentially misassembled regions were also identified in the reference 217
sequence via regions of discordance between the linkage and physical maps, an example 218
of which is between ~ 11.5 MB and 11.8 MB on Chromosome 26 (File S3). 219
220
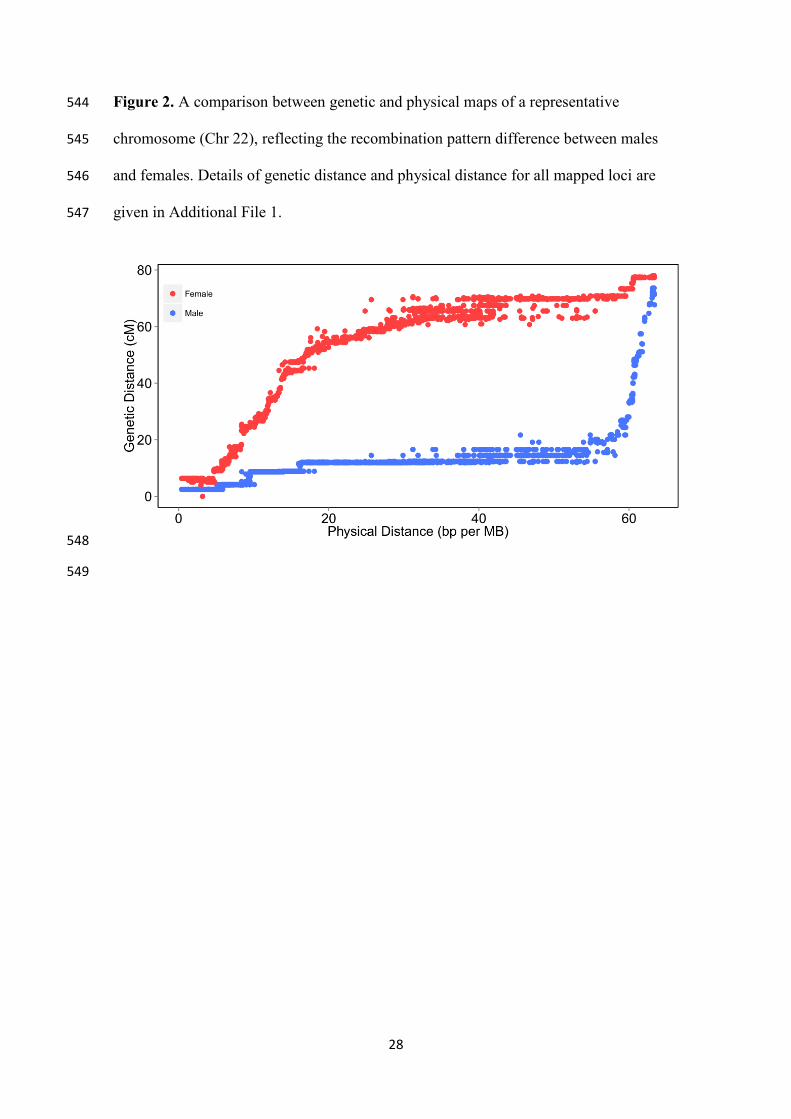
There were substantial differences in the patterns of recombination between the sexes. 221
The female linkage map covered 7,153 cM (ranging from 72.6 to 689.0 cM per 222
chromosome) whereas the male linkage map covered 4,769 cM (ranging from 70.2 to 223
428.8 cM per chromosome) (Table 1). Overall, the female map was ~ 1.5 × longer than 224
the male map, consistent with previous Atlantic salmon SNP linkage maps (Lien et al. 225
2011; Gonen et al. 2014). The pattern of recombination across the genome was notably 226
different between the sexes, with female recombination rates being higher across much 227
of the genome, except for some subtelomeric regions where male recombination was 228
substantially higher (e.g. Figure 2). This phenomenon has been observed in several 229
previous salmonid linkage maps (Sakamoto et al. 2000; Lien et al. 2011; Miller et al. 230
2011; Brieuc et al. 2014; Gonen et al. 2014), but the availability of the reference 231
genome enables a more detailed investigation. Therefore, linkage and physical maps 232
were aligned and a proxy of recombination rate (number of centimorgans per megabase) 233
was estimated at regular intervals on each chromosome, with each interval 234
corresponding to 2 % of the total chromosome’s physical length. The average 235
recombination rate for each corresponding interval on the 29 chromosomes was 236

12
calculated and graphed against the distance from the nearest telomere (Figure 3). The 237
results highlight the phenomenon of markedly high male recombination in some sub-238
telomeric regions, on average ~10 × higher than regions of the genome nearer the 239
middle of the chromosome (Figure 3). 240
Transcriptome assembly and annotation 241
To annotate the mapped SNPs and predict their function according to their position 242
relative to putative genes, an annotated reference transcriptome was created. RNA-seq 243
of 48 individual salmon fry yielded 927 M raw paired-end sequence reads, of which 244
93% remained after trimming and filtering. Filtered reads were aligned to the most 245
recent Atlantic salmon reference genome assembly (GCA_000233375.4; 82.2 % 246
concordant pair alignment) to generate a reference transcriptome. The alignment 247
resolved 202,009 putative transcripts corresponding to 65,803 putative genes, consisting 248
of 36,846 single transcript genes and 28,957 multi-transcript genes (Table 2, File S4). 249
The average length of the transcripts was 4,127 bp with an N50 of 5,710, an N90 of 250
2,323 and > 90 % of transcripts longer than 500 bp. The assembled transcripts were 251
annotated using BLASTx and BLASTn searches against the NCBI non-redundant 252
protein and nucleic acid databases respectively. Of the 65,804 total putative genes, 253
58,416 (88.8 %) showed significant similarity to known proteins, while an additional 254
2,732 (4.2 %) showed significant similarity to nucleotide entries in the NCBI non-255
redundant nucleotide database (File S5). The proportion of unannotated genes was 256
higher for the shorter transcript sequences (File S6), but all transcripts were retained 257
(since a relevant minimum size threshold was not apparent). The completeness of the 258
transcriptome was evaluated against a set of 248 core eukaryotic genes described in 259
Parra et al. (2007); 247 of these genes were found in our transcriptome (BLASTn e-260

13
value < E10-25
), 222 of which had at least 90 % coverage, and 153 of which were fully 261
covered. A total of 53,950 identified genes were located within chromosomes on the 262
Atlantic salmon genome assembly, while the remaining 11,853 were aligned to 263
unassigned contigs. Of these 11,853 genes, 1,647 (13.9 %) were located in contigs 264
assigned to chromosomes using the linkage map of the current study (Table 1; File S7). 265
SNP annotation 266
The RNA-seq based transcriptome described above was used to predict open reading 267
frames and protein sequences in order to annotate the SNPs present on the ‘ssalar01’ 268
array (Table 3, File S8). A total of 106,424 SNPs (95 %) matched a single genome 269
location, while 2,857 SNPs matched two different genomic positions, related in part to 270
the salmonid specific genomic duplication. An additional 880 SNPs mapped to 3 or 271
more genome locations, indicative of repetitive elements or protein domains. It should 272
be noted that filtering of SNPs during the design process for the array would have 273
removed the majority of SNPs mapping to two or more locations (Houston et al. 2014). 274
The tentative annotation of all SNPs is given (File S6), but only those mapping to 275
unique genomic regions are described below. Of these 106,424 unique SNPs, 48,842 276
(45.9 %) were located in putative genes, with the remainder mapping to intergenic 277
regions. Of the genic SNPs, the majority were in putative intronic regions (34,534 – 278
70.7%), although 483 of these were associated with splicing regions and therefore have 279
a higher likelihood of being functionally relevant. The remaining genic SNPs were 280
mapped to putative UTRs (8,091), with a larger amount of SNPs in the 3’ UTR as 281
expected (6,224 vs 1,867 5’UTR); and to putative exons (5,856). A total of 2,465 282
putative non-synonymous SNPs were identified, in addition to 39 SNPs predicted to 283
cause gain / loss of start / stop codons, which have a high likelihood of functional 284
consequences (File S8). As an example, a premature stop codon was found in 285

14
phospholipase D, an enzyme which produces the signal molecule phosphatidic acid 286
which is also a precursor for the biosynthesis of many other lipids (McDermott et al. 287
2004). The distribution of the SNP functional categories across the 29 chromosome 288
pairs is given in Table 4. It is important to note that these predicted SNP effects will 289
contain a proportion of false positives due to inevitable errors in the predicted structure 290
of the genes. Nonetheless, their annotation combined with their linkage and physical 291
mapping provides a valuable resource for users of the high density ‘ssalar01’ array in 292
particular, and for salmonid genomics researchers in general. 293
Conclusion 294
A linkage map comprising > 96 K SNPs from the ‘ssalar01’ array was created, 295
annotated and integrated with the reference genome assembly. This represents the 296
highest density SNP linkage map for any salmonid species. Alignment of the linkage 297
and physical maps revealed good agreement between genetic map, and the mapping 298
allowed a further circa 1 % of the salmon reference genome assembly to be tentatively 299
assigned to chromosomes. Marked heterochiasmy was observed, with male 300
recombination rate substantially lower than females across much of the genome, but 301
with a notably high level in some sub-telomeric regions. Finally, the mapped SNPs were 302
annotated and categorised according to their predicted function. The map will be 303
another useful resource for salmonid genomics research. 304
Funding 305
This research was supported by Biotechnology and Biological Sciences Research 306
Council (BBSRC) grants (BB/H022007/1, BB/F002750/1, BB/F001959/1) awarded to 307
The Roslin Institute and University of Stirling, and by BBSRC Institute Strategic 308
Funding Grants to The Roslin Institute (BB/J004235/1, BB/J004324/1, BB/J004243/1). 309

15
DR was funded by a postgraduate grant from Fundación Barrié. The authors also 310
acknowledge the support of the MASTS pooling initiative (The Marine Alliance for 311
Science and Technology for Scotland) in the completion of this study. MASTS is 312
funded by the Scottish Funding Council (grant reference HR09011) and contributing 313
institutions. 314
315
Acknowledgements 316
The authors gratefully acknowledge (i) Mike Stear, Karim Gharbi, Bill Roy, Matt 317
Tinsley, Alastair Hamilton, Derrick Guy and Alan Tinch for provision of the data and 318
samples from the population used for map construction; (ii) David Verner-Jeffreys, 319
Richard Paley, Georgina Rimmer and Ian Tew at the Centre for Environment Fisheries 320
and Aquaculture Science (Cefas) for contribution to the disease challenge experiment 321
from which the RNA-Seq samples were derived; and (iii) Lep-Map 2 software 322
developer, Pasi Rastas, for the technical suggestions for the linkage map construction. 323
RNA sequencing and SNP array genotyping were carried out by Edinburgh Genomics, 324
The University of Edinburgh. Edinburgh Genomics is partly supported through core 325
grants from NERC (R8/H10/56), MRC (MR/K001744/1) and BBSRC (BB/J004243/1) 326
327
Competing interests 328
The authors declare that they have no competing interests. 329
330
Author contributions 331
Conceived and designed the study: RDH, JEB, JBT; Performed laboratory experiments: 332
NRL; Analysed data: HYT, DR, MB; Wrote the manuscript: HYT, DR, RDH. 333
334

16
References 335
Allendorf, F. W., and Thorgaard, G. H. 1984 Evolutionary Genetics of Fishes. 336
in:Tetraploidy and the Evolution of Salmonid Fishes Ch, ed Turner B. J. 55–93. 337
Plenum Press 338
Allendorf, F. W., S. Bassham, W. A. Cresko, M. T. Limborg, L. W. Seeb et al., 2015 339
Effects of crossovers between homeologs on inheritance and population genomics 340
in polyploid-derived salmonid fishes. J. Hered. 106: 217–227. 341
Altschul, S. F., T. L. Madden, A. A. Schäffer, J. Zhang, Z. Zhang et al., 1997 Gapped 342
BLAST and PSI-BLAST: A new generation of protein database search programs. 343
Nucleic Acids Res. 25: 3389–3402. 344
de Boer, J. G., R. Yazawa, W. S. Davidson, and B. F. Koop, 2007 Bursts and horizontal 345
evolution of DNA transposons in the speciation of pseudotetraploid salmonids. 346
BMC Genomics 8: 422. 347
Bolger, A. M., M. Lohse, and B. Usadel, 2014 Trimmomatic: a flexible trimmer for 348
Illumina sequence data. Bioinformatics 30: 2114–20. 349
Brieuc, M. S. O., C. D. Waters, J. E. Seeb, and K. Naish, 2014 A dense linkage map for 350
Chinook salmon (Oncorhynchus tshawytscha) reveals variable chromosomal 351
divergence after an ancestral whole genome duplication event. G3 (Bethesda). 4: 352
447–460. 353
Cingolani, P., A. Platts, L. L. Wang, M. Coon, T. Nguyen et al., 2012 A program for 354
annotating and predicting the effects of single nucleotide polymorphisms, SnpEff: 355
SNPs in the genome of Drosophila melanogaster strain w 1118; iso-2; iso-3. Fly 356
(Austin). 6: 80–92. 357
Correa, K., J. P. Lhorente, M. E. López, L. Bassini, S. Naswa et al., 2015 Genome-wide 358
association analysis reveals loci associated with resistance against Piscirickettsia 359
17
salmonis in two Atlantic salmon (Salmo salar L.) chromosomes. BMC Genomics 360
16: 854. 361
Danzmann, R. G., and K. Gharbi, 2001 Gene mapping in fishes: A means to an end. 362
Genetica 111: 3–23. 363
Davey, J. W., P. A. Hohenlohe, P. D. Etter, J. Q. Boone, J. M. Catchen et al., 2011 364
Genome-wide genetic marker discovery and genotyping using next-generation 365
sequencing. Nat Rev Genet 12: 499–510. 366
Davidson, W. S., B. F. Koop, S. J. M. Jones, P. Iturra, R. Vidal et al., 2010 Sequencing 367
the genome of the Atlantic salmon (Salmo salar). Genome Biol. 11: 403 368
Fierst, J. L., 2015 Using linkage maps to correct and scaffold de novo genome 369
assemblies: Methods, challenges, and computational tools. Front. Genet. 6: 220 370
Gharbi, K., L. Matthews, J. Bron, R. Roberts, A. Tinch et al., 2015 The control of sea 371
lice in Atlantic salmon by selective breeding. J. R. Soc. Interface 12: 0574. 372
Gilbey, J., E. Verspoor, A. McLay, and D. Houlihan, 2004 A microsatellite linkage map 373
for Atlantic salmon (Salmo salar). Anim Genet 35: 98–105. 374
Goddard, M. E., and B. J. Hayes, 2009 Mapping genes for complex traits in domestic 375
animals and their use in breeding programmes. Nat. Rev. Genet. 10: 381–391. 376
Goddard, M. E., B. J. Hayes, and T. H. Meuwissen, 2010 Genomic selection in 377
livestock populations. Genet Res 92: 413–421. 378
Gonen, S., N. R. Lowe, T. Cezard, K. Gharbi, S. C. Bishop et al., 2014 Linkage maps of 379
the Atlantic salmon (Salmo salar) genome derived from RAD sequencing. BMC 380
Genomics 15: 166. 381
Groenen, M. A. M., P. Wahlberg, M. Foglio, H. H. Cheng, H. J. Megens et al., 2009 A 382
high-density SNP-based linkage map of the chicken genome reveals sequence 383
features correlated with recombination rate. Genome Res. 19: 510–519. 384

18
Houston, R. D., C. S. Haley, A. Hamilton, D. R. Guy, J. C. Mota-Velasco et al., 2010 385
The susceptibility of Atlantic salmon fry to freshwater infectious pancreatic 386
necrosis is largely explained by a major QTL. Heredity (Edinb). 105: 318–327. 387
Houston, R. D., J. B. Taggart, T. Cézard, M. Bekaert, N. R. Lowe et al., 2014 388
Development and validation of a high density SNP genotyping array for Atlantic 389
salmon (Salmo salar). BMC Genomics 15: 90. 390
Houston, R. D., S. C. Bishop, D. R. Guy, A. E. Tinch, J. B. Taggart et al., 2014 Genome 391
Wide Association Analysis for Resistance to Sea Lice in Atlantic Salmon: 392
Application of a Dense SNP Array. Proc. 10th World Congr. Genet. Appl. to 393
Livest. Prod. 394
Kim, D., G. Pertea, C. Trapnell, H. Pimentel, R. Kelley et al., 2013 TopHat2: accurate 395
alignment of transcriptomes in the presence of insertions, deletions and gene 396
fusions. Genome Biol. 14: R36. 397
Langmead, B., and S. L. Salzberg, 2012 Fast gapped-read alignment with Bowtie 2. 398
Nat. Methods 9: 357–9. 399
Lien, S., L. Gidskehaug, T. Moen, B. J. Hayes, P. R. Berg et al., 2011 A dense SNP-400
based linkage map for Atlantic salmon (Salmo salar) reveals extended 401
chromosome homeologies and striking differences in sex-specific recombination 402
patterns. BMC Genomics 12: 615 403
Lien, S., B. F. Koop, S. R. Sandve, J. R. Miller, M. P. Kent et al., 2016 The Atlantic 404
salmon genome provides insights into rediploidization. Nature. 405
doi:10.1038/nature17164 406
Liu, Z. J., 2010 Next Generation Sequencing and Whole Genome Selection in 407
Aquaculture. Des Moines, IA: Blackwell Publishing Ltd. 10.1002/9780470958964 408
McDermott, M., M. J. O. Wakelam, and A. J. Morris, 2004 Phospholipase D. Biochem. 409

19
Cell Biol. 82: 225–53. 410
Meuwissen, T. H. E., B. J. Hayes, and M. E. Goddard, 2001 Prediction of Total Genetic 411
Value Using Genome-Wide Dense Marker Maps. Genetics 157: 1819–1829. 412
Miller, M. R., J. P. Brunelli, P. A. Wheeler, S. Liu, C. E. Rexroad 3rd et al., 2011 A 413
conserved haplotype controls parallel adaptation in geographically distant 414
salmonid populations. Mol Ecol. 21: 237–249 415
Moen, T., B. Hoyheim, H. Munck, and L. Gomez-Raya, 2004 A linkage map of Atlantic 416
salmon (Salmo salar) reveals an uncommonly large difference in recombination 417
rate between the sexes. Anim Genet 35: 81–92. 418
Ødegård¸ J., T. Moen, N. Santi, S. A. Korsvoll, S. Kjøglum et al., 2014 Genomic 419
prediction in an admixed population of Atlantic salmon (Salmo salar). Front. 420
Genet. 5: 402 421
Parra, G., K. Bradnam, and I. Korf, 2007 CEGMA: A pipeline to accurately annotate 422
core genes in eukaryotic genomes. Bioinformatics 23: 1061–1067. 423
Rastas, P., F. C. F. Calboli, B. Guo, T. Shikano, and J. Merilä, 2016 Construction of 424
Ultradense Linkage Maps with Lep-MAP2: Stickleback F2 Recombinant Crosses 425
as an Example. Genome Biol. Evol. 8: 78–93. 426
Sakamoto, T., R. G. Danzmann, K. Gharbi, P. Howard, A. Ozaki et al., 2000 A 427
Microsatellite Linkage Map of Rainbow Trout (Oncorhynchus mykiss) 428
Characterized by Large Sex-Specific Differences in Recombination Rates. 429
Genetics 155: 1331–1345. 430
Sherry, S. T., M. H. Ward, M. Kholodov, J. Baker, L. Phan et al., 2001 dbSNP: the 431
NCBI database of genetic variation. Nucleic Acids Res. 29: 308–11. 432
Shi, Y., S. Wang, Z. Gu, J. Lv, X. Zhan et al., 2014 High-density single nucleotide 433
polymorphisms linkage and quantitative trait locus mapping of the pearl oyster, 434

20
Pinctada fucata martensii Dunker. Aquaculture 434: 376–384. 435
Sonesson, A. K., 2010 Genomic Selection for Aquaculture: Principles and Procedures, 436
pp. 151–163 in Next Generation Sequencing and Whole Genome Selection in 437
Aquaculture. Des Moines, IA: Blackwell Publishing Ltd. 438
Tortereau, F., B. Servin, L. Frantz, H.-J. Megens, D. Milan et al., 2012 A high density 439
recombination map of the pig reveals a correlation between sex-specific 440
recombination and GC content. BMC Genomics 13: 586 441
Trapnell, C., A. Roberts, L. Goff, G. Pertea, D. Kim et al., 2012 Differential gene and 442
transcript expression analysis of RNA-seq experiments with TopHat and Cufflinks. 443
Nat. Protoc. 7: 562–78. 444
Tsai, H. Y., A. Hamilton, A. E. Tinch, D. R. Guy, K. Gharbi et al., 2015 Genome wide 445
association and genomic prediction for growth traits in juvenile farmed Atlantic 446
salmon using a high density SNP array. BMC Genomics 16: 969. 447
Tsai, H. Y., A. Hamilton, A. E. Tinch, D. R. Guy, K. Gharbi et al., 2016. Genomic 448
prediction of host resistance to sea lice in farmed Atlantic salmon populations. 449
Gen. Sel. Evol. Accepted. 450
Wang, L., Z. Y. Wan, B. Bai, S. Q. Huang, E. Chua et al., 2015 Construction of a high-451
density linkage map and fine mapping of QTL for growth in Asian seabass. Sci. 452
Rep. 5: 16358. 453
Wright Jr., J. E., K. Johnson, A. Hollister, and B. May, 1983 Meiotic models to explain 454
classical linkage, pseudolinkage, and chromosome pairing in tetraploid derivative 455
salmonid genomes. Isozymes Curr Top Biol Med Res 10: 239–260. 456
Yáñez, J. M., R. D. Houston, S. Newman 2014 Genetics and genomics of disease 457
resistance in salmonid species. Front. Genet. 5: 415 458
Yáñez, J. M., S. Newman, and R. D. Houston, 2015 Genomics in aquaculture to better 459

21
understand species biology and accelerate genetic progress. Front. Genet. 6: 128. 460
Yáñez, J. M., S. Naswa, M. E. López, L. Bassini, K. Correa et al., 2016 Genome-wide 461
single nucleotide polymorphism (SNP) discovery in Atlantic salmon ( Salmo salar 462
): validation in wild and farmed American and European populations. Mol. Ecol. 463
Resour. DOI: 10.1111/1755-0998.12503 464
465
466
22
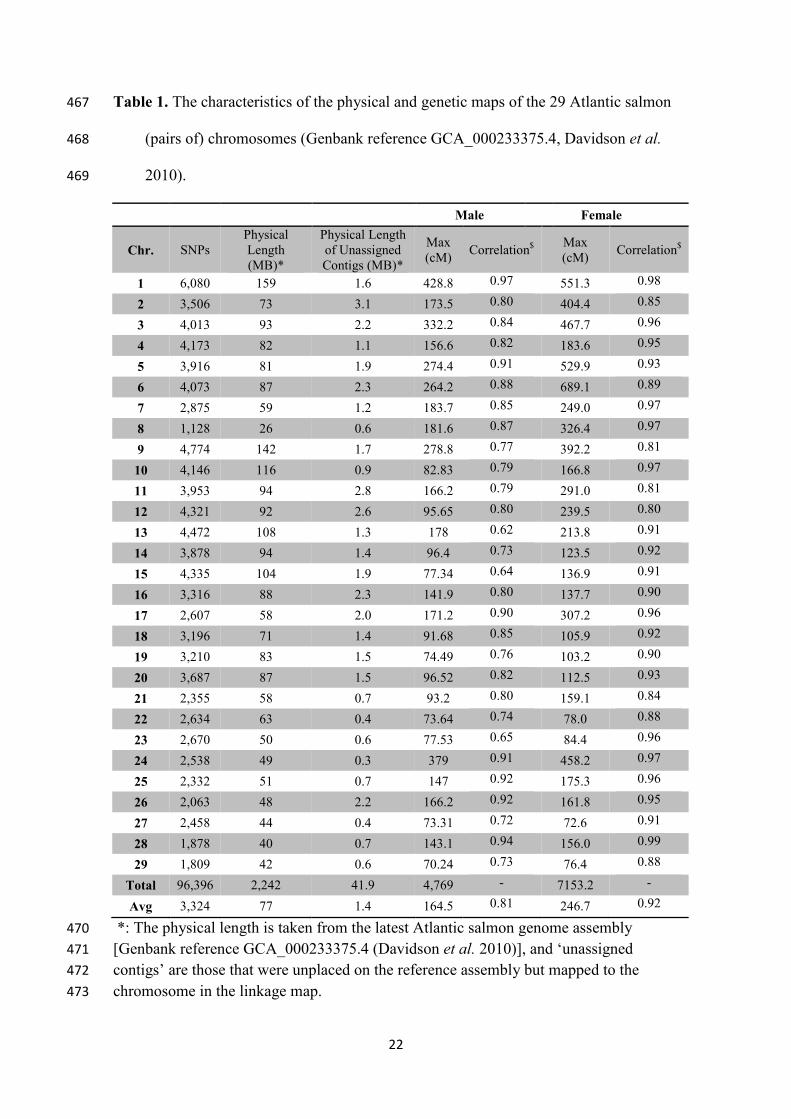
Table 1. The characteristics of the physical and genetic maps of the 29 Atlantic salmon 467
(pairs of) chromosomes (Genbank reference GCA_000233375.4, Davidson et al. 468
2010). 469
Male Female
Chr. SNPs
Physical
Length
(MB)*
Physical Length
of Unassigned
Contigs (MB)*
Max
(cM)
Correlation$
Max
(cM)
Correlation$
1 6,080 159 1.6 428.8 0.97 551.3 0.98
2 3,506 73 3.1 173.5 0.80 404.4 0.85
3 4,013 93 2.2 332.2 0.84 467.7 0.96
4 4,173 82 1.1 156.6 0.82 183.6 0.95
5 3,916 81 1.9 274.4 0.91 529.9 0.93
6 4,073 87 2.3 264.2 0.88 689.1 0.89
7 2,875 59 1.2 183.7 0.85 249.0 0.97
8 1,128 26 0.6 181.6 0.87 326.4 0.97
9 4,774 142 1.7 278.8 0.77 392.2 0.81
10 4,146 116 0.9 82.83 0.79 166.8 0.97
11 3,953 94 2.8 166.2 0.79 291.0 0.81
12 4,321 92 2.6 95.65 0.80 239.5 0.80
13 4,472 108 1.3 178 0.62 213.8 0.91
14 3,878 94 1.4 96.4 0.73 123.5 0.92
15 4,335 104 1.9 77.34 0.64 136.9 0.91
16 3,316 88 2.3 141.9 0.80 137.7 0.90
17 2,607 58 2.0 171.2 0.90 307.2 0.96
18 3,196 71 1.4 91.68 0.85 105.9 0.92
19 3,210 83 1.5 74.49 0.76 103.2 0.90
20 3,687 87 1.5 96.52 0.82 112.5 0.93
21 2,355 58 0.7 93.2 0.80 159.1 0.84
22 2,634 63 0.4 73.64 0.74 78.0 0.88
23 2,670 50 0.6 77.53 0.65 84.4 0.96
24 2,538 49 0.3 379 0.91 458.2 0.97
25 2,332 51 0.7 147 0.92 175.3 0.96
26 2,063 48 2.2 166.2 0.92 161.8 0.95
27 2,458 44 0.4 73.31 0.72 72.6 0.91
28 1,878 40 0.7 143.1 0.94 156.0 0.99
29 1,809 42 0.6 70.24 0.73 76.4 0.88
Total 96,396 2,242 41.9 4,769 - 7153.2 -
Avg 3,324 77 1.4 164.5 0.81 246.7 0.92
*: The physical length is taken from the latest Atlantic salmon genome assembly 470
[Genbank reference GCA_000233375.4 (Davidson et al. 2010)], and ‘unassigned 471
contigs’ are those that were unplaced on the reference assembly but mapped to the 472
chromosome in the linkage map. 473

23
$: The correlation between the genetic distance of SNPs (cM) on the linkage map and 474
the physical distance (bp) according to the reference genome assembly. 475
476
Table 2. Summary statistics for the Atlantic salmon RNA-seq transcriptome assembly 477
Transcriptome assembly details Number
Transcripts 202,009
Genes 65,803
Single transcript genes 36,846
Multi-transcript genes 28,957
Genes in assembled chromosomes 53,950
Genes in unassigned contigs 11,853
Average transcript length 4,127
N50 5,710
N90 2,323
Transcripts > 500 bp 195,224
Genes annotated using protein database 58,416
Genes annotated using DNA database 2,732
478
479
Table 3. Predicted numbers, location and effect of the mapped SNPs according to their 480
position on the annotated reference genome 481
Summary of annotated SNPs
Intergenic 57,582
Genic 48,842 UTR 8,091 5’ 1,867
3’ 6,224
Intron 34,534 Splice region 483
Non splice region 34,051
Exon 5,856 Synonymous 3,352
Non-synonymous 2,465
Gain or loss of start / stop codon 39
482
483
484
485
486
487

24
Table 4. Number of predicted genes and functional categories of SNPs split according 488
to chromosome 489
Genes and SNPs per chromosome
Chromosome Genes Exonic SNPs Intronic SNPs UTR
SNPs Intergenic SNPs
1 3,507 181 877 206 4,717
2 2,711 222 1,116 284 1,630
3 2,741 225 1,209 312 2,026
4 2,255 246 1,301 309 2,066
5 2,286 220 1,184 299 2,030
6 2,441 217 1,286 312 2,006
7 1,526 152 928 192 1,455
8 875 44 335 67 525
9 3,062 244 1,415 374 2,563
10 2,568 217 1,341 300 2,140
11 2,308 162 1,168 249 2,207
12 2,672 268 1,398 349 2,088
13 2,524 276 1,516 328 2,181
14 2,343 236 1,154 314 2,034
15 2,400 271 1,415 294 2,138
16 2,205 193 1,003 253 1,721
17 1,770 144 744 206 1,307
18 1,767 142 1,041 205 1,654
19 1,694 125 1,013 203 1,743
20 2,072 211 1,093 257 1,830
21 1,056 129 700 160 1,252
22 1,398 153 811 189 1,416
23 1,138 142 863 192 1,400
24 1,040 146 860 187 1,238
25 1,032 113 585 133 1,431
26 1,372 102 606 128 1,082
27 1,096 129 828 195 1,221
28 912 92 593 147 992
29 821 88 598 120 937
Total 55,592 5,090 28,981 6,764 51,030
Avg 1,917 176 999 233 1,760
490
491
492

25
Additional files 493
File S1. Details of the linkage map of the 29 chromosomes. The file includes SNP 494
IDs, their position on the linkage map (cM), their position on the reference genome 495
(contig ID and position in bp), the flanking sequence and the two SNP alleles. There are 496
separate sheets for each of the 29 chromosomes. Link: https://goo.gl/LoNajr. 497
File S2. Unassigned genome contigs. The position of each of the previously 498
unassigned reference genome contigs (Genbank assembly reference GCA_000233375.4, 499
Davidson et al. 2010) on the 29 linkage groups. 500
File S3. Potential misassembly in reference genome. A graph of the linkage map 501
versus the physical map for the first 20 MB of chromosome 26, highlighting a potential 502
misassembly of a region between 11.5 and 11.8 MB. 503
File S4. Reference transcriptome sequence (fasta). All the sequences of the Atlantic 504
salmon transcriptome in fasta format. Link: https://goo.gl/StCveN 505
File S5. Reference transcriptome annotation. The position of every putative gene in 506
the genome (chromosome or scaffold, start and end positions, and DNA strand), length 507
in base pairs and annotation against NCBI’s databases (description of the best match, e-508
value and similarity) are shown. Link: https://goo.gl/jgHkat. 509
File S6. Length distribution of annotated and unannotated genes. Length 510
distribution (bin width = 100bp) for the annotated and unannotated genes of the 511
transcriptome. 512
File S7. Number of previously unmapped genes assigned to chromosomes using the 513
linkage map. Number of unmapped genes (placed in previously unassigned genome 514
contigs), assigned to each Atlantic salmon chromosome using the linkage map. 515

26
File S8. SNP annotation. The position of each SNP in the Atlantic salmon genome, the 516
SNP-array ID, the genomic and the alternative variants, the effects of the alternative 517
variant and, if applicable, the affected protein, gene and its annotation are shown. In 518
some cases two different genes / proteins are affected by the SNP due to them being 519
overlapping and transcribed from different DNA strands. SNPs aligning with more than 520
one region of the genome assembly are given in separate worksheets. Link: 521
https://goo.gl/kyvSOe. 522
523
524
525
526
527
528
529
530
531
532
533
534
535
536
537
538

27
Figure 1. Comparison of the number of SNPs in corresponding chromosomes and 539
physical length retrieving from recent reference assembly (Genbank assembly reference 540
GCA_000233375.4, Davidson et al. 2010). The correlation was approximately 0.95. 541
542 543
28
Figure 2. A comparison between genetic and physical maps of a representative 544
chromosome (Chr 22), reflecting the recombination pattern difference between males 545
and females. Details of genetic distance and physical distance for all mapped loci are 546
given in Additional File 1. 547
548
549

29
Figure 3. A comparison of male and female recombination level (cM / Mb) graphed 550
according to physical distance from the nearest chromosome end (expressed as a 551
percentage of total chromosome size in megabases.) 552
553