constellation software inc. interim financial … · 2016-10-04 · 1 constellation software inc....
TRANSCRIPT

Constellation Software Inc.
INTERIM FINANCIAL REPORT
Second Quarter Fiscal Year 2012
For the three and six month periods ended June 30, 2012
(UNAUDITED)

1
CONSTELLATION SOFTWARE INC.
MANAGEMENT’S DISCUSSION AND ANALYSIS (“MD&A”)
The following discussion and analysis should be read in conjunction with the Unaudited Condensed Consolidated Interim Financial Statements for the three and six month periods ended June 30, 2012 and with our Annual Consolidated Financial Statements for the year ended December 31, 2011, which we prepared in accordance with International Financial Reporting Standards (“IFRS”). Certain information included herein is forward-looking and based upon assumptions and anticipated results that are subject to uncertainties. Should one or more of these uncertainties materialize or should the underlying assumptions prove incorrect, actual results may vary significantly from those expected. See “Forward-Looking Statements” and “Risks and Uncertainties”.
Unless otherwise indicated, all dollar amounts are expressed in U.S. dollars. All references to “$” are to U.S. dollars and all references to “C$” are to Canadian dollars.
Additional information about Constellation Software Inc. (the “Company” or “Constellation”), including our most recently filed Annual Information Form ("AIF"), is available on SEDAR at www.sedar.com. Forward Looking Statements
Certain statements in this report may contain “forward looking” statements that involve risks, uncertainties and other factors that may cause the actual results, performance or achievements of the Company or industry to be materially different from any future results, performance or achievements expressed or implied by such forward-looking statements. Words such as “may”, “will”, “expect”, “believe”, “plan”, “intend”, “should”, “anticipate” and other similar terminology are intended to identify forward looking statements. These statements reflect current assumptions and expectations regarding future events and operating performance and speak only as of the date of this MD&A, August 1, 2012. Forward looking statements involve significant risks and uncertainties, should not be read as guarantees of future performance or results, and will not necessarily be accurate indications of whether or not such results will be achieved. A number of factors could cause actual results to vary significantly from the results discussed in the forward looking statements, including, but not limited to, the factors discussed under “Risks and Uncertainties”. Although the forward looking statements contained in this MD&A are based upon what management of the Company believes are reasonable assumptions, the Company cannot assure investors that actual results will be consistent with these forward looking statements. These forward looking statements are made as of the date of this MD&A and the Company assumes no obligation, except as required by law, to update any forward looking statements to reflect new events or circumstances. This report should be viewed in conjunction with the Company’s other publicly available filings, copies of which can be obtained electronically on SEDAR at www.sedar.com. Non-IFRS Measures
This MD&A includes certain measures which have not been prepared in accordance with IFRS such as Adjusted EBITDA, Adjusted EBITDA margin, Adjusted net income and Adjusted net income margin.
The term ‘‘Adjusted EBITDA’’ refers to net income before adjusting for finance income, finance costs, income taxes, equity in net loss of equity investees, impairment of non-financial assets, depreciation, amortization, and foreign exchange loss (gain). The Company believes that Adjusted EBITDA is useful supplemental information as it provides an indication of the results generated by the Company’s main business activities prior to taking into consideration how those activities are financed and taxed and also prior to taking into consideration asset depreciation and amortization and the other items listed above. ‘‘Adjusted EBITDA margin’’ refers to the percentage that Adjusted EBITDA for any period represents as a portion of total revenue for that period.

2
‘‘Adjusted net income’’ means net income plus non-cash expenses (income) such as amortization of intangible assets, deferred income taxes, and certain other expenses (income). The Company believes that Adjusted net income is useful supplemental information as it provides an indication of the results generated by the Company’s main business activities prior to taking into consideration amortization of intangible assets, deferred income taxes, and certain other non-cash expenses (income) incurred by the Company from time to time. ‘‘Adjusted net income margin’’ refers to the percentage that Adjusted net income for any period represents as a portion of total revenue for that period.
Adjusted EBITDA and Adjusted net income are not recognized measures under IFRS and, accordingly, shareholders are cautioned that Adjusted EBITDA and Adjusted net income should not be construed as alternatives to net income determined in accordance with IFRS. The Company’s method of calculating Adjusted EBITDA and Adjusted net income may differ from other issuers and, accordingly, Adjusted EBITDA and Adjusted net income may not be comparable to similar measures presented by other issuers. See ‘‘Results of Operations —Adjusted EBITDA’’ and ‘‘— Adjusted net income’’ for a reconciliation of Adjusted EBITDA and Adjusted net income to net income.
Overview
We acquire, manage and build vertical market software (“VMS”) businesses. Generally, these businesses provide mission critical software solutions that address the specific needs of our customers in particular markets. Our focus on acquiring businesses with growth potential, managing them well and then building them, has allowed us to generate significant cash flow and revenue growth during the past several years.
Our revenue consists primarily of software license fees, maintenance and other recurring fees, professional service fees and hardware sales. Software license revenue is comprised of license fees charged for the use of our software products generally licensed under multiple-year or perpetual arrangements in which the fair value of maintenance and/or professional service fees are determinable, where applicable. Maintenance and other recurring revenue primarily consists of fees charged for customer support on our software products post-delivery and also includes, to a lesser extent, recurring fees derived from combined software/support contracts, transaction-related revenues, and hosted products. Maintenance and other recurring fee arrangements generally include ongoing customer support and rights to certain product updates “when and if available” and products sold on a subscription basis. Professional service revenue consists of fees charged for implementation services, customized programming, product training and consulting. Hardware sales include the resale of third party hardware that forms part of our customer solutions and arrangements, as well as sales of hardware assembled internally. Our customers typically purchase a combination of software, maintenance, professional services and hardware, although the type, mix and quantity of each vary by customer and by product.
Expenses consist primarily of staff costs, occupancy costs, the cost of hardware, third party licenses, maintenance and professional services to fulfill our customer arrangements, and other general operating expenses.

3
Results of Operations (In thousands of dollars, except percentages and per share amounts)
2012 2011 $ % 2012 2011 $ %(Recast-Note 1) (Recast-Note 1)
Revenue 208,969 195,099 13,870 7% 404,247 372,731 31,516 8%
Expenses 165,267 153,337 11,930 8% 321,278 295,935 25,343 9%
Adjusted EBITDA 43,702 41,762 1,940 5% 82,969 76,796 6,173 8%
Depreciation 1,803 1,956 (153) -8% 3,521 4,082 (561) -14%Amortization of intangible assets 20,269 18,073 2,196 12% 39,544 36,598 2,946 8%Foreign exchange (gain) loss (217) 1,868 (2,085) -112% (9) 3,933 (3,942) -100%Equity in net loss of equity investees 209 0 209 NM 1,091 0 1,091 NMFinance income (394) (3,004) 2,610 -87% (1,463) (3,372) 1,909 -57%Finance costs 774 1,966 (1,192) -61% 1,792 3,127 (1,335) -43%Profit before income taxes 21,258 20,903 355 2% 38,493 32,428 6,065 19%
Income taxes expense (recovery)Current income tax expense 5,366 5,469 (103) -2% 10,169 8,477 1,692 20%Deferred income tax recovery (1,700) (40,552) 38,852 -96% (3,192) (94,523) 91,331 -97%Income tax expense (recovery) 3,666 (35,083) 38,749 -110% 6,977 (86,046) 93,023 -108%
Net income 17,592 55,986 (38,394) -69% 31,516 118,474 (86,958) -73%
Adjusted net income 36,161 33,507 2,654 8% 67,868 60,549 7,319 12%
Weighted average number of shares outstanding (000's) Basic and diluted 21,192 21,192 21,192 21,192
Net income per share Basic and diluted 0.83$ 2.64$ (1.81)$ -69% 1.49$ 5.59$ (4.10)$ -73%
Adjusted EBITDA per share Basic and diluted 2.06$ 1.97$ 0.09$ 5% 3.92$ 3.62$ 0.29$ 8%
Adjusted net income per share Basic and diluted 1.71$ 1.58$ 0.13$ 8% 3.20$ 2.86$ 0.35$ 12%
Cash dividends declared per share Basic and diluted 1.00$ -$ 1.00$ 2.00$ 2.00$ -$ 0%
NM - Not meaningful
Three months ended June 30,
Period-Over-Period Change
Six months ended June 30,
Period-Over-Period Change
Note 1: Net income for the three and six months ended June 30, 2011 has been adjusted to correct for an error. This error resulted in a reduction of the deferred income tax recovery recognized in profit and loss for the periods totalling $2,613 and $4,354 respectively.

4
Comparison of the three and six months ended June 30, 2012 and 2011
Revenue:
Total revenue for the quarter ended June 30, 2012 was $209 million, an increase of 7%, or $14 million, compared to $195 million for the comparable period in 2011. For the first six months of 2012 total revenues were $404 million, an increase of 8%, or $31 million, compared to $373 million for the comparable period in 2011. The increase for both the three and six month periods compared to the same periods in the prior year is mainly attributable to growth from acquisitions as organic growth was negative 4% and negative 1%, respectively. For acquired companies, organic growth is calculated as the difference between actual revenues achieved by each company in the financial period following acquisition compared to the revenues they achieved in the corresponding financial period preceding the date of acquisition by Constellation.
Constellation acquired the Public Transit Solutions business ("PTS") from Continental Automotive AG ("Continental") on November 2, 2009. Given the substantial amount of non-recurring revenue historically earned by PTS, gross revenue from PTS has fluctuated significantly in the past and will continue to do so in the future. As well, a number of acquired contracts were recorded at their estimated fair value as of the date of acquisition. Under this treatment, excess profits or costs relative to normalized profitability are recorded as contract assets or liabilities and amortized against revenues over the remaining life of the contract. As a result, the revenue and costs of these contracts reflected through profit or loss will differ from the revenue and costs that would have been recognized under normal course percentage of completion contract accounting. As such, management has chosen to provide supplemental organic growth disclosure to provide greater clarity regarding the impact of PTS on Constellation’s consolidated financial results. Excluding PTS, organic growth for Constellation was negative 2% in Q2 2012 and nil for the six months ended June 30, 2012.
The following table provides a summary of the impact of PTS on Constellation’s organic revenue growth:
Organic Revenue Growth
Three months ended June 30, 2012 Six months ended June 30, 2012
Constellation ‐4% ‐1%
Constellation excluding PTS ‐2% 0%
Further details of the PTS acquisition are provided under “Acquisition of PTS from Continental”.
Software license revenue for the quarter ended June 30, 2012 remained at $16 million compared to the same period in 2011. During the six months ended June 30, 2012, software license revenue increased by 3%, or $1 million to $31 million, from $30 million compared to the same period in 2011. Professional services revenue for the quarter ended June 30, 2012 decreased by 4%, or $2 million to $46 million, from $48 million compared to the same period in 2011. During the six months ended June 30, 2012, professional services revenue decreased by 2%, or $1 million to $88 million, from $89 million compared to the same period in 2011. Hardware and other revenue for the quarter ended June 30, 2012 decreased by 22%, or $7 million to $22 million, from $29 million compared to the same period in 2011. During the six months ended June 30, 2012, hardware and other revenue decreased by 7%, or $3 million to $48 million, from $51 million compared to the same period in 2011. Maintenance and other recurring revenues for the quarter ended June 30, 2012 increased by 21%, or $22 million to $125 million, from $103 million compared to the same period in 2011. During the six months ended June 30, 2012, maintenance and other recurring revenues increased by 17%, or $36 million to $238 million, from $202 million compared to the same period in 2011.The following table displays the breakdown of our revenue according to revenue type:

5
We aggregate our business into two distinct segments for financial reporting purposes: (i) the public
sector reportable segment, which includes business units focused primarily on government and government-related customers, and (ii) the private sector reportable segment, which includes business units focused primarily on commercial customers.
The following table displays our revenue by reportable segment and the percentage change for the three and six months ended June 30, 2012 compared to the same period in 2011:
Public Sector
For the quarter ended June 30, 2012, total revenue in the public sector reportable segment increased by 1%, or $2 million to $148 million, compared to $146 million for the quarter ended June 30, 2011. For the six months ended June 30, 2012, total revenue increased by 3%, or $9 million to $286 million, compared to $277 million for the comparable period in 2011. Revenue growth from acquired businesses contributed approximately $11 million to our Q2 2012 revenues and $16 million to our six months ended June 30, 2012 revenues compared to the same periods in 2011, as we completed 17 acquisitions since the beginning of 2011. Organic revenues decreased by 7% in Q2 2012 and decreased by 3% in the six months ended June 30, 2012 compared to the same periods in 2011. Excluding PTS, where revenue was expected to decrease, organic revenues decreased by 4% in Q2 2012 and decreased by 2% in the six months ended June 30, 2012 respectively, compared to the same periods in 2011.
Organic Revenue Growth
Three months ended June 30, 2012 Six months ended June 30, 2012
Public Sector ‐7% ‐3%
Public Sector excluding PTS ‐4% ‐2%
The organic revenue change was primarily driven by the following:
2012 2011 $ % 2012 2011 $ %
Licenses 15,994 15,568 426 3% 30,934 29,974 960 3%Professional services 45,935 47,616 (1,681) -4% 88,062 89,405 (1,343) -2%Hardware and other 22,351 28,717 (6,366) -22% 47,706 51,104 (3,398) -7%Maintenance and other recurring 124,689 103,198 21,491 21% 237,545 202,248 35,297 17%
208,969 195,099 13,870 7% 404,247 372,731 31,516 8%
Three months ended June 30,
Period-Over-Period Change
Six months ended June 30,
Period-Over-Period Change
($000, except percentages) ($000, except percentages)
2012 2011 $ % 2012 2011 $ %
Public SectorLicenses 10,864 10,607 257 2% 20,654 20,760 (106) -1%Professional services 35,489 39,036 (3,547) -9% 67,791 72,494 (4,703) -6%Hardware and other 18,756 25,622 (6,866) -27% 41,045 45,276 (4,231) -9%Maintenance and other recurring 82,613 70,975 11,638 16% 156,464 138,660 17,804 13%
147,722 146,240 1,482 1% 285,954 277,190 8,764 3%
Private SectorLicenses 5,130 4,961 169 3% 10,280 9,214 1,066 12%Professional services 10,446 8,580 1,866 22% 20,271 16,911 3,360 20%Hardware and other 3,595 3,095 500 16% 6,661 5,828 833 14%Maintenance and other recurring 42,076 32,223 9,853 31% 81,081 63,588 17,493 28%
61,247 48,859 12,388 25% 118,293 95,541 22,752 24%
Three months ended June 30,
Period-Over-Period Change
Six months ended June 30,
Period-Over-Period Change
($000, except percentages) ($000, except percentages)

6
Volaris operating group (decrease of approximately $9 million in Q2 2012 and a decrease of approximately $7 million for the six months ended June 30, 2012). The majority of the decrease was due to a decrease in PTS project related revenue.
Private Sector
For the quarter ended June 30, 2012, total revenue in the private sector reportable segment increased 25%, or $12 million to $61 million, compared to $49 million for the quarter ended June 30, 2011. For the six months ended June 30, 2012 total revenue increased by 24%, or $22 million to $118 million, compared to $96 million for the comparable period in 2011. Revenue growth from acquired businesses contributed approximately $10 million to our Q2 2012 revenues and $18 million to our six months ended June 30, 2012 revenues compared to the same periods in 2011, as we completed 20 acquisitions since the beginning of 2011. Revenues increased organically by 5% in both Q2 2012 and in the six months ended June 30, 2012 compared to the same periods in 2011.
The organic revenue change was primarily driven by the following: - Jonas operating group (increase of approximately $2 million in Q2 2012 and an increase of
approximately $5 million for the six months ended June 30, 2012). Jonas’ organic growth was driven by strong sales to both existing and new customers primarily in its fitness, construction, and food service verticals.
Expenses:
The following table displays the breakdown of our expenses:
Overall expenses for the quarter ended June 30, 2012 increased 8%, or $12 million to $165 million,
compared to $153 million during the same period in 2011. As a percentage of total revenue, expenses remained consistent at 79% in the quarter ended June 30, 2012 compared to the quarter ended June 30, 2011. During the six months ended June 30, 2012, expenses increased 9%, or $25 million to $321 million, compared to $296 million during the same period in 2011. As a percentage of total revenue, overall expenses remained consistent at 79% in the six months ended June 30, 2012 compared to the quarter ended June 30, 2011. The growth in expenses for the three and six month periods is primarily due to the growth in the number of employees. Our average employee headcount grew 19% from 3,671 in the quarter ended June 30, 2011 to 4,377 in the quarter ended June 30, 2012 primarily due to acquisitions.
Staff expense – Staff expense can be broken down into five key operating departments: Professional Services, Maintenance, Research and Development, Sales and Marketing, and General and Administrative. Professional Services staff expenses include personnel and related costs associated with our delivery of
2012 2011 $ % 2012 2011 $ %
ExpensesStaff 113,689 100,687 13,002 13% 219,320 196,606 22,714 12%Hardware 10,705 16,763 (6,058) -36% 22,932 28,884 (5,952) -21%Third party license, maintenance and professional services 14,715 11,949 2,766 23% 28,961 24,612 4,349 18%Occupancy 5,039 4,715 324 7% 9,664 9,303 361 4%Travel 7,766 7,190 576 8% 16,012 13,458 2,554 19%Telecommunications 2,553 2,344 209 9% 5,050 4,881 169 3%Supplies 3,866 4,133 (267) -6% 7,298 8,296 (998) -12%Professional fees 2,222 2,584 (362) -14% 4,067 4,720 (653) -14%Other 4,712 2,972 1,740 59% 7,974 5,175 2,799 54%
165,267 153,337 11,930 8% 321,278 295,935 25,343 9%
Three months ended June 30,
Period-Over-Period Change
Six months ended June 30,
Period-Over-Period Change
($000, except percentages) ($000, except percentages)
7
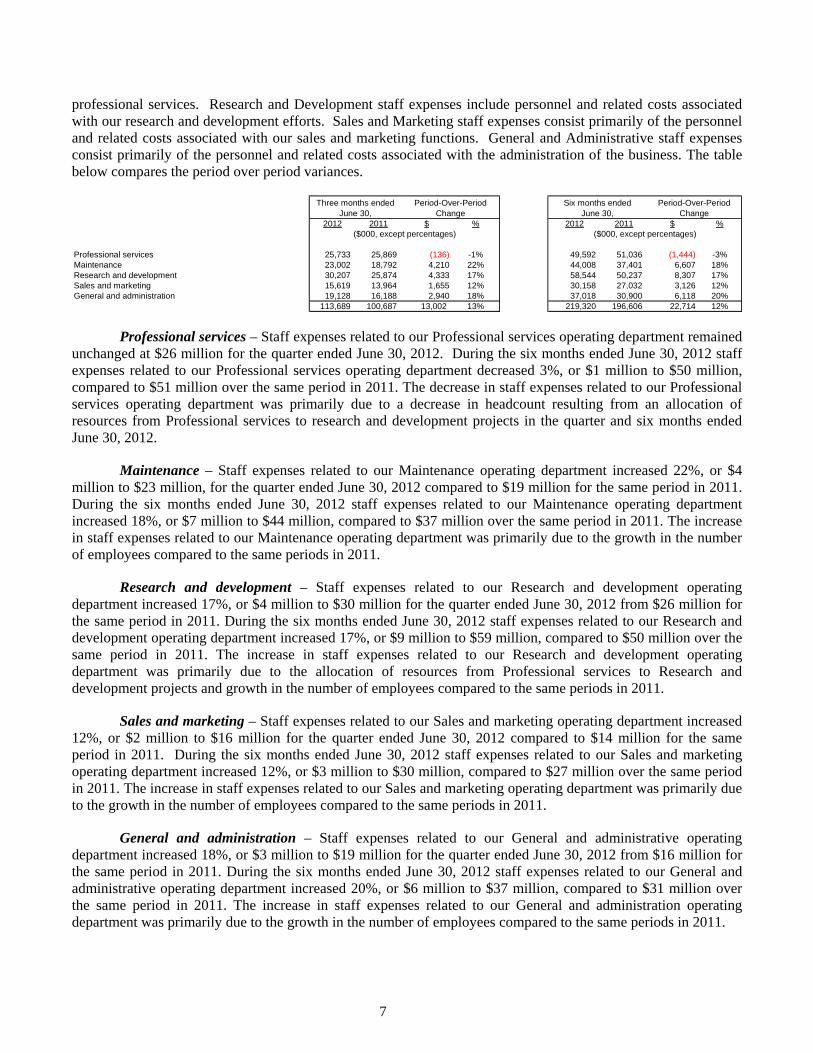
professional services. Research and Development staff expenses include personnel and related costs associated with our research and development efforts. Sales and Marketing staff expenses consist primarily of the personnel and related costs associated with our sales and marketing functions. General and Administrative staff expenses consist primarily of the personnel and related costs associated with the administration of the business. The table below compares the period over period variances.
Professional services – Staff expenses related to our Professional services operating department remained unchanged at $26 million for the quarter ended June 30, 2012. During the six months ended June 30, 2012 staff expenses related to our Professional services operating department decreased 3%, or $1 million to $50 million, compared to $51 million over the same period in 2011. The decrease in staff expenses related to our Professional services operating department was primarily due to a decrease in headcount resulting from an allocation of resources from Professional services to research and development projects in the quarter and six months ended June 30, 2012.
Maintenance – Staff expenses related to our Maintenance operating department increased 22%, or $4 million to $23 million, for the quarter ended June 30, 2012 compared to $19 million for the same period in 2011. During the six months ended June 30, 2012 staff expenses related to our Maintenance operating department increased 18%, or $7 million to $44 million, compared to $37 million over the same period in 2011. The increase in staff expenses related to our Maintenance operating department was primarily due to the growth in the number of employees compared to the same periods in 2011.
Research and development – Staff expenses related to our Research and development operating department increased 17%, or $4 million to $30 million for the quarter ended June 30, 2012 from $26 million for the same period in 2011. During the six months ended June 30, 2012 staff expenses related to our Research and development operating department increased 17%, or $9 million to $59 million, compared to $50 million over the same period in 2011. The increase in staff expenses related to our Research and development operating department was primarily due to the allocation of resources from Professional services to Research and development projects and growth in the number of employees compared to the same periods in 2011.
Sales and marketing – Staff expenses related to our Sales and marketing operating department increased 12%, or $2 million to $16 million for the quarter ended June 30, 2012 compared to $14 million for the same period in 2011. During the six months ended June 30, 2012 staff expenses related to our Sales and marketing operating department increased 12%, or $3 million to $30 million, compared to $27 million over the same period in 2011. The increase in staff expenses related to our Sales and marketing operating department was primarily due to the growth in the number of employees compared to the same periods in 2011.
General and administration – Staff expenses related to our General and administrative operating department increased 18%, or $3 million to $19 million for the quarter ended June 30, 2012 from $16 million for the same period in 2011. During the six months ended June 30, 2012 staff expenses related to our General and administrative operating department increased 20%, or $6 million to $37 million, compared to $31 million over the same period in 2011. The increase in staff expenses related to our General and administration operating department was primarily due to the growth in the number of employees compared to the same periods in 2011.
2012 2011 $ % 2012 2011 $ %
Professional services 25,733 25,869 (136) -1% 49,592 51,036 (1,444) -3%Maintenance 23,002 18,792 4,210 22% 44,008 37,401 6,607 18%Research and development 30,207 25,874 4,333 17% 58,544 50,237 8,307 17%Sales and marketing 15,619 13,964 1,655 12% 30,158 27,032 3,126 12%General and administration 19,128 16,188 2,940 18% 37,018 30,900 6,118 20%
113,689 100,687 13,002 13% 219,320 196,606 22,714 12%
Three months ended June 30,
Period-Over-Period Change
Six months ended June 30,
Period-Over-Period Change
($000, except percentages) ($000, except percentages)
8
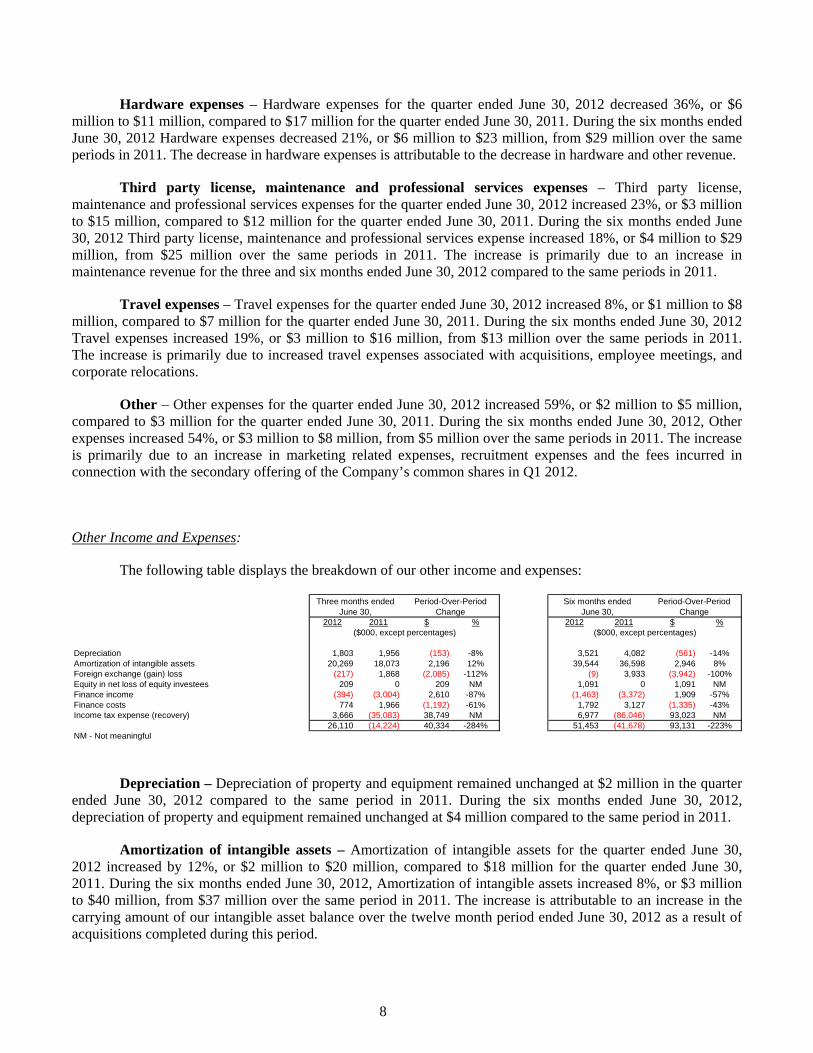
Hardware expenses – Hardware expenses for the quarter ended June 30, 2012 decreased 36%, or $6 million to $11 million, compared to $17 million for the quarter ended June 30, 2011. During the six months ended June 30, 2012 Hardware expenses decreased 21%, or $6 million to $23 million, from $29 million over the same periods in 2011. The decrease in hardware expenses is attributable to the decrease in hardware and other revenue.
Third party license, maintenance and professional services expenses – Third party license, maintenance and professional services expenses for the quarter ended June 30, 2012 increased 23%, or $3 million to $15 million, compared to $12 million for the quarter ended June 30, 2011. During the six months ended June 30, 2012 Third party license, maintenance and professional services expense increased 18%, or $4 million to $29 million, from $25 million over the same periods in 2011. The increase is primarily due to an increase in maintenance revenue for the three and six months ended June 30, 2012 compared to the same periods in 2011.
Travel expenses – Travel expenses for the quarter ended June 30, 2012 increased 8%, or $1 million to $8 million, compared to $7 million for the quarter ended June 30, 2011. During the six months ended June 30, 2012 Travel expenses increased 19%, or $3 million to $16 million, from $13 million over the same periods in 2011. The increase is primarily due to increased travel expenses associated with acquisitions, employee meetings, and corporate relocations.
Other – Other expenses for the quarter ended June 30, 2012 increased 59%, or $2 million to $5 million, compared to $3 million for the quarter ended June 30, 2011. During the six months ended June 30, 2012, Other expenses increased 54%, or $3 million to $8 million, from $5 million over the same periods in 2011. The increase is primarily due to an increase in marketing related expenses, recruitment expenses and the fees incurred in connection with the secondary offering of the Company’s common shares in Q1 2012.
Other Income and Expenses:
The following table displays the breakdown of our other income and expenses:
Depreciation – Depreciation of property and equipment remained unchanged at $2 million in the quarter ended June 30, 2012 compared to the same period in 2011. During the six months ended June 30, 2012, depreciation of property and equipment remained unchanged at $4 million compared to the same period in 2011.
Amortization of intangible assets – Amortization of intangible assets for the quarter ended June 30, 2012 increased by 12%, or $2 million to $20 million, compared to $18 million for the quarter ended June 30, 2011. During the six months ended June 30, 2012, Amortization of intangible assets increased 8%, or $3 million to $40 million, from $37 million over the same period in 2011. The increase is attributable to an increase in the carrying amount of our intangible asset balance over the twelve month period ended June 30, 2012 as a result of acquisitions completed during this period.
2012 2011 $ % 2012 2011 $ %
Depreciation 1,803 1,956 (153) -8% 3,521 4,082 (561) -14%Amortization of intangible assets 20,269 18,073 2,196 12% 39,544 36,598 2,946 8%Foreign exchange (gain) loss (217) 1,868 (2,085) -112% (9) 3,933 (3,942) -100%Equity in net loss of equity investees 209 0 209 NM 1,091 0 1,091 NMFinance income (394) (3,004) 2,610 -87% (1,463) (3,372) 1,909 -57%Finance costs 774 1,966 (1,192) -61% 1,792 3,127 (1,335) -43%Income tax expense (recovery) 3,666 (35,083) 38,749 NM 6,977 (86,046) 93,023 NM
26,110 (14,224) 40,334 -284% 51,453 (41,678) 93,131 -223%NM - Not meaningful
Three months ended June 30,
Period-Over-Period Change
Six months ended June 30,
Period-Over-Period Change
($000, except percentages) ($000, except percentages)
9
Foreign exchange – Most of our businesses are organized geographically so many of our expenses are incurred in the same currency as our revenues, which mitigates some of our exposure to currency fluctuations. For the quarter ended June 30, 2012, our foreign exchange gain was $0.2 million compared to a loss of $2 million in the quarter ended June 30, 2011. For the six months ended June 30, 2011 the foreign exchange gain was nil compared to a loss of $4 million for the same period in 2011. The foreign exchange loss in the prior year was due to realized losses on the settlement of certain non-USD liabilities and due to holding losses on certain non-USD liabilities.
Equity in net loss of equity investees – Equity in net loss of equity investees was $0.2 million for the quarter ended June 30, 2012 compared to nil for the quarter ended June 30, 2011. For the six months ended June 30, 2012, Equity in net loss of equity investees was $1 million compared to nil for the same period in 2011. The $1 million relates to our proportionate share of a loss recorded by an equity investee for the period. The loss resulted primarily from an impairment charge on the equity investee’s goodwill.
Finance income – Finance income for the quarter ended June 30, 2012 decreased 87%, or $3 million to
$0.3 million, compared to $3 million for the quarter ended June 30, 2011. During the six months ended June 30, 2012, Finance income decreased 57%, or $2 million to $1 million, from $3 million over the same period in 2011. The decrease in finance income for the quarter is due to a lower gain on available-for-sale financial assets due to fewer shares sold during this period.
Finance costs – Finance costs for the quarter ended June 30, 2012 decreased 61%, or $1 million to $1
million, compared to $2 million for the quarter ended June 30, 2011. During the six months ended June 30, 2012, Finance costs decreased 43%, or $1 million to $2 million, from $3 million over the same period in 2011. The decrease in finance costs for the three and six month periods ended June 30, 2012 is primarily due to less interest expense on our revolving line of credit resulting from relatively decreased borrowings.
Income taxes – We operate globally and we calculate our tax provision in each of the jurisdictions in
which we conduct business. Our tax rate is, therefore, affected by the realization and anticipated relative profitability of our operations in those various jurisdictions, as well as different tax rates that apply and our ability to utilize tax losses. The decrease in income tax recovery for both the three and six months ended June 30, 2012 compared to the same period in 2011 was primarily due to a transfer of certain intangible assets from one subsidiary to another in the same period last year. In the prior year, a deferred tax asset was recorded on the increase in fair market value arising on the sale of intellectual property between entities within the Company at the rate of tax of the entity that acquired the assets notwithstanding that the gains are not otherwise recorded for accounting and financial reporting on consolidation. The deferred income tax recovery recorded through profit or loss represented the amount of these deferred income tax deductions that the Company determined was probable of being utilized for income tax deduction purposes in the future. Excluding deferred income tax recovery, income tax expense as a percent of net income before income taxes was 25% for the quarter ended June 30, 2012 compared to 26% for the same period in 2011. Excluding deferred income tax recovery, income tax expense as a percent of net income before income taxes was 26% for both the six months ended June 30, 2012 and June 30, 2011.
Net Income:
Net income for the quarter ended June 30, 2012 was $18 million compared to net income of $56 million for the same period in 2011. On a per share basis this translated into a net income per diluted share of $0.83 in the quarter ended June 30, 2012 compared to net income per diluted share of $2.64 in the quarter ended June 30, 2011. For the first six months of 2012, net income was $32 million or $1.49 per diluted share compared to $118 million or $5.59 per diluted share in the first six months of 2011. Excluding our income tax recovery, net income increased by 3% to $16 million in the quarter ended June 30, 2012 from $15 million in the quarter ended June 30,

10
2011 and by 18% to $28 million from $24 million in the six months ended June 30, 2012. The increase in net income excluding the income tax recovery in the three and six months ended June 30, 2012 was primarily due to an increase in Adjusted EBITDA.
Adjusted EBITDA:
For Q2 2012, Adjusted EBITDA increased by $2 million to $44 million compared to $42 million in Q2 2011 representing an increase of 5%. Adjusted EBITDA margin was 21% in the second quarter of 2012 and the second quarter of 2011. For the first six months of 2012, Adjusted EBITDA increased by $6 million to $83 million compared to $77 million during the same period in 2011, representing an increase of 8%. Adjusted EBITDA margin was 21% in the first six months of 2012 and the first six months of 2011. See “Non-IFRS Measures” for a description of Adjusted EBITDA and Adjusted EBITDA margin.
The following table reconciles Adjusted EBITDA to net income:
Adjusted net income:
For Q2 2012, Adjusted net income increased by $2 million to $36 million compared to $34 million in Q2 2011, representing an increase of 8%. Adjusted net income margin was 17% in the second quarter of 2012 and the second quarter 2011. For the first six months of 2012, Adjusted net income increased by $7 million to $68 million compared to $61 million during the same period in 2011, representing an increase of 12%. Adjusted net income margin was 17% in the first six months of 2012, compared to 16% of total revenue for the same period in 2011. The increase in Adjusted net income for the three and six months ended June 30, 2012 is largely due to an increase in Adjusted EBITDA. See “Non-IFRS Measures” for a description of Adjusted net income and Adjusted net income margin.
(Unaudited)
2012 2011 2012 2011
Total revenue 208,969$ 195,099$ 404,247$ 372,731$
Net income 17,592 55,986 31,516 118,474Adusted for:Income tax expense (recovery) 3,666 (35,083) 6,977 (86,046)Foreign exchange (gain) loss (217) 1,868 (9) 3,933Equity in net loss of equity investees 209 0 1,091 0Finance income (394) (3,004) (1,463) (3,372)Finance costs 774 1,966 1,792 3,127Amortization of intangible assets 20,269 18,073 39,544 36,598Depreciation 1,803 1,956 3,521 4,082
Adjusted EBITDA 43,702 41,762 82,969 76,796Adjusted EBITDA margin 21% 21% 21% 21%
Three months ended June 30,
Six months ended June 30,
($000, except percentages) ($000, except percentages)

11
The following table reconciles Adjusted net income to net income:
Quarterly Results
We do not generally experience significant seasonality in our operating results from quarter to quarter. However, our quarterly results may fluctuate as a result of the various acquisitions which may be completed by the Company in any given quarter. We may experience variations in our net income on a quarterly basis depending upon the timing of certain one-time expenditures or gains which may include bargain purchase gains and loss (gain) on the sale of available-for-sale equity securities and other assets.
Acquisition of PTS from Continental
On November 2, 2009, Constellation acquired the Public Transit Solutions business ("PTS") from Continental AG ("Continental") for gross cash consideration of $3 million. The purchase price was a small percentage of PTS’ annualized revenues, reflecting its pre-acquisition history of negative cash flows.
(Unaudited)2012 2011 2012 2011
Total revenue 208,969$ 195,099$ 404,247$ 372,731$
Net income 17,592 55,986 31,516 118,474Adusted for:Amortization of intangible assets 20,269 18,073 39,544 36,598Deferred income tax expense (recovery) (1,700) (40,552) (3,192) (94,523)
Adjusted net income 36,161 33,507 67,868 60,549Adjusted net income margin 17% 17% 17% 16%
($000, except percentages) ($000, except percentages)
Three months ended June 30,
Six months ended June 30,
(Unaudited) Sep. 30 Dec. 31 Mar. 31 Jun. 30 Sep. 30 Dec. 31 Mar. 31 Jun. 302010 2010 2011 2011 2011 2011 2012 2012
Note 1 Note 1 Note 1
Revenue 163,588 171,986 177,632 195,099 202,253 198,357 195,278 208,969Net Income 8,786 10,877 62,488 55,986 19,305 19,395 13,924 17,592Adjusted Net Income 22,516 22,546 27,042 33,507 39,717 40,229 31,707 36,161
Net Income per share Basic & diluted 0.41 0.51 2.95 2.64 0.91 0.92 0.66 0.83
Adjusted Net Income per share Basic & diluted 1.06 1.06 1.28 1.58 1.87 1.90 1.50 1.71
The quarterly information is presented in accordance with IFRS.
Quarter Ended
Note 1: Net income amounts for each of the quarterly periods in the nine months ended September 30, 2011 have beenadjusted to correct for out of period errors. This resulted in a reduction of the deferred income tax recovery in profit and loss foreach of the quarterly periods in the nine months ended September 30, 2011 totalling $1,741, $2,613 and $2,613 respectively,which have been reflected herein.
($000, except per share amounts)

12
Management believes cash flows from operations is useful supplemental information about the performance of the underlying business as certain acquisition related accounting adjustments and the impact of contract accounting in a business combination under IFRS, where applicable, may result in reported earnings that differ materially from cash flow from operations. Additionally, net working capital requirements can fluctuate significantly depending on contract billings, customer deposits and inventory requirements, which may have a material positive impact on cash flows from operations.
A number of acquired contracts were recorded at their estimated fair value as of the date of acquisition. Under this accounting treatment, excess profits or costs relative to normalized profitability are recorded as contract assets or liabilities and amortized against revenues over the remaining life of the contract. As a result, the revenue and costs of these contracts reflected through profit or loss will differ from the revenue and costs that would have been recognized under normal course percentage of completion contract accounting.
Cash flows from operations from PTS will fluctuate significantly from quarter to quarter due to the timing of receipt of milestone payments associated with large customer contracts. PTS has contributed $26 million in cash flows from operations since the date of acquisition; however, in the first six months of 2012, cash flows from operations at PTS were negative $10 million. The negative operating cash flows for the six months ended June 30, 2012 was primarily driven by the payment of 2011 employee bonuses and an increase in net working capital.
As part of the PTS acquisition, Constellation also assumed certain long-term contracts that contain contingent liabilities which may, but in management’s opinion are unlikely to, exceed $2 million in the aggregate. The contingent liabilities relate to liquidated damages contractually available to customers for breaches of contracts by PTS. The contingent liabilities represent the maximum financial liabilities potentially due to customers less the amounts accrued in connection with the contracts assumed on acquisition.
Supplemental Financial Information for PTS
The table below provides certain supplemental statements of comprehensive income and cash flows information regarding PTS for the three and six months ended June 30, 2012. PTS is not considered a reportable operating segment of Constellation; however, management has chosen to provide certain supplemental financial information to provide greater clarity into the operating performance and cash flows from operations of each business. Management believes cash flows from operations is useful supplemental information about the performance of the underlying business as certain purchase price adjustments and contract accounting under IFRS may result in reported earnings that differ materially from cash flow from operations.

13
Acquisition of certain software assets and liabilities from MAXIMUS Inc.
On September 30, 2008, Constellation acquired certain assets and liabilities of MAXIMUS Inc.’s Asset, Justice, and Education businesses (‘MAJES’) for net cash consideration of $34 million.
As part of the acquisition, the Company also acquired certain long-term contracts that contain contingent liabilities which may, but are unlikely to, exceed $15 million in the aggregate. The contingent liabilities relate to liquidated damages contractually available to customers for breaches of contracts by MAJES and for estimated damages available to customers for breaches of such contracts by MAJES where such contracts did not contain
Supplemental financial information
(Unaudited)
Constellation Software Inc.
(excluding PTS) PTS Consolidated
Constellation Software Inc.
(excluding PTS) PTS Consolidated
Revenue 179,380$ 29,589$ 208,969$ 341,848$ 62,399$ 404,247$
Adjusted EBITDA 38,227 5,475 43,702 70,838 12,131 82,969
EBITDA as % Total Revenue 21% 19% 21% 21% 19% 21%
Net Income 13,207$ 4,385$ 17,592$ 21,385$ 10,131$ 31,516$
Cash flows from operating activities:
Net income 13,207$ 4,385$ 17,592$ 21,385$ 10,131$ 31,516$
Adjustments to reconcile net income to
net cash flows from operations, including taxes paid: 17,138 959 18,097 38,918 1,820 40,738
Change in non-cash operating working
capital (5,732) (3,763) (9,495) (12,268) (21,571) (33,839)
Cash flows from operating activities 24,613$ 1,581$ 26,194$ 48,035$ (9,620)$ 38,415$
For the three months ended June 30, 2012 For the six months ended June 30, 2012
Adjusted EBITDA to net income reconciliation
(Unaudited)
Constellation Software Inc.
(excluding PTS) PTS Consolidated
Constellation Software Inc.
(excluding PTS) PTS Consolidated
Total revenue 179,380$ 29,589$ 208,969$ 341,848$ 62,399$ 404,247$
Net income 13,207 4,385 17,592 21,385 10,131 31,516
Adjusted for:
Income tax expense 2,732 934 3,666 5,646 1,331 6,977
Other expenses (income) 370 2 372 1,061 350 1,411
Amortization of intangible assets 20,269 - 20,269 39,544 - 39,544
Depreciation 1,649 154 1,803 3,202 319 3,521
Adjusted EBITDA 38,227 5,475 43,702 70,838 12,131 82,969
Adjusted EBITDA margin 21% 19% 21% 21% 19% 21%
For the three months ended June 30, 2012 For the six months ended June 30, 2012
14
specified penalties. The contingent liabilities represent the difference between the maximum financial liabilities potentially due to customers less the amounts accrued in connection with the contracts assumed on acquisition.
In February 2011, a subsidiary of the Company and MAXIMUS Inc. (“Maximus”) received a letter from
a customer initiating a dispute resolution process under the customer’s contract. The customer alleges that the subsidiary of Constellation and MAXIMUS failed to observe the most favoured customer pricing terms of the contract and also raised a number of issues pertaining to services and products delivered under the contract. The subsidiary of the Company, MAXIMUS and the customer have resolved the issues relating to the most favoured customer pricing terms of the contract without liability to the Company but continue to follow the dispute resolution process for the customer’s other allegations. The subsidiary of the Company and the seller of the MAJES assets continue to contest all of the customer’s claims. The potential liability is undefined with respect to the remainder of the claims made by the customer, however, the contract with the customer has a $9 million limitation of liability clause that the Company believes will apply to all of the claims should there be an unfavourable outcome to the Company.
Liquidity
Our net cash position (cash less bank indebtedness) at June 30, 2012 was negative $6 million compared to $33 million at December 31, 2011. Net borrowings on our line of credit increased by $27 million and cash decreased by $12 million.
Total assets increased $44 million, from $631 million at December 31, 2011 to $675 million at June 30, 2012. The majority of the increase can be explained by an increase in equity securities available-for-sale, accounts receivable, work in progress, deferred income taxes and an increase in goodwill and intangible assets associated with acquisitions made in 2012. This was offset by a decrease in cash of $12 million.
Current liabilities increased $52 million, from $321 million at December 31, 2011 to $373 million at June 30, 2012. The increase can be explained by an increase in borrowings on our line of credit of $29 million, an increase in dividends payable of $21 million, an increase in deferred revenue of $20 million primarily due to acquisitions and the timing of billings versus revenue recognized and an increase in acquisition holdback payments of $6 million in connection with increased capital deployed on acquisitions. This increase was offset by a decrease in accounts payable and accrued liabilities of $20 million primarily resulting from the payment of the 2011 bonus during fiscal 2012.
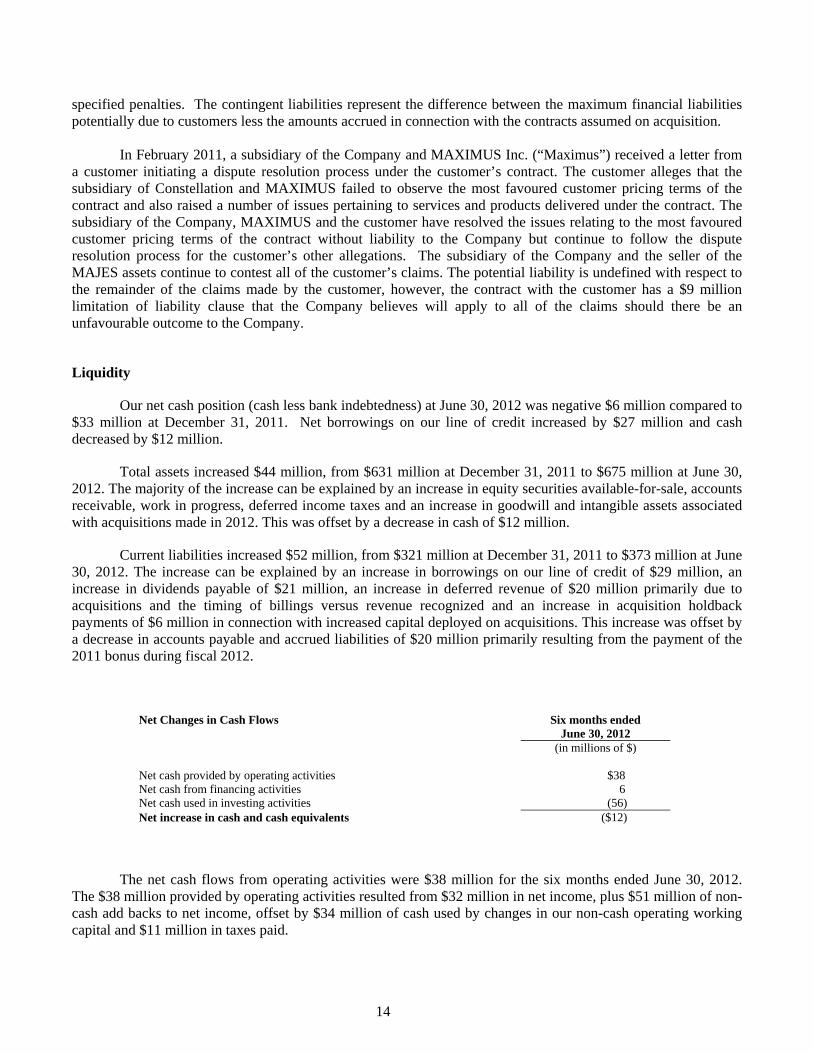
Net Changes in Cash Flows Six months ended June 30, 2012
(in millions of $) Net cash provided by operating activities $38 Net cash from financing activities 6 Net cash used in investing activities (56) Net increase in cash and cash equivalents ($12)
The net cash flows from operating activities were $38 million for the six months ended June 30, 2012. The $38 million provided by operating activities resulted from $32 million in net income, plus $51 million of non-cash add backs to net income, offset by $34 million of cash used by changes in our non-cash operating working capital and $11 million in taxes paid.

15
The net cash generated in financing activities in the six months ended June 30, 2012 was $6 million, which is mainly a result of an increase in bank indebtedness used, in part, to settle dividends paid in the period.
The net cash used in investing activities in the six months ended June 30, 2012 was $56 million. The cash used in investing activities was primarily due to acquisitions for an aggregate of $55 million (including payments for holdbacks relating to prior acquisitions).
We believe we have more than sufficient cash to continue to operate for the foreseeable future. Generally our VMS businesses operate with negative working capital as a result of the collection of maintenance payments and other revenues in advance of the performance of the related services. As such, management anticipates that it can continue to grow the business organically without any additional funding. If we continue to acquire VMS businesses we may need additional external funding depending upon the size and timing of the acquisitions.
Capital Resources and Commitments
On March 13, 2012, we entered into a new credit facility with a syndicate of Canadian chartered banks and U.S. banks in the amount of $300 million which replaced our previous $160 million facility. The credit facility is collateralized by substantially all of our assets including the assets of the majority of our material Canadian and U.S. subsidiaries. Certain other subsidiaries also guarantee this facility. The facility is available for acquisitions, working capital needs, and other general corporate purposes and for the needs of our subsidiaries. As at June 30, 2012, we had drawn $29 million on this facility. Commitments include operating leases for office equipment and facilities, letters of credit and performance bonds issued on our behalf by financial institutions in connection with facility leases and contracts with public sector customers. Also, occasionally we structure some of our acquisitions with contingent consideration, or earn out obligations, based on the future performance of the acquired business. Aside from the aforementioned, we do not have any other business arrangements, derivative financial instruments, or any equity interests in non-consolidated entities (aside from our shareholdings in publicly traded companies included in our available for sale financial assets and our equity investments included in other assets) that would have a significant effect on our assets and liabilities as at June 30, 2012.
Foreign Currency Exposure
We operate internationally and have foreign currency risks related to our revenue, operating expenses, assets and liabilities denominated in currencies other than the U.S. dollar. Consequently, we believe movements in the foreign currencies in which we transact could significantly affect future net earnings. Currently, we typically do not use hedging techniques to mitigate such currency risks. We cannot predict the effect of foreign exchange losses in the future; however, if significant foreign exchange losses are experienced, they could have a material adverse effect on our business, results of operations, and financial condition.
The following table provides an approximate breakdown of our revenue and expenses by currency, expressed as a percentage of total revenue and expenses, as applicable, for the three and six month periods ended June 30, 2012:

16
Off-Balance Sheet Arrangements
As a general practice, we have not entered into off-balance sheet financing arrangements. Except for operating leases and letters of credit, all of our liabilities and commitments are reflected as part of our statement of financial position.
Proposed Transactions
We seek potential acquisition targets on an ongoing basis and may complete several acquisitions in any given fiscal year.
Recent Accounting Pronouncements
A number of new standards, and amendments to standards and interpretations, are not yet effective for the year ended December 31, 2012, and have not been applied in preparing these consolidated financial statements. The relevant standards are listed below.
IFRS 9 Financial Instruments
IFRS 9 (2010) supersedes IFRS 9 (2009) and is effective for annual periods beginning on or after January 1, 2015, with early adoption permitted. For annual periods beginning before January 1, 2015, either IFRS 9 (2009) or IFRS 9 (2010) may be applied.
The Company intends to adopt IFRS 9 (2010) in its financial statements for the annual period beginning on January 1, 2015. The extent of the impact of adoption of IFRS 9 (2010) has not yet been determined.
Amendments to IFRS 7 Disclosures – Transfers of Financial Assets
The Company does not expect the amendments to have a material impact on the financial statements, because of the nature of the Company’s operations and the types of financial assets that it holds.
IFRS 10 Consolidated Financial Statements
The Company intends to adopt IFRS 10 in its financial statements for the annual period beginning on January 1, 2013. The Company does not expect IFRS 10 to have a material impact on the financial statements.
IFRS 11 Joint Arrangements
Three Months Ended June 30,2012 Six Months Ended June 30, 2012Currencies % of Revenue % of Expenses % of Revenue % of Expenses
USD 67% 55% 67% 54%CAD 12% 23% 11% 22%GBP 11% 10% 12% 11%
EURO 4% 3% 5% 3%CHF 1% 5% 1% 5%
Others 4% 5% 4% 5%Total 100% 100% 100% 100%

17
The Company intends to adopt IFRS 11 in its financial statements for the annual period beginning on January 1, 2013. The Company does not expect IFRS 11 to have a material impact on the financial statements.
IFRS 12 Disclosure of Interests in Other Entities
The Company intends to adopt IFRS 12 in its financial statements for the annual period beginning on January 1, 2013. The Company does not expect the amendments to have a material impact on the financial statements, because of the nature and extent of the Company’s interests in other entities.
IFRS 13 Fair Value Measurement
The Company intends to adopt IFRS 13 prospectively in its financial statements for the annual period beginning on January 1, 2013. The extent of the impact of adoption of IFRS 13 has not yet been determined.
Amendments to IAS 28 Investments in Associates and Joint Ventures
The Company intends to adopt the amendments in its financial statements for the annual period beginning on January 1, 2013. The extent of the impact of adoption of the amendments has not yet been determined.
Amendments to IAS 1 Presentation of Financial Statements
The Company intends to adopt the amendments in its financial statements for the annual period beginning on January 1, 2013. As the amendments only require changes in the presentation of items in other comprehensive income, the Company does not expect the amendments to IAS 1 to have a material impact on the financial statements.
Amendments to IAS 19 Employee Benefits
The Company intends to adopt the amendments in its financial statements for the annual period beginning on January 1, 2013. The extent of the impact of adoption of the amendments has not yet been determined.
Amendments to IAS 32 and IFRS 7, Offsetting Financial Assets and Liabilities
The Company intends to adopt the amendments to IFRS 7 in its financial statements for the annual period beginning on January 1, 2013, and the amendments to IAS 32 in its financial statements for the annual period beginning January 1, 2014. The extent of the impact of adoption of the amendments has not yet been determined.
Share Capital
As at August 1, 2012, there were 21,191,530 common shares outstanding.
18
Risks and Uncertainties
A complete description of the risks and uncertainties affecting the Company is included in the most recently filed AIF. Additional risks and uncertainties not presently known to us or that we currently consider immaterial also may impair our business and operations and cause the price of the common shares to decline. If any of the noted risks actually occur, our business may be harmed and the financial condition and results of operation may suffer significantly. In that event, the trading price of the common shares could decline, and shareholders may lose all or part of their investment.
Canada Revenue Agency Reassessment and Other Tax Uncertainties
In July 2012, a subsidiary of Constellation received a notice of reassessment for the 2004 taxation year from the Canadian tax authorities (“CRA”) which increased taxable income of the subsidiary by approximately $20 million relating to a gain on the sale of property between entities under common control. As a result of the notice of reassessment, the CRA has determined that the subsidiary owes approximately $6.2 million in federal tax and interest. In order to appeal the reassessment, the subsidiary is required to pay 50% of this amount within 90 days. The Company has yet to receive a provincial reassessment, but expects to receive such notice within the next 120 days. At this stage, the Company believes the proposed reassessment is without merit and intends to appeal the reassessment. The Company believes that it has adequately provided for the probable outcome in respect of this matter and as such no additional provision has been recorded in these financial statements during the quarter. There is no assurance, however, that the Company's appeal will be successful and, if unsuccessful, the Company's future financial results and tax provisions could be adversely affected.
The Company is subject to various other income tax audits by various authorities in respect of prior periods that could result in additional tax expense in future periods. While the outcome of such other outstanding audits and claims remains uncertain, it is expected that they will be resolved without a material impact to the Company’s financial position.
Controls and Procedures Evaluation of disclosure controls and procedures:
Management is responsible for establishing and maintaining disclosure controls and procedures as defined under National Instrument 52-109. At June 30, 2012, the President and Chief Financial Officer concluded that the design and operation of these disclosure controls and procedures were effective and that material information relating to the Company, including its subsidiaries, was made known to them and was recorded, processed, summarized and reported within the time periods specified under applicable securities legislation.
Internal controls over financial reporting: In accordance with National Instrument 52-109 which requires certification of disclosure in issuers’ interim filings, the President and Chief Financial Officer have designed or caused it to be designed under their supervision, disclosure controls and procedures to provide reasonable assurance that (i) information required to be disclosed by the Company in its quarterly filings or other reports filed or submitted by it under applicable securities legislation is recorded, processed, summarized and reported within the prescribed time periods, and (ii) material information regarding the Company is accumulated and communicated to the Company’s management, including its President and Chief Financial Officer in a timely manner.
In addition, the President and Chief Financial Officer have designed or caused it to be designed under their supervision internal controls over financial reporting (“ICFR”) to provide reasonable assurance regarding the

19
reliability of financial reporting and the preparation of financial statements for external purposes. The control framework the President and the Chief Financial Officer used to design the Company’s ICFR is recognized by the Committee of Sponsoring Organizations of the Treadway Commission.
The President and the Chief Financial Officer have evaluated, or caused to be evaluated under their supervision, whether or not there were changes to its ICFR during the six-month period ended June 30, 2012 that have materially affected, or are reasonably likely to materially affect the Company’s ICFR. No such changes were identified through their evaluation.

For the three and six month periods ended June 30, 2012 and 2011
Condensed Consolidated Interim Financial Statements(In U.S. dollars)
CONSTELLATIONSOFTWARE INC.
(Unaudited)

CONSTELLATION SOFTWARE INC.Condensed Consolidated Interim Statements of Financial Position(In thousands of U.S. dollars)
(Unaudited)June 30,
2012December 31,
2011
Assets
Current assets:Cash 21,671$ 33,492$
Equity securities available-for-sale (note 5) 24,327 21,222
Accounts receivable 107,804 100,398
Work in progress 33,156 26,244
Inventories 14,983 13,539
Other assets (note 6) 27,219 25,633
229,160 220,528
Non-current assets:
Property and equipment 15,461 14,591
Deferred income taxes 102,719 99,659
Other assets (note 6) 26,594 28,005
Intangible assets (note 7) 301,153 267,792
445,927 410,047
Total assets 675,087$ 630,575$
Liabilities and Shareholders' Equity
Current liabilities:
Bank indebtedness (note 8) 27,535$ ‐$
Accounts payable and accrued liabilities 95,287 114,952
Dividends payable (note 11) 21,217 ‐
Deferred revenue 201,586 181,450
Provisions (note 9) 3,156 3,555
Acquired contract liabilities 2,045 4,750
Acquisition holdback payments 17,832 11,378
Income taxes payable 4,280 4,751
372,938 320,836
Non-current liabilities:
Deferred income taxes 14,458 11,259
Acquired contract liabilities 27,044 28,051
Acquisition holdback payments 2,980 2,474
Other liabilities 9,554 11,675
54,036 53,459
Total liabilities 426,974 374,295
Shareholders' equity (note 11):
Capital stock 99,283 99,283
Accumulated other comprehensive income 9,662 6,961
Retained earnings 139,168 150,036 248,113 256,280
Subsequent events (notes 11, 13,16,18)
Total liabilities and shareholders' equity 675,087$ 630,575$
See accompanying notes to the condensed consolidated interim financial statements.
21
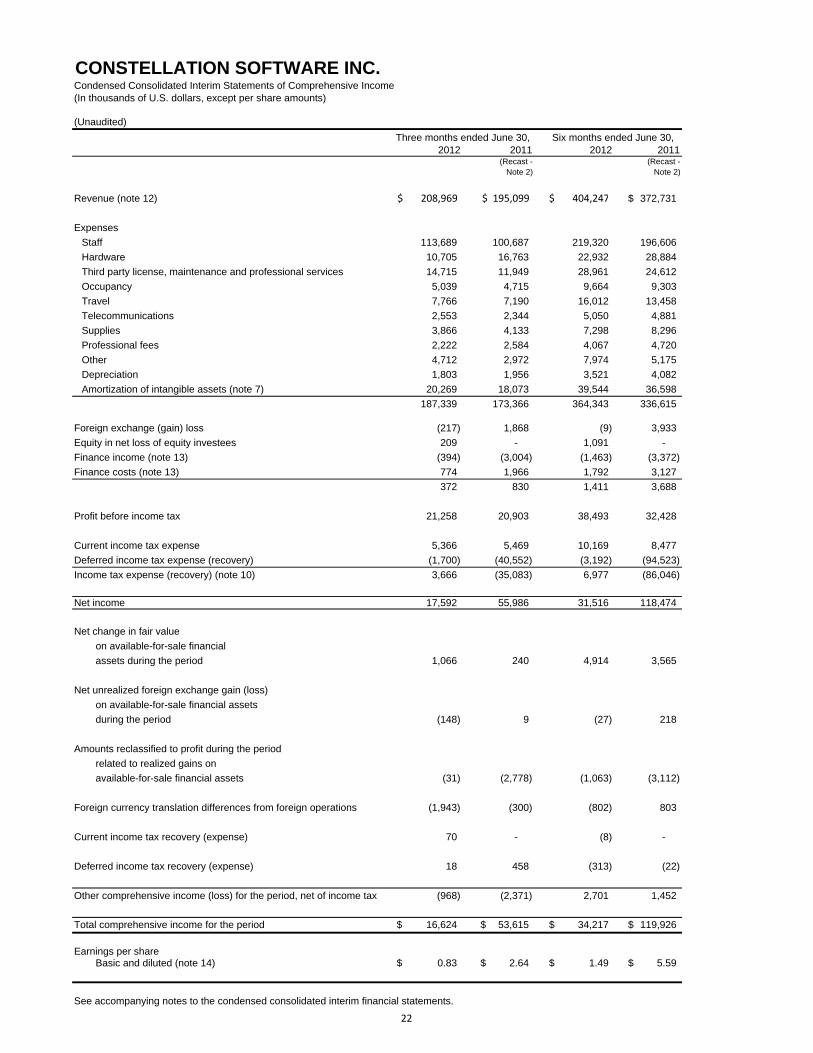
CONSTELLATION SOFTWARE INC.Condensed Consolidated Interim Statements of Comprehensive Income(In thousands of U.S. dollars, except per share amounts)
(Unaudited)
2012 2011 2012 2011(Recast -
Note 2)(Recast -
Note 2)
Revenue (note 12) 208,969$ 195,099$ 404,247$ 372,731$
Expenses
Staff 113,689 100,687 219,320 196,606
Hardware 10,705 16,763 22,932 28,884
Third party license, maintenance and professional services 14,715 11,949 28,961 24,612
Occupancy 5,039 4,715 9,664 9,303
Travel 7,766 7,190 16,012 13,458
Telecommunications 2,553 2,344 5,050 4,881
Supplies 3,866 4,133 7,298 8,296
Professional fees 2,222 2,584 4,067 4,720
Other 4,712 2,972 7,974 5,175
Depreciation 1,803 1,956 3,521 4,082
Amortization of intangible assets (note 7) 20,269 18,073 39,544 36,598
187,339 173,366 364,343 336,615
Foreign exchange (gain) loss (217) 1,868 (9) 3,933
Equity in net loss of equity investees 209 - 1,091 -
Finance income (note 13) (394) (3,004) (1,463) (3,372)
Finance costs (note 13) 774 1,966 1,792 3,127
372 830 1,411 3,688
Profit before income tax 21,258 20,903 38,493 32,428
Current income tax expense 5,366 5,469 10,169 8,477
Deferred income tax expense (recovery) (1,700) (40,552) (3,192) (94,523)
Income tax expense (recovery) (note 10) 3,666 (35,083) 6,977 (86,046)
Net income 17,592 55,986 31,516 118,474
Net change in fair value
on available-for-sale financial
assets during the period 1,066 240 4,914 3,565
Net unrealized foreign exchange gain (loss)
on available-for-sale financial assets
during the period (148) 9 (27) 218
Amounts reclassified to profit during the period
related to realized gains on
available-for-sale financial assets (31) (2,778) (1,063) (3,112)
Foreign currency translation differences from foreign operations (1,943) (300) (802) 803
Current income tax recovery (expense) 70 - (8) -
Deferred income tax recovery (expense) 18 458 (313) (22)
Other comprehensive income (loss) for the period, net of income tax (968) (2,371) 2,701 1,452
Total comprehensive income for the period 16,624$ 53,615$ 34,217$ 119,926$
Earnings per shareBasic and diluted (note 14) 0.83$ 2.64$ 1.49$ 5.59$
See accompanying notes to the condensed consolidated interim financial statements.
Six months ended June 30,Three months ended June 30,
22
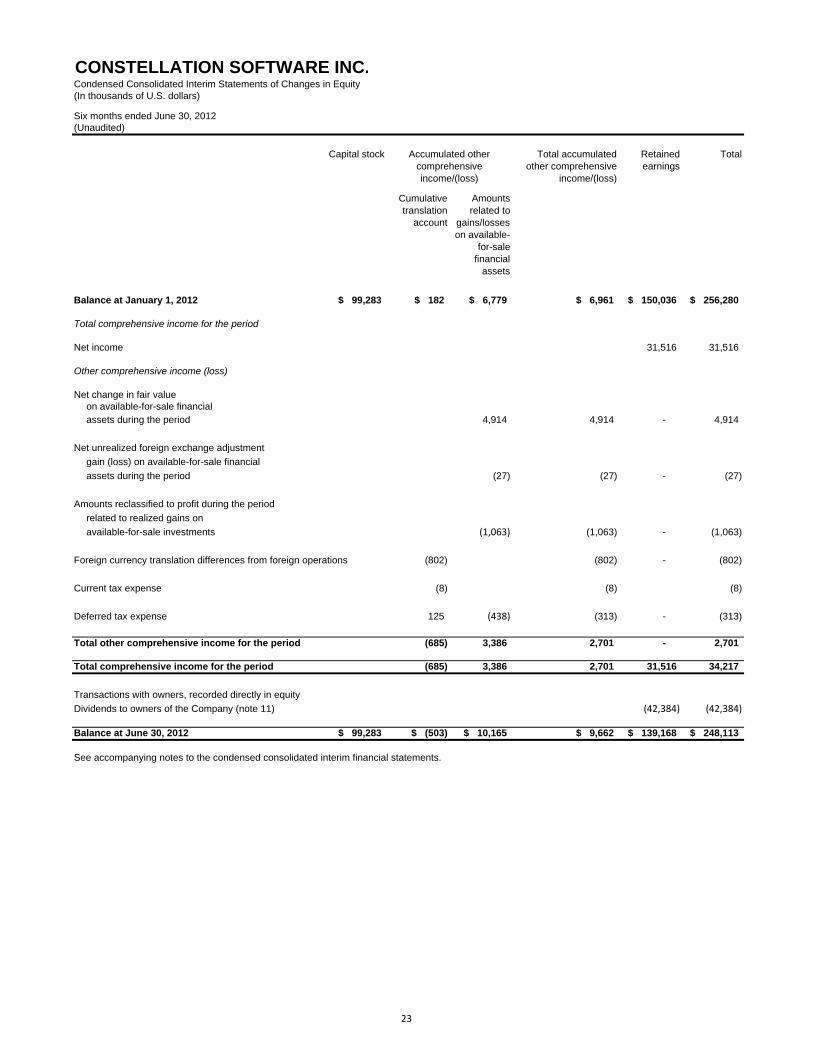
CONSTELLATION SOFTWARE INC.Condensed Consolidated Interim Statements of Changes in Equity(In thousands of U.S. dollars)
Six months ended June 30, 2012(Unaudited)
Capital stock Total accumulated other comprehensive
income/(loss)
Retained earnings
Total
Cumulative translation
account
Amounts related to
gains/losses on available-
for-sale financial
assets
Balance at January 1, 2012 $ 99,283 $ 182 $ 6,779 $ 6,961 $ 150,036 $ 256,280
Total comprehensive income for the period
Net income 31,516 31,516
Other comprehensive income (loss)
Net change in fair valueon available-for-sale financialassets during the period 4,914 4,914 ‐ 4,914
Net unrealized foreign exchange adjustment
gain (loss) on available-for-sale financial
assets during the period (27) (27) ‐ (27)
Amounts reclassified to profit during the period
related to realized gains on
available-for-sale investments (1,063) (1,063) ‐ (1,063)
Foreign currency translation differences from foreign operations (802) (802) ‐ (802)
Current tax expense (8) (8) (8)
Deferred tax expense 125 (438) (313) ‐ (313)
Total other comprehensive income for the period (685) 3,386 2,701 - 2,701
Total comprehensive income for the period (685) 3,386 2,701 31,516 34,217
Transactions with owners, recorded directly in equity
Dividends to owners of the Company (note 11) (42,384) (42,384)
Balance at June 30, 2012 $ 99,283 $ (503) $ 10,165 $ 9,662 $ 139,168 $ 248,113
See accompanying notes to the condensed consolidated interim financial statements.
Accumulated other comprehensive income/(loss)
23
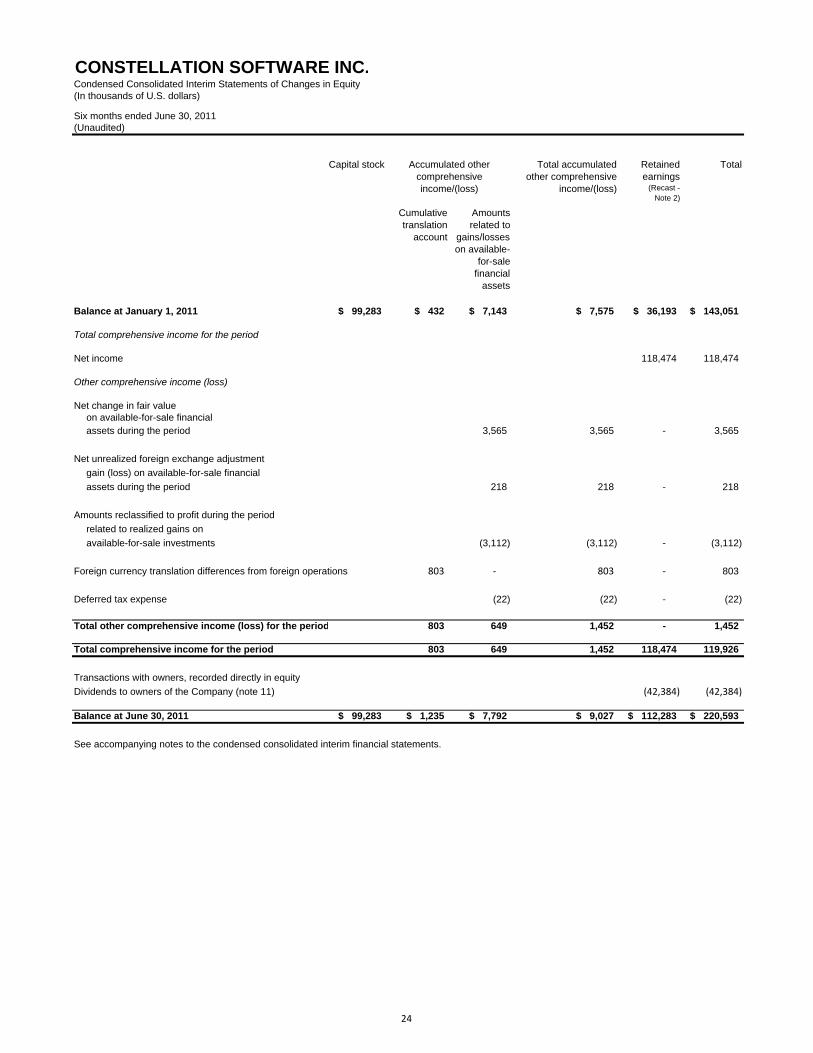
CONSTELLATION SOFTWARE INC.Condensed Consolidated Interim Statements of Changes in Equity(In thousands of U.S. dollars)
Six months ended June 30, 2011(Unaudited)
Capital stock Total accumulated other comprehensive
income/(loss)
Retained earnings
(Recast - Note 2)
Total
Cumulative translation
account
Amounts related to
gains/losses on available-
for-sale financial
assets
Balance at January 1, 2011 $ 99,283 $ 432 $ 7,143 $ 7,575 $ 36,193 $ 143,051
Total comprehensive income for the period
Net income 118,474 118,474
Other comprehensive income (loss)
Net change in fair value on available-for-sale financialassets during the period 3,565 3,565 ‐ 3,565
Net unrealized foreign exchange adjustment
gain (loss) on available-for-sale financial
assets during the period 218 218 ‐ 218
Amounts reclassified to profit during the period
related to realized gains on
available-for-sale investments (3,112) (3,112) ‐ (3,112)
Foreign currency translation differences from foreign operations 803 ‐ 803 ‐ 803
Deferred tax expense (22) (22) ‐ (22)
Total other comprehensive income (loss) for the period 803 649 1,452 - 1,452
Total comprehensive income for the period 803 649 1,452 118,474 119,926
Transactions with owners, recorded directly in equity
Dividends to owners of the Company (note 11) (42,384) (42,384)
Balance at June 30, 2011 $ 99,283 $ 1,235 $ 7,792 $ 9,027 $ 112,283 $ 220,593
See accompanying notes to the condensed consolidated interim financial statements.
Accumulated other comprehensive income/(loss)
24

CONSTELLATION SOFTWARE INC.Condensed Consolidated Interim Statements of Cash Flows(In thousands of U.S. dollars)
(Unaudited)
2012 2011 2012 2011(Recast -
Note 2)(Recast -
Note 2)
Cash flows from operating activities:Net income 17,592$ 55,986$ 31,516$ 118,474$ Adjustments for:
Depreciation 1,803 1,956 3,521 4,082 Amortization of intangible assets 20,269 18,073 39,544 36,598 Equity in net loss of equity investees 209 - 1,091 - Finance income (394) (3,004) (1,463) (3,372) Finance costs 774 1,966 1,792 3,127 Income tax expense (recovery) 3,666 (35,083) 6,977 (86,046) Foreign exchange loss (217) 1,868 (9) 3,933
Change in non-cash operating working capital (note 17) (9,495) (29,572) (33,839) (42,948) Income taxes paid (8,013) (4,349) (10,715) (6,728) Net cash flows from operating activities 26,194 7,841 38,415 27,120
Cash flows from financing activities:Interest paid (501) (1,576) (837) (2,463) Increase in other non current liabilities 322 (246) 122 (159) Increase in bank indebtedness, net 16,342 17,071 29,342 55,715 Credit facility transaction costs (46) - (1,886) - Dividends paid (21,192) - (21,192) (42,384) Net cash flows from (used in) financing activities (5,075) 15,249 5,549 10,709
Cash flows from investing activities:Acquisition of businesses, net of cash
acquired (note 4) (42,830) (21,153) (50,637) (31,544) Post-acquisition settlement payments, net of receipts (4,132) (47) (4,633) (1,099) Purchases of available-for-sale financial assets (80) (4,695) (80) (5,944) Proceeds from sale of available-for-sale financial assets 55 5,845 1,863 6,488 Proceeds from sale of intangible assets 101 101 - Increase in restricted cash - - - 450 Interest received 41 117 79 154 Property and equipment purchased (1,251) (1,465) (2,541) (4,064) Cash flows provided from (used in) investing activities (48,096) (21,398) (55,848) (35,559)
Effect of foreign currency translation adjustment oncash and cash equivalents (165) (1,623) 63 (2,969)
Increase (decrease) in cash and cash equivalents (27,142) 69 (11,821) (699)
Cash, beginning of period 48,813 30,143 33,492 30,911
Cash, end of period 21,671$ 30,212$ 21,671$ 30,212$
See accompanying notes to the condensed consolidated interim financial statements.
Three months ended June 30, Six months ended June 30,
25

CONSTELLATION SOFTWARE INC. Notes to Condensed Consolidated Interim Financial Statements (In thousands of U.S. dollars, except per share amounts and as otherwise indicated) Three and six months ended June 30, 2012 and 2011 (Unaudited)
26
Notes to the consolidated financial statements
1. Reporting entity 10. Income tax expense
2. Basis of presentation 11. Capital and other components of equity
3. Significant accounting policies 12. Revenue
4. Business acquisitions 13. Finance income and finance costs
5. Equity securities available-for-sale 14. Earnings per share
6. Other assets 15. Operating segments
7. Intangible assets 16. Contingencies
8. Bank indebtedness 17. Changes in non-cash operating working capital
9. Provisions 18. Subsequent events
CONSTELLATION SOFTWARE INC. Notes to Condensed Consolidated Interim Financial Statements (In thousands of U.S. dollars, except per share amounts and as otherwise indicated) Three and six months ended June 30, 2012 and 2011 (Unaudited)
27
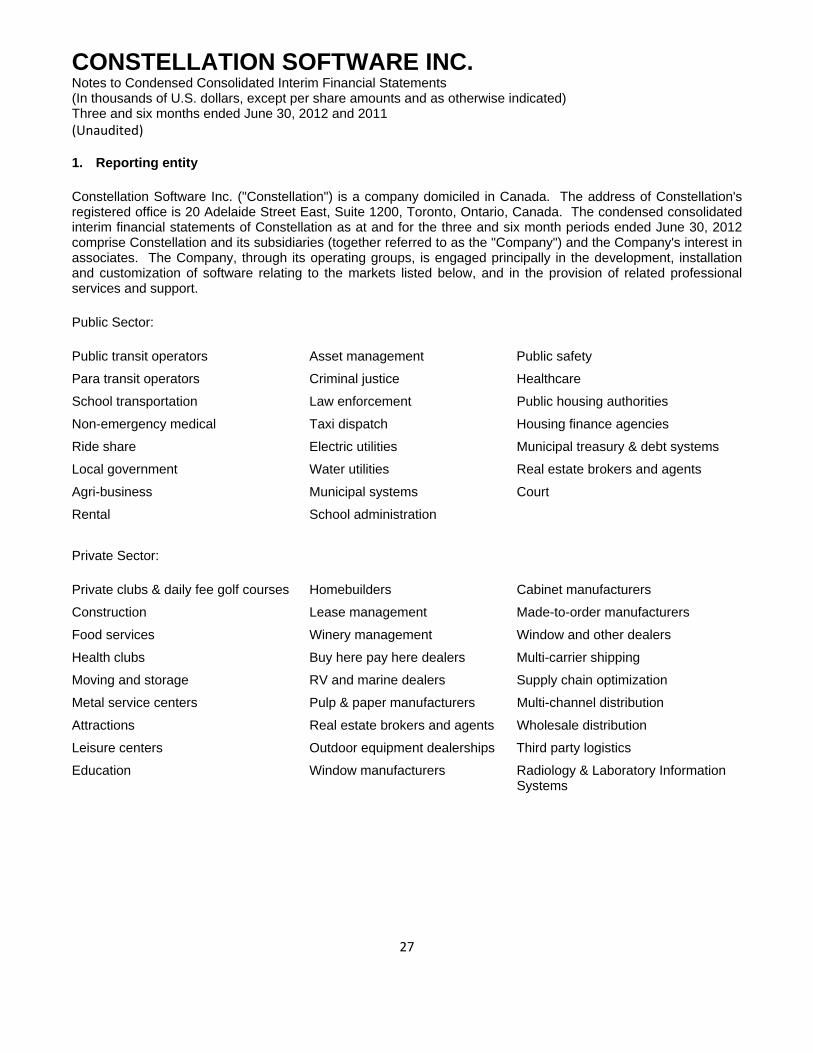
1. Reporting entity
Constellation Software Inc. ("Constellation") is a company domiciled in Canada. The address of Constellation's registered office is 20 Adelaide Street East, Suite 1200, Toronto, Ontario, Canada. The condensed consolidated interim financial statements of Constellation as at and for the three and six month periods ended June 30, 2012 comprise Constellation and its subsidiaries (together referred to as the "Company") and the Company's interest in associates. The Company, through its operating groups, is engaged principally in the development, installation and customization of software relating to the markets listed below, and in the provision of related professional services and support.
Public Sector:
Public transit operators Asset management Public safety
Para transit operators Criminal justice Healthcare
School transportation Law enforcement Public housing authorities
Non-emergency medical Taxi dispatch Housing finance agencies
Ride share Electric utilities Municipal treasury & debt systems
Local government Water utilities Real estate brokers and agents
Agri-business Municipal systems Court
Rental School administration
Private Sector:
Private clubs & daily fee golf courses Homebuilders Cabinet manufacturers
Construction Lease management Made-to-order manufacturers
Food services Winery management Window and other dealers
Health clubs Buy here pay here dealers Multi-carrier shipping
Moving and storage RV and marine dealers Supply chain optimization
Metal service centers Pulp & paper manufacturers Multi-channel distribution
Attractions Real estate brokers and agents Wholesale distribution
Leisure centers Outdoor equipment dealerships Third party logistics
Education Window manufacturers Radiology & Laboratory Information Systems

CONSTELLATION SOFTWARE INC. Notes to Condensed Consolidated Interim Financial Statements (In thousands of U.S. dollars, except per share amounts and as otherwise indicated) Three and six months ended June 30, 2012 and 2011 (Unaudited)
28
2. Basis of presentation
(a) Statement of compliance
These condensed consolidated interim financial statements have been prepared in accordance with International Accounting Standard 34, Interim Financial Reporting (“IAS 34”) as issued by the International Accounting Standards Board (“IASB”) and using the accounting policies disclosed in Note 3 of the Company’s 2011 annual consolidated financial statements.
The policies applied in these condensed consolidated interim financial statements are based on International Financial Reporting Standards (“IFRS”) issued and outstanding as of August 1, 2012, the date the Board of Directors approved the condensed consolidated interim financial statements. Any subsequent changes to IFRS that are given effect in the Company’s annual consolidated financial statements for the year ending December 31, 2012 could result in a restatement of these condensed consolidated interim financial statements.
These condensed consolidated interim financial statements should be read in conjunction with the Company’s 2011 annual consolidated financial statements.
Recast of prior period financial information
Net income for the three and six months ended June 30, 2011 has been adjusted to correct for an error. This error resulted in a reduction of the deferred income tax recovery recognized in profit and loss for the three and six month periods totalling $2,613 and $4,354 respectively. Accordingly, the condensed consolidated interim statements of comprehensive income, changes in equity, and cash flows for the three and six months ended June 30, 2011 have been adjusted for this correction.
(b) Basis of measurement
The condensed consolidated interim financial statements have been prepared on the historical cost basis except for available-for-sale financial assets, certain assets and liabilities initially recognized in connection with business combinations, and derivative financial instruments, which are measured at fair value.
Previously
Reported Recast
Previously
Reported Recast
Deferred income tax recovery (43,165) (40,552) (98,877) (94,523)
Net income 58,599 55,986 122,828 118,474
Earnings per share
Basic and diluted 2.77$ 2.64$ 5.80$ 5.59$
Three months ended
June 30, 2011
Six months ended
June 30, 2011
CONSTELLATION SOFTWARE INC. Notes to Condensed Consolidated Interim Financial Statements (In thousands of U.S. dollars, except per share amounts and as otherwise indicated) Three and six months ended June 30, 2012 and 2011 (Unaudited)
29
(c) Functional and presentation of currency
The condensed consolidated interim financial statements are presented in U.S. dollars, which is Constellation's functional currency.
(d) Use of estimates and judgements
The preparation of the condensed consolidated interim financial statements in conformity with IFRS requires management to make judgements, estimates and assumptions that affect the application of accounting policies and reported amounts of assets, liabilities, income and expenses. Actual results may differ from these estimates.
Estimates and underlying assumptions are reviewed on an ongoing basis. Estimates are based on historical experience and other assumptions that are considered reasonable in the circumstances. The actual amount or values may vary in certain instances from the assumptions and estimates made. Changes will be recorded, with corresponding effect in profit or loss, when, and if, better information is obtained.
3. Significant accounting policies
The significant accounting policies used in preparing these condensed consolidated interim financial statements are unchanged from those disclosed in the Company’s 2011 annual consolidated financial statements, and have been applied consistently to all periods presented in these condensed consolidated interim financial statements.
The accounting policies have been applied consistently by the Company‘s subsidiaries.
New standards and interpretations not yet adopted
A number of new standards, and amendments to standards and interpretations, are not yet effective for the year ending December 31, 2012, and have not been applied in preparing these consolidated financial statements. The relevant standards are listed below.
IFRS 9 Financial Instruments
IFRS 9 (2010) supersedes IFRS 9 (2009) and is effective for annual periods beginning on or after January 1, 2015, with early adoption permitted. For annual periods beginning before January 1, 2015, either IFRS 9 (2009) or IFRS 9 (2010) may be applied.
The Company intends to adopt IFRS 9 (2010) in its financial statements for the annual period beginning on January 1, 2015. The extent of the impact of adoption of IFRS 9 (2010) has not yet been determined.
Amendments to IFRS 7 Disclosures – Transfers of Financial Assets
The Company does not expect the amendments to have a material impact on the financial statements, because of the nature of the Company’s operations and the types of financial assets that it holds.
CONSTELLATION SOFTWARE INC. Notes to Condensed Consolidated Interim Financial Statements (In thousands of U.S. dollars, except per share amounts and as otherwise indicated) Three and six months ended June 30, 2012 and 2011 (Unaudited)
30
IFRS 10 Consolidated Financial Statements
The Company intends to adopt IFRS 10 in its financial statements for the annual period beginning on January 1, 2013. The Company does not expect IFRS 10 to have a material impact on the financial statements.
IFRS 11 Joint Arrangements
The Company intends to adopt IFRS 11 in its financial statements for the annual period beginning on January 1, 2013. The Company does not expect IFRS 11 to have a material impact on the financial statements.
IFRS 12 Disclosure of Interests in Other Entities
The Company intends to adopt IFRS 12 in its financial statements for the annual period beginning on January 1, 2013. The Company does not expect the amendments to have a material impact on the financial statements, because of the nature and extent of the Company’s interests in other entities.
IFRS 13 Fair Value Measurement
The Company intends to adopt IFRS 13 prospectively in its financial statements for the annual period beginning on January 1, 2013. The extent of the impact of adoption of IFRS 13 has not yet been determined.
Amendments to IAS 28 Investments in Associates and Joint Ventures
The Company intends to adopt the amendments in its financial statements for the annual period beginning on January 1, 2013. The extent of the impact of adoption of the amendments has not yet been determined.
Amendments to IAS 1 Presentation of Financial Statements
The Company intends to adopt the amendments in its financial statements for the annual period beginning on January 1, 2013. As the amendments only require changes in the presentation of items in other comprehensive income, the Company does not expect the amendments to IAS 1 to have a material impact on the financial statements.
Amendments to IAS 19 Employee Benefits
The Company intends to adopt the amendments in its financial statements for the annual period beginning on January 1, 2013. The extent of the impact of adoption of the amendments has not yet been determined.
Amendments to IAS 32 and IFRS 7, Offsetting Financial Assets and Liabilities
The Company intends to adopt the amendments to IFRS 7 in its financial statements for the annual period beginning on January 1, 2013, and the amendments to IAS 32 in its financial statements for the annual period beginning January 1, 2014. The extent of the impact of adoption of the amendments has not yet been determined.

CONSTELLATION SOFTWARE INC. Notes to Condensed Consolidated Interim Financial Statements (In thousands of U.S. dollars, except per share amounts and as otherwise indicated) Three and six months ended June 30, 2012 and 2011 (Unaudited)
31
4. Business acquisitions
During the six months ended June 30, 2012, the Company closed fifteen acquisitions for aggregate cash consideration of $55,805 plus cash holdbacks of $11,817, resulting in total consideration of $67,622. There were no acquisitions during the period that were deemed to be individually material. Of the fifteen acquisitions, the Company acquired 100% of the shares of eleven companies and acquired the net assets of the other four companies. The holdbacks are payable over periods ranging from six months to three years and are adjusted, as necessary, for claims under the respective representations and warranties of the agreements.
The acquisitions include software companies catering to the following markets; health clubs, school administration, asset management, radiology and laboratory information systems, utilities, lease management, local government, rental, real estate brokers and agents, public transit operators, and construction, all of which are software businesses similar to existing businesses operated by the Company. The acquisitions have been accounted for using the acquisition method with the results of operations included in these condensed consolidated interim financial statements from the date of each acquisition. The goodwill recognized in connection with these acquisitions is primarily attributable to the application of Constellation’s best practices to improve the operations of the companies acquired, synergies with existing businesses of Constellation, and other intangibles that do not qualify for separate recognition. Goodwill in the amount of $1,159 is expected to be deductible for income tax purposes.
Due to the complexity and timing of certain acquisitions made in the latter part of the quarter, the Company is still in the process of determining and finalizing the fair value of the assets and liabilities acquired as part of the acquisitions. The amounts determined on a provisional basis generally relate to net tangible asset assessments and measurement of the assumed liabilities. Eight of the acquisitions have been included in the Private reportable segment and seven have been included in the Public reportable segment.
Public Sector Private Sector Consolidated
Assets acquired:
Cash 3,027$ 2,141$ 5,168$
Accounts receivable 8,563 2,653 11,216
Other current assets 4,355 1,402 5,757
Property and equipment 1,235 691 1,926
Technology assets 32,486 11,675 44,161
Customer assets 15,047 6,170 21,217
Backlog 992 - 992
65,873 24,732 90,605
Liabilities assumed:
Current liabilities 6,346 2,993 9,339
Deferred revenue 10,157 3,767 13,924
Deferred income taxes 1,211 1,416 2,627
Other long term liabilities 1,334 698 2,032
19,048 8,874 27,922
Goodwill 1,963 2,976 4,939
Total cash consideration 48,788$ 18,834$ 67,622$

CONSTELLATION SOFTWARE INC. Notes to Condensed Consolidated Interim Financial Statements (In thousands of U.S. dollars, except per share amounts and as otherwise indicated) Three and six months ended June 30, 2012 and 2011 (Unaudited)
32
The acquisitions include contingent consideration payable on the achievement of certain revenue targets. The obligation for contingent consideration for acquisitions during the six months ended June 30, 2012 has been recorded at its estimated fair value, which has been determined to be $2,098 at the various acquisition dates. As part of these arrangements, which included both the maximum and unlimited contingent consideration amounts, the estimated outcome is not expected to exceed a maximum of $3,712. Aggregate contingent consideration of $9,952 (December 31, 2011 - $7,166) has been reported in the statement of financial position at its estimated fair value relating to applicable acquisitions completed in the current and prior periods.
The 2012 business acquisitions contributed revenue of $13,043 and net loss of $1,355 during the six months ended June 30, 2012. Revenue and net loss amounts from acquisitions included in the Public sector were $8,926 and $783, respectively. Revenue and net loss amounts from acquisitions included in the Private sector were $4,117 and $572, respectively. If the acquisitions would have occurred on January 1, 2012, management estimates that consolidated revenue would have been $424,722 and consolidated net income for the period would have been $30,014 as compared to the amounts reported in the statement of comprehensive income for the period. In determining these amounts, management has assumed that the fair value adjustments that arose on the date of acquisitions would have been the same if the acquisition had occurred on January 1, 2012. The net loss from acquisitions is primarily caused by the associated amortization of intangible assets recognized as if the acquisitions had occurred on January 1, 2012.
5. Equity securities available-for-sale
At June 30, 2012, the Company held investments in three (December 31, 2011 – three) public companies listed in the U.S. and Canada, all of which develop and sell software solutions. All investments have been designated as available-for-sale. A certain amount of common shares of one of the investments held by the Company were sold during the six months ended June 30, 2012 and, accordingly, a gain on sale of $1,063 was recognized in profit or loss.
June 30, 2012 December 31, 2011 Cost Fair Value Cost Fair Value
Common shares $ 12,539 $ 24,327 $ 13,330 $ 21,222

CONSTELLATION SOFTWARE INC. Notes to Condensed Consolidated Interim Financial Statements (In thousands of U.S. dollars, except per share amounts and as otherwise indicated) Three and six months ended June 30, 2012 and 2011 (Unaudited)
33
6. Other Assets
7. Intangible assets
June 30, 2012
December 31, 2011
Prepaid assets 22,735$ 22,432$
Investment tax credits recoverable 3,512 3,201
Acquired contract assets 972 -
Total current 27,219$ 25,633$
Investment tax credits recoverable 8,629$ 8,271$
Non-current trade and other receivables 2,293 2,508
Equity accounted investees 13,443 14,534
Acquired contract assets 2,229 2,692
Total non-current 26,594$ 28,005$
Technology Assets
Customer Assets Backlog
Non-compete agreements Goodwill Total
Cost
Balance at January 1, 2012 370,212$ 133,149$ 12,977$ 2,685$ 59,491$ 578,514$
Acquisitions through business combinations 45,272 21,045 992 - 5,545 72,854
Effect of movements in foreign exchange (75) (30) 5 (3) 210 107
Balance at June 30, 2012 415,409$ 154,164$ 13,974$ 2,682$ 65,246$ 651,475$
Amortization and impairment losses
Balance at January 1, 2012 225,112$ 70,208$ 12,973$ 2,429$ -$ 310,722$
Amortization for the year 26,765 12,596 83 100 - 39,544
Effect of movements in foreign exchange 39 6 14 (3) - 56
Balance at June 30, 2012 251,916$ 82,810$ 13,070$ 2,526$ -$ 350,322$
Carrying amounts
At January 1, 2012 145,100$ 62,941$ 4$ 256$ 59,491$ 267,792$
At June 30, 2012 163,493$ 71,354$ 904$ 156$ 65,246$ 301,153$

CONSTELLATION SOFTWARE INC. Notes to Condensed Consolidated Interim Financial Statements (In thousands of U.S. dollars, except per share amounts and as otherwise indicated) Three and six months ended June 30, 2012 and 2011 (Unaudited)
34
8. Bank indebtedness
On March 13, 2012, Constellation entered into a new credit facility with a syndicate of Canadian chartered banks and U.S. banks in the amount of $300,000 (December 31, 2011 - $160,000). The revolving line-of-credit bears a variable interest rate and is due in full on February 29, 2016 with no fixed repayments required over the term to maturity. Interest rates are calculated at prime or LIBOR plus interest rate spreads based on a leverage table that considers Constellation’s indebtedness at that time. The line-of-credit is secured by a general security agreement covering the majority of Constellation’s and its subsidiaries’ present and future real and personal property, assets and undertaking, including all shares, partnership interests and other equity interests held in the capital of any other company; and is subject to various debt covenants. As at June 30, 2012, $29,342 (December 31, 2011 - nil) had been drawn from this credit facility, and letters of credit totalling $280 (December 31, 2011 - $385) were issued, which limits the borrowing capacity on a dollar-for-dollar basis. Transaction costs associated with the new line-of-credit have been included as part of the carrying amount of the liability and are being amortized through profit or loss using the effective interest rate method. Amortized costs recognized in the three and six month periods ended June 30, 2012 relating to this line-of-credit amounted to $41 and $79, respectively. As at June 30, 2012, the carrying amount of such costs totalling $1,807 has been classified as part of bank indebtedness in the statement of financial position. Capitalized costs relating to the operating line-of-credit in place at December 31, 2011 amounted to $644, and have been expensed to finance costs during the period.
9. Provisions
The provisions balance is comprised of various individual provisions for onerous contracts and other estimated liabilities of the Company.
10. Income taxes
Income tax expense is recognized on management’s best estimate of the actual income tax rate for the interim period applied to the pre-tax income of the interim period. As a result of foreign exchange fluctuations, acquisitions and ongoing changes due to intercompany transactions amongst entities operating in different jurisdictions, the Company has determined that a reasonable estimate of a weighted average annual tax rate cannot be determined on a consolidated basis. The Company’s consolidated effective tax rate in respect of continuing operations for the six months ended June 30, 2012 was 18 percent (six months ended June 30, 2011 – negative 265 percent). The significant change in the effective tax rate period over period was due to the recognition of a future tax recovery related to inter-jurisdictional transfers of certain intangible assets within the Company during the six months ended June 30, 2011. Deferred tax assets were recorded on the increase in fair market value arising on the transfers. The deferred income tax recovery recorded through profit or loss represents the amount of the temporary differences that the Company has determined is probable of being utilized to reduce income taxes otherwise payable in the future. The Company does not expect a similar deferred income tax recovery in the year ending December 31, 2012.
At December 31, 2011 3,555$
Reversal (133)
Provisions recorded during the period 1,114
Provisions used during the period (1,366)
Effect of movements in foreign exchange (14)
At June 30, 2012 3,156$
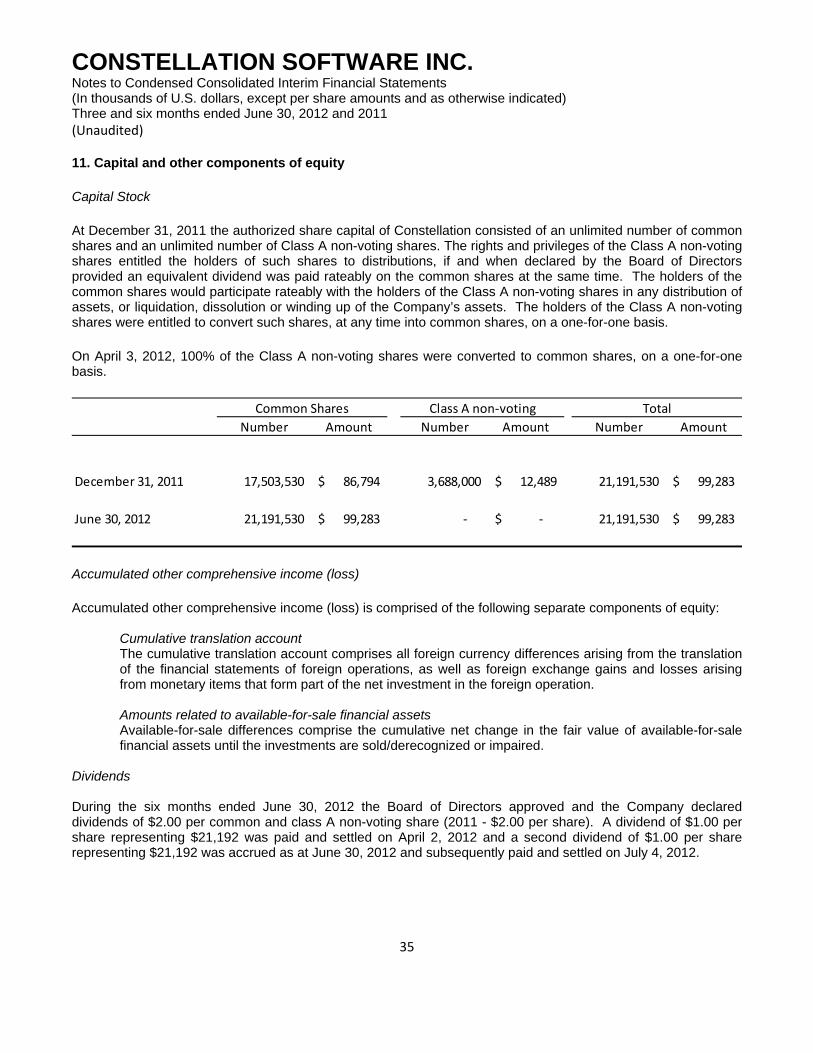
CONSTELLATION SOFTWARE INC. Notes to Condensed Consolidated Interim Financial Statements (In thousands of U.S. dollars, except per share amounts and as otherwise indicated) Three and six months ended June 30, 2012 and 2011 (Unaudited)
35
11. Capital and other components of equity
Capital Stock
At December 31, 2011 the authorized share capital of Constellation consisted of an unlimited number of common shares and an unlimited number of Class A non-voting shares. The rights and privileges of the Class A non-voting shares entitled the holders of such shares to distributions, if and when declared by the Board of Directors provided an equivalent dividend was paid rateably on the common shares at the same time. The holders of the common shares would participate rateably with the holders of the Class A non-voting shares in any distribution of assets, or liquidation, dissolution or winding up of the Company’s assets. The holders of the Class A non-voting shares were entitled to convert such shares, at any time into common shares, on a one-for-one basis.
On April 3, 2012, 100% of the Class A non-voting shares were converted to common shares, on a one-for-one basis.
Accumulated other comprehensive income (loss)
Accumulated other comprehensive income (loss) is comprised of the following separate components of equity:
Cumulative translation account The cumulative translation account comprises all foreign currency differences arising from the translation of the financial statements of foreign operations, as well as foreign exchange gains and losses arising from monetary items that form part of the net investment in the foreign operation.
Amounts related to available-for-sale financial assets Available-for-sale differences comprise the cumulative net change in the fair value of available-for-sale financial assets until the investments are sold/derecognized or impaired.
Dividends During the six months ended June 30, 2012 the Board of Directors approved and the Company declared dividends of $2.00 per common and class A non-voting share (2011 - $2.00 per share). A dividend of $1.00 per share representing $21,192 was paid and settled on April 2, 2012 and a second dividend of $1.00 per share representing $21,192 was accrued as at June 30, 2012 and subsequently paid and settled on July 4, 2012.
Number Amount Number Amount Number Amount
December 31, 2011 17,503,530 86,794$ 3,688,000 12,489$ 21,191,530 99,283$
June 30, 2012 21,191,530 99,283$ ‐ ‐$ 21,191,530 99,283$
Common Shares Class A non‐voting Total
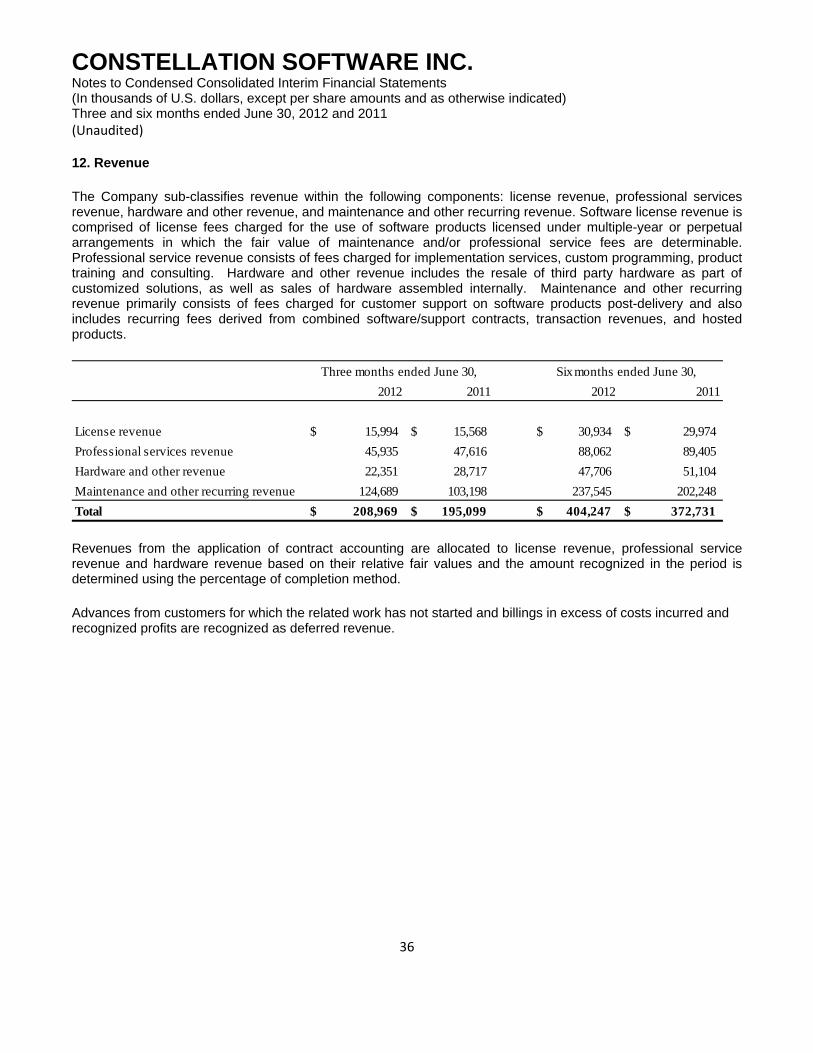
CONSTELLATION SOFTWARE INC. Notes to Condensed Consolidated Interim Financial Statements (In thousands of U.S. dollars, except per share amounts and as otherwise indicated) Three and six months ended June 30, 2012 and 2011 (Unaudited)
36
12. Revenue
The Company sub-classifies revenue within the following components: license revenue, professional services revenue, hardware and other revenue, and maintenance and other recurring revenue. Software license revenue is comprised of license fees charged for the use of software products licensed under multiple-year or perpetual arrangements in which the fair value of maintenance and/or professional service fees are determinable. Professional service revenue consists of fees charged for implementation services, custom programming, product training and consulting. Hardware and other revenue includes the resale of third party hardware as part of customized solutions, as well as sales of hardware assembled internally. Maintenance and other recurring revenue primarily consists of fees charged for customer support on software products post-delivery and also includes recurring fees derived from combined software/support contracts, transaction revenues, and hosted products.
Revenues from the application of contract accounting are allocated to license revenue, professional service revenue and hardware revenue based on their relative fair values and the amount recognized in the period is determined using the percentage of completion method.
Advances from customers for which the related work has not started and billings in excess of costs incurred and recognized profits are recognized as deferred revenue.
2012 2011 2012 2011
License revenue 15,994$ 15,568$ 30,934$ 29,974$
Professional services revenue 45,935 47,616 88,062 89,405
Hardware and other revenue 22,351 28,717 47,706 51,104
Maintenance and other recurring revenue 124,689 103,198 237,545 202,248
Total 208,969$ 195,099$ 404,247$ 372,731$
Six months ended June 30,Three months ended June 30,

CONSTELLATION SOFTWARE INC. Notes to Condensed Consolidated Interim Financial Statements (In thousands of U.S. dollars, except per share amounts and as otherwise indicated) Three and six months ended June 30, 2012 and 2011 (Unaudited)
37
13. Finance income and finance costs
The Company enters into forward foreign exchange contracts from time to time with the objective of mitigating volatility in profit or loss in respect of financial liabilities. During the period, the Company purchased a contract of this nature with a value of $19 million and has recorded its fair value at June 30, 2012 based on foreign exchange rates relative to the stated rate in the contract. The fair value adjustment of $28 has been recorded in finance income in profit or loss. The contract was settled on July 3, 2012.
14. Earnings per share
Basic and diluted earnings per share
2012 2011 2012 2011
Gain on sale of available-for-sale financial (31)$ (2,836)$ (1,063)$ (3,170)$
assets transferred from other comprehensive
income
Gain on sale of intangible assets (321) - (321) -
Other interest income (42) (168) (79) (202)
Finance income (394)$ (3,004)$ (1,463)$ (3,372)$
Interest expense on bank indebtedness 489$ 1,646$ 706$ 2,454$
Amortization of debt related transaction costs 41 185 723 362
Other interest expense 244 135 363 311
Finance costs 774$ 1,966$ 1,792$ 3,127$
Six months ended June 30,Three months ended June 30,
2012 2011 2012 2011(Recast -
Note 2)(Recast -
Note 2)
Numerator:
Net income 17,592$ 55,986$ 31,516$ 118,474$
Denominator:
Basic and diluted shares outstanding 21,192 21,192 21,192 21,192
Earnings per share
Basic and diluted 0.83$ 2.64$ 1.49$ 5.59$
Three months ended June 30, Six months ended June 30,

CONSTELLATION SOFTWARE INC. Notes to Condensed Consolidated Interim Financial Statements (In thousands of U.S. dollars, except per share amounts and as otherwise indicated) Three and six months ended June 30, 2012 and 2011 (Unaudited)
38
15. Operating Segments
Segment information is presented in respect of the Company's business and geographical segments. The accounting policies of the segments are the same as those described in the significant accounting policies section of these consolidated financial statements.
Reportable segments
The Company has six operating segments, which have been aggregated into two reportable segments in accordance with IFRS 8 Operating Segments. The Company‘s Public Sector segment develops and distributes software solutions primarily to government and government-related customers. The Company‘s Private Sector segment develops and distributes software solutions primarily to commercial customers.
The determination that the Company has two reportable segments is based primarily on the assessment that differences in economic cycles and procedures for securing contracts between our governmental clients and commercial, or private sector clients, are significant, thus warranting distinct segmented disclosures.
Corporate head office operating expenses are allocated to the Company’s segments based on the segment’s percentage of total consolidated revenue for the allocation period.
Intercompany-expenses (income) represent Constellation head office management fees and intercompany interest charged to the reportable segments.

CONSTELLATION SOFTWARE INC. Notes to Condensed Consolidated Interim Financial Statements (In thousands of U.S. dollars, except per share amounts and as otherwise indicated) Three and six months ended June 30, 2012 and 2011 (Unaudited)
39
Three months ended June 30, 2012Public Sector
Private Sector Other
Consolidated Total
Revenue 147,722$ 61,247$ -$ 208,969$
Expenses
Staff 79,118 34,571 - 113,689
Hardware 8,478 2,227 - 10,705
Third party licenses, maintenance and professional services 9,728 4,987 - 14,715
Occupancy 3,539 1,500 - 5,039
Travel 6,029 1,737 - 7,766
Telecommunications 1,590 963 - 2,553
Supplies 2,837 1,029 - 3,866
Professional fees 1,608 614 - 2,222
Other 3,102 1,610 - 4,712
Depreciation 1,254 452 97 1,803
Amortization of intangible assets 14,050 6,219 - 20,269
131,333 55,909 97 187,339
Foreign exchange (gain) loss (128) (55) (34) (217)
Equity in net loss of equity investees - - 209 209
Finance income (338) (22) (34) (394)
Finance costs 39 164 571 774
(427) 87 712 372
Profit (loss) before income tax 16,816 5,251 (809) 21,258
Current income tax expense (recovery) 4,556 1,470 (660) 5,366
Deferred income tax expense (recovery) (1,061) (906) 267 (1,700)
Income tax expense (recovery) 3,495 564 (393) 3,666
Net income 13,321 4,687 (416) 17,592

CONSTELLATION SOFTWARE INC. Notes to Condensed Consolidated Interim Financial Statements (In thousands of U.S. dollars, except per share amounts and as otherwise indicated) Three and six months ended June 30, 2012 and 2011 (Unaudited)
40
Six months ended June 30, 2012
Public Sector
Private Sector Other
Consolidated Total
Revenue 285,954$ 118,293$ -$ 404,247$
Expenses
Staff 152,692 66,628 - 219,320
Hardware 19,015 3,917 - 22,932
Third party licenses, maintenance and professional services 19,047 9,914 - 28,961
Occupancy 6,732 2,932 - 9,664
Travel 12,436 3,576 - 16,012
Telecommunications 3,217 1,833 - 5,050
Supplies 5,492 1,806 - 7,298
Professional fees 2,770 1,297 - 4,067
Other 4,892 3,082 - 7,974
Depreciation 2,465 865 191 3,521
Amortization of intangible assets 27,640 11,904 - 39,544
256,398 107,754 191 364,343
Foreign exchange (gain) loss 694 451 (1,154) (9)
Equity in net loss of equity investees - - 1,091 1,091
Finance income (353) (41) (1,069) (1,463)
Finance costs 82 240 1,470 1,792
423 650 338 1,411
Profit (loss) before income tax 29,133 9,889 (529) 38,493
Current income tax expense (recovery) 8,199 3,263 (1,293) 10,169
Deferred income tax expense (recovery) (1,732) (2,025) 565 (3,192)
Income tax expense (recovery) 6,467 1,238 (728) 6,977
Net income 22,666 8,651 199 31,516

CONSTELLATION SOFTWARE INC. Notes to Condensed Consolidated Interim Financial Statements (In thousands of U.S. dollars, except per share amounts and as otherwise indicated) Three and six months ended June 30, 2012 and 2011 (Unaudited)
41
Three months ended June 30, 2011Public Sector
Private Sector Other
Consolidated Total
(Recast - Note 2)
Revenue 146,240$ 48,859$ -$ 195,099$
Expenses
Staff 72,364 28,323 - 100,687
Hardware 14,806 1,957 - 16,763
Third party licenses, maintenance and professional services 8,400 3,549 - 11,949
Occupancy 3,346 1,369 - 4,715
Travel 5,817 1,373 - 7,190
Telecommunications 1,571 773 - 2,344
Supplies 3,539 594 - 4,133
Professional fees 1,864 720 - 2,584
Other 1,922 1,050 - 2,972
Depreciation 1,510 446 - 1,956
Amortization of intangible assets 14,045 4,028 - 18,073
129,184 44,182 - 173,366
Foreign exchange (gain) loss 1,032 33 803 1,868
Finance income (108) (15) (2,881) (3,004)
Finance costs 44 39 1,883 1,966
968 57 (195) 830
Profit (loss) before income tax 16,088 4,620 195 20,903
Current income tax expense (recovery) 4,330 1,318 (179) 5,469
Deferred income tax expense (recovery) (20,768) (20,243) 459 (40,552)
Income tax expense (recovery) (16,438) (18,925) 280 (35,083)
Net income 32,526 23,545 (85) 55,986

CONSTELLATION SOFTWARE INC. Notes to Condensed Consolidated Interim Financial Statements (In thousands of U.S. dollars, except per share amounts and as otherwise indicated) Three and six months ended June 30, 2012 and 2011 (Unaudited)
42
Six months ended June 30, 2011Public Sector
Private Sector Other
Consolidated Total
(Recast - Note 2)
Revenue 277,190$ 95,541$ -$ 372,731$
Expenses
Staff 141,335 55,271 - 196,606
Hardware 25,288 3,596 - 28,884
Third party licenses, maintenance and professional services 17,265 7,347 - 24,612
Occupancy 6,621 2,682 - 9,303
Travel 10,739 2,719 - 13,458
Telecommunications 3,356 1,525 - 4,881
Supplies 7,040 1,256 - 8,296
Professional fees 3,432 1,288 - 4,720
Other 2,864 2,311 - 5,175
Depreciation 3,203 879 - 4,082
Amortization of intangible assets 27,855 8,743 - 36,598
248,998 87,617 - 336,615
Foreign exchange (gain) loss 1,668 1,204 1,061 3,933
Finance income (117) (34) (3,221) (3,372)
Finance costs 104 78 2,945 3,127
1,655 1,248 785 3,688
Profit (loss) before income tax 26,537 6,676 (785) 32,428
Current income tax expense (recovery) 7,160 2,072 (755) 8,477
Deferred income tax expense (recovery) (57,319) (37,183) (21) (94,523)
Income tax recovery (50,159) (35,111) (776) (86,046)
Net income 76,696 41,787 (9) 118,474
CONSTELLATION SOFTWARE INC. Notes to Condensed Consolidated Interim Financial Statements (In thousands of U.S. dollars, except per share amounts and as otherwise indicated) Three and six months ended June 30, 2012 and 2011 (Unaudited)
43
16. Contingencies
In the normal course of operations, the Company is subject to litigation and claims from time to time. The Company may also be subject to lawsuits, investigations and other claims, including environmental, labour, product, customer disputes and other matters. Management believes that adequate provisions have been recorded in the accounts where required. Although it is not always possible to estimate the extent of potential costs, if any, management believes that the ultimate resolution of such contingencies will not have a material adverse impact on the results of operations, financial position or liquidity of the Company.
On September 30, 2008, Constellation acquired certain assets and liabilities of Maximus Inc.’s Asset, Justice, and Education Solutions businesses ("MAJES"). As part of the acquisition, the Company also acquired certain long-term contracts that contain contingent liabilities which may, but are unlikely to, exceed $15 million in the aggregate. The contingent liabilities relate to liquidated damages contractually available to customers for breaches of contracts by MAJES and for estimated damages available to customers for breaches of such contracts by MAJES where such contracts did not contain specified penalties. The contingent liabilities represent the difference between the maximum financial liabilities potentially due to customers less the amounts accrued in connection with the contracts assumed on acquisition.
In February 2011, a subsidiary of Constellation and MAXIMUS Inc. (“Maximus”) received a letter from a customer initiating a dispute resolution process under the customer’s contract. The customer alleges that the subsidiary of Constellation and MAXIMUS failed to observe the most favoured customer pricing terms of the contract and also raised a number of issues pertaining to services and products delivered under the contract. The subsidiary of the Company, MAXIMUS and the customer have resolved the issues relating to the most favoured customer pricing terms of the contract without liability to the Company but continue to follow the dispute resolution process for the customer’s other allegations. The subsidiary of the Company and the seller of the MAJES assets continue to contest all of the customer’s claims. The potential liability is undefined with respect to the remainder of the claims made by the customer, however, the contract with the customer has a $9 million limitation of liability clause that the Company believes will apply to all of the claims should there be an unfavourable outcome to the Company.
On November 2, 2009, the Company acquired certain assets and liabilities of the Public Transit Solutions ("PTS") business of Continental Automotive AG. The Company also acquired contingent liabilities related to certain long-term contracts that may, but are unlikely to, exceed $2 million in the aggregate. The contingent liabilities relate to liquidated damages contractually available to customers for breaches of contracts by PTS. The contingent liabilities represent the difference between the maximum financial liabilities potentially due to customers less the estimated fair value amounts accrued in connection with the contracts assumed on acquisition.
In July 2012, a subsidiary of Constellation received a notice of reassessment for the 2004 taxation year from the Canadian tax authorities (“CRA”) which increased taxable income of the subsidiary by approximately $20 million relating to a gain on the sale of property between entities under common control. As a result of the notice of reassessment, the CRA has determined that the subsidiary owes approximately $6.2 million in federal tax and interest. In order to appeal the reassessment, the subsidiary is required to pay 50% of this amount within 90 days. The Company has yet to receive a provincial reassessment, but expects to receive such notice within the next 120 days. At this stage, the Company believes the proposed reassessment is without merit and intends to appeal the reassessment. The Company believes that it has adequately provided for the probable outcome in respect of this matter and as such no additional provision has been recorded in these financial statements during the quarter. There is no assurance, however, that the Company’s appeal will be successful and, if unsuccessful, the Company’s future financial results and tax provisions could be adversely affected.

CONSTELLATION SOFTWARE INC. Notes to Condensed Consolidated Interim Financial Statements (In thousands of U.S. dollars, except per share amounts and as otherwise indicated) Three and six months ended June 30, 2012 and 2011 (Unaudited)
44
17. Changes in non-cash operating working capital
18. Subsequent events
On August 1, 2012 the Company declared a $1.00 per share dividend that is payable on October 3, 2012 to all common shareholders of record at close of business on September 17, 2012.
2012 2011 2012 2011
Decrease (increase) in accounts receivable 2,215$ (3,657)$ 2,988$ (5,658)$
Increase in work in progress (548) (3,375) (3,283) (5,553)
Decrease (increase) in other current assets 949 (226) (1,132) 557
Increase in inventory (133) (817) (868) (2,690)
(Increase) decrease in long term assets (604) (945) 463 (1,695)
Change in acquired contract assets and liabilities (2,185) (5,089) (4,743) (12,026)
(Decrease) increase in other non-current liabilities (3,948) 34 (4,777) (83) Increase (decrease) in accounts payable and accrued liabilities
excluding holdbacks from acquisitions 9,582 (306) (28,364) (24,888)
(Decrease) increase in deferred revenue (14,839) (15,191) 6,651 9,088
Increase (decrease) in provisions 16 - (774) -
(9,495)$ (29,572)$ (33,839)$ (42,948)$
Three months ended
June 30,
Six months ended
June 30,