constellation energy q2 2008 earnings presentation 2008 second quarter
TRANSCRIPT

11
Constellation EnergyQ2 2008 Earnings Presentation
July 31, 2008
Kevin Hadlock:
Good morning everyone. I am Kevin Hadlock, Vice President of Investor Relations and Financial Planning & Analysis. Welcome to our second quarter 2008 earnings call. Thank you for being with us today.
Turning to slide 2…

22
22
Forward Looking Statements DisclosureCertain statements made in this presentation are forward-looking statements and may contain words such as “believes,”“anticipates,” “expects,” “intends,” “plans,” and other similar words. We also disclose non-historical information that represents management’s expectations, which are based on numerous assumptions. These statements are not guarantees of future performance and are subject to risks and uncertainties that could cause actual results to be materially different from projectedresults. These risks include, but are not limited to: the timing and extent of changes in commodity prices for energy including coal, natural gas, oil, electricity, nuclear fuel, freight and emissions allowances; the timing and extent of deregulation of, and competition in, the energy markets, and the rules and regulations adopted on a transitional basis in those markets; the conditions of the capital markets, interest rates, availability of credit, liquidity and general economic conditions, as well as Constellation Energy’s and BGE’sability to maintain their current credit ratings; the ability to attract and retain customers in our competitive supply activities and to adequately forecast their energy usage; the effectiveness of Constellation Energy’s and BGE’s risk management policies and procedures and the ability and willingness of our counterparties to satisfy their financial and other commitments; the liquidity and competitiveness of wholesale markets for energy commodities; uncertainties associated with estimating natural gas reserves, developing properties and extracting gas; operational factors affecting the operations of our generating facilities (including nuclear facilities) and BGE’s transmission and distribution facilities, including catastrophic weather-related damages, unscheduled outages or repairs, unanticipated changes in fuel costs or availability, unavailability of coal or gas transportation or electric transmission services, workforce issues, terrorism, liabilities associated with catastrophic events, and other events beyond our control; theinability of BGE to recover all its costs associated with providing customers service; the effect of weather and general economic and business conditions on energy supply, demand, and prices; regulatory or legislative developments that affect deregulation, transmission or distribution rates, demand for energy, or that would increase costs, including costs related to nuclear power plants, safety, or environmental compliance; the ability of our regulated and non-regulated businesses to comply with complex and/or changing market rules and regulations; the actual outcome of uncertainties associated with assumptions and estimates using judgment when applying critical accounting policies and preparing financial statements, including factors that are estimated in applying mark-to-market accounting, such as the ability to obtain market prices and in the absence of verifiable market prices, the appropriateness of models and model impacts (including, but not limited to, extreme contractual load obligations, unit availability, forward commodity prices, interest rates, correlation and volatility factors); changes in accounting principles or practices; losses on the sale or write-down of assets due to impairment events or changes in management intent with regard to either holding or selling certain assets; our ability to successfully identify and complete acquisitions and sales of businesses and assets; and cost and other effects of legal and administrative proceedings that may not be covered by insurance, including environmental liabilities. Giventhese uncertainties, you should not place undue reliance on these forward-looking statements. Please see our periodic reports filed with the SEC for more information on these factors. These forward-looking statements represent estimates and assumptions only as of the date of this presentation, and no duty is undertaken to update them to reflect new information, events or circumstances.
Before we begin our presentation, let me remind you that our comments today will include forward-looking statements, which are subject to certain risks and uncertainties.
For a complete discussion of these risks, we encourage you to read our documents on file with the SEC.
Our presentation today is being webcast, and the slides are available on our website, which you can access at www.constellation.com under Investor Relations.

33
33
Use of Non-GAAP Financial MeasuresConstellation Energy presents several non-GAAP financial measures in this presentation in addition to information in accordance with generally accepted accounting principles (GAAP) amounts. This includes measures such as adjusted earnings per share (adjusted EPS), Gross Margin, EBIT, EBITDA, Net Debt to Total Capital, Free Cash Flow, and Funds From Operations to Debt.
Constellation Energy provides its earnings and annual earnings guidance in terms of adjusted EPS. Adjusted EPS differs from reported GAAP EPS because it excludes the cumulative effects of changes in accounting principles, discontinued operations, special items (which we define as significant items that are not related to our ongoing, underlying business or which distort comparability of results) included in operations, the impact of certain economic, non-qualifying hedges, and synfuel earnings. The mark-to-market impact of economic non-qualifying hedges is significant to reported results, but economically neutral to the company in that offsetting gains or losses on underlying accrual positions will be recognized in the future. Synfuel earnings are excluded due to the potential for oil price volatility to result in a difficult-to-forecast phase-out of tax credits. We present adjusted EPS because we believe that it is appropriate for investors to consider results excluding these items in addition to our results in accordance with GAAP. We believe this measure provides a picture of our results that is comparable among periods since it excludes the impact of items such as workforce reduction costs or gains and losses on the sale of assets, which may recur occasionally, but tend to be irregular as to timing, thereby distorting comparisons between periods. However, investors should note that this non-GAAP measure involves judgment by management (in particular, judgment as to what is classified as a special item or an economic, non-qualifying hedge to be excluded from adjusted earnings). This non-GAAP measure is also used to evaluate management's performance and for compensation purposes. Constellation Energy is unable to reconcile its annual earnings guidance to GAAP earnings per share because we do not predict the future impact of special items, economic, non-qualifying hedges or synfuel earnings due to the difficulty of doing so. The impact of special items, economic, non-qualifying hedges, or synfuel earnings could be material to our operating results computed in accordance with GAAP.
We note that adjusted EPS and the other non-GAAP measures utilized by Constellation Energy are not in accordance with GAAP and should not be viewed as an alternative to GAAP information. A reconciliation of non-GAAP information to GAAP information is included either on the slide where the information appears or on one of the slides in the Non-GAAP Measures section provided at the end of the presentation, along with additional information on why and how Constellation Energy uses this information. Please see the Summary of Non-GAAP Measures included to find the appropriate GAAP reconciliation and its related slide(s). These slides are only intended to be reviewed in conjunction with the oral presentation to which they relate.
On slide 3, you will notice we will use Non-GAAP financial measures in this presentation to help you understand our operating performance.
We’ve attached an Appendix to the charts on the website reconcilingNon-GAAP measures to GAAP measures.
With that, I’d like to turn the time over to Mayo Shattuck, Chairman, President and CEO of Constellation Energy…

44
44
Q2 2008 Adjusted EPS Summary($ per share) Q2 2008 Q2 2007
GAAP Earnings $0.95 $0.64
Special Items 0.69 0.08
(Gain)/Loss on Economic Non-Qualifying Hedges 0.19 (0.01)
Synfuel Earnings (0.01) (0.07)
Adjusted Earnings (1) $1.82 $0.64
(1) Excludes special items, certain economic, non-qualifying hedges, and synfuel earningsSee Appendix
Thank you, Kevin.
Good morning everyone, and thank you for joining us today. For the second quarter of 2008, we recorded adjusted earnings of $1.82 per share, $1.18 above the adjusted 64 cents per share earned during the second quarter of last year. As we mentioned at our Annual Meeting of Shareholders, these results significantly exceeded our expectations, reflecting strong execution at each of our operating divisions, with particularly strong performance at our Global Commodities Group. We are also reaffirming earnings guidance for 2008 of $5.25 to $5.75 per share.
Now let’s turn to slide 5 for a review of the second quarter’s operational highlights…

5
55
Q2 2008 Operating Highlights• Continued excellent operating performance across the
nuclear fleet– Successfully completed the Ginna and Nine Mile Point Unit 2 nuclear
power plant refueling outages
– Very low forced outage rate across the nuclear fleet
• Expanded existing Generation fleet by 300 megawatts– Purchased the 200-megawatt West Valley gas-fired plant in Utah from
Iberdrola Renewables– Returned to service the 100-megawatt Gould Street Power Plant in
Baltimore
• Delivered strong Global Commodities new business results
• BGE Smart Energy Savers ProgramSM is moving forward– Peak RewardsSM, Energy Efficiency, and Advanced Metering
Infrastructure
Our nuclear generation fleet continued its excellent operating performance in the second quarter. We successfully completed the Ginna and Nine Mile Point Unit 2 nuclear refueling outages, while maintaining a very low forced outage rate across the nuclear fleet. We are proud of our three refueling outages that resulted in the first, third and 11th shortest durations out of the 42 units refueled in the first half of the year.
In addition, we expanded our existing fleet by 300 megawatts through the acquisition of the West Valley facility in Utah and the refurbishment of our Gould Street plant in Baltimore.
Our Global Commodities Group delivered strong new business results as rising commodities prices benefited our strategies in power, natural gas, and coal markets. We continued to execute our Invest – Develop – Harvest strategy with the sale of gas assets in Arkansas. With the purchase of Nufcor, we acquired specialized uranium capabilities and expanded our risk management services.
At BGE, our Smart Energy Savers program is moving forward with very successful results. Our Peak Rewards program launched earlier this summer, and we just began a pilot program of advanced metering and dynamic pricing. The PSC also authorized last year a limited number of energy efficiency programs, and we are now working towards approval of a broader portfolio of conservation initiatives. The combined potential of the programs, including smart thermostats, advanced meters, dynamic pricing and energy efficiency, is between 1500 and 1700 megawatts. To put that into context, our 2-unit Calvert Cliffs plant produces 1735 megawatts, so these plans are roughly equivalent to a large nuclear facility. The gains we can make with demand response are extraordinary; it represents one of the most encouraging developments for BGE customers and the energy sector overall.
Turning to slide 6…

6
6
90%
100%
110%
120%
130%
140%
150%
160%
170%
180%
190%
200%
210%
220%
230%
240%
250%
260%
1/2/
2008
1/17
/200
8
2/1/
2008
2/16
/200
8
3/2/
2008
3/17
/200
8
4/1/
2008
4/16
/200
8
5/1/
2008
5/16
/200
8
5/31
/200
8
6/15
/200
8
6/30
/200
8
Pric
e In
dex
(1/2
/200
8 =
100)
PJM 2009 Gas NYMEX 2009 Oil WTI 2009 Coal CSX 2009
Q1 2008 Q2 2008
6
Q2 2008 Market Overview
• Energy commodity prices continued to escalate in the second quarter• Second quarter market liquidity improved versus first quarter but remained below 2007 levels
As you can see from the chart on this slide, energy commodity prices in the second quarter escalated even faster than in the first quarter of this year. Through the second quarter, power in PJM has risen 33 percent in 2008, while coal has jumped an unprecedented 153 percent. Market liquidity appeared to improve in the second quarter, though activity remains well below 2007 levels.
As you’ve seen from our past performance, volatile markets typically result in success for our businesses. We started the quarter with a fundamentally bullish outlook on commodity prices and, as shown here, all energy commodity markets moved dramatically higher. As a merchant supplier, we are able to identify opportunities to serve customers, which provides the insight to acquire assets and deploy risk capital at the right time.
As I said at our annual shareholders meeting earlier this month, the effects of the current rising commodity cycle have been and will continue to be significantly exacerbated by a host of environmental and reliability issues. An investment in energy infrastructure is, almost by definition, an investment in the environment. We are, today, making more than a billion dollars of investment in Air Quality Control Systems for our coal plants in Maryland, while also investing in efficiency, conservation and demand response programs at BGE. We are finding commercial opportunities to meet the growing customer interest in solar and other renewable technologies. Meanwhile, there is intense pressure to hold down electric prices, despite the expectation that reserve margins should grow and be met only with cleaner resources.
Turning to slide 7…
7
7
New Nuclear Update• Timing for a build decision on a new unit at Calvert Cliffs has been pushed
into 2009• Dependent on several factors
– Timely and workable loan guarantees– Acceptable project economics
• State and regulatory reviews on track• Significant materials escalation is a key driver to higher project cost
estimates
June 30DOE issued solicitation
Jun Jul Aug Sep Oct Nov Dec
2008
December 19Part II Submissions Due
Beginning December 20, 2008DOE may approve selection of applicants for diligence, underwriting and negotiationSeptember 29
Part I Submissions Due
October 29Initial Rankings Issued
• Continue to pursue the option to build, recognizing there are many hurdles before a decision to move forward can be made
Department of Energy Program Milestones
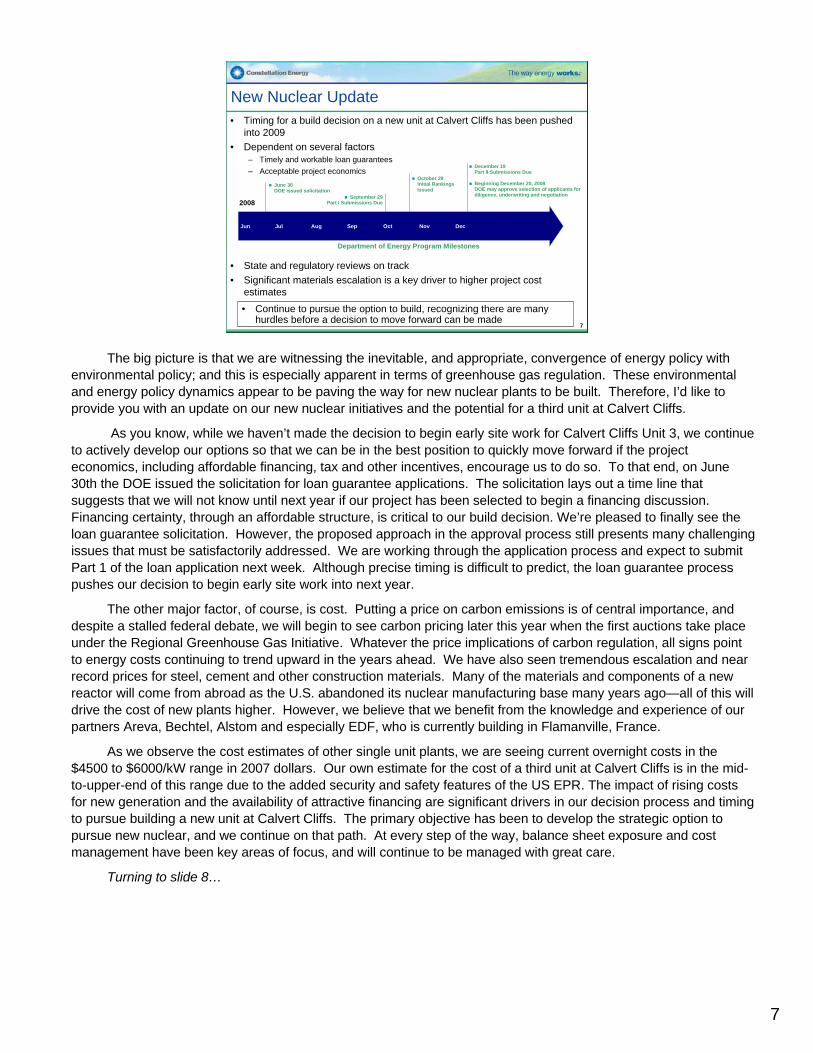
The big picture is that we are witnessing the inevitable, and appropriate, convergence of energy policy with environmental policy; and this is especially apparent in terms of greenhouse gas regulation. These environmental and energy policy dynamics appear to be paving the way for new nuclear plants to be built. Therefore, I’d like to provide you with an update on our new nuclear initiatives and the potential for a third unit at Calvert Cliffs.
As you know, while we haven’t made the decision to begin early site work for Calvert Cliffs Unit 3, we continue to actively develop our options so that we can be in the best position to quickly move forward if the project economics, including affordable financing, tax and other incentives, encourage us to do so. To that end, on June 30th the DOE issued the solicitation for loan guarantee applications. The solicitation lays out a time line that suggests that we will not know until next year if our project has been selected to begin a financing discussion. Financing certainty, through an affordable structure, is critical to our build decision. We’re pleased to finally see the loan guarantee solicitation. However, the proposed approach in the approval process still presents many challenging issues that must be satisfactorily addressed. We are working through the application process and expect to submit Part 1 of the loan application next week. Although precise timing is difficult to predict, the loan guarantee process pushes our decision to begin early site work into next year.
The other major factor, of course, is cost. Putting a price on carbon emissions is of central importance, and despite a stalled federal debate, we will begin to see carbon pricing later this year when the first auctions take place under the Regional Greenhouse Gas Initiative. Whatever the price implications of carbon regulation, all signs point to energy costs continuing to trend upward in the years ahead. We have also seen tremendous escalation and near record prices for steel, cement and other construction materials. Many of the materials and components of a new reactor will come from abroad as the U.S. abandoned its nuclear manufacturing base many years ago—all of this will drive the cost of new plants higher. However, we believe that we benefit from the knowledge and experience of our partners Areva, Bechtel, Alstom and especially EDF, who is currently building in Flamanville, France.
As we observe the cost estimates of other single unit plants, we are seeing current overnight costs in the $4500 to $6000/kW range in 2007 dollars. Our own estimate for the cost of a third unit at Calvert Cliffs is in the mid-to-upper-end of this range due to the added security and safety features of the US EPR. The impact of rising costs for new generation and the availability of attractive financing are significant drivers in our decision process and timing to pursue building a new unit at Calvert Cliffs. The primary objective has been to develop the strategic option to pursue new nuclear, and we continue on that path. At every step of the way, balance sheet exposure and cost management have been key areas of focus, and will continue to be managed with great care.
Turning to slide 8…

88
88
Earnings Outlook
• Reaffirming earnings guidance for 2008 of $5.25 to $5.75 per share• Forecasting 2009 EPS growth of 15% to 20% over 2008• Expect compound annual growth rate of greater than 10% over the next 5 years
$2.89
$3.61
15% - 20%
$5.25 - $5.75
$4.60
$2.50
$3.00
$3.50
$4.00
$4.50
$5.00
$5.50
$6.00
$6.50
2005 2006 2007 2008E 2009E
Compound Annual Earnings Growth of 20% - 24%
Adj
uste
d EP
S (1
)
($ per share)
(1) Adjusted for the effect of special items, certain economic, non-qualifying hedges, and synfuel earningsSee Appendix
In closing, I am especially pleased with the strong performance of the Company during the second quarter, and we are confident we can achieve our guidance range for 2008.
Therefore, we are reaffirming our 2008 earnings guidance of $5.25 to $5.75. For 2009 we continue to forecast earnings growth of 15 to 20 percent over 2008. Over the five-year planning horizon, we continue to project an average growth rate of greater than 10 percent.
With that, I’ll turn the presentation over to John to review the financial results.

9
Financial Overview John R. Collins
Executive Vice President and Chief Financial OfficerConstellation Energy
Thank you Mayo, and good morning everyone.
Let’s begin on slide 10…

10
10
Q2 2008 Adjusted EPS Summary
(0.01)0.19(Gain)/Loss on Economic Non-Qualifying Hedges(0.07)(0.01)Synfuel Earnings$0.64$1.82Adjusted Earnings Per Share (1)
0.080.69Special Items$0.64$0.95GAAP Earnings Per Share
Q2 2007Q2 2008($ per share)
(1) Excludes special items, certain economic, non-qualifying hedges, and synfuel earningsSee Appendix
184%$1.18$0.64$1.82Adjusted Earnings Per ShareNM(0.01)0.00(0.01)Other Non-regulated13%0.010.080.09BGE
211%$1.18$0.56$1.74Merchant%EPSQ2 2007Q2 2008($ per share)
ChangeAdjusted Earnings Per Share (1)
Second quarter GAAP earnings were 95 cents per share. After special items, adjusted earnings were $1.82 per share.
Let’s walk through the major adjustments to GAAP earnings:
• As expected, we recorded a negative 69 cent special item at BGE related to the $188 million customer credit that was accrued in April and will be applied to customer bills in September. The credit also causes a reduction in BGE’s full year effective tax rate, which impacts all four quarters. In addition to classifying the $188 million credit as a special item in the second quarter, the impact of the lower effective tax rate on normal earnings will be classified as a special item in each quarter.
• We had a 19 cent loss on economic, non-qualifying hedges. The loss in the second quarter was related primarily to gas transportation.
Looking at our segment performance in the second quarter compared to last year, Merchant was up $1.18, the Utility was up 1 cent, and Other Non-regulated was down a penny. Overall, adjusted earnings were up $1.18 per share. I will speak to the segment results in more detail on the next few slides.
Turning to slide 11…
11
11
$0.04 - $0.08$0.09Adjusted Earnings (1)
GuidanceActual
Q2 2008Adjusted Earnings vs. Guidance($ per share)
BGE
$0.01
Change
$0.08$0.09Adjusted Earnings (1)
Q2 2007Q2 2008
Adjusted Earnings vs. Prior Year($ per share)
(1) Excludes special itemsSee Appendix
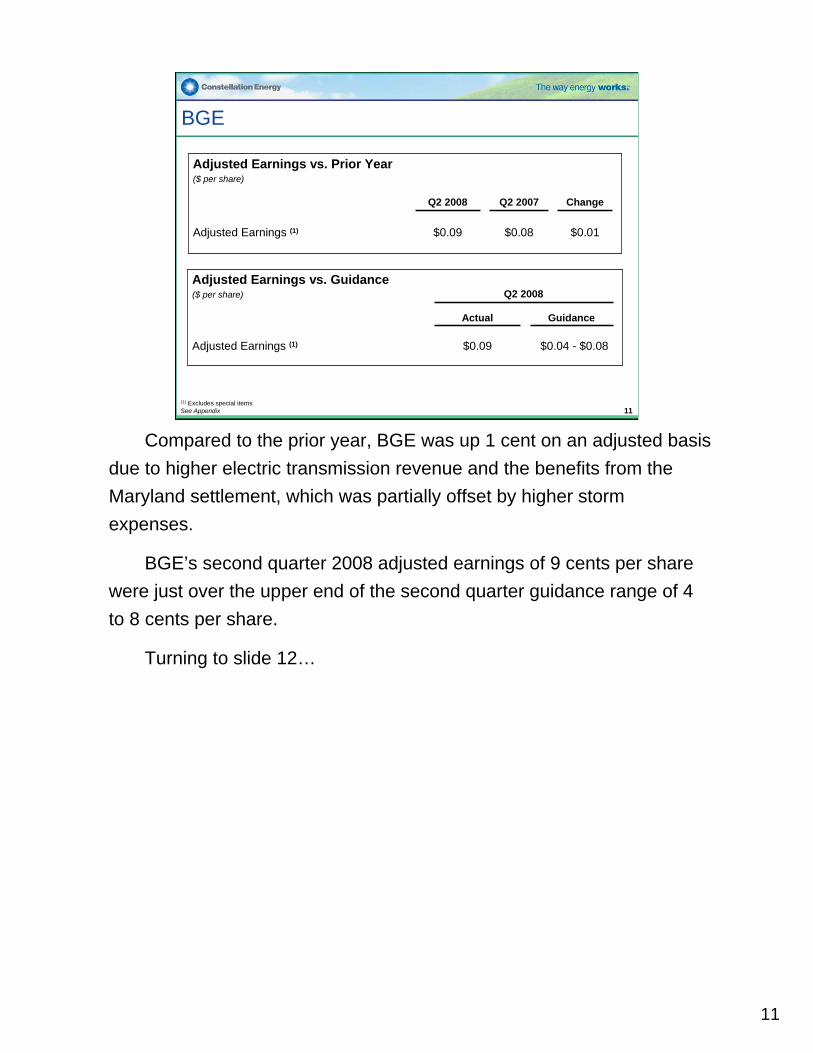
Compared to the prior year, BGE was up 1 cent on an adjusted basis due to higher electric transmission revenue and the benefits from the Maryland settlement, which was partially offset by higher storm expenses.
BGE’s second quarter 2008 adjusted earnings of 9 cents per share were just over the upper end of the second quarter guidance range of 4 to 8 cents per share.
Turning to slide 12…

12
12
Merchant
-$0.19 Generation+$1.20 Global Commodities Group+$0.14 Customer Supply Group+$0.03 Interest/Taxes/Other
Variance Primarily Due to:
$1.18$0.56$1.74Adjusted Earnings (1)
ChangeQ2 2007Q2 2008Adjusted Earnings vs. Prior Year($ per share)
(1) Excludes special items and certain economic, non-qualifying hedges and synfuel earnings(2) Excludes allocation of Corporate CostsSee Appendix
$257
$123
ActualQ2 2008
$177$130Generation Hedged EBITDA (2) ($ in millions)
NA$257Customer Supply Backlog ($ in millions)
ActualQ2 2007
GuidanceQ2 2008
Compared to the second quarter of last year, Merchant adjusted earnings were up $1.18 per share.
• On the positive side, Global Commodities was favorable $1.20, driven by strong new business results and an increased backlog realization compared to a relatively weak second quarter 2007, and
• Customer Supply was favorable 14 cents, primarily driven by favorable mark-to-market results in Retail Gas versus the second quarter of last year.
I will cover the drivers to Customer Supply and Global Commodities in a moment.
• Lastly, Generation was unfavorable 19 cents primarily driven by the differences in planned refeuling outages at our nuclear plants as compared to the same quarter last year, higher costs to improve fossil peaking unit reliability in response to PJM’sRPM capacity market, and unplanned outages at our Baltimore coal plants.
• Turning to slide 13…

13
13
Generation Earnings Outlook
2,0841,5911,3321,068Hedged EBITDA265170(65)(10)Change since Q1’08
(762)(1,494)(2,169)(2,074)Hedge Impact
2,8463,0853,5013,142Unhedged EBITDA(1,026)(979)(904)(872)O&M
3,8724,0644,4054,014Unhedged GM53525353Total Output (MM MWhs)
2011E2010E2009E2008E($ millions)
$0$500
$1,000$1,500$2,000$2,500$3,000$3,500$4,000
2008E 2009E 2010E 2011EEBITDA with hedges Unhedged EBITDA
$MM
Generation EBITDA, before and after hedge results
As of 6/30/08
This chart provides an update on how changes in market forward prices and hedging activity affect generation EBITDA. For 2008, we are forecasting unhedged EBITDA of $3.1 billion. Netting the hedging impacts of approximately $2.1 billion, our hedged EBITDA is forecast to be about $1.1 billion.
As Mayo mentioned, the Regional Greenhouse Gas Initiative takes effect January 1, 2009. This is earlier than we initially assumed and has the result of reducing our current hedged EBITDA forecast for 2009.
Over the last quarter, the power curve and forecasted coal prices have risen. We currently forecast unhedged EBITDA of $2.8 billion by 2011. This is $0.5 billion higher than what we shared with you in April.
Turning to slide 14…

14
14
$0.00
$0.05
$0.10
$0.15
$0.20
$0.25
$0.30
3Q06 4Q06 1Q07 2Q07 3Q07 4Q07 1Q08 2Q0850%
60%
70%
80%
90%
100%
Gross Margin/Dth Retention Rates
$0.00$1.00$2.00$3.00$4.00$5.00$6.00$7.00$8.00
4Q06 1Q07 2Q07 3Q07 4Q07 1Q08 2Q080%
20%
40%
60%
80%
100%
Electric Gross Margin Realized / MWh Retention Rates (inc. month-to-month)
Retention Rates (less month-to-month)
Customer Supply Gross Margin
(8%)
30%
Change
$800$737Full Year Plan
Changes in Business Measurement
$220$286Comparable Gross Margin Results
30Retail Power Adjustments
09Wholesale Variable Load Cost (2)
$217 (1)$277Gross Margin
20New Business
$257Already Originated Business
Q2 2007Q2 2008($ in millions)
(1) Due to Merchant realignment, Already Originated Business and New Business breakdowns are not available for Q2 2007(2) Recognized in Portfolio Management and Trading in prior periods(3) Does not include mark-to-market resultsSee Appendix
Retail GasRetail Power
Retention R
ate
Retention R
ate
Realized As Priced
Elec
tric
GM
/MW
h
Gas
GM
/Dth
(3)
As you see in the chart at the top of the slide, during the quarter, Customer Supply realized gross margin of $277 million. This was in line with our second quarter expectations. Year over year on a comparable basis, gross margin is up $66 million or 30 percent. The difference is primarily due to increased new business at Retail Gas.
The Retail Power retention rate, including the customers that remain on a month-to-month basis, increased to 76 percent, consistent with last year’s rate. Of the customers we retained, a significant portion remained on short term contracts due to the high price energy environment that persisted through the second quarter.
In the second quarter, as-priced margins were $2.49 per megawatt hour, down from the $3.01 level of the second quarter 2007 primarily reflecting increased competition, especially in Texas and New England. Additionally, our product mix in the second quarter was more weighted toward lower-margin products compared to the same period last year.
Retail Gas retention rates remained strong at 95 percent and realized margins improved by 10 cents over last year partially driven by our Midwest acquisition of Cornerstone Energy.
In summary, our customer supply businesses, wholesale power, retail power and retail gas, are on track to achieve their 2008 earnings targets.
Turning to slide 15…
15
15
Customer Supply: Backlog
(1) Adjusted backlog from prior presentations due to portfolio re-valuation(2) Renewal Gross Margin assumes a renewal rate of 68% for Retail Power and 94% for Retail Gas
Backlog(as of 6/30/08)
487
224
102
32
125
153
78
65
21
$0
$100
$200
$300
$400
$500
$600
$700
$800
2008 2009 2010
$ in
mill
ions
Backlog Renewal New Business (1) (2)
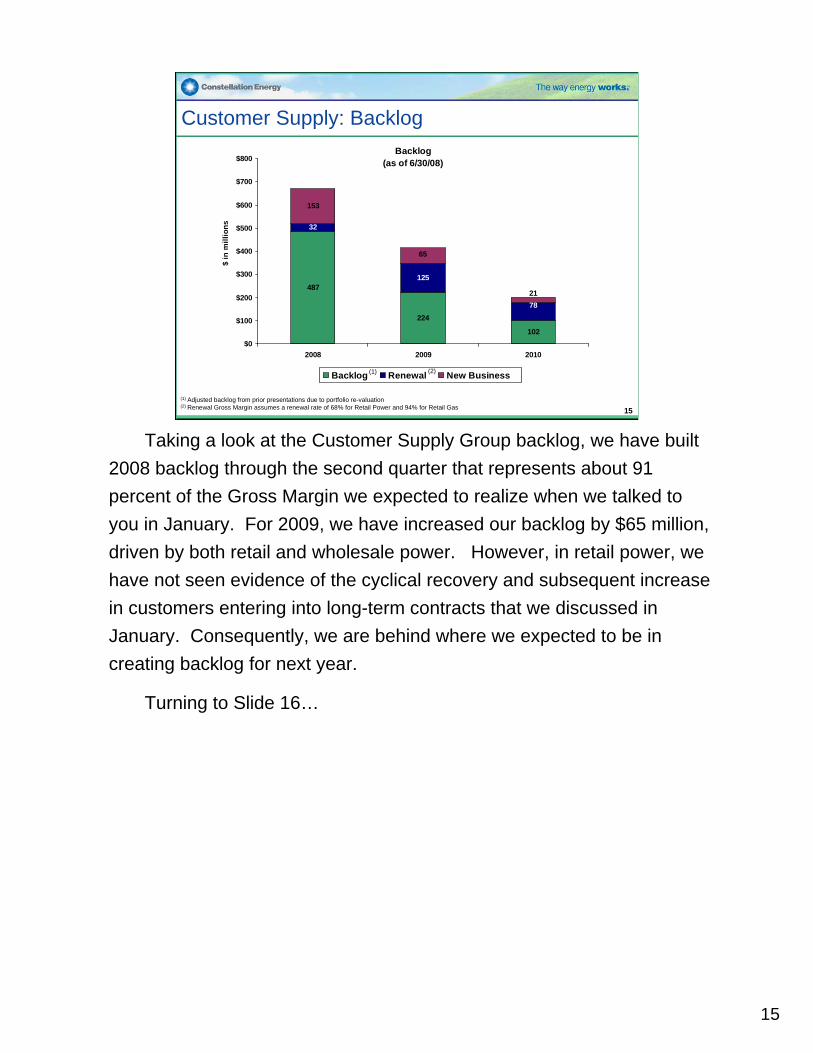
Taking a look at the Customer Supply Group backlog, we have built 2008 backlog through the second quarter that represents about 91percent of the Gross Margin we expected to realize when we talked to you in January. For 2009, we have increased our backlog by $65 million, driven by both retail and wholesale power. However, in retail power, we have not seen evidence of the cyclical recovery and subsequent increase in customers entering into long-term contracts that we discussed in January. Consequently, we are behind where we expected to be increating backlog for next year.
Turning to Slide 16…

16
16
Global Commodities
20072008100465New Business Realized YTD
NM38653439New Business Realized (2)
(1) Includes Structured Products gross margin originated in prior periods(2) Includes Structured Products, gas (non-project), and coal gross margin and gas project margin (project revenue less operating, depreciation,
depletion and interest expenses incurred at the project level). Excluding gas project-level expenses of $28 million in Q2 2008 and $21 million in Q2 2007, total Global Commodities gross margin in Q2 2008 and Q2 2007 was $514 million and $71 million, respectively.
See Appendix
NM43650486Total Contribution Margin (2)
NM50(3)47Already Originated Business (1)
%$Q2 2007Q2 2008
Change($ in millions)
Turning to the Global Commodities Group, as you can see in the column on the left, total contribution margin during the quarter was $486 million, including backlog of $47 million and $439 million of new business. Backlog realization in the second quarter was up $50 million versus the same period last year.
New business in the second quarter was $386 million higher versus last year’s second quarter, driven primarily by an increase in Portfolio Management and Trading of $346 million. As Mayo stated, we entered the second quarter bullish on energy commodities and certain price relationships among commodities and locations given what we observed in the first quarter. We benefited in our power, gas, and coal businesses from what turned out to be a rapidly rising market even while maintaining risk levels comparable to the first quarter. In addition, Energy Investments was up year over year driven by a $76 million gain on the sale of certain gas assets in Arkansas. As Mayo mentioned, this is the continued execution of our upstream gas strategy of “Invest-Develop-Harvest”.
Looking at the bottom portion of the chart you can see that we have generated $465 million of new business year-to-date. These results are driven by strong year over year performance in all three areas: Energy Investments, Structured Products and Portfolio Management and Trading.
Turning to slide 17…

17
17
Q2 Capital Markets Activity
• Executed capital markets transactions – Raised $700 million of debt and hybrid securities at CEG
– Issued $400 million of 5-year notes at BGE
• Increased credit facilities by $1.1 billion to support growing needs of the business
Achieved strong execution in volatile capital markets at attractive pricing
As we told you in January, we expected to be in the capital markets in 2008, and in the second quarter, we raised $1.1 billion of capital.
As previously discussed, our 2008 capital expenditure plan primarily consists of environmental projects, projects which improve plantreliability, investments in BGE’s infrastructure and conservation programs, and investments in strategic opportunities. Overall, 2008 capital spending is approximately $800 million higher than our 2007 capital expenditure program. Through the end of the second quarter, $1.2 billion has been spent of our $2.4 billion capital program. In addition to capital expenditures, BGE has $300 million of debt maturities this year, which we planned to refinance.
In June, we also added an additional $1.1 billion of credit facilities to support the continued growth of the business and to maintain an adequate liquidity position.
Now let’s turn to slide 18 to discuss liquidity…

18
18
Net Available Liquidity
Historical Net Available Liquidity
-
1.0
2.0
3.0
4.0
5.0
6.0
7.0
Dec-04
Mar-05
Jun-0
5
Sep-05
Dec-05
Mar-06
Jun-0
6
Sep-06
Dec-06
Mar-07
Jun-0
7
Sep-07
Dec-07
Mar-08
Jun-0
8
($ in
bill
ions
)
Net Available Liquidity Transitional Liquidity
At the end of June, the Company had $2.9 billion in net available liquidityNote: Transitional liquidity is made up of proceeds from the sale of assets, pre-funding of maturing debt and a special purpose credit facility
At the end of June, our net available liquidity was $2.9 billioncompared to $3.1 billion at the end of March. We have normalized our net available liquidity presented on this page to exclude certain transitional liquidity items that were not intended to support normal operations.
During the second quarter, we added an additional $1.1 billion in credit facilities to address the significant increase in energy commodity prices which resulted in the issuance of an additional $1.75 billion in letters of credit to support our risk management and hedging activities.
Turning to slide 19…

19
19
Q2 2008 Cash Flow
(156)(156)Total Acquisitions
(86)Common Stock Dividends Paid
193366125Depreciation & Amortization
(120)1230(350)Total Working Capital & Other
1102Net Debt Issuances/(Payments)
262318754Cash Flow from Operating Activities(2)
1710(108)279Net Income(1)
18Pension
(15)Other Financing
4Equity Issuances & Acquisition of Common Stock
(438)(9)(89)(358)Total Free Cash Flow
1006Cash Flow from Financing Activities(2)
153153Total Divestitures
(73)(73)Amortization of Acquired Contracts/Structured Deals
568Change in Net Cash Position
(700)(12)(276)(412)Cash Flow from Investing Activities(2)
(625)(12)(276)(337)Total Capital Expenditures
Q2 TotalOther Non-RegUtilityMerchant($ in millions)
(1) Includes special items (3) Includes $(212) million in restricted cash for BGE POLR contracts (2) Non-GAAP Note: numbers may not add due to rounding See Appendix Note: Company reclassed $28 million from operating activities into investing activities since July 31,2008
(3)
As in the first quarter, we are using the same format to report cash flow so that it is more closely aligned with our GAAP cash flow statement. Adjusted cash flow from operating activities was a positive $262 million during the second quarter. Adjusting for investing activities, free cash flow was a use of $438 million primarily driven by capital expenditures. Cash flow from financing activities, which primarily reflects the debt issuances during the quarter, was a positive $1 billion resulting in a change in net cash of $568 million in the second quarter.
Looking at each segment, Merchant generated approximately $450 million in cash flow from operations excluding changes in working capital. Increases in working capital were driven primarily by $400 million of additional initial margin requirements under new exchange rules.
Additionally, BGE generated $187 million of adjusted operating cash flow this quarter. While the BGE’s GAAP net income was negative, due to the one-time customer credit associated with the Maryland settlement, actual cash flows for the settlement will occur later this year.
Turning to slide 20…

20
20
Balance Sheet Metrics
42%
35%
$11.4
6.7
$0.3
$4.4
(1.2)
$5.6
Q2 2008
38%
36%
$10.4
6.2
$0.1
$4.1
(0.7)
$4.8
Q1 2008
36%Net Debt to Total Capital (2)
35%Adjusted Net Debt to Adjusted Total Capital (3)
$0.150% Hybrid & Preferred Securities
Capital
$3.8Net Debt
5.6Equity (1)
(1.1)Less: Cash
$9.5Total Capital
$4.9Total Debt
Debt
YE 2007($ in billions)
(1) Includes preferred stock and minority interest(2) Excludes BGE Rate Stabilization Securitization debt(3) Excludes BGE Rate Stabilization Securitization debt, AOCI balance related to cash flow hedges of commodity transactions and 3rd party cash collateralNote: numbers may not add due to roundingSee Appendix
We continue to maintain a strong balance sheet.
Total debt outstanding increased to $5.6 billion in the quarter,reflecting the new issuances previously noted. Price changes andhedging contract expirations running through our Accumulated Other Comprehensive Income again caused the majority of the increase in Equity. These changes caused the Net Debt to Total Capital metric to improve by roughly 100 basis points in the quarter. The Adjusted Net Debt to Adjusted Total Capital increased to 42 percent during the second quarter, due to an increase in third party collateral held and adjustments to equity from changes in Accumulated Other Comprehensive Income.
As you will recall, all of these metrics exclude the impact of the BGE Securitization debt.
Turning to slide 21…

21
21
Q3 2008 Outlook
NA
$310
$0.14
Actual Q3 2007
$113Customer Supply Backlog ($ in millions)
$437Generation Hedged EBITDA (1) ($ in millions)
$0.13 - $0.17BGE Earnings Per Share
Outlook Q3 2008E
See Appendix(1) Excludes allocation of Corporate Costs
Let me wrap up with a brief review of our third quarter outlook.
Consistent with the approach we introduced in January for the first quarter of 2008, we are providing a few key operating and financial metrics to help you understand our expectations for the third quarter.
First, we are providing a BGE earnings range of 13 cents to 17 cents per share. This compares to our third quarter 2007 earnings of 14 cents per share.
For Generation, we are providing a hedged EBITDA forecast of $437 million, which is $127 million higher than the hedged EBITDA of $310 million earned in the third quarter of 2007, driven mainly by the continued roll-off of below market hedges and higher capacity prices.
Customer Supply backlog is expected to be $113 million in the third quarter of 2008. Because we did not measure 2007 backlog in a manner comparable to today, we are not providing an estimate for the third quarter last year. However, as a point of reference, total realized customer supply gross margin in the third quarter of 2007 was $163 million.
To wrap up, we wanted to provide you some thoughts on our expected earnings pattern for the remainder of 2008. Today, we affirmed guidance of $5.25 to $5.75 per share for 2008. We expect roughly a third of the balance of the year earnings to occur in the third quarter and two-thirds to occur in the fourth.
That concludes my remarks. I will turn the call back over to Mayo for concluding comments and Q&A.

22
Thanks, John. Before we take your questions, I wanted to comment briefly on our business outlook and future investment for growth. Midway through the year, we are pleased that our overall operating performance. While we've experienced greater variability in our quarterly results, which was a major driver for our decision to discontinue quarterly guidance, we think our second quarter results speak to the strength of our operating model and our focus on execution. We remain very confident in our long-term outlook given market fundamentals that are supportive of the value of our underlying assets. This is particularly true in our generation business, which we see as a significant driver of shareholder value over the next several years.
While we are pleased with the overall operating performance of the company, we understand that the recent performance of our stock does not reflect the underlying value of our assets. While some of this is directly related to the tough economic and market environment, we believe that our current stock price significantly undervalues the company and we intend to take strategic steps to address this valuation gap. In addition to continuing to execute on our basic business plan, we are focused on two additional drivers of shareholder value. First, optimizing our business mix as it relates to our allocation of capital, and, second, driving long-term growth by continuing to make investments to grow our physical asset base.
Focusing on our current business mix, we are actively assessing the ongoing capital requirements of our global commodities business. In that regard, we are considering various strategic alternatives for our commodities business. These alternatives may involve various approaches, including possible partnership arrangements. We have had a very successful first half of the year, and our performance demonstrates the strength of our business model. As we look to the future, we will remain focused on maximizing shareholder value by executing in our plan, while optimizing our business mix and pursuing additional growth through investment in our physical asset base.
And now we would be pleased to answer your questions. As usual, we have the management team here to assist.

23
Additional Modeling Information

24
24
Merchant – Q2 2008 Income Statement
(1) Earnings Exclude special items, certain economic, non-qualifying hedges, and synfuel earnings(2) Includes other gross margin of ($1M) in Q2 2008 due to Merchant eliminationsNote: Numbers may not sum due to roundingSee Appendix
6%1(18)(17)Asset Retirement Obligation
623%44271513Global Commodities(2)
28%61217277Customer Supply
(4%)$(14)$379$365Generation
(7%)(5)(72)(77)Depreciation & Amortization
207%$211$102$313Net Income(184%)(118)(64)(182)Income Tax
198%329166495Pre-Tax Income(93%)(13)(14)(27)Net Interest Expense
190%342180522EBIT(30%)(148)(486)(633)Total Costs below Gross Margin
(15)
(128)
490
$
Change
NM
(32%)
74%
%
2(13)Other Revenue and Expenses
(398)(526)Operating & Maintenance
6661,156Gross Margin
Q2 2007(1)Q2 2008(1)($ in millions)

25
25
Q2 2008 Depreciation and Amortization
$193
4
17
30
$142
Total
$66
3
$63
Utility
$125
1
17
30
$77
Merchant
$3
$3
Other Non-Reg
Q2 2008 D&A (Slide 19)
Other
($ in millions)
Asset Retirement Obligation Liability
Synfuel Amortization Adjustment
Nuclear Fuel Amortization
Q2 2008 Depreciation & Amortization
(1) From Slide 23 – Merchant – Q2 2008 Income StatementNote: Numbers may not sum due to rounding
(1)

26
26
Generation Hedge Profile
• Hedge strategy has substantially reduced the fleet’s exposure to changes in energy prices• After-tax hedge impact (NPV) is $4.8 billion
2008E (1) 2009E 2010E
Power (2) + $1 per MWh, fuel unchanged
Fuel + $0.10 per MMBtu, power unchanged
--
Capacity + $10 per MW-day
+$1.5MM +$10.6MM
-- -$0.0MM -$0.5MM
-- +$1.5MM +$2.8MM
(1) Relatively minor residual 2008 position managed within Global Commodities Group portfolio(2) Sensitivities represent energy price changes at the relevant liquid hub only and do not capture the impact of potential changes in basis from the
hub to actual location of each individual power plantNote: Generation hedges through GCG, which may not hedge externally

27
27
Forward Market Prices (as of 6/30/2008)
201120102009
84.6087.1595.29PJM WHUB ($/MWh) (7 x 24)
70.8274.2482.74NY West Zone ($/MWh) (7 x 24)
134.00136.75139.13NYMEX Coal ($/Ton)
$10.75$11.22$12.46NYMEX Gas ($/MMBtu)

28
28
Sum-of-the-Parts Valuation
(3,647)Less: Merchant Net Debt
Utility
Merchant
14 – 16127Net IncomeBaltimore Gas & Electric
EBITDA
EBITDA
EBITDA
Earnings Metric
3.5 – 5 (4)567Global Commodities
4.5 – 6 (3)456Customer Supply
(4,800)(2)NPV of Remaining Hedges
$3,142
2008 Forecast($ in millions)
7x – 8x (1)
Comparable Multiple Range
Unhedged Generation Fleet
(1) Unhedged EBITDA multiple range for comparable merchant generators(2) Represents NPV of all Generation hedges for 2008 and forward(3) EBITDA multiple range for specialty insurers(4) EBITDA multiple range for merchant banks

29
29
Sum-of-the-Parts Valuation Comparables• Merchant Generators(1)
– Calpine Corp. (CPN)– Mirant Corp. (MIR)– NRG Energy Inc. (NRG)– Reliant Energy Inc. (RRI)
• Specialty Insurers– RLI Corp. (RLI)– Safeco Corp. (SAF)– WR Berkley Corp. (WRB)– White Mountains Insurance Group (WTM)
• Merchant Banks– Deutsche Bank AG (DB)– Goldman Sachs Group Inc. (GS)
• Regulated Utilities– Duke Energy Corp. (DUK) – Energen Corp. (EGN)– Nstar (NST)– PG&E Corp. (PCG)– Southern Co. (SO)
(1) Multiples calculated using unhedged EBITDA

30
30
Bank Facilities• CEG had $5.0 billion in committed bank facilities as of March 31, 2008
• During Q2, CEG increased total committed bank facilities to $6.13 billion
Committed Facilities ($ millions)
Dec 2009150n/aBilateral (new)
$ 6,130
400
$ 5,730
750
350
380
250
$ 3,850
Jun 2008
$ 5,000Total (CEG)Group (CEG)
Dec 2008 (renewed)500Bilateral
Sep 2013n/aBilateral (new)
Dec 2008n/aSyndicated (new)
$ 4,600Subtotal (CE)
Dec 2008250Bilateral
Dec 2011400SyndicatedUtility (BGE)
Jul 2012$ 3,850SyndicatedHoldCo (CE)
ExpirationMar 2008

31
Non-GAAP Reconciliations

32
32
Summary of Non-GAAP Measures
Slide(s) Where Used Slide Containing Non-GAAP Measure in Presentation Most Comparable GAAP Measure Reconciliation
Adjusted EPS Reported GAAP EPSQ208 Actual 4, 10, 11, 12 33Q207 Actual 4, 10, 11, 12 33EPS Guidance 8, 11, 21 33YTD 2007 Actual 8 34YTD 2006 Actual 8 34YTD 2005 Actual 8 34Q307 BGE Actual 21 35
Merchant Gross Margin 14, 16, 23 Income from Operations / Net Income 36, 37Merchant Below Gross Margin 23 36, 37
Free Cash Flow 19 Operating, Investing and Financing Cash Flow 38
Net Debt to Total Capital 20 Debt Divided by Total Capitalization 39

33
33
Adjusted EPS Q2 2008 and 2007We exclude special items and certain economic, non-qualifying fuel adjustment clause and gas transportation and storage hedges because we believe that it is appropriate for investors to consider results excluding these items, in addition to our results in accordance with GAAP. We have also adjusted earnings to exclude synfuel results due to the potential volatility and phase-out of the tax credits. We believe such a measure provides a picture of our results that is comparable among periods since it excludes the impact of items, which may recur occasionally, but tend to be irregular as to timing and magnitude, thereby distorting comparisons between periods. However, investors should note that this non-GAAP measure involves judgment by management (in particular, judgments as to what is or is not classified as a special item). We also use this measure to evaluate performance and for compensation purposes.
RECONCILIATION:Regulated Regulated Other
Merchant Electric Gas BGE Nonreg. Total
A B C D = (B+C) E F =(A+D+E)
2Q08 ACTUAL RESULTS:
Reported GAAP EPS 1.56$ (0.58)$ (0.02)$ (0.60)$ (0.01)$ 0.95$
Loss from Discontinued Operations - - - - - - GAAP MEASURES
1.56 (0.58) (0.02) (0.60) (0.01) 0.95
Special Items, Non-qualifying Hedges, and Synfuel Results Included in Operations:
Non-qualifying hedges (0.19) - - - - (0.19)
Synthetic fuel facility results 0.01 - - - - 0.01
Maryland Settlement - BGE Credit - (0.70) - (0.70) - (0.70)
Effective Tax Rate Impact - BGE Credit - 0.01 - 0.01 - 0.01
Total Special Items, Non-qualifying Hedges, and Synfuel Results (0.18) (0.69) - (0.69) - (0.87)
Adjusted EPS 1.74$ 0.11$ (0.02)$ 0.09$ (0.01)$ 1.82$ NON-GAAP MEASURE
2Q07 ACTUAL RESULTS:
Reported GAAP EPS 0.56$ 0.11$ (0.03)$ 0.08$ -$ 0.64$
Loss from Discontinued Operations - - - - - - GAAP MEASURES
0.56 0.11 (0.03) 0.08 - 0.64
Special Items, Non-qualifying Hedges, and Synfuel Results Included in Operations:
Non-qualifying hedges 0.01 - - - - 0.01
Workforce Reduction (0.01) - - - - (0.01)
Impairment (0.07) - - - - (0.07)
Synthetic fuel facility results 0.07 - - - - 0.07
Total Special Items, Non-qualifying Hedges, and Synfuel Results - - - - - -
Adjusted EPS 0.56$ 0.11$ (0.03)$ 0.08$ -$ 0.64$ NON-GAAP MEASURE
EARNINGS GUIDANCE Constellation Energy is unable to reconcile its earnings guidance excluding special items to GAAP earnings per share because we do not predict the future impact ofspecial items such as the cumulative effect of changes in accounting principles and the disposition of assets. See above reconciliation for actual Special Items.
EPS Before Discontinued Operations
EPS Before Discontinued Operations

34
34
Adjusted EPS YTD 2005, 2006 and 2007We exclude special items and certain economic, non-qualifying fuel adjustment clause and gas transportation and storage hedges because we believe that it is appropriate for investors to consider results excluding these items, in addition to our results in accordance with GAAP. We have also adjusted earnings to exclude synfuel results due to the potential volatility and phase-out of the tax credits. We believe such a measure provides a picture of our results that is comparable among periods since it excludes the impact of items, which may recur occasionally, but tend to be irregular as to timing and magnitude, thereby distorting comparisons between periods. However, investors should note that this non-GAAP measure involves judgment by management (in particular, judgments as to what is or is not classified as a special item). We also use this measure to evaluate performance and for compensation purposes.
R E C O N C IL IA T IO N :
2 0 0 7 2 0 0 6 2 0 0 5
T o ta l T o ta l T o ta l
A C T U A L R E S U L T S :
R e p o rte d G A A P E P S 4 .5 0$ 5 .1 6$ 3 .4 7$
In c o m e fro m D is c o n tin u e d O p e ra tio n s (0 .0 1 ) 1 .0 4 0 .5 3 G A A P M E A S U R E S
C u m u la tive E ffe c ts o f C h a n g e s in A c c o u n tin g P rin c ip le s - - (0 .0 4 )
4 .5 1 4 .1 2 2 .9 8
S p e c ia l Ite m s a n d N o n -q u a lify in g H e d g e s In c lu d e d in O p e ra tio n s :
G a in o n s a le o f g a s - fire d p la n ts (e x c lu d in g H ig h D e s e rt) - 0 .2 6 -
Im p a irm e n t lo s s e s a n d O th e r C o s ts (0 .0 7 ) - -
N o n -q u a lify in g H e d g e s 0 .0 1 0 .2 1 (0 .1 4 )
S yn th e tic fu e l fa c ility re s u lts (0 .0 2 ) 0 .1 6 0 .3 3
M e rg e r-re la te d co s ts - (0 .0 3 ) (0 .0 9 )
W o rk fo rc e re d u c tio n c o s ts (0 .0 1 ) (0 .0 9 ) (0 .0 1 )
T o ta l S p e c ia l Ite m s , N o n -q u a lify in g H e d g e s , a n d S yn fu e l R e s u lts (0 .0 9 ) 0 .5 1 0 .0 9
A d ju s te d E P S 4 .6 0$ 3 .6 1$ 2 .8 9$ N O N -G A A P M E A S U R E
E A R N IN G S G U ID A N C E C o n s te lla tio n E n e rg y is u n a b le to re c o n c ile its e a rn in g s g u id a n c e e x c lu d in g s p e c ia l ite m s to G A A P e a rn in g s p e r s h a re b e c a u s e w e d o n o t p re d ic t th e fu tu re im p a c t o f s p e c ia l ite m s s u c h a s th e c u m u la tive e ffe c t o f c h a n g e s in a c c o u n tin g p rin c ip le s a n d th e d is p o s itio n o f a s s e ts . S e e a b o ve re c o n c ilia tio n fo r a c tu a l S p e c ia l Ite m s .
E P S B e fo re D is c o n tin u e d O p e ra tio n s a n d C u m u la tiv e E ffe c ts o f C h a n g e s in A c c o u n tin g P rin c ip le s

35
35
Adjusted EPS BGE 3Q07 We exclude special items and certain economic, non-qualifying fuel adjustment clause and gas transportation and storage hedges because we believe that it is appropriate for investors to consider results excluding these items, in addition to our results in accordance with GAAP. We have also adjusted earnings to exclude synfuel results due to the potential volatility and phase-out of the tax credits. We believe such a measure provides a picture of our results that is comparable among periods since it excludes the impact of items, which may recur occasionally, but tend to be irregular as to timing and magnitude, thereby distorting comparisons between periods. However, investors should note that this non-GAAP measure involves judgment by management (in particular, judgments as to what is or is not classified as a special item). We also use this measure to evaluate performance and for compensation purposes.
RECONCILIATION:Regulated Regulated
Electric Gas BGE
A B C = (A+B)
3Q07 ACTUAL RESULTS: 0.19$ (0.05)$ 0.14$
Reported GAAP EPS - - - GAAP MEASURES
Loss from Discontinued Operations 0.19 (0.05) 0.14
Special Items, Non-qualifying Hedges, and Synfuel Results Included - - -
Non-qualifying hedges - - -
Synthetic fuel facility results - - -
Total Special Items, Non-qualifying Hedges, and Synfuel Results 0.19$ (0.05)$ 0.14$ NON-GAAP MEASURE
Adjusted EPS
EPS Before Discontinued Operations
36
36
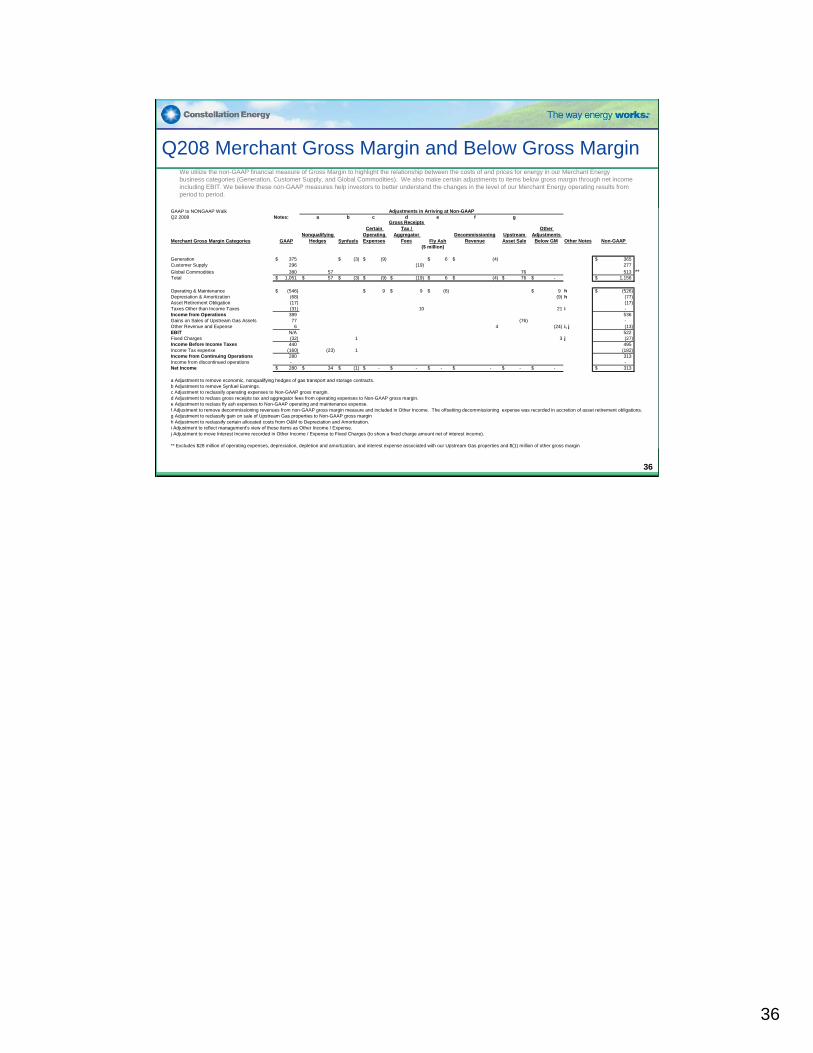
Q208 Merchant Gross Margin and Below Gross MarginWe utilize the non-GAAP financial measure of Gross Margin to highlight the relationship between the costs of and prices for energy in our Merchant Energy business categories (Generation, Customer Supply, and Global Commodities). We also make certain adjustments to items below gross margin through net income including EBIT. We believe these non-GAAP measures help investors to better understand the changes in the level of our Merchant Energy operating results from period to period.
GAAP to NONGAAP WalkQ2 2008 Notes: a b c d e f g
Merchant Gross Margin Categories GAAPNonqualifying
Hedges Synfuels
Certain Operating Expenses
Gross Receipts Tax /
Aggregator Fees Fly Ash
DecommissioningRevenue
Upstream Asset Sale
Other Adjustments
Below GM Other Notes Non-GAAP
Generation 375$ (3)$ (9)$ 6$ (4)$ 365$ Customer Supply 296 (19) 277 Global Commodities 380 57 76 513 **Total 1,051$ 57$ (3)$ (9)$ (19)$ 6$ (4)$ 76$ -$ 1,156$
Operating & Maintenance (546)$ 9$ 9$ (6)$ 9$ h (526)$ Depreciation & Amortization (68) (9) h (77) Asset Retirement Obligation (17) (17) Taxes Other than Income Taxes (31) 10 21 i - Income from Operations 389 536 Gains on Sales of Upstream Gas Assets 77 (76) - Other Revenue and Expense 6 4 (24) i, j (13) EBIT N/A 522 Fixed Charges (32) 1 3 j (27) Income Before Income Taxes 440 495 Income Tax expense (160) (23) 1 (182) Income from Continuing Operations 280 313 Income from discontinued operations - - Net Income 280$ 34$ (1)$ -$ -$ -$ -$ -$ -$ 313$
a Adjustment to remove economic, nonqualifying hedges of gas transport and storage contracts.b Adjustment to remove Synfuel Earnings.c Adjustment to reclassify operating expenses to Non-GAAP gross margin.d Adjustment to reclass gross receipts tax and aggregator fees from operating expenses to Non-GAAP gross margin.e Adjustment to reclass fly ash expenses to Non-GAAP operating and maintenance expense.f Adjustment to remove decommissioning revenues from non-GAAP gross margin measure and included in Other Income. The offsetting decommissioning expense was recorded in accretion of asset retirement obligations.g Adjustment to reclassify gain on sale of Upstream Gas properties to Non-GAAP gross marginh Adjustment to reclassify certain allocated costs from O&M to Depreciation and Amortization.i Adjustment to reflect management's view of these items as Other Income / Expense. j Adjustment to move Interest Income recorded in Other Income / Expense to Fixed Charges (to show a fixed charge amount net of interest income).
** Excludes $28 million of operating expenses, depreciation, depletion and amortization, and interest expense associated with our Upstream Gas properties and $(1) million of other gross margin
Adjustments in Arriving at Non-GAAP
($ million)

37
37
Q207 Merchant Gross Margin and Below Gross MarginWe utilize the non-GAAP financial measure of Gross Margin to highlight the relationship between the costs of and prices for energy in our Merchant Energy business categories (Generation, Customer Supply, and Global Commodities). We also make certain adjustments to items below gross margin through net income including EBIT. We believe these non-GAAP measures help investors to better understand the changes in the level of our Merchant Energy operating results from period to period.
GAAP to NONGAAP WalkQ2 2007 Notes: a b c d e f g h
Merchant Gross Margin Categories GAAPNonqualifying
Hedges Synfuels
Certain Operating Expenses
Gross Receipts Tax /
Aggregator Fees Fly Ash
DecommissioningRevenue
Gain on Initial Public Offering of
CEP
Special Items and
TaxesAdjustments
Below GMOther Notes Non-GAAP
Generation 385$ 6$ (11)$ 3$ (4)$ 379$ Customer Supply 238 (3) (18) 217 Global Commodities 48 1 9 13 71 **Total 671$ (2)$ 15$ (11)$ (18)$ 3$ (4)$ 13$ -$ 666$
Operating & Maintenance (432)$ 5$ 11$ 9$ (3)$ 12$ i (398)$ Depreciation & Amortization (68) 8 (12) i (72) Asset Retirement Obligation (18) (18) Impairment Loss (20) 20 - Workforce Reduction (2) 2 - Taxes Other than Income Taxes (29) 9 20 j - Income from Operations 102 178 Gain on initial Public Offering of CEP LLC 13 (13) - Other Revenue and Expense 22 4 (24) j, k 2 EBIT N/A 180 Fixed Charges (20) 2 4 k (14) Income Before Income Taxes 117 166 Income Tax expense (15) 1 (42) (8) (64) Income from Continuing Operations 102 102 Income from discontinued operations - - Net Income 102$ (1)$ (12)$ -$ -$ -$ -$ -$ 14$ -$ 102$
a Adjustment to remove economic, nonqualifying hedges of gas transport and storage contracts.b Adjustment to remove Synfuel Earnings.c Adjustment to move operating expenses to Non-GAAP gross margin.d Adjustment to reclass gross receipts tax from operating expenses to gross margin.e Adjustment to reclass fly ash expenses to Non-GAAP operating and maintenance expense.f Adjustment to remove decommissioning revenues from non-GAAP gross margin measure and included in Other Income. The offsetting decommissioning expense was recorded in accretion of asset retirement obligations.g Adjustment to move gain on sale of stock by CEP to gross margin to reflect management's view of this activity as part of operationsh Adjustment to remove Special Items and related tax benefit which are not included in determining Merchant Below Gross Margin.i Adjustment to reclassify certain allocated costs from O&M to Depreciation and Amortization.j Adjustment to reflect management's view of these items as Other Income / Expense. k Adjustment to move Interest Income recorded in Other Income / Expense to Fixed Charges (to show a fixed charge amount net of interest income).
** Excludes $21 million of operating expenses, depreciation, depletion and amortization, and interest expense associated with our Upstream Gas properties
($ million)
Adjustments in Arriving at Non-GAAP

38
38
Cash Flows – Q2 2008 - RevisedThe following is a reconciliation of the non-GAAP financial measures of Net Cash Flow before Debt Issuances/Payments and Free Cash Flow. We utilize these non-GAAP measures because we believe they are helpful in understanding our ability to reduce debt by existing cash.
RECONCILIATION:
QTD JUNE ACTUAL RESULTS:Net cash provided by operating activities (GAAP measure) 188 Adjustment for derivative contracts presented as financing activities under SFAS 149 (1) Adjusted Net Cash Provided by Operating Activities 187$ NON-GAAP MEASURE
Net cash used in investing activities (GAAP measure) (627)
Net Cash Used in Financing Activities (Excl. Debt-Related Sources & Uses) *Common stock dividends paid (86) Proceeds from issuance of common stock 4 Other financing activities, excluding SFAS 149 activities included in operating 2 Adjusted Net Cash Used in Financing Activities (80)
Net Cash Flow before Debt Issuances/(Payments) (520) NON-GAAP MEASURE
Less: Proceeds from issuance of common stock (4) Add: Common stock dividends paid 86
Free Cash Flow (438)$ NON-GAAP MEASURE
* Total GAAP Cash Provided by Financing Activities (incl. debt-related sources & uses) was $1,007 million QTD June 08.
PROJECTED CASH FLOWS:Constellation Energy is unable to provide a reconciliation of these measures for Projected 2008 because it does not prepare a forecasted statement of cash flows on a GAAP basis.
Q2 2008($ millions)

39
39
Net Debt to Total Capital Debt to Total Capital is a non-GAAP ratio that excludes unamortized discounts and premiums, reduces debt by our cash balance, and includes minority interests in equity. In addition, we reflect a 50 percent equity credit for our trust preferred securities and remove the non-economic impact commodity hedges and cash collateral held, similar to the evaluation performed by major credit rating agencies. Management believes this non-GAAP measures provide investors useful information on our leverage because it is consistent with the evaluation performed by rating agencies, takes into account minority equity interests in our consolidated affiliates and cash available to reduce debt, and facilitates comparability between periods.
RECONCILIATION:
Total long-term debt (gross of current portion) 5,626.3$ 5,626.3$ 4,666.6$ 4,666.6$ 4,788.2$ 4,788.2$
Fair value decrease (increase) in fixed to floating rate swap included in long-term debt (13.2) (38.6) (11.8) 6.20% deferrable interest subordinated debentures due
October 15, 2043 to BGE wholly owned BGE Capital Trust II relating to trust originated preferred securities 257.7 257.7 257.7 257.7 257.7 257.7
50% Equity credit to trust preferred securities (125.0) (125.0) - (125.0) 50% Equity credit for 60-year hybrid debt securities (225.0) Short-term borrowings 145.7 145.7 14.0 14.0 Unamortized discount and premium (4.7) (4.8) (4.8) - Subtotal 6,025.0 5,666.5 4,919.5 4,760.7 5,055.1 4,923.1 LESS: Cash 1,230.7 662.6 - 1,095.9 Total Net Debt 6,025.0 4,435.8 4,919.5 4,098.1 5,055.1 3,827.2 Rate stabilzation securitization bonds of BGE (590.0) (623.2) (623.2) Net Debt for Debt to Capital Ratio 6,025.0 3,845.8 35.4% 4,919.5 3,474.9 35.8% 5,055.1 3,204.0 36.1%
BGE Preference Stock Not Subject To Mandatory Redemption 190.0 190.0 190.0 190.0 190.0 190.0 Minority Interests 20.1 19.9 - 19.2 Common shareholders' equity 6,451.1 5,906.0 5,906.0 5,340.2 5,340.2 Subtotal 190.0 6,661.2 6,096.0 6,115.9 5,530.2 5,549.4 50% Equity credit to trust preferred securities 125.0 125.0 - 125.0 50% Equity credit for 60-year hybrid debt securities 225.0 Total Equity 190.0 7,011.2 64.6% 6,096.0 6,240.9 64.2% 5,530.2 5,674.4 63.9%Total Capitalization 6,215.0 11,447.0 11,015.5 10,339.0 10,585.3 9,501.6 Rate stabilzation securitization bonds of BGE (590.0) (623.2) (623.2) Total capitalization for Debt to Capital Ratio 6,215.0$ 10,857.0$ 100.0% 11,015.5$ 9,715.8$ 100.0% 10,585.3$ 8,878.4$ 100.0%
Exclude commodity hedge AOCI Balance from common shareholders' equity and rate stabilization bonds (18) 397 940 Counterparty cash collateral held reflected as a reduction of cash balance and rate stabilzation bonds (1,313) (562) (270) Adjusted Net Debt to Total Capital 42.5% 37.9% 34.5%
June 30, 2008
GAAP Balances Non-GAAP Ratio
March 31, 2008
GAAP Balances Non-GAAP Ratio
December 31, 2007
GAAP Balances Non-GAAP Ratio