conspicuity index– which sign is more visible? measuring the visibilityof traffic signs through...
DESCRIPTION
Thomas Porathe & Lennart Strand*This was a hand note at Information Visualization course at Chalmers University of TechnologyTRANSCRIPT
ORIGINAL PAPER
Which sign is more visible? Measuring the visibilityof traffic signs through the conspicuity index method
Thomas Porathe & Lennart Strand
Received: 8 July 2010 /Accepted: 4 April 2011 /Published online: 7 May 2011# The Author(s) 2011. This article is published with open access at SpringerLink.com
AbstractPurpose A new method of measuring visibility takingcontext into account introduced by Alexander Wertheimhas been validated in this study. The purpose was to see if asimple and practical technique could render robust anduseful quantitatively measurable results.Methods An ordinary traffic sign, placed against differentbackgrounds, was used as a target. Subjects were told tofixate the sign and then slowly deviate with their gaze untilthey could no longer see the sign in the corner of their eye.This angle was then used as an index for conspicuity. Asimple paper and pen method was tested as well as acomputer based method.Results Results for the paper and pen method showed lowvariance among subjects and a clear correlation between theconspicuity index and intuitive judgments of the visibilityof the signs against different backgrounds. For thecomputer based method the variability was higher but theresults still significant between the two groups of dynamicversus static signs.Conclusions The conclusion is that the conspicuity indexmethod is a simple and useful method that rendersquantitative measurements of the visibility of targets takencontext into account.
Keywords Conspicuity . Visibility . Information design .
Traffic signs
1 Introduction
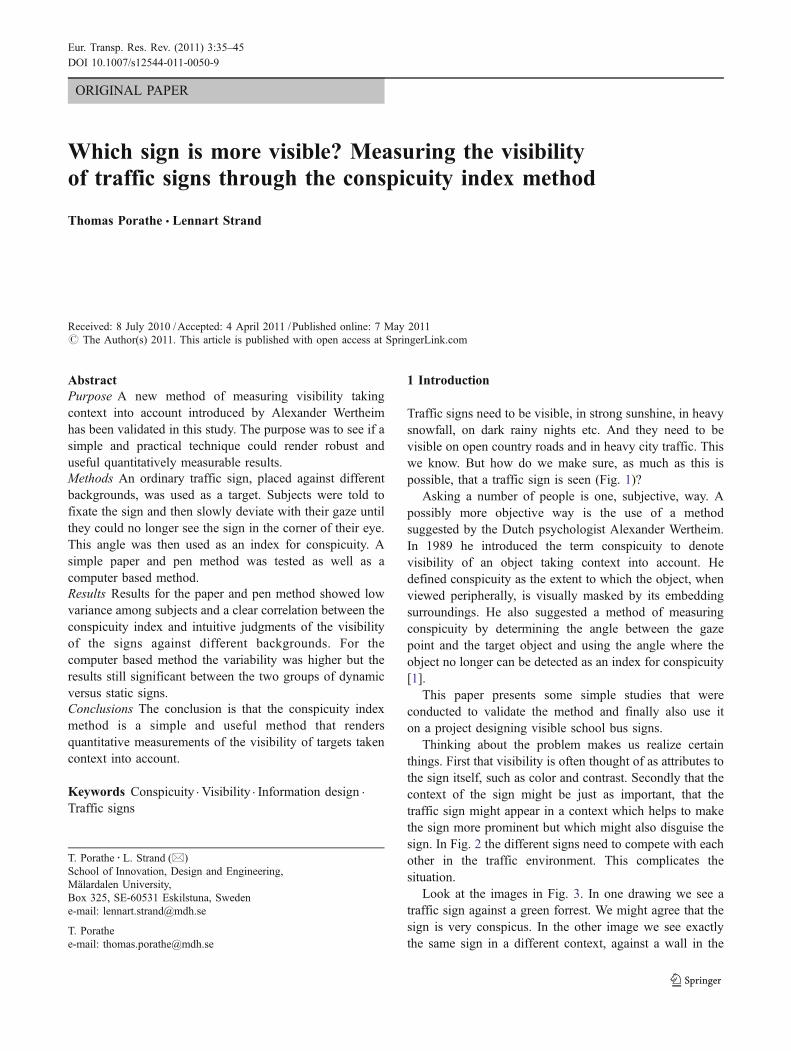
Traffic signs need to be visible, in strong sunshine, in heavysnowfall, on dark rainy nights etc. And they need to bevisible on open country roads and in heavy city traffic. Thiswe know. But how do we make sure, as much as this ispossible, that a traffic sign is seen (Fig. 1)?
Asking a number of people is one, subjective, way. Apossibly more objective way is the use of a methodsuggested by the Dutch psychologist Alexander Wertheim.In 1989 he introduced the term conspicuity to denotevisibility of an object taking context into account. Hedefined conspicuity as the extent to which the object, whenviewed peripherally, is visually masked by its embeddingsurroundings. He also suggested a method of measuringconspicuity by determining the angle between the gazepoint and the target object and using the angle where theobject no longer can be detected as an index for conspicuity[1].
This paper presents some simple studies that wereconducted to validate the method and finally also use iton a project designing visible school bus signs.
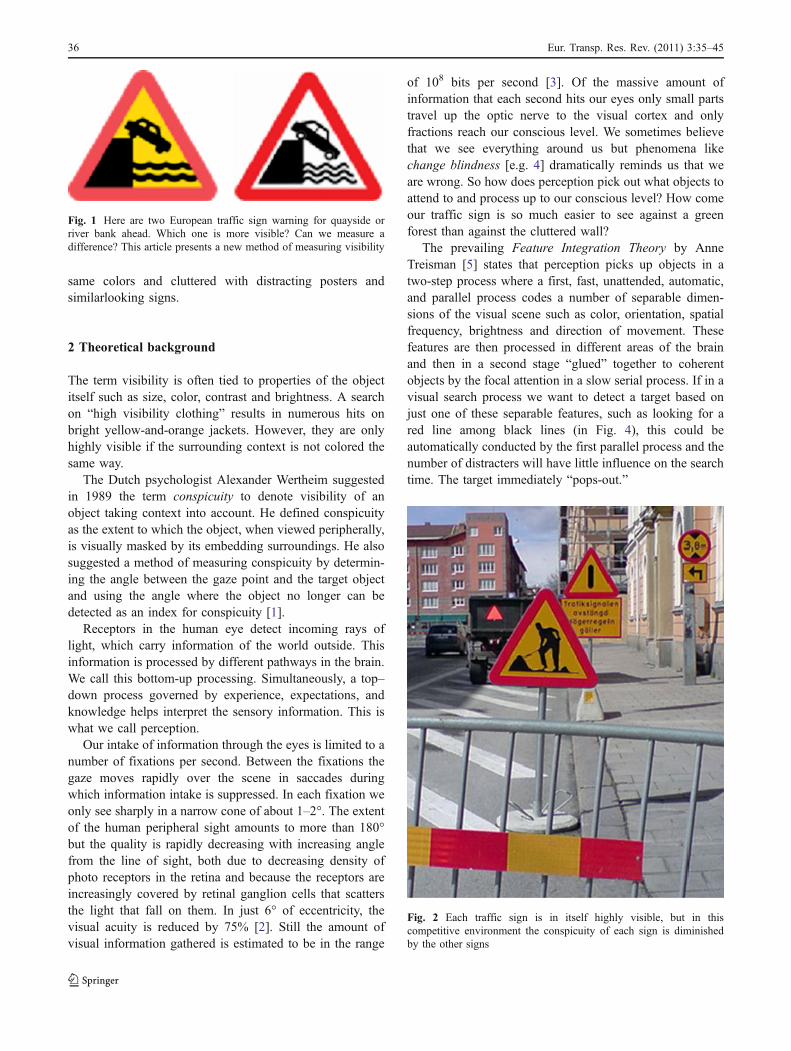
Thinking about the problem makes us realize certainthings. First that visibility is often thought of as attributes tothe sign itself, such as color and contrast. Secondly that thecontext of the sign might be just as important, that thetraffic sign might appear in a context which helps to makethe sign more prominent but which might also disguise thesign. In Fig. 2 the different signs need to compete with eachother in the traffic environment. This complicates thesituation.
Look at the images in Fig. 3. In one drawing we see atraffic sign against a green forrest. We might agree that thesign is very conspicus. In the other image we see exactlythe same sign in a different context, against a wall in the
T. Porathe : L. Strand (*)School of Innovation, Design and Engineering,Mälardalen University,Box 325, SE-60531 Eskilstuna, Swedene-mail: [email protected]
T. Porathee-mail: [email protected]
Eur. Transp. Res. Rev. (2011) 3:35–45DOI 10.1007/s12544-011-0050-9
same colors and cluttered with distracting posters andsimilarlooking signs.
2 Theoretical background
The term visibility is often tied to properties of the objectitself such as size, color, contrast and brightness. A searchon “high visibility clothing” results in numerous hits onbright yellow-and-orange jackets. However, they are onlyhighly visible if the surrounding context is not colored thesame way.
The Dutch psychologist Alexander Wertheim suggestedin 1989 the term conspicuity to denote visibility of anobject taking context into account. He defined conspicuityas the extent to which the object, when viewed peripherally,is visually masked by its embedding surroundings. He alsosuggested a method of measuring conspicuity by determin-ing the angle between the gaze point and the target objectand using the angle where the object no longer can bedetected as an index for conspicuity [1].
Receptors in the human eye detect incoming rays oflight, which carry information of the world outside. Thisinformation is processed by different pathways in the brain.We call this bottom-up processing. Simultaneously, a top–down process governed by experience, expectations, andknowledge helps interpret the sensory information. This iswhat we call perception.
Our intake of information through the eyes is limited to anumber of fixations per second. Between the fixations thegaze moves rapidly over the scene in saccades duringwhich information intake is suppressed. In each fixation weonly see sharply in a narrow cone of about 1–2°. The extentof the human peripheral sight amounts to more than 180°but the quality is rapidly decreasing with increasing anglefrom the line of sight, both due to decreasing density ofphoto receptors in the retina and because the receptors areincreasingly covered by retinal ganglion cells that scattersthe light that fall on them. In just 6° of eccentricity, thevisual acuity is reduced by 75% [2]. Still the amount ofvisual information gathered is estimated to be in the range
of 108 bits per second [3]. Of the massive amount ofinformation that each second hits our eyes only small partstravel up the optic nerve to the visual cortex and onlyfractions reach our conscious level. We sometimes believethat we see everything around us but phenomena likechange blindness [e.g. 4] dramatically reminds us that weare wrong. So how does perception pick out what objects toattend to and process up to our conscious level? How comeour traffic sign is so much easier to see against a greenforest than against the cluttered wall?
The prevailing Feature Integration Theory by AnneTreisman [5] states that perception picks up objects in atwo-step process where a first, fast, unattended, automatic,and parallel process codes a number of separable dimen-sions of the visual scene such as color, orientation, spatialfrequency, brightness and direction of movement. Thesefeatures are then processed in different areas of the brainand then in a second stage “glued” together to coherentobjects by the focal attention in a slow serial process. If in avisual search process we want to detect a target based onjust one of these separable features, such as looking for ared line among black lines (in Fig. 4), this could beautomatically conducted by the first parallel process and thenumber of distracters will have little influence on the searchtime. The target immediately “pops-out.”
Fig. 2 Each traffic sign is in itself highly visible, but in thiscompetitive environment the conspicuity of each sign is diminishedby the other signs
Fig. 1 Here are two European traffic sign warning for quayside orriver bank ahead. Which one is more visible? Can we measure adifference? This article presents a new method of measuring visibility
36 Eur. Transp. Res. Rev. (2011) 3:35–45

If, on the other hand, a search process involvesintegrating separable features, the second focused attentionmechanism needs to be called in, which involves slowserial search. This can be intuitively demonstrated bysearching for the red horizontal line among the red verticaland black horizontal and vertical distracters in the panel ofFig. 5.
In the discussion of what accomplishes the early pre-attentive selection, Koch and Ullman [6] introduced theidea of saliency maps as a concept of mental two-dimensional diagrams that encode the saliency of the visualenvironment based on the aforementioned features. Themost salient feature would get the attention first and so on.It would then be the saliency of the red horizontal line inFig. 4 that makes it pop-out in the fast pre-attentative stage.Predictions based on automatic saliency maps made bycomputers would then be possible to make.
On the other hand, in the second stage, selectiveattention and visual strategies based on top–down knowl-edge of the scene, such as searching for traffic signs alongroad sides and not in tree tops, make automatic predictionsof search patterns difficult.
Based on the feature integration theory we can under-stand why we so easily detect the red line against all theblack distracters in Fig. 4, but not among the red and blackdistracters in Fig. 5. In the first case, we can conduct adisjunctive parallel search based on one feature (color); inthe second case we need to conduct a slow serialconjunctive search on both color (red) and shape (horizon-tal). The established way to measure this difference insaliency is using search time. The method is cumbersome.The subjects cannot know in advance where the target is
Fig. 4 The target is the one red horizontal line in the top left quadrant.The distracters are black horizontal and vertical lines. We can easilypick out the target based by its different color
Fig. 3 The same traffic signagainst a background of a greenforest or a cluttered wall con-taining the same colors as thetraffic sign itself. Intuitively wecan easily say that the signagainst the green background ismore conspicuous than the otherone. But is the difference mea-surable with the suggestedmethod?
Fig. 5 In this panel about half of the lines are black and the other halfare red. The black lines are both horizontal and vertical, the red linesare vertical. Only one of the red lines is horizontal—this is the target(top right quadrant). To spot the target both color and orientationneeds to be processed
Eur. Transp. Res. Rev. (2011) 3:35–45 37
but have to know what to look for, and each target can thenonly be used once. Furthermore, chance plays a role(subjects might happen to look right at the target at once),so a large number of subjects need to be used to reachsignificance. This is the background to Wertheim’s sug-gested conspicuity index method.
3 Conspicuity
The method can be used both in the physical setting and onphotographs of the scene. The subject fixates a point well tothe side (or in any radial direction) of the target and thensuccessively moves the gaze towards the target until it canbe detected (detection conspicuity) or identified (identifi-cation conspicuity). The process is repeated three times andcan also be done the other way, from the target out in anyradial direction until detection (or identification) is nolonger possible. The mean value of the angle can then beused as an index of conspicuity.
It is not self-evident that a measure of how well anobject can be seen at different positions in the periphery ofour vision can be applied to its visibility in the scene, butthe correlation between conspicuity angle and traditional
search times in natural scenes has been shown to be high [7,8]. The logic is that during a search process, the larger theconspicuity index, the greater the chance that a target isspotted when a fixation is within the radius of theconspicuity angle. A study by Cook, Webber, Gillham, LeScouiller, and Moseley [9] also showed good correlationwith subjective ratings of visibility.
Theoretically, conspicuity is explained as based on asensory phenomenon in the retina called lateral masking.This theory is in opposition to the feature integration theoryand suggests that the slow search in conjunctive conditionis due to lateral masking and not to focal attention. For adeeper theoretical explanation and experimental evidence,see Wertheim, Hooge, Krikke and Johnsson, [10].
4 Method
In this method section three experiments will be described.In the first experiment we wanted to find out if thedifference in conspicuity, which intuitively was obvious inthe two prepared stimulus in Fig. 3, with the sign against acontrasting green forest and a masking wall with postersand another sign, was measurable with the conspicuityindex method suggested by Wertheim. And could it be donein a simple enough way so that the method could be usedby information designers as a practical tool?
In second experiment we wanted to find out if theconspicuity index would react to small differences like
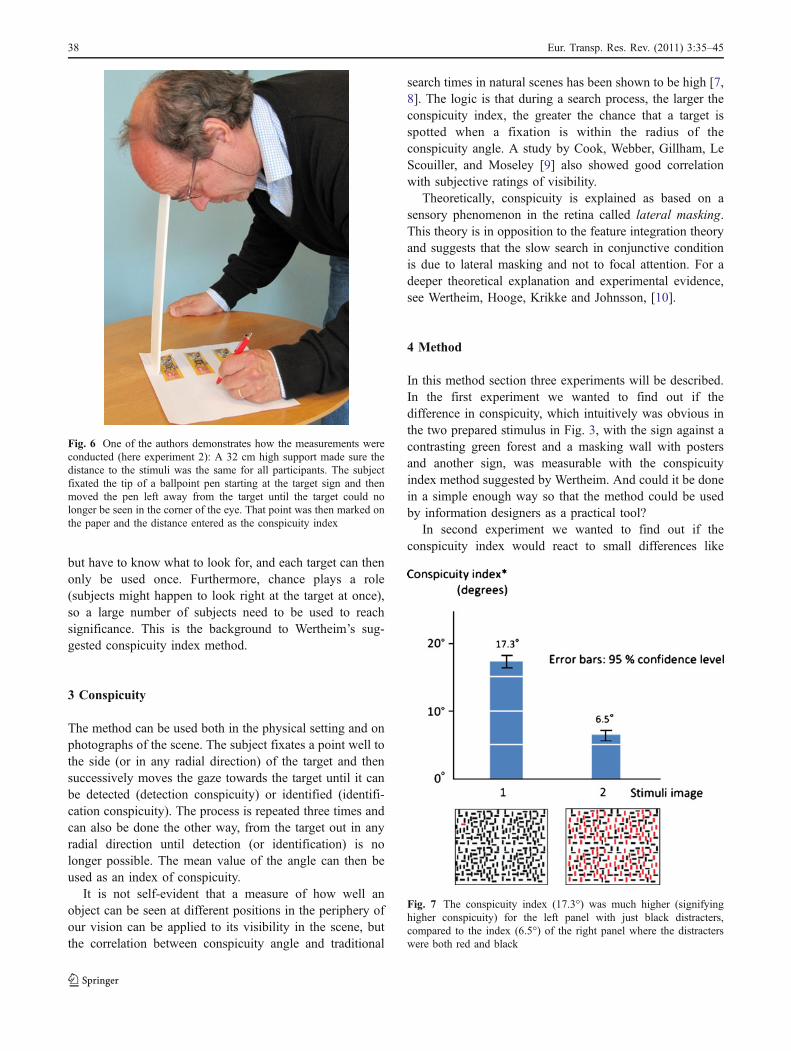
Fig. 6 One of the authors demonstrates how the measurements wereconducted (here experiment 2): A 32 cm high support made sure thedistance to the stimuli was the same for all participants. The subjectfixated the tip of a ballpoint pen starting at the target sign and thenmoved the pen left away from the target until the target could nolonger be seen in the corner of the eye. That point was then marked onthe paper and the distance entered as the conspicuity index
Fig. 7 The conspicuity index (17.3°) was much higher (signifyinghigher conspicuity) for the left panel with just black distracters,compared to the index (6.5°) of the right panel where the distracterswere both red and black
38 Eur. Transp. Res. Rev. (2011) 3:35–45

adding a mask behind the traffic sign in the previousexperiment. A technique traditionally used on traffic andrailway signals to enhance conspicuity.
In both of the experiments above the answer wasintuitively obvious and we wanted to validate the conspi-cuity index method. In the third experiment we wanted toapply the method on a real problem on which we had noprevious assumption.
5 Experiment 1
The two images in Fig. 3 and the two panels in Figs. 4 and5 were used as stimuli. The images were printed on A4paper where the image of each of the traffic sign were 100by 28 mm (a boundary box precisely containing thedrawing) and the two panels with red and black linesegments were 58 by 70 mm. They were all printed incolor.
The paper with the stimuli was placed horizontally on adesk in a classroom environment with normal lightingconditions. A 32 cm tall support was placed on the paperslightly above the image area and was used as a headrest toensure the same viewing distance for all subjects. Thesubjects were asked to rest their forehead on the supportand view the drawing with both eyes as demonstrated inFig. 6. They were to fixate the tip of a pen, which at theoutset of the test, was pointed on the middle of the targetsign. Then the subjects were asked to slowly move the penhorizontally to the left (for the panel in Fig. 4 to the right),away from the target, while continuing to fixate the tip ofthe pen. They were asked to continue moving the pen to theleft until they could no longer detect the stimulus sign inthe corner of their eye (while still fixating the tip of thepen). When they found a point where they could no longerdetect the target they were asked to move the pen back andforward to further try to specify the location of this spot andthen make a mark on the paper. This distance was laterrecalculated to an angle and used as the conspicuity index.
The panels were measured by 59 students, 35 male, 24female, ages 23–30, from Austria, Holland, Sweden andTurkey. All had normal vision or vision corrected to
normal. (In seven cases some panel was overlooked byparticipants, this is why the number of participants for thesepanels are lower than 59.)
5.1 Results of experiment 1
For the panel in Fig. 4, the subjects were asked to movetheir gaze to the right and mark the point where they couldno longer detect the red horizontal line (among the blackhorizontal and vertical distracters). The distance between
Panel inFig. 4
Panel inFig. 5
Forest backgroundin Fig. 3
Wall backgroundin Fig. 3
N 57 59 59 54
Mean (mm) 100 37 >135 77
SD (mm) 20 17 – 25
95% Conf. level (mm) 5 4 – 7
Conspicuity angle (deg.) 17.3 6.5 >42 13.6
95% Conf. Level (deg.) 0.9 0.8 – 1.2
Table 1 Results from theconspicuity measurements of thepanels in Fig. 3, 4 and 5
Fig. 8 The results of the conspicuity index method applied to the twodrawings with the same sign against a green forest and against asimilar colored and cluttered wall showed much higher index angle(>42°) compared to the other stimulus (13.6°)
Eur. Transp. Res. Rev. (2011) 3:35–45 39

the target and this point is used to calculate the conspicuityangle. For the panel in Fig. 5, the subjects were asked tomove their gaze to the left and mark the point where theycould no longer detect the red horizontal line (among thered vertical and black horizontal and vertical distracters).
The procedure for the two pictures with the traffic signagainst a green forest or a cluttered wall was the same. Inboth cases the participants were asked to move their gaze to
the left and mark the spot where they could no longer detectthe presence of the traffic sign in question.
The results where clear and in accordance with theintuitive feeling that the target in the panel with red verticaland black horizontal and vertical distracters were moredifficult to spot—lower conspicuity index—than the targetin the panel with just black vertical and horizontaldistracters. The distance between the target and the point
Fig. 9 A street sign in Prague,Czech Republic. A brightlycolored mask has been added tothe sign to enhance its visibility.The question is if enhancementsby masks are measurable usingthe conspicuity index method?
Fig. 10 The stimuli picturefrom experiment 1 (a) and withmasks added (b–d)
40 Eur. Transp. Res. Rev. (2011) 3:35–45

where the target could no longer be detected in theperipheral vision was much larger for the disjunctive panel.This distance was then recalculated to an angle measure-ment for the viewing distance of 32 cm. See Fig. 7 andTable 1 for the results.
The results for the prepared stimulus with the traffic signagainst a green forest and a cluttered yellow wall showedthe same clear results when measured with the conspicuityindex method: the picture with the sign against the greenforest had such a large index that the point where the signcould no longer be detected was way outside of the A4paper used to mark the index point. Thus we know that theindex point was more than 135 mm (more than 42°), butwere not able to record it with the simplified technique usedin this experiment. The stimuli with the sign against thecluttered wall had a conspicuity index of 13.6°. See Fig. 8and Table 1.
The results were very clear and consistent and thevariation surprisingly small. We think the results clearlyshow that the intuitively obvious difference in conspicuityalso could be measured using the method.
The interesting question was now whether small differ-ences were also possible to measure using this method(Fig. 9).
6 Experiment 2
In the second experiment we wanted to see if the traditionalmethod of increasing the conspicuity of traffic signals by
adding a black mask behind the sign was measurable usingthe conspicuity indexing method.
We used one of the picture from experiment 1, with thetraffic sign against the cluttered wall (Fig. 10a), and added ablack mask (Fig. 10b). We also used two other variations ofthe mask (black with a white border and plain yellow, likethe background wall—see Fig. 10c and d).
This time the stimuli pictures where slightly larger, 115by 34 mm, and placed to the right on an A4 paper inlandscape orientation (see Fig. 6). The participants used acarton support to make sure the distance between the eyeand the stimuli was approximately 32 cm. In this study the13 Swedish students participated (age 25–30, gender wasnot recorded). All subjects had normal eyesight, or eyesightcorrected to normal.
The expectation was that this mask would increase theconspicuity angle by making the sign more conspicuous.
Table 2 Conspicuity indices for experiment 2
A B C D
N 13 13 13 13
Mean (mm) 97,8 169,4 156,8 134,2
SD (mm) 23,6 29,9 31,7 31,4
95% conf. level (mm) 13,3 16,3 17,2 17,1
Conspicuity angle (deg.) 17,8 31,9 29,3 24,8
95% conf. level (deg.) 2,4 2,9 3,1 3,1
Fig. 11 The results of experi-ment 2. There is a significantdifference in the conspicuityindex for stimuli A, the signagainst the cluttered wall,compared to stimuli B, wherethe sign is enhanced by a blackmask. There are differencesbetween the three types ofmasks but they are notsignificant
Eur. Transp. Res. Rev. (2011) 3:35–45 41

6.1 Results of experiment 2
The results showed a significant difference in conspicuityindex between stimuli A, (the sign without any mask), andstimuli B, C, and D, with masks. The conspicuity indexangle for stimuli A was 17.8° and for stimuli B, with theplain black mask, 31.9°. The yellow mask with the samecolor as the background had the lowest index angle. Thedifferences between the three different masks were notsignificant. The variance between subjects was still verylow with the 95% confidence levels at around 3°. Theresults are presented in Fig. 11 and in Table 2.
The results of experiment 1 and 2 were reassuring. Itlooked as if the conspicuity index could not only bemeasured with the simple method used, but also that it wassensitive enough to measure relatively small differences.
In the final experiment we wanted to use the method on areal problem in an ongoing project: to test differences invisibility of different design for school bus signs (Fig. 12).
7 Experiment 3
Every year a large number of school children are killed inaccidents relating to school bus transportation (Fig. 12).This problem is addressed in the EU project Safeway twoSchool involving a number of European nations. One
central question in this project is: How do we make schoolbus signs visible? Our task in this project was to helpdetermine which of several tested school bus signs weremost visible, that is had the highest conspicuity index.
This time a more elaborated system was used whichallowed for a higher degree of control. The stimulus waspresented on a monitor. The screen’s physical dimensionswere 523 by 327 mm and the resolution 1920 by 1,200pixels. The subject was seated in front of the monitor usinga chin rest fixating the viewing distance to 660±10 mm.
As a background to the different bus signs tested themanipulated traffic environment in Fig. 13 was used.Parts of the picture were copied twice to make it wideenough. The background was a semi realistic view thatwould act as a mask for all the tested signs, allowing us tomake some kind of comparison between their conspicuity.To the far right of the background picture the targetstimulus was shown added to the back of a gray bus. Thesize of the sign corresponded to a real world size of 500by 500 mm.
On the monitor screen the size of the sign was 48 by 48pixels or 13 by 13 mm constituting a viewing angle of 1.13by 1.13°. In real life this corresponded to looking at the bussign from a distance of about 25 m.
The measurements were this time done using a smallyellow dot as a fixation mark for the participant (barelyseen in the back windscreen of the rightmost gold colored
Fig. 13 The stimuli picture withthe target (the bus sign) to thefar right, at the lower rightcorner of the bus. During thetest the participants were tofixate on a “gaze point” in theform of a yellow dot that couldbe moved left and right by theparticipant. In this screen dumpit can barely be seen in themiddle of the back windscreenof the rightmost gold colored car
Fig. 12 A school bus inEskilstuna, Sweden. Thevisibility of the bus is high incontrast to the winter snow butthe school bus sign is partlycamouflaged through the colorof the bus, which happens to beof the same color as the sign
42 Eur. Transp. Res. Rev. (2011) 3:35–45

car in Fig. 13). The dot could be moved left or right insmall 5 pixel increments by the participant using the leftand right arrow keys on a keyboard. At the outset of thefirst trial the dot was on top of the bus sign. The participantwould then move the dot gradually to the left. Fixating itwith his or her gaze until the bus sign could no longer beseen in the corner of the eye. The participant would thenmark the distance by pressing the space bar. The dot wouldthen move to the far left in the picture and the procedurewould restart using the same stimulus but this time movingright until the participant was able to distinguish the bussign in the corner of the eye. This went on three timesstarting from the sign and three times staring from the farleft, for each stimulus. The mean value of the six trials wasthen used as measurement.
Eight different bus signs were used as stimuli. Four staticand four others where the picture changed during a timeinterval of 3 s (see Table 3).
Based on the low variance in the previous experimentsonly five subjects were used for this test (males 27 to
56 years of age). All subjects had normal eyesight, oreyesight corrected to normal.
7.1 Results for experiment 3
The results showed a significant difference between theconspicuity index of the two groups of static bus signs(about 20–25°) and picture changing signs (35 to 36°). Thepicture changing signs (sign 5–8) showed higher conspicu-ity index, they were thus more visible (see Fig. 14 andTable 4). However the differences within the four picturechanging signs were small and not significant. The differ-ences within the group of static signs were also small andnot significant.
There was a larger variance between participants in thisexperiment. The point of detection seemed to be moredifficult to establish when asking the participants. If this hassomething to do with the new method displaying the stimulion a monitor as opposed to printed on a paper is somethingthat we will need to investigate further in future tests. We
Sign 1 Sign 5 Sign 2 Sign 6 Sign 3 Sign 7 Sign 4 Sign 8
N 5 5 5 5 5 5 5 5
Mean (px) 934 1730 898 1721 1039 1771 1115 1753
SD (px) 426 236 333 266 369 218 517 213
95% conf. Level (px) 373 207 292 233 323 191 453 187
Index (degrees) 20,9 35,3 20,2 35,1 23,0 35,9 24,5 35,6
SD (degrees) 9,9 5,5 7,8 6,2 8,6 5,1 11,9 5,0
95% conf. level 8,7 4,8 6,8 5,4 7,5 4,5 10,4 4,4
Table 4 Results fromexperiment 3
Table 3 The stimuli signs used in experiment 3
Eur. Transp. Res. Rev. (2011) 3:35–45 43

also noticed a small difference between the index when theparticipants started with the gaze on the target and wentoutward, than when the procedure was the reversed.However, the differences between signs were not affected.
Considering the higher variance we can conclude thatthe number of participants (5) was too low in experiment 3.We also need to work on optimizing the method with themonitor interface.
8 Discussion
The simple experiment method used in experiment 1 and 2showed robust results suggesting that the conspicuity indexmethod can be used to measure visibility of signs in theircontext. The results showed low variations across subjects,suggesting that fewer subjects could be used than in thefirst experiment. The results also showed good correlationwith intuitive expectations. Experiment 2 also suggestedthat small differences are detectable using this method. Theresults of experiment 3 were less robust, showing a highervariance between participants for the same sign. If this hassomething to do with the new method introduced heredisplaying the stimuli on a monitor screen or with therelatively few participants used will be the subject of futurestudies.
One has to be aware of the fact that the visibility of thesign now is measured in context and that the same signagainst another background will show different results.Thus it is the relative values that are of interest not theabsolute ones.
However, the ultimate goal for the development of thismethod would be to be able to define a method where the
conspicuity index of different signs could be tested againstone, or several standard backgrounds and an indexthreshold decided below which no traffic sign would beconsidered visible enough. If lower, something would haveto be done about the context, using masks, separating largeclusters of signs, etc. This will also be the subject of futurestudies.
9 Conclusions
The results from this study show that Wertheims conspicu-ity index method is useful in determining the visibility ofsigns in context. The simple method with the stimuliprinted on paper used in experiment 1 and 2 should bevaluable for practical use by designers in an everydaysetting. The robustness of the results found suggests that arelatively low number of participants still could give usefulresults. The results from the last experiment using evenfewer participants and a new computer based method wereless robust and needs to be investigated further.
As a guideline to sign design the quantitative resultsfrom this study show that uncluttering of the immediatebackground of signs by using a mask clearly increases theconspicuity of the sign.
Acknowledgement Parts of his study has been conducted within theEU 7th Framework program SAFEWAY 2 SCHOOL, which isgratefully acknowledged.
Open Access This article is distributed under the terms of theCreative Commons Attribution License which permits any use,distribution and reproduction in any medium, provided the originalauthor(s) and source are credited.
Fig. 14 The results ofexperiment 3 show that thepicture changing signs weremore conspicuous than the staticsign. The differences within thetwo groups of dynamic andstatic signs were small and notsignificant
44 Eur. Transp. Res. Rev. (2011) 3:35–45

References
1. Wertheim AH (1989) A quantitative conspicuity index: theoreticalfoundation and experimental validation of a measurement proce-dure. Report C-20 (in Dutch). TNO Human Factors ResearchInstitute, Soesterberg, The Netherlands
2. Purves D, Augustine GJ, Fitzpatrick D, Katz LC, LaManta A-S,Williams SM (2001) Neuroscience. Sinauer, Sunderland
3. Itti L, Koch C (2000) A saliency-based search mechanism forovert and covert shifts of visual attention. Vis Res 40:1489–1506
4. Simons DJ, Levin DT (1997) Failure to detect changes to attendedobjects. Investig Ophthalmol Vis Sci 38:3273
5. Treisman A, Gelade G (1980) A feature integration theory ofattention. Cognit Psychol 12:97–136
6. Koch C, Ullman S (1985) Shifts in selective visual attention:towards the underlying neural circuitry. Hum Neurobiol 4:219–227
7. Kooi FL, Toet A (1999) Conspicuity: an efficient alternative forsearch time. In: Gale AG, Brown ID, Hasslegrave CM, Taylor SP(eds) Vision in vehicles VII. Elsevier, Amsterdam, pp 451–462
8. Toet A, Kooi FL, Bijl P, Valeton JM (1998) Visual conspicuitydetermines human target acquisition performance. Opt Eng 37(7):1969–1975
9. Cook G, Webber G, Gillham SA, Le Scouiller SA, Moseley E(2005) The legibility and conspicuity of emergency escape routesignage for people with visual impairments. Int Congr Series1282:1016–1020
10. Wertheim AH, Hooge LTC, Krikke K, Johnsson A (2006) Howimportant is lateral masking in visual search? Exp Brain Res170:387–402
Eur. Transp. Res. Rev. (2011) 3:35–45 45