consolidation in the banking sector: evidence of
TRANSCRIPT

Department of Management – Chair of Structured Finance
CONSOLIDATION IN THE BANKING SECTOR:
EVIDENCE OF EFFICIENCY GAINS FROM MERGERS
AND ACQUISITIONS
SUPERVISOR
Prof. Riccardo Bruno
CANDIDATE
Roberta Nesti
Mat. 683611
CO-SUPERVISOR
Prof. Alfio Torrisi
ACADEMIC YEAR 2017-2018

2
Table of contents
Chapter 1: The banking sector over the years: overbanking and consolidation process
Introduction ……………………………………………………………………….p.3
1.1 The financial system and its financial intermediaries............................................p.5
1.2 The SSM landscape and the classification into Significant and Less Significant
Institutions ………………………………………………………………………….p.12
1.2.1 The banking sector in Europe over the years…………………………...p.19
1.3 The issue of overbanking………………………………………………………p.20
1.4 Consolidation in the banking Sector……………………………………………p.25
Box: The Italian Credit Cooperative Reform……………………………………….p.28
Chapter 2: The analysis of banks involved in M&A transactions
2.1 Differences between Mergers and Acquisitions and how they are treated in the
analysis……………………………………………………………………………...p.32
2.2 The dataset……………………………………………………………………...p.33
2.3 Analysis of profitability, solvency, asset quality and efficiency in M&A……...p.43
2.4 Analysis of profitability, asset quality and efficiency from a country
perspective………………………………………………………………………….p.50
Chapter 3: Empirical evidence of efficiency gains from M&A transactions
3.1 Literature Review………………………………………………………………p.56
3.2 The Models
3.2.1 Data Envelopment Analysis………………………………………….p.58
3.2.2 Difference-in Differences …………………………………………....p.69
3.3 The Application of the models: data, methodology and results………………...p.61
Conclusions………………………………………………………………………....p.69
3
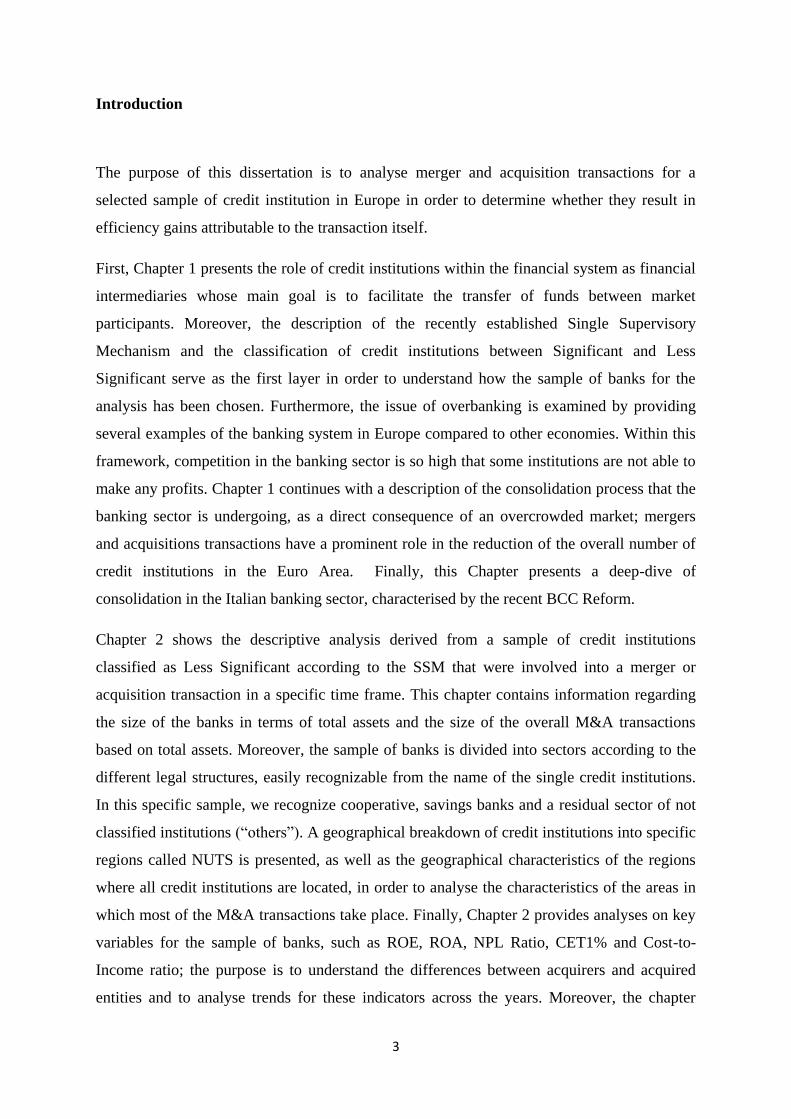
Introduction
The purpose of this dissertation is to analyse merger and acquisition transactions for a
selected sample of credit institution in Europe in order to determine whether they result in
efficiency gains attributable to the transaction itself.
First, Chapter 1 presents the role of credit institutions within the financial system as financial
intermediaries whose main goal is to facilitate the transfer of funds between market
participants. Moreover, the description of the recently established Single Supervisory
Mechanism and the classification of credit institutions between Significant and Less
Significant serve as the first layer in order to understand how the sample of banks for the
analysis has been chosen. Furthermore, the issue of overbanking is examined by providing
several examples of the banking system in Europe compared to other economies. Within this
framework, competition in the banking sector is so high that some institutions are not able to
make any profits. Chapter 1 continues with a description of the consolidation process that the
banking sector is undergoing, as a direct consequence of an overcrowded market; mergers
and acquisitions transactions have a prominent role in the reduction of the overall number of
credit institutions in the Euro Area. Finally, this Chapter presents a deep-dive of
consolidation in the Italian banking sector, characterised by the recent BCC Reform.
Chapter 2 shows the descriptive analysis derived from a sample of credit institutions
classified as Less Significant according to the SSM that were involved into a merger or
acquisition transaction in a specific time frame. This chapter contains information regarding
the size of the banks in terms of total assets and the size of the overall M&A transactions
based on total assets. Moreover, the sample of banks is divided into sectors according to the
different legal structures, easily recognizable from the name of the single credit institutions.
In this specific sample, we recognize cooperative, savings banks and a residual sector of not
classified institutions (“others”). A geographical breakdown of credit institutions into specific
regions called NUTS is presented, as well as the geographical characteristics of the regions
where all credit institutions are located, in order to analyse the characteristics of the areas in
which most of the M&A transactions take place. Finally, Chapter 2 provides analyses on key
variables for the sample of banks, such as ROE, ROA, NPL Ratio, CET1% and Cost-to-
Income ratio; the purpose is to understand the differences between acquirers and acquired
entities and to analyse trends for these indicators across the years. Moreover, the chapter

4
concludes with a focus on Italian and German non-performing loans ratio, to compare the
situation of acquirers and acquired in those two countries and to try to understand whether
merger and acquisitions are driven by different purposes.
In the end, Chapter 3 contains the econometric analysis to attempt to prove whether there are
changes in the efficiency level for the banks that are involved in a merger or acquisition. The
main reason for the introduction of econometrics is related to the fact that changes in
efficiency after a merger cannot be attributed to the merger itself without having assessed
causality. Therefore, a literature review is presented in order to explain which the state of the
art is with regards this type of analysis. This chapter also provides for theoretical summaries
of the two models used, namely Data Envelopment Analysis and Differences-in-differences,
in order to help the reader in understanding the reason for the choice of such models for the
purpose of this dissertation. Finally, the application of the models is made on a sample of
credit institutions classified as Less Significant (for the sake of consistency with the previous
chapter), with a focus on the consequences of M&A transactions in terms of efficiency gains.

5
Chapter 1: The banking sector over the years: overbanking and consolidation process
1.1 The financial system and its financial intermediaries
The financial system is a complex organization that aims at simplifying the transfer of funds
between participants. Its function is considered to be critical, as it produces an efficient
allocation of capital; indeed, by allowing funds to move from the ones without productive
investment opportunities to those who instead have them, the transfer of capital is optimal.
More in detail, the financial system could channel funds from households, firms and
governments that are in excess of funds to the same parties that instead have a shortage of it.
There are other functions the financial system performs that are also important, such as the
functioning of the payment systems, the reduction of asymmetric information between the
parties involved in a transaction and the possibility to match the intertemporal preferences of
investors. Moreover, it is possible to distinguish two different areas in which the financial
system operates: direct finance and indirect finance. The former works through financial
markets, where savers lend money to borrowers directly, whereas the latter works through
financial institutions that facilitate the exchange between the parties, as it is possible to see in
Figure 1.
Figure 1 The Financial System
Source: The Economics of Money, Banking & Financial Markets

6
In financial markets, and therefore direct finance, it is essential that market players have the
same preferences for the financial instruments` characteristics, such as maturity, currency and
amount. If this is not the case, the parties would choose not to act. Instead, in the area of
indirect finance financial institutions play an important role as one of their functions is to
match the preferences of borrowers and savers. They engage in diversification of credit,
transformation of currencies and of maturity of instruments.
Financial markets can be classified according to the issuance or maturity of the financial
instrument. If the classification follows the issuance of instruments, then it is possible to
divide financial markets in primary and secondary market. Primary market is a market where
new issues of securities, such as a bond or a stock, are sold to initial buyers by the
corporation or government agency borrowing the fund1. On the other side, the secondary
market is where securities that had already been issued previously are sold again.
The financial instruments that are traded in financial markets have different maturities: there
are instruments with short maturity (less than 1 year), that are traded in the Money Market
and instruments with longer maturity (more than 1 year) that are instead traded in the Capital
Market.
Money Market
The instruments that are traded in the money market have the following characteristics:
High liquidity
Low risk and Low yield
Traded over-the-counter
Wholesale market
The most important feature of this market is that instruments should be readily turned into
cash at low cost. These instruments are treasury bills, commercial papers, overnight funds
and Certificates of Deposits (CDs). Even though in theory there are no restrictions to
participation in the money market, due to practices and elevated costs of entry, participation
is restricted to few players, such as central and state governments, commercial banks,
insurance companies, mutual funds and corporations.
1 F.S. Mishkin, “The Economics of Money, Banking & Financial Markets”

7
Capital Markets
Capital markets are markets where longer term debt and equity instruments are traded. The
main characteristics are:
Less liquid
Higher risk and return
Traded in exchanges and over-the-counter
In this market securities are traded with the aim of raising medium and long term financing.
The most important instruments are stocks, mortgages, corporate and government bonds. The
participants in the capital markets are several: individuals, corporates and governments, who
raise funds and sell them in the market. The recipients of those funds (funds suppliers) are
typically pension funds, hedge funds, sovereign funds, individuals, corporates and
governments as well, as it is possible to see from Figure 2.
Figure 2 Interchange of suppliers and users of funds in Capital Markets
Source: Structured finance 2017-2018, financial markets Recap
Financial institutions conduct transactions on the side of indirect finance, within a financial
system. The most common type is represented by financial intermediaries, whose main

8
purpose is to facilitate transactions in the financial system by reducing the cost of borrowing
and lending for the market participants.
Transaction costs, indeed, are not negligible in the financial system, and are particularly high
for small players (both savers and borrowers). This means that in case financial
intermediaries did not exist, most of the transaction in the market would not take place at all.
The first solution proposed by financial intermediaries to the problem of high transaction
costs consists in bundling several funds coming from a large number of investors together; in
this way, as the number of transaction increases the cost of transaction per single investment
is reduced. We refer to this phenomenon as economies of scale. The second element that
makes financial intermediaries fundamental for the functioning of the system is characterized
by the development of expertise. Higher level of expertise is, then, translated into lower
transaction costs, which allows financial intermediaries to offer cheap services to their
customers. A third element that should be considered when dealing with the advantage of
intermediaries is the risk sharing. Indeed they help reducing the risk of the investors`
exposures by diversification. Portfolio diversification is a fundamental principle for
managing risks. A portfolio that is well diversified has a lower volatility compared to a non-
diversified portfolio, as the returns of some asset categories are not moving together (low or
null correlation). Therefore, if a financial institution is able to invest in different categories of
assets in more than one market, the overall risk of the customer is lower.
The importance of financial intermediaries can be also partially explained by the reduction in
asymmetric information between the various market participants as a consequence of the
institutions` activities. There are two types of asymmetric information: the first is ex-ante,
that is before the occurrence of a transaction and that is referred to as adverse selection, while
the second is ex-post (after the actual occurrence) and is called moral hazard. Adverse
selection is defined as the problem created when potential borrowers who are the most likely
to produce an undesirable (adverse) outcome are the ones who most actively seek out a loan
and are thus more likely to be selected2. According to this definition, since the probability
that a credit is a bad credit, lenders could also decide not to act at all, not considering the fact
that good borrowers could exist in the market. The presence of financial intermediaries
alleviates the problem of adverse selection, as they act as expert middlemen that possess
2 F.S. Mishkin, “The Economics of Money, Banking & Financial Markets”

9
higher amount of information regarding the quality of credits compared to the single savers
and investors.
Moral hazard is defined as the risk that the borrower might engage in activities that are
undesirable from the lender`s point of view, because they make it less likely that the loan will
be paid back3. If a potential lender doubts that the amount of money returns, he/she may
decide not to grant the loan. For this purpose, financial intermediaries are able to reduce the
probability of hazard by engaging in monitoring activities and not increasing the costs for
market participants.
Depending also on the markets in which they operate, namely primary or secondary market,
intermediaries have different roles. Indeed, in the primary market those institutions provide:
Advisory services with respect to: timing of issuance, size and type of the
instrument, alternative financing options for both buyer/seller side;
Administrative functions: they deal with regulatory authorities and should
satisfy legal, regulatory and market requirements;
Underwriting function4: financial intermediaries have the ability to purchase
instruments from the issuers and to resell them in the market;
Distribution: it is up to the intermediary to initiate a marketing strategy to
promote the issuance in the market;
Stabilization: after the launch of the instrument, the stabilization of price and
the whole aftermarket phase should be dealt by the financial intermediary.
In the secondary market, instead, the roles of the intermediaries are the following:
Research: the analysis of securities already present in the market and recommendation
of purchase are on behalf of the intermediary;
Brokerage: usually those institutions buy and sell on behalf of their clients and earn
fees due to the discrepancy of bid-sell price;
Trading: sometimes intermediaries buy and sell securities also on their behalf, acting
as principals;
3 F.S. Mishkin, “The Economics of Money, Banking & Financial Markets” 4 It is worth mentioning that the underwriting function of intermediaries could be either at
commitment or at best efforts. If the intermediaries commit, in case securities are not sold then the
underwriter bears the losses. If, instead, the underwriting process is at best effort it means that if the
underwriter is not able to sell, the securities go back to the issuer, that bears the losses

10
Market Making: usually dealers buy and sell as principals and earn fees due to the
discrepancy of bid-sell price;
Structuring: some intermediaries are also able to build their own instruments.
Financial intermediaries comprise different types of entities and could be divided into two
macro-categories: depository and non- depository institutions. The former are financial
intermediaries that are legally authorized to accept deposits from customers (legal or natural
persons), pay a fixed or variable interest rate and usually make loans. The most common
institution that falls into this category is the bank. On the contrary, non-depository institutions
are not allowed by law to receive deposits from customers and they typically fund their
lending through the sale of financial instruments in the market. In this category of financial
intermediaries there are insurance companies, mutual funds, pension funds and investment
banks.
According to the European Central Bank, there are five groups of financial institutions5:
Monetary Financial Institutions (MFIs);
Investment Funds (IFs);
Financial Vehicle Corporations (FVCs);
Payment Statistics relevant Institutions (PSRIs);
Insurance Corporations (ICs).
The category that is in the interest of this dissertation is the one of MFIs, defined as resident
undertaking that belongs to any of the following sectors6:
1. Central Banks;
2. Other MFIs.
While Central Banks are indicated as national Central banks of the respective EU member
State, comprising the European Central Bank, in the second category (other MFIs) there are
5 European Central Bank website:
https://www.ecb.europa.eu/stats/financial_corporations/list_of_financial_institutions/html/index.en.ht
ml 6 Regulation ECB/2013/33 concerning the balance sheet of the monetary financial institutions sector
(recast)

11
credit institutions, defined in the Regulation as undertaking the business of which is to take
deposits or other repayable funds from the public and to grant credits for its own account7.
Banks, or credit institutions, are considered the most important intermediaries in the market,
due to the fact that they carry out several tasks that help the well-functioning of the economy.
Indeed, they support the payment system, which entails the exchange of goods and services
(funds) for money or financial assets. Moreover, they allow customers (natural or legal
persons) to store and save their money in accounts or to borrow them in case of need. In
substance, banks operate in such a way that the pool of money coming in from depositors,
typically short-term, is loaned out to borrowers for longer term loans. This activity, better
known as maturity transformation, is a key task for the mismatch in the maturities of all the
market participants and is also the way in which banks make the greatest portion of their
profits. Indeed, they usually pay a lower interest rate for the deposits, that are liabilities,
compared to the one they ask when granting a loan.
In the market there are different types of banks, which can be differentiated according to the
activities and roles they have in the economy:
Commercial banks are credit institutions whose main goal is to accept deposits and
make loans. In particular, this category of bank is able to raise funds by issuing short-
term debt (savings deposits, time deposits, payable deposits) that is used in order to
grant long-term loans (commercial loans, consumer loans, mortgage loans);
Investment banks perform several services for businesses and governments. They
advise companies on several matters, such as issue of securities, underwriting process,
facilitate M&A processes. They also act as brokers for institutional clients, focus on
Initial Public Offerings (IPOs) and on share offerings, both private and public.
However, as previously stated, they are non-depository institutions;
Universal banks perform both commercial and investment bank activities.
Nonetheless, banks are much more diversified than that. Two commercial banks can perform
different activities, but falling into the same category of banks. Indeed, there are several
7 Regulation ECB/575/2013 on prudential requirements for credit institutions and investment firms
amending regulation

12
methodologies to divide credit institutions into different categories. There have been several
studies to distinguish institutions according to their business models by running cluster
analyses; one of them, carried out by the European Central Bank8, has the aim of finding
similarities and differences across institutions on the basis of their activities and the
composition of profits. The results of the study produces four different business models,
namely wholesale, traditional commercial, complex commercial and securities holdings
banks, grouped due to their similarities of risk and performance indicators within each
category9.
Furtherly, banks could be also distinguished on the basis of their counterparts; there are some
banks that are specialised in lending to a particular category in the market, such as Small and
Medium Enterprises (SMEs), central banks, other banks, specific industries. Also, they could
be different in terms of instruments they use in order to earn profits. There might be some
credit institutions whose main source of profits does not rely on loans but rather on
derivatives, and so on.
1.2 The SSM landscape and the classification into Significant and Less Significant
Institutions
The banking sector is one of the most regulated10
, due to the fact that the activities of banks
are essential for the functioning of the economy. On one hand, the level of economic and
monetary integration between the states of the Euro area started decades ago, and several
steps have been taken in order to foster integration and unified financial markets. Indeed, the
introduction of the Single Market for the free trade in 199311
, as well as the establishment of
a single currency in 199912
, symbolizes important achievements for the European community
as a whole. On the other hand, the existence of a single entity that regulated and supervised
8M. Farne, A. Vouldis “Business models of the banks in the Euro Area” ECB Working paper series
2017 9 M. Farne, A. Vouldis “Business models of the banks in the Euro Area” ECB Working paper series
2017 10 F.S. Mishkin, “The Economics of Money, Banking & Financial Markets” 11 European Parliament, “25 Years of the EU Single Market”,
http://www.europarl.europa.eu/resources/library/media/20180116RES91806/20180116RES91806.pdf 12European Central Bank, “The process of European economic integration”, Speech by Jean-Claude
Trichet, September 2007

13
the banking sector was absent until recently. Only national rules and policies, different from
one country to another, prevailed. Consequently, the banking system was fragmented and
banks supervised in very different ways, notwithstanding the fact that are exposed to common
risks. This is the case since all banks are subject to the same levels of interest rates, set by the
European Central Bank and unique for all Europe. Moreover, the imbalance between
integrated financial markets on one and the national-segmented regulation on the other side
created problems among the various national authorities. In addition, the 2008 crisis
highlighted the fact that the banking sector `s interconnectedness could cause damages (better
known as spillover effects) outside the borders of a nation13
.
Therefore, a communication from European Commission to the European Parliament in
201214
highlights the importance of taking a decisive step in the regulation and supervision
fields, and to create a Banking Union. In this note, the European Commission claims that
notwithstanding the decisive steps already implemented in the Economic and Monetary
Union (EMU), the mere coordination between supervisors is not sufficient to tackle all the
risks in the Euro Area; a necessary step concerns the shift in supervision of banks to a
European level. The main purpose is to restore confidence in the Euro Area and to give to the
banking sector a more sound position. The harmonization of the rules across the countries in
the Euro Area has the objective to reduce the distortions and disparities that existed due to
different interpretations and applications of such rules. Moreover, the shift of supervision
represents one element of the Union. It must be accompanied by a common system for
deposit protection as well as integrated bank crisis management.
The Banking Union is composed of different elements:
The Single Supervisory Mechanism (SSM)
The Single Resolution Mechanism (SRM)
The European Deposit Insurance Scheme (EDIS)
The Single Supervisory Mechanism represents the first pillar of the Banking Union, and
consists of the transfer of some of the supervisory tasks at the European level from a national
one. Under the SSM framework, the European Central Bank becomes responsible for the
supervision of all banks that participate in the Banking Union, and for other important tasks:
13Peltonen, T.A., Rancan, M., Sarlin P., “Interconnectedness of the banking sector as a vulnerability to
crises”, ECB Working Paper Series, 2015 14 European Commission, “A Roadmap towards a Banking Union”, 2012

14
grant and withdraw authorisation of banks, asses the purchase of their holdings, ensure
compliance with minimum prudential requirements and adequacy of internal capital15
.
The second pillar is the Single Resolution Mechanism, and is the system that intervenes
whenever a credit institution faces financial distress. The main purpose of this is to ensure the
efficient resolution of failing banks, with low costs for taxpayers and for the real economy16
.
Indeed, a system for resolution of banks should be as important as a system for supervision of
banks.
Finally, the main objective of the common deposit insurance scheme is to offer benefits in
terms of uniform depositors` protection. If depositors have less incentives to withdraw their
money when they are concerned about a bank`s solvency, insurance of deposits might reduce
liquidity risk and a potential crisis17
. Even though this protection scheme is not yet into
place, the general opinion is that this third leg is necessary for the completion of the Banking
Union. Indeed, without the EDIS, the architecture of the union is incomplete and might create
asymmetries since there is a common framework for supervision and resolution but not for
deposit protection. Therefore, depositors are not able to fully benefit from a unified system of
protection18
.
However, the creation of the Banking Union should not jeopardise the successes of the single
market that have been achieved during the years. Therefore, the banking union sets its rules
in such a way that create a reinforcing mechanism with the already established principles of
the single market contained in the Single Rulebook19
. The Rulebook consists of a set of
written regulations and harmonised prudential rules for the financial and banking sectors.
Within the framework of the Banking Union, these rules create a level playing field for all the
credit institutions belonging to the EU countries, and are different according to the financial
situation of a bank:
15 European Central Bank, “Guide to Banking Supervision”, November 2014 16 European Central Bank, “Banking Union”,
https://www.bankingsupervision.europa.eu/about/bankingunion/html/index.en.html 17 Carmassi, J., Dobkowitz S., Evrard J., Parisi L., Silva, A., Wedow M., “Completing the Banking
Union with a European Deposit Insurance Scheme: who is afraid of cross-subsidisation?”, Occasional
Paper Series, 2018 18 European Central Bank, “Financial Integration in Europe”, 2016 19 European Commission, “A Roadmap towards a Banking Union”, 2012

15
Figure 3 Single Rulebook`s legal proposals
Source: European Commission, press release 9th March 2015 “restoring financial stability in the
Eurozone”
As it is shown in the picture, CRD4 aims at ensuring safer banks while BRRD is a set of rules
applied whenever a credit institution displays financial issues. Finally, in a crisis management
situation, also the Single Resolution Mechanism, together with BRRD, is applied. What is
also worth mentioning is that all these requirements concerning the Banking Union have been
communicated through Regulations and not Directives20
.
The conduct of supervision and the responsibilities are divided between the SSM (centralized
level) and the National Competent Authorities (national level). In this way, both the ECB and
the NCAs play an active and pivotal role, and have also the duty to cooperate and coordinate
the actions, as it is possible to see in Figure 4.
20 While regulations are directly enforceable, directives needed to be transposed into national law.
This, of course, required more time and no certainty of being applied

16
The different roles and responsibilities are, therefore, decided according to the criteria of
significance of credit institutions, listed in the SSM Framework21
. The criteria are based on
size, economic importance, level of cross-border activities, presence of direct public financial
assistance and if the entity is one of the three most significant credit institutions.
The framework sets also some quantitative thresholds for the abovementioned criteria. A
supervised entity or a supervised group shall be classified as significant if:
i. The total value of its assets exceeds EUR 30 billion
ii. it is relevant for the economic sector, for the interconnectedness, for substantiality
or complexity
iii. the total value of its assets exceeds EUR 5 billion and the ratio of its cross-border
assets/liabilities in more than one other participating Member State to its total
assets/liabilities is above 20%
21 Regulation No 468/2014 of the ECB, establishing the framework for cooperation within the SSM
between the ECB and national competent authorities and with national designated authorities (SSM
Framework Regulation)
Figure 4 Distribution of tasks between ECB and NCAs
Source: Guide to Banking Supervision, ECB 2014

17
iv. it has requested/ received funding from the European Stability Mechanism22
or
from the European Financial Stability Facility23
v. It is one of the three most significant institutions in a participating Member State
To be qualified as a Significant Institution (SI), banks have to fulfil at least one of those
criteria. The review for the significance is an on-going activity and the status of banks can
change (the “migration” phenomenon). However, as the SSM Framework explains, the
approach for migration is asymmetric, in order to avoid that some credit institutions fluctuate
from Significant to Less Significant or vice versa too often. Indeed, when a Less Significant
Institution (LSI) surpasses any of the criteria, it becomes a Significant Institution and the
national supervisors have to hand over responsibility for direct supervision to the ECB24
. If,
instead, a Significant Institution does not exceed any threshold, it does not become
immediately Less Significant. In this case, the ECB supervisory responsibility is terminated
only if the institution does not meet any of the criteria for three subsequent years.
The separation between SIs and LSIs is important in terms of approach to supervision and in
terms of characteristics of banks. If the ECB supervises directly an institution, a proper team
called Joint Supervisory Team (JST) is formed; this team, composed by both members of
ECB and of National Competent Authorities (NCAs), is responsible for the day-to-day
supervision. On the contrary, there are no JSTs for Less Significant Institutions, since they
are directly supervised by the respective Central Banks/ Supervisory Institutions of the
Member States, and the ECB has an oversight function. This means that the NCAs carry out
their supervisory activities using their own resources and decision-making procedures, while
the ECB, and more in detail Directorate General Microprudential Supervision III, is
responsible for the effective and consistent functioning of the SSM framework, and has to
22 The European Stability Mechanism is the European Institution in charge of recapitalizing credit
institutions that are likely to be unable to meet the capital requirements established by the ECB 23 The European Financial Stability Facility is an institution that provides financial assistance to
countries in economic difficulties, for the purpose of financial stability 24Banking Supervision Website:
https://www.bankingsupervision.europa.eu/banking/list/criteria/html/index.en.html

18
make sure that the methodologies applied by the NCAs are in line with the high standards of
supervision25
.
Moreover, the credit institutions that have been divided into the two categories can be very
different. While SIs are “big” banks and a potential deterioration or failure can have a direct
impact in the economy, LSIs are smaller, they typically operate on a regional level and
therefore cannot impact the economy in a direct manner. However, if more than one “small”
player deteriorates or fails, this could have an impact in the SSM world. Additionally, if we
take into account the fact that at the end of 2017, according to the List of Supervised Entities
published by the ECB, the number of SIs corresponds to 118, while the number of LSIs is
315526
, it is easy to understand why it would be impossible to let a European Institution to
supervise all those entities directly. These numbers are also important to understand that the
world of LSIs is complex, and performing a deep/dive in how this system of credit
institutions has changed over time could give us the idea of how it could change in the future
and what impact it could have in the financial system.
25 SSM Supervisory Manual, European Banking Supervision: functioning of the SSM and Supervisory
Approach, March 2018 26 List of Supervised Entities, ECB, cut-off date 1st January 2018

19
1.2.1 The banking sector in Europe over the years
After the crisis in 2008 the banking sector in the Euro Area has changed resulting in a lower
number of institutions overall27
, as shown in Figure 5.
Figure 5 Number of Credit institutions and foreign branches, 2008 and 2016
Source: European Central Bank, “Report on financial structures, October 2017”
The number of banks at the end of 2008 amounted to 6768 and declined to 5073, resulting in
a decrease of 25% on an unconsolidated basis. On a consolidated basis, instead, the number
of existing banks has changed from 2904 to 2290 in the period 2008-201628
.
As it is possible to see in the picture, the countries with the highest number of banks are
Germany, Italy and Austria, that account for the greatest portion in the Euro Area (67% of
total). Notwithstanding the fact that those countries are the ones that have faced the greatest
changes in the reduction of credit institutions, they remain the areas with the biggest banking
sector. In terms of total assets, France and Germany continue to have the largest sector. In
Figure 6 a representation of total assets on a country basis is shown for 2008 and 2016.
27 Source: European Central Bank, “Report on financial structures, October 2017” 28
Source: European Central Bank, “Report on financial structures, October 2017”

20
Figure 6 Total Assets of the banking sector by country, 2016-2017
Source: European Central Bank SDW, author`s computations
Between 2008 and 2016 all the countries in the picture have experienced a decrease in the
value of total assets of banks, with the exception of Spain (+5%). Moreover, the figures for
Germany are the most interesting, as in 8 years total assets decreased by around 27%, from
around €9 Trillion to less than €7 Trillion.
One question that is worth answering is related to the reasons why during the last decade this
decreasing trend begun. The next section will go deeper in analysing how the banking sector
has changed over time.
1.3 The issue of overbanking
Overbanking can be described as “the excessive provision of banks or banking facilities; the
granting of charters to an excessive number of banks, especially when this results in bank
failures”29
. However, in practice the concept of overbanking is not univocally defined, as it
could be interpreted in different manners.
It is true that the banking sector has changed in the past century; the supply of credit has
increased and banks expanded into new businesses. As shown in Figure 7, bank loans in
Europe increased during the 90s, compared to other economies such as the US and Japan.
29 Oxford Dictionary: https://en.oxforddictionaries.com/definition/overbanking
21
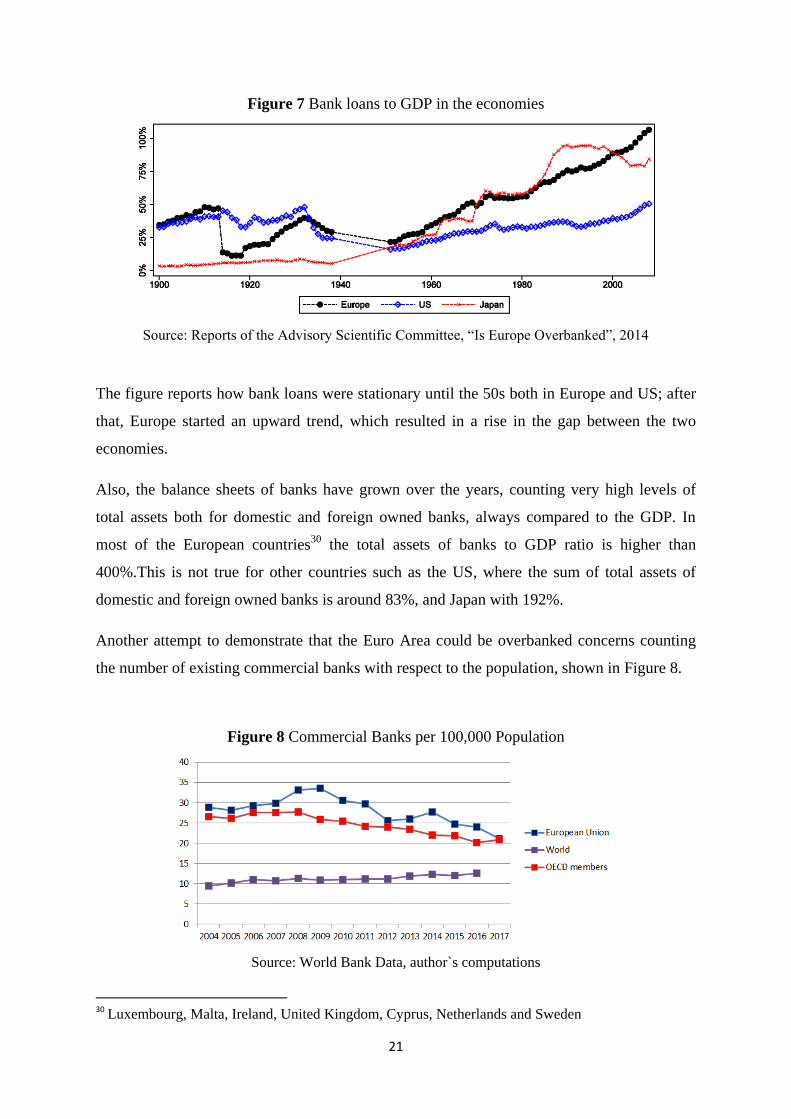
Figure 7 Bank loans to GDP in the economies
Source: Reports of the Advisory Scientific Committee, “Is Europe Overbanked”, 2014
The figure reports how bank loans were stationary until the 50s both in Europe and US; after
that, Europe started an upward trend, which resulted in a rise in the gap between the two
economies.
Also, the balance sheets of banks have grown over the years, counting very high levels of
total assets both for domestic and foreign owned banks, always compared to the GDP. In
most of the European countries30
the total assets of banks to GDP ratio is higher than
400%.This is not true for other countries such as the US, where the sum of total assets of
domestic and foreign owned banks is around 83%, and Japan with 192%.
Another attempt to demonstrate that the Euro Area could be overbanked concerns counting
the number of existing commercial banks with respect to the population, shown in Figure 8.
Figure 8 Commercial Banks per 100,000 Population
Source: World Bank Data, author`s computations
30 Luxembourg, Malta, Ireland, United Kingdom, Cyprus, Netherlands and Sweden

22
First, when comparing the data of the Euro Area and the World, it is not surprising that the
number of commercial banks is higher in the former. The reason is that the world`s average
number is affected by data of undeveloped countries, whose number of commercial banks per
population is either low or null. Instead, likening the Euro Area results with the one of the
OECD countries allows more comparability, since the latter generally involve the most
developed countries31
. Moreover, in the list of OECD there are most of the countries present
also in the Euro Area, which means that the differences in the two lines in the figure is
represented by countries that are in the OECD list but not in the Euro Area: being the OECD
line lower compared to the other implies that in the Euro Area the number of commercial
bank per population is higher than in other developed countries.
All in all, it is possible to affirm that the banking sector is significant in Europe (bank-
biased), as it has been measured using the income and population of the respective countries.
However, it is not possible to conclude that the banking sector is too large, as it should be
compared to other sectors in the economy. Indeed, other markets (bonds and equity) should
increase in size whenever institutions improve32
. This phenomenon interested a lot of non-EU
countries during the years. On the contrary, the EU became more bank-based when
institutions improved.
As shown in Figure 9, the financial structure of some countries of the world, measured by
taking the ratio between stocks and bonds market and bank credit, is plotter over fifteen
years: in the bottom left side of the graph there are most of the European nations, showing
that the equity and bond market values are low compared to the bank credit. Moreover, the
structure of the system has not moved towards a market-based system, but has rather
reinforced its bank bias.
31 Australia, Austria, Belgium, Canada, Chile, Czech Republic, Denmark, Estonia, Finland, France,
Germany, Greece, Hungary, Iceland, Ireland, Israel, Italy, Japan, Korea, Latvia, Lithuania,
Luxembourg, Mexico, Netherlands, New Zealand, Norway, Poland, Portugal, Slovak Republic,
Slovenia, Spain, Sweden, Switzerland, Turkey, United Kingdom, United States. Source: OECD 32 Laporta R., Lopez-de-Silanes, F., Shleifer, A., “Law and Finance”, 1997

23
Also, the next figure represents the financial structure of some countries of the world in 2011,
the last year of observation of the previous figure. The financial structure is measured with
the same indicator as before:
Figure 10 Financial structure of European and other countries (2011)
Source: Reports of the Advisory Scientific Committee, “Is Europe Overbanked”, 2014
As all the black lines represent EU countries, it is clear that in most of the cases the
combination of bond and equity markets are lower compared to the banking industry, with
respect to the world. The only two exceptions are represented by France and Belgium, as they
both share more advanced markets both for bonds and equity.
It is true that bank-based economies have the advantage of decreasing transaction costs due to
their ability to gather data and subsequently monitor their client, thus mitigating the
asymmetries of information in the market (also mentioned in the previous section). On the
other side, systems that are overbanked have some drawbacks. For instance, literature
Figure 9 Financial Markets over time (1995-2011)
Source: Reports of the Advisory Scientific Committee, “Is Europe Overbanked”, 2014

24
suggests that bank-based economies perform slightly better during normal business cycle, but
suffer more and take more time to recover33
.
Another issue that could hamper financial stability, at least in principle, is related to
competition across credit institutions in systems where there is higher supply than demand for
banks. Also here literature presents different theories34
: the traditional “competition-fragility”
view states that competition of banks erodes market power and decreases margins. Banks,
therefore, have more incentives to take more risks in order to increase their returns. A more
recent view, the “competition-stability” view, supports instead the idea that the higher the
market power in the loan market, the higher is the risk for banks. This is because an increase
in interest rates makes it harder for customers to repay their loans; this could raise the interest
of the borrowers to invest into riskier projects, thus increasing moral hazard (as stated in the
first section, moral hazard should be reduced by the presence of financial intermediaries, not
increased). The result of this study embraces both theories. On one side, banks with higher
market power happen to have portfolios with higher risk. However, credit institutions that
have the highest market power are also the ones that end up with lower risk exposures
overall, due to the fact that they hold more capital, on average35
.
One of the most recent views regarding the matter of overbanking has been given by the ex-
Chair of the Supervisory Board of the ECB Danièle Nouy. According to her, there is no clear
definition of overbanking, and it could mean both that there are too many banks as well as
that there are too many weak banks that do not exit the market36
. In this situation, profits are
squeezed and banks are not able to build up enough capital. From here, they could decide to
engage in risky activities and to threat financial stability (similar to the “competition-
fragility” view previously mentioned). Overbanking might also mean that the banking sector
is too large compared to other sectors of the economy. This would cause distortion in human
capital, as the banking sector attracts people that could have worked in more productive and
efficient sectors. Another interpretation of overbanking refers to the presence of too many
assets in the sector, implying that the economy is over-indebted.
33 Gambacorta L., Yang J. “Financial Structure and Growth”, Bank of International Settlement 2014 34 Berger A., Klapper L., Turk-Ariss R., “Bank competition and Financial Stability” Policy Research
Working Paper 2008 35 Berger A., Klapper L., Turk-Ariss R., “Bank competition and Financial Stability” Policy Research
Working Paper 2008 36 Banking Supervision Speech, “Too much of a good thing? The need for consolidation in the
European banking sector” September 2017

25
In the light of all, the concept of overbanking appears to be complex to identify and analyse,
as there is no current normative for a threshold indicating that the banking sector is “too
much”. However, what is sure is that a lot of banks in the Euro Area are not able to earn their
cost of capital37
, which means that there are too many banks for the number of customers.
1.4 Consolidation in the Banking Sector
The presentation of the banking sector features in the Euro Area suggests that such a high
number of banks in the market cannot last forever; indeed, if a market is overcrowded, some
players must exit the market. However, with banks the situation is more complicated, as
failure of a credit institution might represent one of the causes for a potential crisis.
Moreover, mainly after the 2008 crisis, the banking sector has undergone several changes in
terms of new regulations (Basel III, CRDIV, BRRD), new challenges in terms of competitive
framework and the need for digitalisation in order to survive. Individual banks could struggle
in this specific market condition: they should review their business models, try to earn profits
in a world of low interest rate environment, invest their capital to modernize their systems.
All these actions could lead potentially to a bank failure.
The first problem that arises if a credit institution fails derives from the strong
interconnectedness among banks, and the failure of one could in principle cause the failure of
others. This, of course, would have serious consequences in the economy. Secondly, if a bank
fails, confidence in the banking sector might be immediately undermined, and this could pose
threats to the stability of the system as a whole. A lack of confidence in the system could, in
turn, easily become a crisis. Fortunately, the recent creation of the Single Resolution
Mechanism (already mentioned in Section 1.2) could hopefully smooth the process of
banking failure.
Having mentioned this, exiting from the market is not the only practice possible in order to
try to solve the issue of overbanking. Certainly, bank mergers and acquisitions could as well
37 Banking Supervision Speech, “Too much of a good thing? The need for consolidation in the
European banking sector” September 2017

26
play a pivotal role by reducing the size of the sector and by increasing efficiency of the
remaining players38
.
There is evidence that the banking sector is undergoing a process of consolidation since the
90s. As shown in Figure 11, within ten years of observation in Europe the amount of M&A
deals (in US$) reached the peak in 2000 for all the categories, and then decreased but
remained stable over the years. The yellow line, that represents France, Germany, Italy and
Spain is the category characterised by the highest number of deals compared to the other
countries in Europe (one example could be the merger between Paribas and Banque National
de Paris in the year 2000). The result could have been predicted, as those countries are the
ones with the highest number of credit institutions that suffered from high competition levels
and were “forced’ to merge or being acquired by another institution.
Figure 11 M&A value in Europe (1998-2004)
Source: Figueira C, Nellis J., “Bank M&A activity in the EU: much ado about nothing?”,2007
In theory, the reason for a merger or an acquisition should be the one of increasing
shareholders value. However, not always there is evidence that M&A activity actually leads
38 Banking Supervision Speech, “Too much of a good thing? The need for consolidation in the
European banking sector” September 2017

27
to this result. On the contrary, there are studies that show how mergers and acquisitions do
not increase at all the level of profitability and efficiency of banks.
More in detail, a paper carried out by studying some M&A activity in Italy during 1985-
1996 stresses the fact that large and more efficient banks buy the smaller and inefficient ones.
In this paper, mergers and acquisitions have been separated and therefore also results are
different. For acquisitions in the Italian market, the main purpose seems to be the one of
improving the loan portfolio situation of the acquired institutions, whereas the mergers`
motives could be related to the quest for improvement of services. In terms of profitability
(measured through ROE and ROA), there are no improvements in the years after the merger,
while after an acquisition profitability drops on average. Efficiency, measured through labour
and operative costs over gross income, decreases since all costs rise and remains permanently
higher in mergers, but it has no impact on acquiring banks after the acquisition. 39
Another element that is worth mentioning regarding consolidation refers to the differences
between domestic (or national) M&A activity, and the cross-border one. There are many
observations for domestic transactions in Europe since the early 90s, but very few for cross-
border ones, as Danièle Nouy highlights in her speech regarding the issue of overbanking in
Europe and the consolidation process in the banking sector. Notwithstanding the fact that
financial and economic integration have reached a peak in the latest years, there are no signs
of cross-border activity between banks.
There might be several obstacles related to cross-border activities. For sure they are riskier
than the domestic ones as some barriers across different countries still remain, such as the
language. Cross-border M&As are also more expensive, difficult to coordinate and complex
for value creation. The participants must be confident that the after-merger or acquisition
would create value, which is difficult in a situation where non-performing loans are still high
within some regions, business models are not entirely sustainable and some categories of
assets still represent almost a mystery40
. Therefore, the fundamental element that would push
39 Focarelli D., Panetta F., Salleo C. “Why do banks Merge”, Journal of Money Credit and Banking
2002 40 Banking Supervision Speech, “Too much of a good thing? The need for consolidation in the
European banking sector” September 2017
28
credit institutions to merge across border is confidence in the economic value those mergers
could generate, and apparently, there is a lack of it.
However, cross-border mergers would not just solve the issue of overbanking, but would
rather be useful for customers, as they would have more option to invest, more source of
funding as well. Furthermore, the principle of diversification is essential in finance and for
credit institutions. Cross-border M&A would help banks to diversify portfolios so making
them safer.
In the next Chapters a study of M&A activities in the in Europe area will be carried out on
the basis of real banking data, and the main purpose is to analyse the characteristics of those
mergers and acquisitions in terms of specificities and potential gains, especially in terms of
efficiency.
41 The European Central Bank has the duty to provide its opinion regarding modifications,
amendments and entrance of new laws and systems that could potentially change the banking sector 42 Opinion of the ECB, 24th March 2016 on the reform of cooperative banks, a guarantee scheme for
securitisations of non-performing loans and the lending capacity of alternative investment funds 43 Italian Banking Association Annual Meeting, Speech by the Governor of Italy Ignazio Visco, 10th
July 2018
Box: The Italian Credit Cooperative Reform
In 2016, the Ministry of Finance and Economic Affairs completed the Decree-Law No 18 of
February 2016 regarding Italian “Banche di Credito Cooperativo” (also known as BCCs).
The Decree-Law, that under the Italian legal system must be adopted by the Government and
sent to the Parliament the same day for the conversion within 60 days (otherwise declared
invalid), concerns the Italian system of banks and their re-organization, and therefore is also
in the interests of the ECB41
.The main purpose of the Decree-law is to make the Italian
banking system more transparent and efficient in terms of government standards, and to
eliminate weaknesses present in the BCC structure42
.
Indeed, the Governor of Bank of Italy Ignazio Visco highlights that the Italian banking sector
has struggled for several years, and smallest institutions were the ones that suffered more in
terms of capital requirements, liquidity, regulations and so on43
. Therefore, the practice was
to resolve banks through acquisitions by other banks in order to improve efficiency and be

29
44 Opinion of the ECB, 24th March 2016 on the reform of cooperative banks, a guarantee scheme for
securitisations of non-performing loans and the lending capacity of alternative investment funds
recapitalized in a proper manner, being the other alternative liquidation. Even though small
banks do not have impact in the economy, the resolution of several Italian banks would have
for sure significance consequences on depositors and reputational damage to the country.
Therefore, in order to raise the economic and financial strength of a big portion of the Italian
banking system characterised by credit cooperatives, the solution concerns the creation of
three different BCC groups (each led by a parent company), to which most of the
cooperatives must adhere within a specified period of time.
More in detail, each BCC must44
:
Join a Cooperative Banking group or, under certain circumstances transform into a
Joint Stock Company (S.p.A.)
Bigger BCCs (total assets higher than 200 Mln €) might decide not to join any of the groups,
but will be forced to change their legal structure to an S.p.A. and to pay 20% more of
extraordinary taxes on their reserves. Moreover, the BCCs that do not enter any group nor
change their legal structure must be liquidated.
Each of the newly created groups must be incorporated as a Joint Stock Company
(S.p.A.) that has net assets of at least 1 Bn €. The primary function of the parent is to
manage and coordinate the BCCs according to the “cohesion contracts”, that set out
the powers of the power company, such as:
o Implementing strategic orientation and operational objectives of the
group, adjusted according to the BCC in question;
o Approve or reject the appointment of one or more of the BCC board
members (under certain circumstances) up to the majority of the
members;
o Expel a BCC from the group, in case of a serious breach of the
cohesion contract.
Other amendments of the Decree-law No 18 of February 2016:

30
45 “Reform of Italian Cooperative Credit Banks”, February 2017
https://www.lexology.com/library/detail.aspx?g=33f91f17-d272-471a-b1ef-e56d7d14a1d1 46 https://www.ilsole24ore.com/art/notizie/2018-11-14/nuovo-vertice-palazzo-chigi-conte-e-
vicepremier-bcc-112839.shtml?uuid=AEM3mggG&refresh_ce=1
Changes in the capitalisation of individual BCCs, so that the maximum share capital
that can be held in a single bank by one shareholders raises up to 100 000 € (it was 50
000 € before) and the minimum number of shareholders to form a BCC raised up to
500 (instead of 200).
All the above mentioned actions need the approval of the national competent authority,
namely the Bank of Italy. It is the duty of any BCC to notify the authority of its intentions no
more than 18 months after the entry into force of the provisions, by submitting both a
proposal for cohesion contract and an indication of the group the single BCC would like to
enter45
.
Whenever the BCC groups are created and authorized by Bank of Italy, at this point the
shareholders of the various BCC have 90 days to sign the adhesion contract and to declare,
therefore, to which of the groups the single institution would like to enter.
However, the newly established Italian Government decided to freeze the Italian BCC reform
during the third quarter of 2018, when the small credit cooperatives were supposed to sign
their cohesion contracts and to declare their choice with respect to which group to join.
Indeed, the government succeeded in obtaining an amendment in the law which requires the
BCC to sign their adhesion contracts not within 90 days, but in 180. This means that there has
been a postponement of three months for the new setting of the Italian banking sector.
The deputy prime ministers of the Italian government, Matteo Salvini and Luigi Di Maio,
have strengthened their position against the reform, as they believe that the cooperative banks
are extremely tied to the territory they are located. According to them, the BCC reform would
cancel the advantage of these credit institutions, namely the territorial nature and mutuality46
.
They claim that during the crisis the Italian cooperative banks were the ones that still were
able to grant credit to households and small enterprises. Therefore, an alternative to the
reform would include some interventions aimed at improving the profitability and efficiency
of this sector.
Partially in agreeing with this view is the Professor and Economist Giovanni Ferri, who
believes that it would be hard for the single BCCs to keep a certain degree of autonomy and
31
47 http://www.vita.it/it/article/2016/02/15/riforma-bcc-attenzione-a-non-cancellare-un-
modello/138305/ 48 Opinion of the ECB of September 2018, on the amendments to the reform of popolari banks and
cooperative banks 49 Opinion of the ECB of September 2018, on the amendments to the reform of popolari banks and
cooperative banks
to still play a pivotal role in the economy of their territory. Moreover, the Professor Ferri does
not agree with the rules that the cooperatives who decide not to adhere to any group would
have to apply. The “opting out” clauses are not proportionate and practically force all the
credit institutions that have the choice not to enter any group to do so, in order to avoid the
extremely high taxes and the change of company form. However, he also states that the
reason why credit cooperatives are struggling in the market is in primis related to the unstable
economies of the territory. Whenever a cooperative bank injects credit to a territory, and the
territory itself fails, inevitably the bank will have trouble as well. For this reason, he
concludes that the reform is necessary for the country47
.
Apart from the different viewpoints presented, the postponement of the reform might create
uncertainty: not only at national level, but also at the European one. On this matter, the ECB
provided its opinion with respect to the decision of the amendment48
, by stating that the most
important objective to be preserved in the Law 18/2016 is the adaptation of the small BCCs
into bigger groups. Moreover, the ECB stresses also the importance of the reform itself, as it
is aimed at addressing the vulnerabilities of the Italian cooperative sector, and in particular
the ability to absorb shocks and to become more efficient49
. In few words, the European
Central Bank is in favour to the reform and wishes that notwithstanding the amendments the
Government requested, the law will be implemented, so the small BCC will be part of bigger
and safer credit institutions.

32
Chapter 2: The analysis of banks involved in M&A transactions
2.1 Differences between Mergers and Acquisitions and how they are treated in the
analysis
This Chapter is going to focus on the study of mergers and acquisitions of a sample of banks
classified as Less Significant Institutions under the Single Supervisory Mechanism. The next
sections will provide a descriptive analysis of the credit institutions that have merged with or
been acquired by other institutions, with a focus on the most critical variables that mark the
performance of such banks.
Merger and Acquisitions are two transactions that are used in a strategic way to possibly
increase the value of the company for the stakeholders50
. The terms merger and acquisition
are often used interchangeably, but the two transactions have some differences. First of all, in
legal terms, a merger is defined as two or more companies joining together while an
acquisition occurs when one company buys shares of another company to achieve a
managerial influence51
.
Secondly, when speaking about mergers, the nature of the decision to form a new entity must
be mutual. There is the need of the approval of the Board of Directors of a company in order
to enter into a merger, whereas this is not the case for acquisitions. Indeed, these transactions
could be differentiated in “friendly” acquisitions or “hostile” acquisitions (also known as
hostile takeovers). Usually, also the scenarios for mergers and acquisitions are different. In
mergers, it could be the case that companies that have similar terms (size, importance,
positioning in the market) decide to merge and to form a new entity. This is usually done in
order to facilitate the share information, resources (IT resources for instance) and
technologies or to gain more market power within a specific industry. On the other side,
when dealing with acquisitions, it is more probable that the acquiring entity is larger and
stronger than the acquired one.
50 Abrams, H., “Mergers and Acquisitions: how do you increase the value of two companies joined
together?”, 2013 51
European Central Bank, “Mergers and Acquisitions involving the EU banking industry: facts and
implications”, 2000

33
However, it must be noted that the abovementioned differences in mergers and acquisitions
are not well perceived and observed in practice: on one side, the word “acquisition” is viewed
negatively and for this reason some companies claim that they are conducting a merger while
in reality is an acquisition. On the other side, it is very uncommon to find two companies in
an industry that are very similar in terms of size, share of the market and that have intention
to merge rather than compete52
.
In the light of all, this dissertation is going to consider mergers and acquisitions without
distinguishing the differences concerning the nature of the transaction, since the main
purpose of the analysis is to understand the general characteristics of credit institutions that
enter into such activity under an analytical point of view, and not in terms of process or
changes in ownership and management structure. Moreover, the study regarding efficiency
that will be presented in Chapter 3 does not require mergers and acquisitions to be classified
differently, as the final goal is to investigate how credit institutions perform in the periods
after the actual operation.
2.2 The dataset
The data used in order to perform the descriptive analysis has been gathered by mainly three
sources, namely SNL Financial database, Eurostat and Legal Entity Identifier Search. The
former provides industry-specific financial market data, by including sector-specific
performance metrics and financial statements as well as mergers and acquisitions data. Also,
the SNL database allows the user to select multiple financial statements` items both from the
Balance Sheet and Profit & Loss statements of the single entities that are under analysis.
Eurostat, instead, has been used in order to integrate some regional specific data linked to the
headquarters of the credit institutions under analysis. Finally, in order to link the information
from SNL Financials to Eurostat, Legal Entity Identifier Search has been consulted. This
database provides up-to-date information regarding the LEI codes53
of credit institutions. LEI
52 Investopedia Dictionary, “What is the difference between Mergers and Acquisitions?”, https://www.investopedia.com/ask/answers/021815/what-difference-between-merger-and-
acquisition.asp 53 Codes made of numbers and letters (usually 20 characters) to identify distinct legal entities

34
codes are 20-character long containing both numbers and letters, each of which is unique for
identifying legal entities that participate in financial transactions. However, for the scope of
this dissertation, data has been used in order to gather information regarding the location of
banks (headquarters).
The sample involves credit institutions classified as Less Significant Institutions that entered
into an M&A transaction between January 2015 and June 2018. The main reason for the
choice of the period of analysis is related to the birth of the Single Supervisory Mechanism
that allowed the distinction of credit institutions in Significant and Less Significant. The
summary statistics for the sample are presented in the following table:
Table 1 Summary statistics for M&A
Source: SNL Financial, author`s computation
Even though the study is concentrated in four years, it emerges from the table that the SSM
LSI banking sector has undergone some changes due to the elevated number of M&A
transactions, in total 222. It must be mentioned that this number is referred to the M&A
involving credit institutions that exist in the database SNL and not to the total number of
M&A in the LSI world, which means that the actual number is even higher. Also shown in
Table 1 is the number of credit institutions involved in transactions for each of the years of
analysis. For 2016, 2017 and 2018 the number of banks involved (third column) is more than
the double compared to the number of M&A (second column). This means that in these years
some transactions experienced that acquirer entities buy more than one credit institution that
we can refer to as acquired.

35
Moreover, the table displays the countries where M&A transactions took place, for each year
of observation54
. There is no surprise that Austria, Germany and Italy are the ones that appear
the most (>90% of M&A), since these are the countries with the highest concentration of
Less Significant Institutions (84% at the end of 201655
). Therefore, these countries are also
the ones that could possibly be overbanked, as discussed in the previous chapter, and for this
reason the phenomenon of M&A is more common. Finally, in the dataset there is no presence
of cross-border mergers.
In terms of size of the sample, Table 2 shows the sum of the total assets of the credit
institutions (both acquirer and acquired entity) that entered into a merger or acquisition
during the years of analysis.
Table 2 Total Assets of M&As
Source: SNL Financial, author`s computation
The size of the M&A transactions between 2015 and 2018 is equal to € 592.85 Billion
overall. Table 2 shows that the sum of total assets is the highest in 2017 with € 272.74
Billion; this is also the year with the highest number of mergers and acquisitions (107). On
the other side, both 2015 and 2018 report the lowest amount of assets involved due to the
lower number of transactions. However, it is worth mentioning that despite 2018 reports only
17 M&A compared to 2015 that instead counts 22, the sum of total assets is higher in 2018.
This means that the credit institutions involved are bigger in size. Indeed, the average size of
banks for the different reported period increases. While in 2015 the average total assets of an
acquirer was equal to 1.5 bln €, it reaches 3 bln € in 201856
.
In Table 2 is also possible to notice the discrepancy in terms of size between acquirer and
acquired entities over the years. The sum of total assets of acquirers, in fact, is bigger than the
one of acquired entities for all the years of observation. While in 2015 the difference between
54 Data of acquired entities are missing for Spain, France and the Netherlands 55 European Central Bank, “LSI supervision within the SSM”, November 2017 56 Author`s computation

36
the two sums is the highest (TA of acquirers is 4 times the one of acquired), it decreases over
the years (TA of acquirers is 1.2 times the one of acquired). This is true also when looking at
the averages of data. While in 2015 acquirers were on average 3.5 times bigger than acquired,
in 2018 the discrepancy disappears. This suggests that the differences in terms of total assets
between the acquirers and the acquired entities in the sample have decreased over time.
All credit institutions can be classified according to a business model, which is a definition
aimed at distinguishing banks on the basis of the prevalent activities they carry out. For
instance, the difference between retail and wholesale banking is crucial to understand: while
the former is a model for which credit institutions provide services mostly to individuals
(legal persons) and small enterprises, wholesale banking is more focused on services for large
businesses (also international), institutional customers, high net worth investors. While the
retail banks make small profits for a large volume of transactions, wholesale banks typically
make higher profits but for a lower amount of transactions.
In the world of Less Significant Institutions, credit institutions are small and generally
operate on a regional basis. Therefore, it is appropriate to state that their business models are
more retail-oriented. In the dataset, there is also room for a further breakdown of banks on the
basis of the different legal structures. Determining the different legal structures is not a
complicated task, as it could be done by simply looking at name of each institution. For
instance, most of the Italian banks have “Credito Cooperativo” or “BCC” inside their name,
so they can be classified as Cooperative banks. Moreover, in Germany and Austria, all credit
institutions that have in their name “Raiffeisenbank”, “Volksbank” or “VR” (abbreviation for
Volksbank-Raiffeisenbank) are Cooperative Banks as well. Cooperative banks could also be
recognized in Germany by two letters at the end of some credit institutions, namely “eG”.
This is an abbreviation for “eingetragene Genossenschaf”, which means “registered
cooperative society” under German Law. The ones that, instead, have in their name
“Sparkasse”, “Kreisparkasse” or “Stadtsparkasse” are translated into Savings Banks. Finally,
for Spanish credit institutions, the words “Crédito Cooperativo” and “Caja Rural” indicate
that those banks are again cooperatives.

37
Savings and Cooperative banks have an important role in the banking system in several
countries of Europe such as Austria, Germany and Italy. The banks belonging to these sectors
are considered “unconventional”, because of their business model and features57
. In
Germany, both savings and cooperative banks date back to the 19th
century, and they became
so popular that they expanded also into the adjacent countries. A peculiarity of these sectors
in Germany is that they kept most of principles and regulations for more than 200 years, until
today. Indeed, savings and cooperatives still adhere to the “regional principle”, according to
which banks cannot compete with others in the same banking group. Cooperation rather than
competition allows the creation of networks within a group, not by law but by choice as
institutions are still considered independent. Again, cooperation helps those small credit
institutions to share costs but at the same time to provide several services to the customers.
Austria has followed a similar pattern. Both cooperatives and savings represented the greatest
slice of the country`s banking sector in terms of number of institutions. However, during the
20th
century Austrian savings ceased to adhere to the regional principle, and credit institutions
started operating on a larger scale, namely on a national level. Other reforms of those years
allowed savings to split into different legal forms changed radically their business model, so
that the real savings bank sector does not exist anymore.
In Italy, both savings and cooperative banks have been built up on the German model, but the
sector did not become as strong as in Germany. On the contrary, the small credit institutions
operating on a regional level were struggling with issues related to profitability and
efficiency58
. During 1990s the Italian law imposed the privatization of the savings bank
sector59
, and the entities were transformed into Joint Stock Companies (S.p.A.). As the case
of Austrian savings, the regional principle was abolished and savings started to offer their
services on a national level. Instead, the cooperatives have survived over the years, and
notwithstanding the issues related to profits and efficiency, they still operate on a regional
basis. During the last couple of years, however, the reform of the BCC has required all the
smallest cooperatives to join one of large banking group, as an attempt to restore the
conditions of those banks.
57Bülbül D., Schmidt R.H., Schuwer U. “Savings Banks and Cooperative Banks in Europe”, Goethe
University 58 Bülbül D., Schmidt R.H., Schuwer U. “Savings Banks and Cooperative Banks in Europe”, Goethe
University 59 Law n.218, 30.07.1990, known as Legge Amato-Carli

38
The following table (Table 3) displays the classifications into sectors and the average size of
the banks included in the dataset.
Table 3 Sectors and average size of credit institutions involved in M&A
Source: SNL Financial, author`s computations
It is clear that the majority of the institutions involved in M&A activities belong to the
cooperative sector. Indeed, 85% of the sample in terms of number of banks and 76.4% in
terms of total assets fall under this category. The number of savings banks, on the contrary,
amounts to 12.5%, while 15% is the percentage of total assets of banks with respect to the
total of the sample. Finally, the table shows the remaining institutions that were not classified
into a sector, and as referred to as others. In terms of the share of assets, the banks that fall in
this residual category sum up to around 9% of the total.
Table 3 shows also the average size of the credit institutions on the basis of the sector, and
interesting results emerge. Comparing the three sectors, the biggest banks in the sample
belong to the one classified as others. On the contrary, cooperatives and savings are smaller
and more similar between each other, on average. This could be partially explained by the
regional principle exposed above, as banks classified as others are not bound to adhere to it.
When comparing cooperative banks across countries, it emerges that German banks are the
smallest as their average size does not reach 1 bln €, whereas the country that has the biggest
cooperatives is Austria, with an average size of 4 bln €. Austrian cooperatives are greater not
only compared to cooperatives of other countries, but also to the average size of the whole
sample, which is around 3 bln €. Another interesting comparison across countries is in the
“others” column, for average of total assets. Indeed, the Dutch acquirer entity is, on average,
8 times bigger than the Italian and Slovakian one as well as 2 times bigger than the French
acquirer.

39
One last interesting piece of information can be extrapolated by comparing the average total
assets of banks among different sectors. This can be done only for Germany, the sole country
in the sample with banks belonging to all sectors. Again, it is clear that cooperatives are very
small, also compared to the other banks in the country belonging to the other sectors
(institutions under the category of others are 9 times bigger than the cooperatives).
During the 1970s, Eurostat created some codes, called NUTS (Nomenclature of Territorial
Units for Statistics), in order to identify and divide the European territory into smaller regions
and to facilitate some regional and specific analyses. There are three levels of NUTS:
NUTS1, NUTS2 and NUTS3, as shown in Figure 12.
Figure 12 Representation of NUTS
Source: Eurostat
NUTS1 corresponds to major socio-economic regions, and counts 104 different areas in
Europe, NUTS2 are basic territories for the application of regional policies, and are 281 in
total, while NUTS3 represent small regions for specific diagnoses and are currently 134860
.
Therefore, NUTS3 is the most detailed and is the one used in order to locate the LSIs in the
sample.
The distinction into regions is based on two principles: first, the population within a specific
area. Indeed, the NUTS Regulation also defines some quantitative threshold for minimum
60 Eurostat website: https://ec.europa.eu/eurostat/web/nuts/background

40
and maximum population. Second, the division in areas also takes into account the
administrative divisions of each state: this is done mainly for practical reasons and facilitates
the presence and availability of specific data.
Figure 13 displays the locations of the banks that are in the dataset and their sectors, not
accounting for the year of their merger or acquisition. The blue colour is for cooperative
banks, red represents savings banks and orange are the ones that are the ones classified as
“others”. Moreover, the size of the bubbles depends on the total assets of the credit
institutions61
, so that the biggest bubbles reflect the biggest banks in the sample.
Figure 13 Banks` locations and Sectors
Source: Eurostat, SNL Financial, author`s computations
Notes: the three colours represent the sectors of banks, while the size of the bubble reflect the
institutions` total assets the year prior to the M&A. Due to missing data, the n. of observation is 396
The first element that is worth to notice is the fact that the majority of the banks are situated
in Germany, Italy and Austria, as anticipated previously. Secondly, it is clear that the number
of cooperatives is the highest, as the blue colour is the most numerous and appears in most of
61 Total Assets of the year before their merger or acquisition

41
the countries, while savings banks are located only in Germany. It is also telling that,
comparing the sizes of the bubbles according to their colour, there are several blue dots that
are significantly smaller compared to the others. Indeed, cooperative banks are smaller than
the other banks, on average. Even though the orange bubbles - representing the not classified
entities in the sample - are very few, they are the biggest in terms of size.
In Italy, the biggest banks in the dataset are Banca di Credito Cooperativo di Roma - Società
Cooperativa and Banca Popolare dell'Alto Adige SCPA, both cooperatives. In Germany,
instead, the biggest are: Frankfurter Volksbank eG (cooperative), Sparkasse Saarbrücken
(savings) and LBS Landesbausparkasse Südwest (others). Austrian banks are smaller on
average, but the biggest in the sample is Raiffeisenbank Kitzbühel - St. Johann eGen and is,
again, a cooperative bank. Furthermore, the big orange bank in France is Rothschild & Cie
while in the Netherlands the other not classified bank is Nationale-Nederlanden Bank N.V.,
the biggest of our sample in terms of total assets. Finally, it is worth specifying that all those
entities are classified as acquirers in the analysis.
NUTS3 is not limited only to the separation Europe into different regions. Indeed, all the
areas that are covered by NUTS are also classified according to an urban-rural typology,
aimed at distinguishing areas on the basis of their characteristics. More in detail, Eurostat
follows the OECD methodology to define a typology, which takes into account mainly two
factors: administrative units and population share62
. This approach ends up with the
classification of region as:
Predominantly Urban (PU)
Intermediate (IN)
Predominantly Rural (PR)
The largest cities fall under the category of urban, while the areas where low density of
population and administrative units are the rural ones. The intermediate category is the mixed
one, characterised by cities and countryside. This classification is interesting for the purpose
of our analysis, as it indicates the areas with the greatest density of M&A.
62 Eurostat website: https://ec.europa.eu/eurostat/statistics-explained/index.php/Archive:Urban-rural_typology

42
The following figures represent the urban-rural typologies of acquirers on the left and
acquired on the right. The blue dots are the banks in regions classified as predominantly
urban (PU), the red dots are the ones classified as intermediate (IN), while green bubbles are
the predominantly rural (PR) regions. Again, the size of the bubbles indicates the total assets
of the credit institutions.
Figure 14 Urban/Rural Typology of Acquirers
Figure 15 Urban/Rural Typology of Acquired
Source: Eurostat, SNL Financial, author`s computations
Notes: the three colours represent the typologies of regions, while the size of the bubble reflects the institutions`
total assets the year prior to the M&A.
First, the map on the left displays more banks with greatest bubbles, as acquirers are on
average bigger in size compared to the acquired. Second, in both pictures the red dots are
predominant, which indicates that most of the banks are located in areas classified as
Intermediate. The following table shows the distribution of the mergers and acquisitions
divided according to the urban-rural typology in numbers.

43
Table 4 Rural-Urban typology for M&A credit institutions
Source: Eurostat, SNL Financial, author`s computations
The first interesting result concerns the fact that both for acquirers and acquired entities, the
majority of M&A take place in the areas classified as intermediate. At the second place we
have rural areas and finally banks in urban regions. However, the situation changes when
looking at the sum of total assets of those banks. The third column shows the sum of the total
assets of the acquired entities in the three typologies, and it`s clear that the smallest banks, on
average, are found in the rural areas, compared to the other two. This is because while the
number of acquirers is the second highest in PR areas, the sum of assets is the lowest. The
situation is different for acquired entities; here, banks that are situated in the rural areas have
the greatest sum of assets, while for PU typology the assets are the lowest. Overall, the region
with the highest value of M&A in terms of assets (acquirers and acquired entities together) is
the Rural, followed by Intermediate and finally Urban.
In order to deepen the knowledge of the credit institutions involved in mergers and
acquisitions in the sample and to attempt to understand the pattern of these transactions,
several variables related to the banks` performances will be analysed.
2.3 Analysis of profitability, solvency, asset quality and efficiency in M&A
The following section is going to describe the main features of M&A activities and of the
banks that enter into such operations. More in detail, variables for profitability, asset quality,
solvency and efficiency are going to be evaluated to understand the position of credit
institutions for the years between 2014 and 2018.

44
In terms of profitability, the indicators that are the most useful to understand how effectively
a credit institution is managing its capital position and assets are, respectively, Return on
Equity (RoE) and Return on Assets (RoA). While the numerator is identified in the Return
after Tax and is identical for both ratios, the denominator is different. Equity, in banks, is
represented by equity capital, which is aimed at avoiding that a credit institution takes
excessive leverage and becomes insolvent.
RoE aims at measuring the shareholders` rate of return on their investment in the company,
while RoA measures the operating efficiency for the company based on the bank`s profits
from its total assets63
. As credit institutions are financial intermediaries that provide several
services to the public and serve an important role in the economy, banks` capital is highly
regulated (Basel III). In this analysis, the denominator for RoE is the total equity. Instead, for
RoA, the denominator is represented by total assets, that have already been introduced in the
previous sections. Figure 16 and Figure 17 compare the two profitability ratios for all the
banks in the sample throughout all the years.
Figure 16 Return on Equity Figure 17 Return on Assets
Source: SNL Financial, author`s computations
Notes: There are 380 observations for RoE and 385 for RoA
The different results for the acquired category in RoE and RoA in 2015 are explained by an outlier
63 Majed Abdel Majid Kabajeh et al., “The relationhip between the ROE, ROE, and ROI ratios within
Jordanian Inruacne public companies market share prices”, Internaltiona Journal of humanities and
social science, 2012

45
When looking at the left picture, it is clear that acquirers are, on average, more profitable than
acquired entities since they have higher ratios for all the observed periods. Indeed, while RoE
for acquired entities is negative with exception of the banks involved in M&A in 2018, for
acquirers it is always positive and around 3%. As far as RoA is concerned (Figure 17), the
results are similar to the previous ones for 2015, 2016 and 2017, but in 2018 something
changes. Acquired entities have, on average, greater RoA compared to the acquirers, and the
difference between the two categories is around 90bps, which can be considered as
significant. However, one must keep in mind that the number of transactions in 2018 is lower
compared to the one of the previous years (17) and the result is mostly driven by one
acquired entity with a high RoA (9.66%). Without this “outlier” in the sample, the average
RoA for acquired entities would decrease to 0.05%.
Another important element used for the evaluation of a credit institution is the quality of its
assets. Typically, in the balance sheet of a bank the greatest portion of assets is composed of
loans, that represent the assets connected to the institution`s main source of profitability.
Indeed, whenever a bank grants a loan to a customer, it is exposed to credit risk, namely the
probability that the borrower defaults on the repayment of the loan itself. Even though banks
have the expertise to analyse and understand the soundness of potential borrowers, it is highly
probable that some of the loans granted will not be paid back. The probability of default on
the borrower side depends on several elements; among these, there is the type of borrower.
Indeed, if a bank lends money to another bank or to counterparty that has low probability of
default, then the amount of lending should be considered to be safe. On the contrary, a loan
granted to counterparty that is considered to be more risky has a higher probability of default.
Therefore, the asset quality of a bank strictly depends on the quality of customers to which
they are more exposed to.
When the customer is not able to meet its obligations, the loan becomes non-performing. Due
to the fact that until recently there was no unique regulatory framework across Europe
determining which loans (and exposures in general) are ought to consider non-performing,
the European Central Bank published a guideline in this matter, referring to the European
Banking Authority definition. According to the EBA, exposures are non-performing when:

46
A material exposure that is more than 90 days past-due
The debtor is assessed to be unlikely to pay its obligations in full without realisation
of collateral, regardless the existence of any past-due amount or of the number of days
past due64
Therefore, if there was a legal obligation to repay the credit institution and the customer did
not meet the obligation for more than 90 days, the loan is classified as non-performing.
Moreover, a loan can be classified as non-performing also with non-quantitative thresholds,
but simply if the credit institution judges the customer to be unable to repay the amount
borrowed65
.
Figure 18 shows the ratio between non-performing loans and total loans of banks, better
known as NPL Ratio.
Figure 18 Non-performing Loans Ratio
Source: SNL Financial, author`s computations
Notes: there are 185 observations for this variable
In this figure, the difference between acquirer and acquired entities in terms of asset quality is
quite clear. With the exception of 2015, where acquired banks shows lower ratios on
average66
, in all the remaining periods acquirers result to have a better asset quality than the
others. Especially in 2016, there the average NPL Ratio for acquired banks is 11.75% and is
64 European Central Bank, “Guidance to banks on non-performing loans”, March 2017 65 Banks have both pre-defined automatic events as well as manual events in place to determine
whether the customer is unlikely to pay (UTP) 66 Missing data for the acquired entities

47
the highest in the whole sample. Moreover, in 2018 the difference between the two categories
of banks is around 6.7% and is also the highest. By comparing this data with the official ECB
statistics, other results emerge: Q4-2017 aggregate data for Less Significant Institutions
indicate that the average NPL Ratio is equal to 3.83%67
. By comparing this figure with the
averages of our sample, it results that not only acquired entities, but also acquiring banks
appear to have lower quality of assets for 2016 and 2017 (7.15% and 7.5% respectively).
Finally, contrary to the previous figures of RoE and RoA, where the pattern indicated a
convergence of indicators over time between acquirers and acquired, it is not the case for
NPL Ratio.
The ability of credit institutions to operate in the system is not only determined by
profitability; efficiency is an important factor that determines the capability of a bank to
generate enough income by using its resources68
in order to cover for expenses. This, in turn,
distinguishes the banks that are sustainable in the medium-long term to the ones that are not.
In a banking sector where income margins are squeezed due to high level of competition,
credit institutions have to try to keep costs under control. There are different types of costs
that banks have to deal with. First, there is the cost of funds, that is the cost associated with
the repayment of a rate to the bank`s depositors. Since the greatest portion of the profits of
banks is the difference between the interest rate they charge for loans and the interest that
have to pay to depositors, banks try to keep cost of funds the lowest possible. Staff costs
again represent a great portion of a bank`s expenses. Measures to cut costs in this area
include the reduction of employees` benefits or reduction of staff (also as a consequence of
automatization of operations), but there is the risk that this becomes counter-productive, and
instead of improving efficiency they end up decreasing it. Another expense is reflected in the
infrastructures, and more specifically branch costs. Branches, indeed, are very expensive in
terms of investments. In the recent years, with the great increase of digitalisation and IT
services, physical branches might not be the right solution for a credit institution that aims at
improving efficiency. In order to grow and become more efficient, banks should deploy a lot
of resources in digitalisation; even though this requires huge up-front investment, the
67 ECB website: https://www.bankingsupervision.europa.eu/banking/statistics/html/index.en.html 68 Aguenaou. S, Lahrech. A, Bounakaya. S, “Analyzing banks` efficiency as a measurement of
performance in the Moroccan context: Application of CAMEL framework”, 2017

48
resulting customer services will improve cost-efficiency69
. An additional solution to the
problem of efficiency and cost-cutting measures is the usage of M&A. Banks that have
limited possibilities in terms of organic growth might consider as a solution a merger or an
acquisition, being the alternative in an adverse scenario the one of exiting the market70
.
Cost-to-income ratio is a variable that captures the relationship between costs and operating
income of credit institutions and is shown in Figure 19.
Figure 19 Cost-to-Income Ratio
Source: SNL Financial, author`s computation
Notes: this is based on 361 observations
For all the four years of study, the cost-to-income ratio (CIR) observed is always lower for
acquiring entities than the acquired ones, which means that usually the most efficient banks
acquire the less efficient. More in detail, we see that in 2017 the target banks are the worst in
the whole sample, since the average ratio reaches 74.3%; for the same year, acquirers instead
have 69.4%. In the picture there is also another result that is worth mentioning. From 2015
until 2017, the average CIR is increasing for both acquirers and acquired entities, showing
that the cost-cutting measures that banks should apply have not worked properly.
69European Central Bank: “How can euro area banks reach sustainable profitability in the future?” 70 European Central Bank, “Too much of a good thing? The need for consolidation in the European
banking sector”, Banking Supervision Speech, September 2017

49
There is another risk that is meaningful for the survival of a credit institution in the banking
sector, namely solvency risk. Being solvent is a fundamental condition for a bank to survive
in the market. A bank is solvent whenever it is sufficiently capitalized in order to absorb
future asset shocks, with the available capital71
. As previously anticipated, regulatory capital
requirements have become more stringent for banks especially after the crisis and one of the
main areas where regulation increased is in indicators related to solvency. Indeed, according
to Basel III regulation, CET1%, a ratio composed by CET1 capital and Risk Weighted
Assets, must always be greater than 4.5%. While Common Equity Tier 1 (CET1) is the
capital that contains mostly retained earnings and common shares, Risk Weighted Assets are
assets weighted on the basis of their risk.
The next figure displays the CET1 Ratios of the banks in the sample for the years of
observation.
Figure 20 CET1% Ratio
Source: SNL Financial, author`s computation
Notes: this is based on 294 observations
As it is possible to see in the picture, the ratio is typically higher for acquirer entities than
acquired. Indeed, in the first three years of observation this is the case. The difference
between the two parties involved in M&A is not big, however it must be noticed that with
CET1% also a small number could make a difference, especially in times of crisis. The
greatest disparity between acquirers and acquired can be observed in 2015, and is equal to 71 Pierret, D., “Systemic risk and the solvency-liquidity nexus of banks”, University of Lausanne,
2015
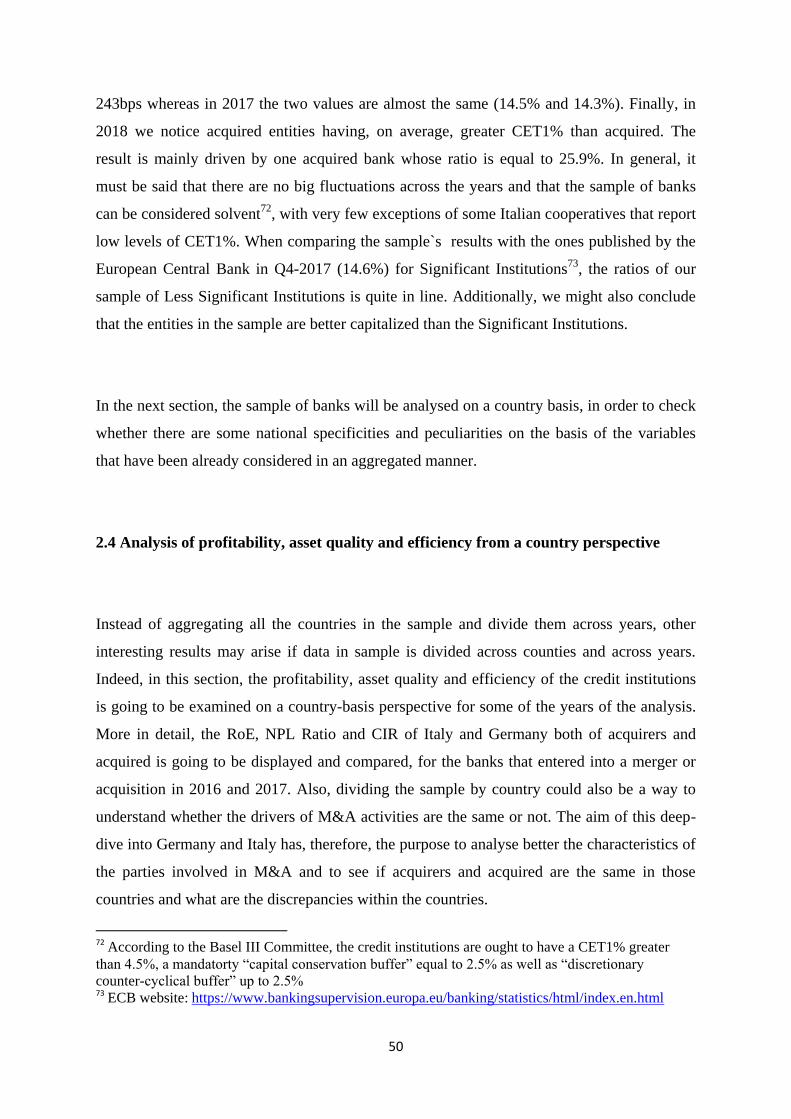
50
243bps whereas in 2017 the two values are almost the same (14.5% and 14.3%). Finally, in
2018 we notice acquired entities having, on average, greater CET1% than acquired. The
result is mainly driven by one acquired bank whose ratio is equal to 25.9%. In general, it
must be said that there are no big fluctuations across the years and that the sample of banks
can be considered solvent72
, with very few exceptions of some Italian cooperatives that report
low levels of CET1%. When comparing the sample`s results with the ones published by the
European Central Bank in Q4-2017 (14.6%) for Significant Institutions73
, the ratios of our
sample of Less Significant Institutions is quite in line. Additionally, we might also conclude
that the entities in the sample are better capitalized than the Significant Institutions.
In the next section, the sample of banks will be analysed on a country basis, in order to check
whether there are some national specificities and peculiarities on the basis of the variables
that have been already considered in an aggregated manner.
2.4 Analysis of profitability, asset quality and efficiency from a country perspective
Instead of aggregating all the countries in the sample and divide them across years, other
interesting results may arise if data in sample is divided across counties and across years.
Indeed, in this section, the profitability, asset quality and efficiency of the credit institutions
is going to be examined on a country-basis perspective for some of the years of the analysis.
More in detail, the RoE, NPL Ratio and CIR of Italy and Germany both of acquirers and
acquired is going to be displayed and compared, for the banks that entered into a merger or
acquisition in 2016 and 2017. Also, dividing the sample by country could also be a way to
understand whether the drivers of M&A activities are the same or not. The aim of this deep-
dive into Germany and Italy has, therefore, the purpose to analyse better the characteristics of
the parties involved in M&A and to see if acquirers and acquired are the same in those
countries and what are the discrepancies within the countries.
72 According to the Basel III Committee, the credit institutions are ought to have a CET1% greater
than 4.5%, a mandatorty “capital conservation buffer” equal to 2.5% as well as “discretionary
counter-cyclical buffer” up to 2.5% 73 ECB website: https://www.bankingsupervision.europa.eu/banking/statistics/html/index.en.html
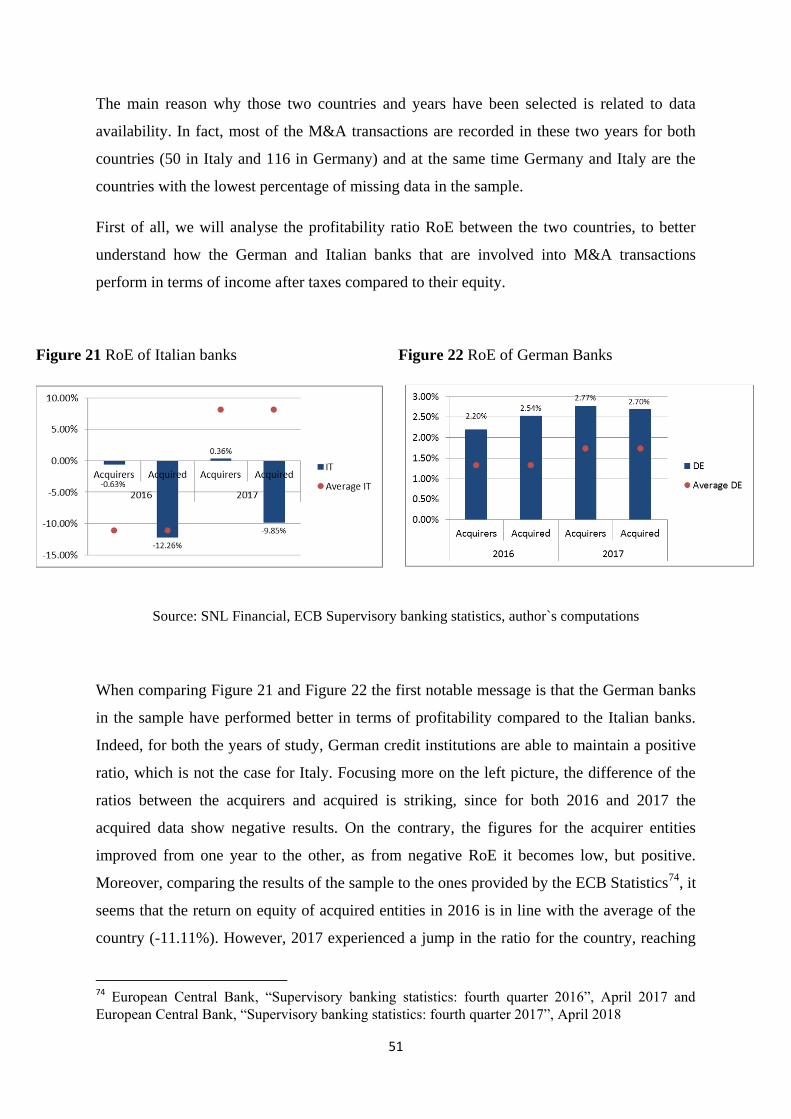
51
The main reason why those two countries and years have been selected is related to data
availability. In fact, most of the M&A transactions are recorded in these two years for both
countries (50 in Italy and 116 in Germany) and at the same time Germany and Italy are the
countries with the lowest percentage of missing data in the sample.
First of all, we will analyse the profitability ratio RoE between the two countries, to better
understand how the German and Italian banks that are involved into M&A transactions
perform in terms of income after taxes compared to their equity.
When comparing Figure 21 and Figure 22 the first notable message is that the German banks
in the sample have performed better in terms of profitability compared to the Italian banks.
Indeed, for both the years of study, German credit institutions are able to maintain a positive
ratio, which is not the case for Italy. Focusing more on the left picture, the difference of the
ratios between the acquirers and acquired is striking, since for both 2016 and 2017 the
acquired data show negative results. On the contrary, the figures for the acquirer entities
improved from one year to the other, as from negative RoE it becomes low, but positive.
Moreover, comparing the results of the sample to the ones provided by the ECB Statistics74
, it
seems that the return on equity of acquired entities in 2016 is in line with the average of the
country (-11.11%). However, 2017 experienced a jump in the ratio for the country, reaching
74 European Central Bank, “Supervisory banking statistics: fourth quarter 2016”, April 2017 and
European Central Bank, “Supervisory banking statistics: fourth quarter 2017”, April 2018
Figure 21 RoE of Italian banks Figure 22 RoE of German Banks
Source: SNL Financial, ECB Supervisory banking statistics, author`s computations

52
positive RoE and equal to 8.13%, but the credit institutions in the sample did not manage to
follow the trend, as RoE improved compared to the previous year but remained negative (-
9.85%).
In Germany, instead, the situation is completely different. Not only the figures are positive
for both acquirers and acquired, but they are also higher if compared to the average of the
country for those years (1.33% and 1.74% in 2016 and 2017 respectively). Also, by again
comparing the two groups of entities, there are no substantial differences in terms of
profitability, which means that German acquired entities are not less profitable than the
acquired.
It is also important to analyse the asset quality of the banks whenever we want to study the
drivers of an M&A transaction. The next figure will show the NPL Ratio for Italian banks
that entered into a merger or acquisition in 2016 and 2017.
From this picture, the first evidence that it is possible to extrapolate is that for both years, the
NPL Ratio of acquirer entities is lower compared to acquired ones. Also, comparing the
average of our sample to the average of the country for those years, other results can be
stated. First of all, the acquirer banks have lower NPL Ratios compared to the ones of the
country, on average. On the contrary, the banks that are acquired have much higher ratios
Figure 23 NPL Ratio of Italian banks
Source: SNL Financial, World Bank, author`s computations

53
than the average of the country. Moreover, whereas the NPL Ratio decreased from one year
to another for acquirers, the opposite happens for the other category into the analysis (NPL
Ratio increased by 734bps from 2016 to 2017 for acquired). Also, comparing these results
with the average NPL Ratio for Less Significant institutions (5.09% in 2016 and 3.83% in
201775
) it is of note that Italian banks have NPL Ratios much higher than the ones at the SSM
Level.
The situation for German LSI is quite different:
Figure 24 NPL Ratio of German banks
Source: SNL Financial, World Bank, author`s computations
Figure 24 shows that again on average acquirer entities have lower ratios compared to the
others, which is true for both years. However, differently from the Italian case, the acquirer
entities in the sample have higher ratios compared to the German average, and this is
especially true for the year 2016. Also acquired entities have higher ratios than the average of
the country, which is not surprising and at the same time is like the Italian case. However,
when comparing these ratios with the averages in the SSM (6.17% in 2016 and 4.93% in
2017) it is possible to realize that German banks have on average a better quality of assets.
Another element that is worth noticing and that is in contrast to the Italian data in the analysis
is that the difference in terms of NPL Ratio between acquirers and acquired entities is
75 ECB website: https://www.bankingsupervision.europa.eu/banking/statistics/html/index.en.html And
https://www.bankingsupervision.europa.eu/ecb/pub/pdf/ssm.supervisorybankingstatistics_fourth_quar
ter_2016_201704.en.pdf

54
minimal. In fact, in 2016 there are only 71bps of lag and this is even lower in 2017, where the
difference is 31bps. Since the acquirer and acquired entities are almost the same in terms of
asset quality, the main driver of M&A must be different from the one in Italy, which is more
related to the rescue.
The main conclusion from Figure 23 and Figure 24 is that one driver of M&A activity for
Italy could be related to the attempt to save the most troubled banks in terms of asset quality
and to englobe them in banks with better quality, in order to avoid the option of liquidation
that could in principle have serious consequences in the economy. As, instead, German banks
seem that they do not acquire banks to improve their asset quality, they might be doing it in
order to increase Economies of Scale and possibly to become more profitable.
Finally, it is also useful to understand how effectively the banks in the sample are able to
manage their costs and income, to better understand if another driver of M&A could be
related to efficiency.
Figure 25 CIR of Italian banks Figure 26 CIR of German banks
Source: SNL Financial, ECB Supervisory banking statistics, author`s computations
First, for the Italian banks in the sample, it appears that the difference in efficiency between
acquirers and acquired is not significant. Notwithstanding the fact acquired entities have
higher ratios for both 2016 and 2017, the ratios are still in line with the average of the country
(74.65% and 63.9% for 2016 and 2017 respectively), and not distant compared to the
acquirers. For German banks the situation is very similar, as again acquirers and acquirer
have very similar CIR for 2016 and 2017. Moreover, it seems that the sample of banks
involved in M&A has lower ratios compared to the one of the country, and this is true for

55
both acquirers and acquired. However, when comparing the two graphs and the results for
efficiency of Italy and Germany, it appears that German banks perform worse than the Italian
in terms of efficiency, since the ratios are higher. From the results of these pictures, therefore,
we can conclude that German banks have an issue with efficiency, and therefore banks could
be involved in M&A transactions in order to attempt to improve it.
In the next chapter the effects of mergers and acquisitions will be analysed, with a focus on
efficiency. Indeed, the study of some banks prior and after an M&A transaction will help to
understand whether this type of activity makes the banks more or less efficient.

56
Chapter 3: Empirical evidence of efficiency gains from M&A transactions
3.1 Literature Review
Several studies have been carried out regarding the relationship between M&A and efficiency
of credit institutions over the years and in different parts of the world. However, the
conclusions of the studies are often contradictory, as there is no certainty regarding the effect
of efficiency after mergers and acquisitions.
First of all, two different approaches could be used when studying this topic: the first
involves the analysis of the market values of a company before and after the transaction has
been announced to the public76
. The second stream involves accounting variables for
efficiency and comparisons between banks that are involved in M&A in contrast to the ones
that are not. This Chapter will follow the latter approach.
In the existing literature there are distinctions of papers that study the efficiency effects under
a profit point of view and others that focus on costs efficiency instead. Moreover, while there
are studies that find no evidence of improvement in efficiency, there are others that reach
exactly the opposite conclusion. A paper that focuses on M&A activities for several banks in
Greece, for instance, did not result in significant improvement in efficiency post-merger77
.
On the other side, a paper of M&A in the USA between the 80s and the 90s gets to the
conclusions that there are significant efficiency gains arising from mergers and acquisitions,
notwithstanding the fact that some credit institutions in the sample were less efficient than
their peers prior to the transaction78
.
Several researches have compared some profitability figures pre- and post- M&A of banks
involved in such transactions compared to a sample of credit institutions that were not
merging, but again there is no consensus on the answer. Most of the times, these types of
76 Focarelli,D., Panetta F., Salleo C. “Why do banks merge?”, 2002 77 Halkos, G., Tzeremes N., "Measuring the effect of virtual mergers on banks’ efficiency levels: A
non-parametric analysis”, 2013 78 Akhavein, J. D., Berger A., Humphrey D., "The effects of megamergers on efficiency and prices:
evidence from a bank profit function", 1997

57
studies are not able to determine whether the change in efficiency of a single credit institution
is driven by changes in profit efficiency or by changes in market power79
.
The limitations regarding profitability indicators are also connected to the fact that they are
considered short-term measures to calculate performances of credit institutions, and therefore
lack comparability over time80
.
In order to attempt to overcome the limitations that are connected to the profitability ratios
approach, there are papers that measure the efficiency of banks pre- and post- merger through
the use of non-parametric approaches. The main advantage of these types of models is that it
is possible to combine several production inputs and outputs and still provide for a single
final score that measures the efficiency of a single bank from 0 to 1.
One application of the model described, referred to as Data Envelopment Analysis (DEA),
has been carried out to study the effect of efficiency on a sample of Italian banks hit by the
2008 financial crisis81
. Moreover, in order to allow comparability over time, a differences-in-
differences regression is applied.
3.2 The Models
In the following section a detailed explanation on the DEA analysis and diff-in-diff panel
regression will be described in order to better understand the choice of the models for the
study of the impact on efficiency for banks involved in an M&A transaction.
79 Akhavein, J. D., Berger A., Humphrey D., "The effects of megamergers on efficiency and prices:
evidence from a bank profit function", 1997 80
Oberholzer, M. G. van derWesthuizen, "An empirical study on measuring efficiency and
profitability of bank regions", 2004 81 Barra, C., Destefanis S., Lubrano Lavadera G., “Risk and regulation: A difference-in-differences
analysis for Italian local banks” 2016

58
3.2.1 Data Envelopment Analysis
Data Envelopment Analysis is a linear programming procedure for a frontier analysis of
inputs and outputs commonly used to evaluate efficiency for a set of variables82
. This model
allows having multiple inputs and outputs to be analysed at the same time without
assumptions regarding distribution of data.
In the DEA, individuals (in our case, banks) employ a set of inputs in order to produce a
certain level of outputs. A bank might be more efficient whether is able to produce more
output given the same amount of inputs, or if it uses lower amounts of input to get a certain
volume of output. Furthermore, the model compares each producer with the best ones in
order to obtain a relative efficiency score. In few words, through the DEA, we will try to
assess which banks are the most efficient compared to other banks and compute an efficiency
score based on this relation.
For instance, we consider three banks (A, B and C) that have one input (tellers) and two
outputs (checks and loans); given an equal amount of input, the entities will produce different
outputs shown in Figure 27.
82Data Envelopment Analysis
http://citeseerx.ist.psu.edu/viewdoc/download?doi=10.1.1.366.7016&rep=rep1&type=pdf
Figure 27 Efficiency Frontier
Source: Data Envelopment Analysis

59
The bold black line is referred to as efficiency frontier, representing the maximum
combination of outputs for a given set of inputs. This concept is extremely important, as
efficiency is measured as relative distance to the frontier. In this example, while banks A and
C are lying on the frontier and are therefore considered to be efficient, bank B is not.
Finally, the DEA model assigns banks with a score between 0 and 1, where the latter being
the most efficient bank in the sample (“relative efficiency”). Therefore, the higher is the
score, the higher the efficiency is. In this case, A and C will have a score of 1, while bank B a
lower amount, representing its distance from the frontier. The example just shown is a one-
input, two-output model, and therefore easy to represent in two dimensions. Even though
models involving more inputs and outputs are more complex to show, the concept behind the
idea of efficiency is the same.
Indeed, one of the advantages of DEA model is that there is no limit to the number of inputs
and outputs chosen, and producers can be directly comparable across their peers. However, as
all the existing models it has also limitations. First of all, as DEA is an extreme point
technique, is it very sensitive to outliers. Secondly, it must be noted that the analysis is aimed
at evaluating efficiency of a sample, not of the entire universe, and the entities that have the
highest scores are the most efficient with respect to their peers, but not in absolute terms.
For our analysis of efficiency, the purpose is to compare a set of banks that are involved in an
M&A transaction with the ones that instead do not merge for the years of the analysis.
Therefore, the sample of entities has been chosen is composed of several less significant
institutions in the countries where M&As have been observed. The DEA model is run on
STATA.
3.2.2 Difference-in-differences
The second model used in order to attempt to measure whether there are any efficiency gains
from entering into a merger or acquisition is represented by the difference-in-differences
(diff-in-diff or DiD) model.
The diff-in-diff is a statistical technique that is developed across more than one reference
period for entities that are divided into two different groups, namely the treatment and the

60
control group. The DiD is typically used to estimate a causal effect for a specific event that
involves the treatment group by comparing changes over time across the two groups. As it is
the case when testing new drugs that some patients are under treatment while others are only
in “control”, and the drug is considered to be effective if the patients in the treatment group
show improvement in their status, so if banks in the sample that were involved into M&As
display greater efficiency compared to the others (control group), then it means that mergers
and acquisitions convey higher efficiency.
More in detail, the DiD requires data measured from both the treatment and control group at
least one period prior to the event (the M&A) and one period after it. Moreover, the model
has several assumptions. Apart from the typical assumptions of the OLS models83
, the DiD
requires an additional one: in absence of treatment, the unobserved differences across the
treatment and the control group are likely to remain constant over time84
. This means that the
trend in the average values of the variable at study for the two groups should be the same
prior to the event. This assumption is called “Parallel trend”, which is visible once plotting
the above-mentioned averages. Therefore, controlling for other time-variant characteristics,
any deviation from the parallel trend after the event must be attributed to the effects of the
event itself, as time-invariant variables are wiped out by differencing them out over multiple
reported periods. This can be understood intuitively by considering that time invariant
characteristics affect the difference in the level of the average values for the two groups for
each period, but cannot affect possible changes in these differences over time, which is what
we are ultimately interested in as we are considering the existence of gains or losses caused
by M&A transactions. In this analysis, if the trend of efficiency of both the treatment and
control group is the same before M&As while changes after the transaction, then this change
could be attributable only to the merger or acquisition.
The dependent variable in the DiD of this dissertation is represented by the output of the
DEA model, that is the efficiency score of the entities in the sample. The averages of these
scores will be analysed prior and after a mergers, in order to study possible changes in trends
between merging and non-merging banks.
83 Outliers identification, iid testing, heteroscedasticity, multicollinearity and linearity 84 Differences-in-differences estimation
https://www.mailman.columbia.edu/research/population-health-methods/difference-difference-
estimation

61
3.3 The application of the models: data, methodology and results
The credit institutions examined in the following analysis are all Less Significant Institutions
that entered into a merger or acquisition between 2014 and 2015. Moreover, we have
considered only the cases where it is clear which is the acquirer and the acquired entity and
all the entities for which data was incomplete have been deleted.
Finally, we ended up with 42 acquiring banks that belong to the group referred to as
treatment for the regression (at least the same number of acquired entities). In this dataset, the
majority of institutions belong to the sector of cooperative banks (37), then savings (3) and
only two are others; with the exception of one bank from Slovenia, all the other banks are
situated in Austria, Germany and Italy.
Bank level variables have been extracted from SNL Financial between the years 2012 and
2017. The reason for this choice is related to the need to have financial information of credit
institutions for two years prior and after the M&A transaction, in order to be able to analyse
efficiency in a longer time frame. For the purpose of the DiD, another group of entities has
been created, referred to as control group. The control group is a sample of credit institutions
that did not enter into any merger or acquisition transactions for the years of study. The main
rationale behind the choice of the control group entities is the similarity to the banks that are
in the treatment group. More in detail, from a larger sample of banks that existed between
2012 and 2017, we selected the control entities by keeping similar proportions of banks
existing in the treatment group; for instance, in the treatment group 28 entities are located in
Germany, while in the control there are 23. Another factor that has been considered is the size
of banks: for this purpose, the variable of Total Assets has been selected.
For the Data Envelopment Analysis, efficiency has been measured on a bank-level basis by
using Stata, selecting an input-oriented model with constant return to scale. The final score is
calculated on the basis of the following variables:
Input Variable: staff costs
Output Variables: Net Fee and Commission Income (NFCI), customer loans
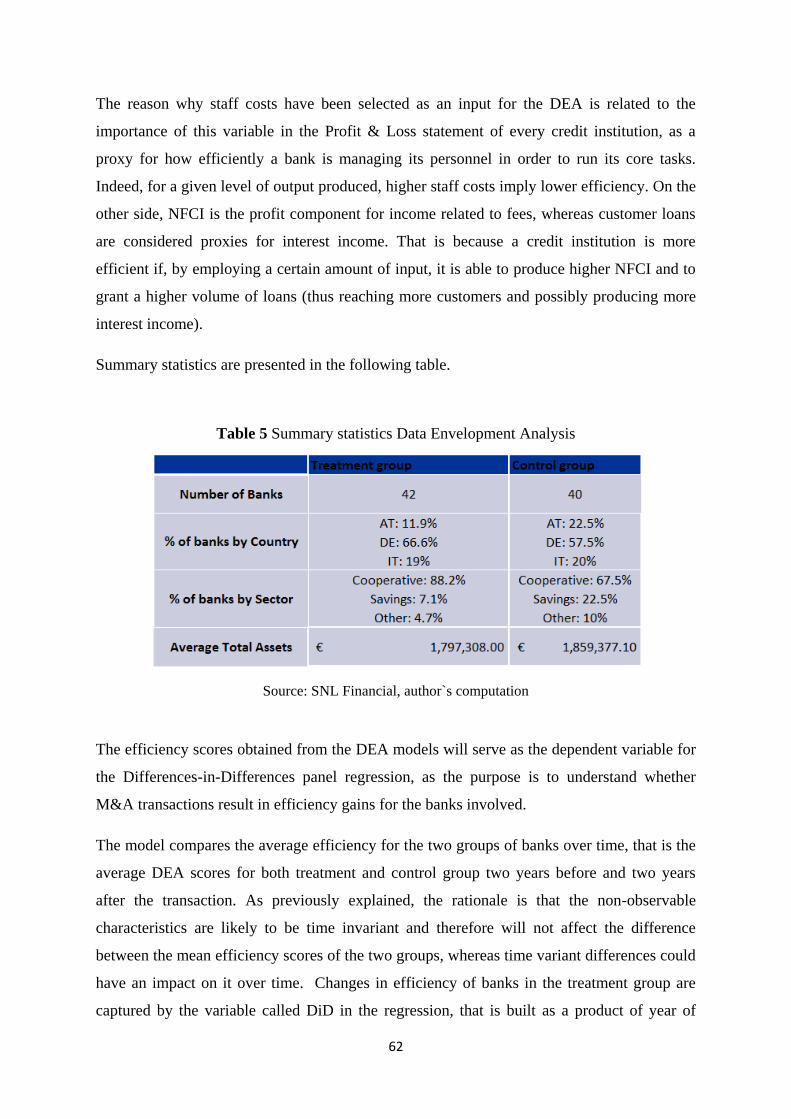
62
The reason why staff costs have been selected as an input for the DEA is related to the
importance of this variable in the Profit & Loss statement of every credit institution, as a
proxy for how efficiently a bank is managing its personnel in order to run its core tasks.
Indeed, for a given level of output produced, higher staff costs imply lower efficiency. On the
other side, NFCI is the profit component for income related to fees, whereas customer loans
are considered proxies for interest income. That is because a credit institution is more
efficient if, by employing a certain amount of input, it is able to produce higher NFCI and to
grant a higher volume of loans (thus reaching more customers and possibly producing more
interest income).
Summary statistics are presented in the following table.
Table 5 Summary statistics Data Envelopment Analysis
Source: SNL Financial, author`s computation
The efficiency scores obtained from the DEA models will serve as the dependent variable for
the Differences-in-Differences panel regression, as the purpose is to understand whether
M&A transactions result in efficiency gains for the banks involved.
The model compares the average efficiency for the two groups of banks over time, that is the
average DEA scores for both treatment and control group two years before and two years
after the transaction. As previously explained, the rationale is that the non-observable
characteristics are likely to be time invariant and therefore will not affect the difference
between the mean efficiency scores of the two groups, whereas time variant differences could
have an impact on it over time. Changes in efficiency of banks in the treatment group are
captured by the variable called DiD in the regression, that is built as a product of year of

63
merger dummy (=1 for the years after the merger) and sample dummy (=1 if treatment
group). According to this methodology, the variable DiD is equal to 1 if the bank belongs to
the treatment group in a period after the acquisition.
Before running the DiD, we should verify that the assumption of the model are met. In
section 3.2.2 we have already introduced the concept of parallel trend. In our analysis,
parallel trend implies that both the treatment and the control group should have a similar
trend in terms of efficiency score prior to the year of merger or acquisition, namely in the
years between 2012 and 2013, as the sample includes M&A transactions between 2014 and
2015. Figure 28 shows the median of efficiency scores for the treatment and control groups.
Figure 28 Median Efficiency scores
Source: SNL Financial, author`s computations
As it is possible to see, the median efficiency scores for both the credit institutions in the
sample that were involved in mergers or acquisitions and the ones that were not have very
similar trends in the years 2012 and 2013, with the treatment group having on average higher
efficiency. However, in 2014 the situation changes since the treatment banks experience a
decrease in efficiency, whereas the banks in the control group present an increasing trend.
Finally, from 2015 on, credit institutions involved in M&A increase their average efficiency
scores and continue to have them until the latest year under analysis. On the contrary, the
control group does not have a clear path. This could already imply that there M&A

64
transactions lead to higher efficiency levels for the banks involved; however, in order to
assess causality, the Differences-in-Differences model is run.
The results of the model are summarized in the following table:
The most important information in the table above is the interaction term (DiD), which
captures the impact of being a participant into a merger or acquisition in the years after the
transaction. The coefficient is significant at 5% level and positive, which means that these
banks are facing efficiency gains. Efficiency gains are estimated to be, on average, around
3% of the DEA score.
Apart from this, more variables have been added to the model in order to control for other
characteristics that might affect banks` performances over time. Dummy Germany is a
dummy variable created for the credit institutions that are situated in Germany, not taking
into account the groups to which they belong. The coefficient suggests that the German banks
in the sample have, on average, lower efficiency level than the other banks. This is in line
with the findings on efficiency for Germany in Chapter 2, despite the fact that efficiency was
Table 6 Difference-in-Differences model results
Source: SNL, Financial, Eurostat, STATA, author`s computations

65
calculated using cost-to-income ratio rather than with the DEA efficiency scores and
confirms that DEA could be potentially a valid model for efficiency estimation. Even though
the coefficient is significant, the magnitude is very small. Similarly, the Dummy Cooperative
is a dummy variable created only for the banks that are in the cooperative sector, again not
considering whether they belong to the treatment or control group. In the sample, those credit
institutions have lower DEA scores compared to other banks. An interesting fact is
extrapolated from the coefficient of the variable Total Assets; it can be interpreted as the
higher the bank in terms of total assets, the higher are the gains in efficiency from a merger or
acquisition, on average. On the other side, the coefficient for Total Capital Ratio states that
the banks in the sample with the highest capital experience efficiency losses from M&A.
Again, the magnitude is small (0.5%) though significant. Finally, the coefficient of the
variable Per Capita GDP suggests that the regions with the highest GPD per capita (where
regions are established on the basis of NUTS 3) are the ones that do not result in gains in
efficiency, as the negative coefficient suggests.
All these results suggest that entering into a merger or acquisition results to be beneficial for
credit institutions, on average. While total assets have a positive influence in the results, the
GDP per capita as well as total capital ratio impact negatively.
As the sample of the banks include mostly credit institutions in Italy and Germany, it would
be interesting to study if the impact of M&A transactions is different across these two
countries. Therefore, the new interaction term DiD is the result of three dummy variables: (=1
for the years after the merger), sample dummy (=1 if treatment group) as in the previous
regression; the third dummy (=1 if the bank is in Germany) will add another condition so that
only the banks that are located in Germany are considered. So, the new DiD will be equal to
one only if a bank belongs to the treatment group after the merger and if it is German. The
results are summarised in Table 7.

66
The coefficient of the interaction term is significant at 1% and is negative. The interpretation
of the coefficient is that the German credit institutions that enter into a merger experience, on
average, a decrease in efficiency of around 5% in the two years after the merger itself. This
result is the opposite of the previous one, as in this case being involved in a merger or
acquisition does not lead to any efficiency gains. However, concerning the other variables in
the model, the results seem to be in line. Indeed, the coefficient for total assets suggests that
the higher the credit institution in terms of size, the higher the gains in efficiency. Instead,
total capital ratio has a negative influence on efficiency, as the negative coefficient suggests
(-7%). Finally, GDP per capita is negative, which means that the regions with the highest
GDP experience a decrease in efficiency. Finally, compared to Table 6, we omitted the
variable Dummy Germany, as it was extremely correlated with the interaction term DiD.
The last regression that has been treated in this dissertation concerns the study of efficiency
gains of credit institutions located in Italy. Here, the interaction term DiD is analogous to the
one created for Germany (the only difference being to the country dummy).
Table 7 Difference-in-Differences model Germany results
Source: SNL, Financial, Eurostat, STATA, author`s computations

67
Table 8 Difference-in-Differences model Italy results
Source: SNL, Financial, Eurostat, STATA, author`s computations
The results show a positive and significant interaction term, which means that on average the
credit institutions that are involved in M&A transaction in Italy result in efficiency gains in
the two years after a merger. The increase in efficiency is around 9% in terms of DEA score.
The control variables are the same of the previous models and also the results are very
similar. The GDP per capita and total capital ratio have both negative and significant
coefficients, meaning that these two variables have a negative impact on the efficiency of the
banks. On the other hand, the coefficient for total assets is positive, which is again a sign that
the biggest banks have higher gains in efficiency from merging.
From the results of the last two difference-in-differences it appears that while for the German
banks at study it might not be convenient to enter in an M&A transaction as there are
efficiency losses, for the Italian banks the situation is the opposite, as on average credit
institutions are able to gain in terms of efficiency in the first two years from the merger. This
is an interesting result, if connected to the current issue of the BCC reform and the attempt to
restore the cooperative banks in Italy. According to this model, it would be convenient of the
Italian cooperatives to merge, as they would result in being more efficient within two years
from the transaction. Given these two opposite conclusions, it must be noted that the results
of the general model that did not distinguish the location of credit institutions determines that

68
there are positive effects from merging, which means that the Italian trend in efficiency
prevailed.
However, the results could have been driven by the sample chosen, as the outcome of the
models is data-driven. The limitations of the model might concern the small sample of data as
well as the number of years of study, both due to data unavailability. Further research might
investigate the topic more extensively, in order to understand whether the same results could
hold with a different sample of banks and assumptions.

69
Conclusions
The banking sector has undergone major changes over the latest decades. Compared to other
economies, Europe results to be the most bank-based, as the supply of credit is the greatest,
the number of commercial banks compared to the population is the highest and the financial
structure is the least market-oriented. Within this framework, the level of banking
competition is extremely high and several credit institutions are not able to earn their cost of
capital; this could be referred to as overbanking. However, after the 2008 financial crisis, the
introduction of new regulations (Basel III, CRDIV, BRRD) and the need to modernize banks`
systems due to challenges in terms of digitalisation and business model could explain why
some banks might struggle to survive. Indeed, since 2008 the overall number of banks has
decreased by 25% in Europe, which is a clear sign of a consolidation trend, especially
through mergers and acquisition transactions.
The descriptive analysis on profitability, solvency, asset quality and efficiency of a sample of
Less Significant Institutions aims at studying the characteristics of the banks that are involved
in M&A, to understand the background and the possible drivers of such transactions. On
average, acquirer entities tend to be more profitable, more efficient and better capitalized than
acquired banks. On a country basis perspective, German credit institutions result to be more
profitable than the Italians as well as having far better asset quality (NPL Ratio), with small
differences between acquirers and acquired entities. This might suggest that while the driver
of M&A transaction in Italy could be linked to the rescue of troubled banks, the one for
Germany is different. However, comparing the level of efficiency between the two countries,
it appears that German banks perform worse than the Italians; this could also mean that M&A
transactions in this country are performed in order to attempt to improve efficiency.
Finally, in order to understand whether M&A transactions lead eventually to efficiency gains
for the banks involved, a difference-in-differences regression of a sample of credit
institutions is presented. This model follows the logic of an existing literature of research
papers aimed at studying the value of M&A in the banking sector (Barra 2016). The results of
the regression suggest that, overall, credit institutions experience gains in efficiency within
two years from the transaction itself. However, when dividing the sample on a country
perspective, different conclusions can be reached. Indeed, for Italian credit institutions, being
involved in and M&A produces positive and significant results in terms of efficiency, while
in Germany the same transaction leads to efficiency losses.

70
References
Abrams, H., “Mergers and Acquisitions: how do you increase the value of two companies
joined together?”, 2013
Aguenaou. S, Lahrech. A, Bounakaya. S, “Analyzing banks` efficiency as a measurement of
performance in the Moroccan context: Application of CAMEL framework”, 2017
Akhavein, J. D., Berger A., Humphrey D., "The effects of megamergers on efficiency and
prices: evidence from a bank profit function", 1997
Associazione nazionale enciclopedia della banca e della borsa, “Trasformazione delle banche
pubbliche”, http://www.bankpedia.org/index.php/it/129-italian/t/22830-trasformazione-delle-
banche-pubbliche
Barone, N.,“Banche, emendamento Lega smonta la riforma Renzi delle BCC”, Il sole 24 ore,
Novembre 2018, https://www.ilsole24ore.com/art/notizie/2018-11-14/nuovo-vertice-palazzo-
chigi-conte-e-vicepremier-bcc-112839.shtml?uuid=AEM3mggG&refresh_ce=1
Barra, C., Destefanis S., Lubrano Lavadera G., “Risk and regulation: A difference-in-
differences analysis for Italian local banks” 2016
Berger A., Klapper L., Turk-Ariss R., “Bank competition and Financial Stability” Policy
Research Working Paper, 2008
Bruno, R., “Financial markets Recap”, Structured finance 2017-2018 slides
Bülbül D., Schmidt R.H., Schuwer U. “Savings Banks and Cooperative Banks in Europe”,
Goethe University, 2013
Carmassi, J., Dobkowitz S., Evrard J., Parisi L., Silva, A., Wedow M., “Completing the
Banking Union with a European Deposit Insurance Scheme: who is afraid of cross-
subsidisation?”, Occasional Paper Series, 2018
Columbia University, “Difference- in- difference Estimation”,

71
https://www.mailman.columbia.edu/research/population-health-methods/difference-
difference-estimation
Data Envelopment Analysis,
http://citeseerx.ist.psu.edu/viewdoc/download?doi=10.1.1.366.7016&rep=rep1&type=pdf
European Central Bank, “Annual Report on supervisory activities”, 2017
European Central Bank, Regulation ECB/2013/33 “concerning the balance sheet of the
monetary financial institutions sector (recast)”, 2013
European Central Bank, Regulation No 468/2014, “establishing the framework for
cooperation within the SSM between the ECB and national competent authorities and with
national designated authorities (SSM Framework Regulation)”, 2014
European Central Bank, “Financial Integration in Europe”, 2016
European Central Bank, “Guidance to banks on non-performing loans”, March 2017
European Central Bank, “Guide to Banking Supervision”, November 2014
European Central Bank: “How can euro area banks reach sustainable profitability in the
future?”, November 2018
European Central Bank website, “List of Financial Institutions”,
https://www.ecb.europa.eu/stats/financial_corporations/list_of_financial_institutions/html/ind
ex.en.html
European Central Bank, List of Supervised Entities, cut-off date 1st January 2018
European Central Bank, “Mergers and Acquisitions involving the EU banking industry: facts
and implications”, 2000
European Central Bank, Regulation ECB/575/2013 “on prudential requirements for credit
institutions and investment firms amending regulation”, 2013
72
European Central Bank, “Publication of supervisory data: Supervisory Banking Statistics”
April 2017,
https://www.bankingsupervision.europa.eu/ecb/pub/pdf/ssm.supervisorybankingstatistics_fou
rth_quarter_2016_201704.en.pdf
European Central Bank, “Report on financial structures, October 2017”,2017
European Central Bank, “SSM Supervisory Manual: functioning of the SSM and Supervisory
Approach”, March 2018
European Central Bank, “Supervisory Banking Statistics”,
https://www.bankingsupervision.europa.eu/banking/statistics/html/index.en.html
European Central Bank, “Supervisory banking statistics: fourth quarter 2017”, April 2018
European Central Bank, “The process of European economic integration”, Speech by Jean-
Claude Trichet, September 2007
European Central Bank, “Too much of a good thing? The need for consolidation in the
European banking sector”, Banking Supervision Speech, September 2017
European Central Bank, “What makes a bank significant?”,
https://www.bankingsupervision.europa.eu/banking/list/criteria/html/index.en.html
European Commission, “A Roadmap towards a Banking Union”, 2012
European Commission, “Restoring financial stability in the Eurozone”, press release March
2015
European Parliament, “25 Years of the EU Single Market”,
http://www.europarl.europa.eu/resources/library/media/20180116RES91806/20180116RES9
1806.pdf
Eurostat, “Archive: Urban-rural typology”, https://ec.europa.eu/eurostat/statistics-
explained/index.php/Archive:Urban-rural_typology

73
Eurostat, “Nomenclature of territorial units for statistics - background”,
https://ec.europa.eu/eurostat/web/nuts/background
Farne, M., Vouldis A., “Business models of the banks in the Euro Area” ECB Working paper
series 2017
Figueira C, Nellis J., “Bank M&A activity in the EU: much ado about nothing?”, 2007
Focarelli D., Panetta F., Salleo C. “Why do banks Merge”, Journal of Money Credit and
Banking, 2002
Gambacorta L., Yang J. “Financial Structure and Growth”, Bank of International
Settlement, 2014
Halkos, G., Tzeremes N., "Measuring the effect of virtual mergers on banks’ efficiency
levels: A non-parametric analysis”, 2013
Investopedia Dictionary, “What is the difference between Mergers and Acquisitions?”,
https://www.investopedia.com/ask/answers/021815/what-difference-between-merger-and-
acquisition.asp
Italian Banking Association Annual Meeting, Speech by the Governor of Italy Ignazio Visco,
10th July 2018
LEI_LOOKUP, http://www.lei-lookup.com/#!search
Majed Abdel Majid Kabajeh et al., “The relationship between the ROE, ROE, and ROI ratios
within Jordanian Insurance public companies market share prices”, International Journal of
humanities and social science, 2012
Mishkin, F.S. “The Economics of Money, Banking & Financial Markets”, 2013
Oberholzer, M. G. van derWesthuizen, "An empirical study on measuring efficiency and
profitability of bank regions", 2004
Opinion of the European Central Bank, “on the amendments to the reform of popolari banks
and cooperative banks”, September 2018

74
Opinion of the European Central Bank, “on the reform of cooperative banks, a guarantee
scheme for securitisations of non-performing loans and the lending capacity of alternative
investment funds”, 24th March 2016
Orrick, Herrington & Sutcliffe LLP, “Reform of Italian Cooperative Credit Banks”, February
2017, https://www.lexology.com/library/detail.aspx?g=33f91f17-d272-471a-b1ef-
e56d7d14a1d1
Oxford Dictionary, “Overbanking”, https://en.oxforddictionaries.com/definition/overbanking
Pagano, M., Langfield, S., “Is Europe Overbanked?”, European Systemic Risk Board,
Reports of the Advisory Scientific Committee 2014
Pierret, D., “Systemic risk and the solvency-liquidity nexus of banks”, University of
Lausanne, 2015
SNL Financial, https://www.spglobal.com/marketintelligence/en/campaigns/snl-financial
Straniero, M., “Riforma BCC, attenzione a non cancellare un modello”, Vita, Febbraio 2016,
http://www.vita.it/it/article/2016/02/15/riforma-bcc-attenzione-a-non-cancellare-un-
modello/138305/
World Bank Database, Number of commercial banks per 100,000 Population

75
Summary
Chapter 1 The banking sector over the years: overbanking and consolidation process
The financial system is a complex organization that aims at simplifying the transfer of funds
between participants. Its function is considered to be critical, as it produces an efficient
allocation of capital; indeed, by allowing funds to move from the ones without productive
investment opportunities to those who instead have them, the transfer of capital is optimal.
More in detail, the financial system could channel funds from households, firms and
governments that are in excess of funds to the same parties that instead have a shortage of it.
There are other functions the financial system performs that are also important, such as the
functioning of the payment systems, the reduction of asymmetric information between the
parties involved in a transaction and the possibility to match the intertemporal preferences of
investors. Moreover, it is possible to distinguish two different areas in which the financial
system operates: direct finance and indirect finance. The former works through financial
markets, where savers lend money to borrowers directly, whereas the latter works through
financial institutions that facilitate the exchange between the parties. In financial markets,
(direct finance), it is essential that market players have the same preferences for the financial
instruments` characteristics, such as maturity, currency and amount. If this is not the case, the
parties would choose not to act. Instead, in the area of indirect finance financial institutions
play an important role as one of their functions is to match the preferences of borrowers and
savers. They engage in diversification of credit, transformation of currencies and of maturity
of instruments. The most common type is represented by financial intermediaries, whose
main purpose is to facilitate transactions in the financial system by reducing the cost of
borrowing and lending for the market participants.
Transaction costs, indeed, are not negligible, and are particularly high for small players (both
savers and borrowers). This means that in case financial intermediaries did not exist, most of
the transaction in the market would not take place at all. The first solution proposed by
financial intermediaries to the problem of high transaction costs consists in bundling several
funds coming from a large number of investors together; in this way, as the number of
transaction increases the cost of transaction per single investment is reduced. We refer to this
phenomenon as economies of scale. The second element that makes financial intermediaries
fundamental for the functioning of the system is characterized by the development of

76
expertise. Higher level of expertise is, then, translated into lower transaction costs, which
allows financial intermediaries to offer cheap services to their customers. A third element that
should be considered when dealing with the advantage of intermediaries is the risk sharing.
Indeed they help reducing the risk of the investors` exposures by diversification. Portfolio
diversification is a fundamental principle for managing risks. A portfolio that is well
diversified has a lower volatility compared to a non-diversified portfolio, as the returns of
some asset categories are not moving together (low or null correlation). Therefore, if a
financial institution is able to invest in different categories of assets in more than one market,
the overall risk of the customer is lower. The importance of financial intermediaries can be
also partially explained by the reduction in asymmetric information between the various
market participants as a consequence of the institutions` activities. Adverse selection is
defined as the problem created when potential borrowers who are the most likely to produce
an undesirable (adverse) outcome are the ones who most actively seek out a loan and are thus
more likely to be selected. The presence of financial intermediaries alleviates the problem of
adverse selection, as they act as expert middlemen that possess higher amount of information
regarding the quality of credits compared to the single savers and investors. Moral hazard,
instead, is defined as the risk that the borrower might engage in activities that are undesirable
from the lender`s point of view, because they make it less likely that the loan will be paid
back. For this purpose, financial intermediaries are able to reduce the probability of hazard by
engaging in monitoring activities and not increasing the costs for market participants.
Banks, or credit institutions, are considered the most important intermediaries in the market,
due to the fact that they carry out several tasks that help the well-functioning of the economy.
Indeed, they support the payment system, which entails the exchange of goods and services
(funds) for money or financial assets. Moreover, they allow customers (natural or legal
persons) to store and save their money in accounts or to borrow them in case of need. In
substance, banks operate in such a way that the pool of money coming in from depositors,
typically short-term, is loaned out to borrowers for longer term loans. This activity, better
known as maturity transformation, is a key task for the mismatch in the maturities of all the
market participants and is also the way in which banks make the greatest portion of their
profits. Indeed, they usually pay a lower interest rate for the deposits, that are liabilities,
compared to the one they ask when granting a loan.
The banking sector is one of the most regulated, due to the fact that the activities of banks are
essential for the functioning of the economy. On one hand, the level of economic and
77
monetary integration between the states of the Euro area started decades ago, and several
steps have been taken in order to foster integration and unified financial markets. Indeed, the
introduction of the Single Market for the free trade in 1993, as well as the establishment of a
single currency in 1999, symbolizes important achievements for the European community as
a whole. On the other hand, the existence of a single entity that regulated and supervised the
banking sector was absent until recently. Only national rules and policies, different from one
country to another, prevailed. Consequently, the banking system was fragmented and banks
supervised in very different ways, notwithstanding the fact that are exposed to common risks.
This is the case since all banks are subject to the same levels of interest rates, set by the
European Central Bank and unique for all Europe. Therefore, a communication from
European Commission to the European Parliament in 2012 highlights the importance of
taking a decisive step in the regulation and supervision fields, and to create a Banking Union.
As the mere coordination between supervisors is not sufficient to tackle all the risks in the
Euro Area, a necessary step concerns the shift in supervision of banks to a European level.
The conduct of supervision and the responsibilities are divided between the Single
Supervisory Mechanism (centralized level) and the National Competent Authorities (national
level), depending on whether the bank is classified as Significant Institution (SI) or Less
Significant Institution (LSI). The separation between SIs and LSIs is important in terms of
approach to supervision and in terms of characteristics of banks. If the ECB supervises
directly an institution, a proper team called Joint Supervisory Team (JST) is formed; this
team, composed by both members of ECB and of NCAs, is responsible for the day-to-day
supervision. On the contrary, there are no JSTs for Less Significant Institutions, since they
are directly supervised by the respective Central Banks/ Supervisory Institutions of the
Member States, and the ECB has an oversight function. Moreover, the credit institutions that
have been divided into the two categories can be very different. While SIs are “big” banks
and a potential deterioration or failure can have a direct impact in the economy, LSIs are
smaller and they typically operate on a regional level. At the end of 2017, according to the
List of Supervised Entities published by the ECB, the number of SIs corresponds to 118,
while the number of LSIs is 3155: therefore, it is important to understand that the world of
LSIs is complex, and performing a deep-dive in how this system of credit institutions has
changed over time could give us the idea of how it could change in the future and what
impact it could have in the financial system.

78
There are several opinions regarding the fact that Europe might be overbanked: indeed, in
most of the European countries the total assets of banks to GDP ratio is higher than 400%, the
number of existing commercial banks with respect to the population is the highest if
compared to other economies, and the ratio between stocks and bonds market and bank credit
is extremely low. It is true that bank-based economies have the advantage of decreasing
transaction costs due to their ability to gather data and subsequently monitor their client, thus
mitigating the asymmetries of information in the market. On the other side, systems that are
overbanked have some drawbacks. For instance, literature suggests that bank-based
economies perform slightly better during normal business cycle, but suffer more and take
more time to recover.
The presentation of the banking sector features in the Euro Area suggests that such a high
number of banks in the market cannot last forever; indeed, if a market is overcrowded, some
players must exit the market. However, exiting from the market is not the only practice
possible in order to try to solve the issue of overbanking. Certainly, bank mergers and
acquisitions could as well play a pivotal role by reducing the considerable size of the sector
and by increasing efficiency of the remaining players.
Chapter 2 The analysis of banks involved in M&A transactions
There is evidence that the banking sector is undergoing a process of consolidation. Therefore,
we study a sample of 222 mergers and acquisitions of banks classified as Less Significant
Institutions under the Single Supervisory Mechanism between 2015 and 2018, with a focus
on the most critical variables that mark the performance of such banks.
The size of the M&A transactions in the years under analysis is equal to € 592.85 Billion
overall. 2017 registers the highest number of mergers as well the highest amount of total
assets involved by taking into account both the acquirer and acquired entities. Over the years,
we observe also that on average, the differences in terms of total assets between the acquirers
and the acquired entities in the sample have decreased. We also manage to divide the sample
of banks into sectors, depending on the legal structure of each credit institution. The majority
of M&A involves cooperative institutions, followed by savings banks and finally a residual
category referred to as “others”. Comparing the three sectors, the biggest banks in the sample

79
belong to the one classified as others. On the contrary, cooperatives and savings are smaller
and more similar between each other, on average.
The analysis continues with a focus on profitability, asset quality, solvency and efficiency.
First, RoE aims at measuring the shareholders` rate of return on their investment in the
company, while RoA measures the operating efficiency for the company based on the bank`s
profits from its total assets. The results for the sample show that acquirers are, on average,
more profitable than acquired entities since they have higher ratios for all the observed
periods.
Another important element used for the evaluation of a credit institution is the quality of its
assets. Typically, in the balance sheet of a bank the greatest portion of assets is composed of
loans, that represent the assets connected to the institution`s main source of profitability.
Indeed, whenever a bank grants a loan to a customer, it is exposed to credit risk, namely the
probability that the borrower defaults on the repayment of the loan itself. Even though banks
have the expertise to analyse and understand the soundness of potential borrowers, it is highly
probable that some of the loans granted will not be paid back. Therefore, analysing non-
performing loan ratios is fundamental to understand the asset quality of each credit
institution. In our sample of M&A, acquirers result to have a better asset quality than the
acquired entities, typically. Moreover, comparing the figures with the average NPL Ratio at
the SSM level, it results that the quality of the assets of the banks in the sample (both
acquirers and acquired) is much lower.
Furtherly, an indicator for banks` efficiency is added to the analysis, as efficiency is an
important factor that determines the capability of a bank to generate enough income by using
its resources in order to cover for expenses. This, in turn, distinguishes the banks that are
sustainable in the medium-long term to the ones that are not since in a banking sector where
income margins are squeezed due to high level of competition, credit institutions have to try
to keep costs under control. The variable that captures the relationship between costs and
operating income of credit institutions is the cost-to income ratio. For all the four years of
study, the cost-to-income ratio (CIR) observed is always lower for acquiring entities than the
acquired ones, which means that usually the most efficient banks acquire the less efficient.
Finally, there is another risk that is meaningful for the survival of a credit institution in the
banking sector, namely solvency risk. Regulatory capital requirements have become more
stringent for banks especially after the crisis and one of the main areas where regulation

80
increased is in indicators related to solvency. From the sample under analysis, the CET1
Ratio is typically higher for acquirer entities than acquired. Even if the difference between
acquirers and acquired is not big for all the years, for this specific ratio also a small number
could make a difference for banks. Moreover, when comparing the sample`s results with the
ones published by the European Central Bank, it is possible to conclude that the entities in the
sample are better capitalized than the average.
In order to analyse deeply the characteristics of the parties involved in M&A, the transactions
are studied also across counties and across years. More in detail, profitability, asset quality
and efficiency of credit institutions are confronted for Italian and German banks between
2016 and 2017. The first notable message is that the German banks in the sample have
performed better in terms of profitability (RoE) compared to the Italian banks. Indeed, while
German credit institutions are able to maintain a positive ratio for both 2016 and 2017, it is
not the case for Italy. Moreover, for Italian banks the difference between acquirers and
acquired entities are big, while in Germany there are no substantial differences in terms of
profitability between the two groups of entities, meaning that acquired banks are not less
profitable than the acquirers, on average.
As far as asset quality is concerned, for Italian banks the NPL Ratio of acquirer entities is
lower compared to acquired one and also if compared to the country average. On the other
side, acquired banks result to have lower asset quality than the average as ratios are higher. In
Germany, the analysis of NPL Ratio shows that again that on average acquirer entities have
lower ratios compared to the others. However, comparing the average results for the two
counties, it is true that German banks have better asset quality than the Italians. Moreover, the
difference in terms of ratio between acquirers and acquired is minimal in Germany, which
could determine that while for Italy the main driver of an M&A transaction includes the
rescue of the worst banks, in Germany the driver could be related to increase economies of
scale and possibly to become more profitable.
Finally, an analysis of efficiency is performed for both acquirers and acquired entities in the
two countries. First, for the Italian banks in the sample, it appears that the difference in
efficiency between acquirers and acquired is not significant, which is the same in Germany.
However, when comparing the results for efficiency of Italy and Germany, it appears that
German banks perform worse than the Italian in terms of efficiency, since the cost-to-income
ratios are higher. Therefore, we can conclude that German banks have an issue with

81
efficiency, and therefore banks could be involved in M&A transactions in order to attempt to
improve it.
Chapter 3 Empirical evidence of efficiency gains from M&A transactions
In this final chapter, the effects of mergers and acquisitions are analysed, with a focus on
efficiency. Indeed, the study of some banks prior and after an M&A transaction helps to
understand whether this type of activity makes the banks more or less efficient.
First of all, several studies have been carried out regarding the relationship between M&A
and efficiency of credit institutions over the years and in different parts of the world.
However, the conclusions of the studies are often contradictory, as there is no certainty
regarding the effect of efficiency after mergers and acquisitions.
For the purpose of this dissertation, two models have been chosen in the attempt to find
significant results for M&A and efficiency. First, Data Envelopment Analysis (DEA) is a
linear programming procedure for a frontier analysis of inputs and outputs commonly used to
evaluate efficiency for a set of variables. This model allows having multiple inputs and
outputs to be analysed at the same time without assumptions regarding distribution of data. In
the DEA, individuals (in our case, banks) employ a set of inputs in order to produce a certain
level of outputs. A bank might be more efficient whether is able to produce more output
given the same amount of inputs, or if it uses lower amounts of input to get a certain volume
of output. Furthermore, the model compares each producer with the best ones in order to
obtain a relative efficiency score. In few words, through the DEA, we try to assess which
banks are the most efficient compared to other banks and compute an efficiency score based
on this relation. One of the advantages of DEA model is that there is no limit to the number
of inputs and outputs chosen, and producers can be directly comparable across their peers.
However, as all the existing models it has also limitations. First of all, as DEA is an extreme
point technique, is it very sensitive to outliers. Secondly, it must be noted that the analysis is
aimed at evaluating efficiency of a sample, not of the entire universe, and the entities that
have the highest scores are the most efficient with respect to their peers, but not in absolute
terms. For our analysis of efficiency, the purpose is to compare a set of banks that are
involved in an M&A transaction with the ones that instead do not merge for the years of the
analysis.

82
The second model used in order to attempt to measure whether there are any efficiency gains
from entering into a merger or acquisition is represented by the difference-in-differences. The
diff-in-diff is a statistical technique that is developed across more than one reference period
for entities that are divided into two different groups, namely the treatment and the control
group. The DiD is typically used to estimate a causal effect for a specific event that involves
the treatment group by comparing changes over time across the two groups. As it is the case
when testing new drugs that some patients are under treatment while others are only in
“control”, and the drug is considered to be effective if the patients in the treatment group
show improvement in their status, so if banks in the sample that were involved into M&As
display greater efficiency compared to the others (control group), then it means that mergers
and acquisitions convey higher efficiency. The model has several assumptions: apart from the
typical assumptions of the OLS models, the DiD requires an additional one: in absence of
treatment, the unobserved differences across the treatment and the control group are likely to
remain constant over time. This means that the trend in the average values of the variable at
study for the two groups should be the same prior to the event. This assumption is called
“parallel trend”, which is visible once plotting the above-mentioned averages. Therefore,
controlling for other time-variant characteristics, any deviation from the parallel trend after
the event must be attributed to the effects of the event itself, as time-invariant variables are
wiped out by differencing them out over multiple reported periods. The dependent variable in
the DiD of this dissertation is represented by the output of the DEA model, that is the
efficiency score of the entities in the sample. The averages of these scores are analysed prior
and after a mergers, in order to study possible changes in trends between merging and non-
merging banks.
The credit institutions examined are all Less Significant Institutions that entered into a
merger or acquisition between 2014 and 2015. The sample is built on 42 acquiring banks that
belong to the group referred to as treatment for the regression, and another group of 40
entities referred to as control group. The control group is a sample of credit institutions that
did not enter into any merger or acquisition transactions for the years of study. The main
rationale behind the choice of the control group entities is the similarity to the banks that are
in the treatment.
In the DEA, the score for efficiency is calculated on the basis of one input, namely staff costs
and two output variables, namely net fee and commission income and customer loans. The
result of this model shows that treatment and control group have a parallel trend before the

83
M&A transaction and that, on average, the treatment group has higher efficiency. However,
the trend changes as in the year after the transactions the treatment banks experience a
decrease in efficiency, whereas the banks in the control group present an increasing trend.
Finally, two years after the M&A the banks in the treatment group increase their average
efficiency scores and continue to have them until the latest year under analysis, while control
group does not have a clear path. This could already imply that there M&A transactions lead
to higher efficiency levels for the banks involved; however, in order to assess causality, the
Differences-in-Differences model is run.
The results of the DiD show that the banks involved in M&A experience efficiency gains
attributed to the transaction itself, as the coefficient of the regression is positive and
significant at 5%. Moreover, as some controls variable have been added to the model, it
seems that while total assets have a positive influence in the results, the GDP per capita as
well as total capital ratio impact negatively on efficiency.
The DiD model is also run separately for German and Italian banks, in order to understand
whether the impact of M&A transactions is different across these two countries. For
Germany, the coefficient is significant at 1% and negative. The interpretation of the
coefficient is that the German credit institutions that enter into a merger experience, on
average, a decrease in efficiency of around 5% in the two years after the merger itself. In
Italy, instead, the results show a positive and significant interaction term, which means that
on average the credit institutions that are involved in M&A transaction in Italy result in
efficiency gains in the two years after a merger. The increase in efficiency is around 9% in
terms of DEA score. The final consideration that should be added refers to the fact that the
above mentioned results could have been driven by the choice of the sample since both the
models are data-driven. Therefore, further research might investigate the topic more
extensively, in order to understand whether the same results could hold with a different
sample of banks and assumptions.