consolidated statements - ferrovial.com · 138 Ɩ 2017 consolidated financial statements....
TRANSCRIPT

137CONSOLIDATED FINANCIAL STATEMENTS B
B
02.CONSOLIDATED
FINANCIALSTATEMENTS
138 Ɩ 2017 CONSOLIDATED FINANCIAL STATEMENTS. FERROVIAL, S.A. AND SUBSIDIARIES
CONTENTS B
A CONSOLIDATED STATEMENTS OF FINANCIAL POSITION AS AT 31 DECEMBER 2017 AND 2016 139
B CONSOLIDATED STATEMENTS OF PROFIT OR LOSS FOR 2017 AND 2016 140
C CONSOLIDATED STATEMENTS OF COMPREHENSIVE INCOME FOR 2017 AND 2016 141
D CONSOLIDATED STATEMENTS OF CHANGES IN EQUITY FOR 2017 AND 2016 142
E CONSOLIDATED STATEMENTS OF CASH FLOWS FOR 2017 AND 2016 143
F NOTES TO THE CONSOLIDATED FINANCIAL STATEMENTS FOR 2017 144
SECTION 1: SCOPE OF CONSOLIDATION AND BASIS OF PRESENTATION:
1.1 BASIS OF CONSOLIDATION, COMPANY ACTIVITIES, SCOPE OF CONSOLIDATION AND ADJUSTMENT 144
1.2 ASSETS AND LIABILITIES CLASSIFIED AS HELD FOR SALE 146
1.3 BASIS OF PRESENTATION AND ACCOUNTING POLICIES 147
1.4 EXCHANGE RATES 157
1.5 SEGMENT REPORTING 157
SECTION 2: PROFIT FOR THE YEAR:
2.1 OPERATING INCOME 158
2.2 MATERIALS CONSUMED AND OTHER OPERATING EXPENSES 159
2.3 STAFF COSTS 159
2.4 GROSS PROFIT FROM OPERATIONS AND PROFIT FROM OPERATIONS BEFORE IMPAIRMENT AND DISPOSALS OF NON-CURRENT ASSETS 160
2.5 IMPAIRMENT AND DISPOSALS OF NON-CURRENT ASSETS 160
2.6 FINANCIAL RESULT 160
2.7 SHARE OF PROFITS OF COMPANIES ACCOUNTED FOR USING THE EQUITY METHOD 162
2.8 INCOME TAX AND DEFERRED TAXES 162
2.9 PROFIT OR LOSS ATTRIBUTABLE TO NON-CONTROLLING INTERESTS 165
2.10 NET PROFIT AND EARNINGS PER SHARE 166
SECTION 3: NON-CURRENT ASSETS:
3.1 GOODWILL AND ACQUISITIONS 168
3.2 INTANGIBLE ASSETS 172
3.3 INVESTMENTS IN INFRASTRUCTURE PROJECTS 173
3.4 PROPERTY, PLANT AND EQUIPMENT 175
3.5 INVESTMENTS IN ASSOCIATES 176
3.6 NON-CURRENT FINANCIAL ASSETS 180
SECTION 4: WORKING CAPITAL:
4.1 INVENTORIES 182
4.2 CURRENT TRADE AND OTHER RECEIVABLES 182
4.3 CURRENT TRADE AND OTHER PAYABLES 183
4.4 DISCLOSURES ON CONTRACTS WITH CUSTOMERS IN THE CONSOLIDATED STATEMENT OF FINANCIAL POSITION AND OTHER DISCLOSURES RELATING TO IFRS 15 184
SECTION 5: CAPITAL STRUCTURE AND FINANCING:
5.1 EQUITY 188
5.2 CONSOLIDATED NET DEBT 191
5.3 CASH FLOW 198
5.4 MANAGEMENT OF FINANCIAL RISKS AND CAPITAL 200
5.5 DERIVATIVE FINANCIAL INSTRUMENTS AT FAIR VALUE 204
SECTION 6: OTHER DISCLOSURES:
6.1 DEFERRED INCOME 208
6.2 PENSION PLAN DEFICIT 208
6.3 PROVISIONS 209
6.4 OTHER NON-CURRENT PAYABLES 211
6.5 CONTINGENT LIABILITIES, CONTINGENT ASSETS, OBLIGATIONS AND COMMITMENTS 211
6.6 REMUNERATION OF THE BOARD OF DIRECTORS 217
6.7 SHARE-BASED PAYMENT 219
6.8 RELATED PARTY TRANSACTIONS 220
6.9 CONFLICTS OF INTEREST 222
6.10 FEES PAID TO AUDITORS 222
6.11 EVENTS AFTER THE REPORTING PERIOD 222
6.12 APPENDICES 222
SECTION 7: EXPLANATION ADDED FOR TRANSLATION TO ENGLISH 222

A. CONSOLIDATED STATEMENTS OF FINANCIAL POSITION Ɩ 139B
Translation of consolidated financial statements originally issued in Spanish and prepared in º accordance with the regulatory financial reporting framework applicable to the Group in Spain (see Notes 1.1 and 7.1). In the event of a discrepancy, the Spanish-language version prevails.
ASSETS (Millions of euros) NOTE 2017 2016 (*)
Non-current assets 14,927 15,679
Goodwill arising on consolidation 3.1 2,062 2,155
Intangible assets 3.2 431 544
Investments in infrastructure projects 3.3 6,917 7,145
Intangible asset model 5,883 6,168
Financial asset model 1,035 977
Investment property 6 6
Property, plant and equipment 3.4 694 731
Investments in associates 3.5 2,687 2,874
Non-current financial assets 3.6 769 735
Loans granted to associates 312 374
Restricted cash relating to infrastructure projects and other financial assets 5.2 285 249
Other receivables 172 112
Deferred tax assets 2.8 1,035 1,057
Non-current derivative financial instruments at fair value 5.5 326 432
Current assets 8,063 7,745
Assets classified as held for sale 1.2 0 624
Inventories 4.1 629 516
Current income tax assets 143 186
Current trade and other receivables 4.2 2,635 2,822
Trade receivables for sales and services 2,032 2,193
Other current receivables 603 629
Cash and cash equivalents 5.2 4,601 3,578
Infrastructure projects 463 277
Restricted cash 58 62
Other cash and cash equivalents 405 215
Excluding infrastructure projects 4,137 3,301
Current derivative financial instruments at fair value 5.5 55 18
TOTAL ASSETS 22,990 23,423
EQUITY AND LIABILITIES (Millions of euros) NOTE 2017 2016
Equity 5.1 6,234 6,314
Equity attributable to the shareholders 5,503 5,597
Equity attributable to non-controlling interests 731 717
Deferred income 6.1 1,037 1,118
Non-current liabilities 9,871 10,421
Pension plan deficit 6.2 66 174
Long-term provisions 6.3 808 757
Borrowings 5.2 7,511 7,874
Debt securities and bank borrowings of infrastructure projects 5,363 5,310
Debt securities and borrowings excluding infrastructure projects 2,149 2,564
Other payables 6.4 198 200
Deferred tax liabilities 2.8 900 979
Derivative financial instruments at fair value 5.5 387 436
Current liabilities 5,848 5,570
Liabilities classified as held for sale 1.2 0 440
Borrowings 5.2 839 302
Debt securities and bank borrowings of infrastructure projects 207 200
Debt securities and bank borrowings excluding infrastructure projects 631 102
Derivative financial instruments at fair value 5.5 65 69
Current income tax liabilities 94 150
Current trade and other payables 4.3 4,221 3,895
Trade payables 2,283 2,299
Customer advances and amounts billed in advance for construction work
1,271 991
Other current payables 667 605
Operating provisions 6.3 629 715
TOTAL EQUITY AND LIABILITIES 22,990 23,423
(*) Adjusted amounts (Note 1.1.4)
The accompanying Notes 1.1 to 7.1 are an integral part of the consolidated statement of financial position as at 31 December 2017.
A. CONSOLIDATED STATEMENTS OF FINANCIAL POSITION AS AT31 DECEMBER 2017 AND 2016
140 Ɩ 2017 CONSOLIDATED FINANCIAL STATEMENTS. FERROVIAL, S.A. AND SUBSIDIARIES
C. CONSOLIDATED STATEMENTS OF PROFIT OR LOSS B
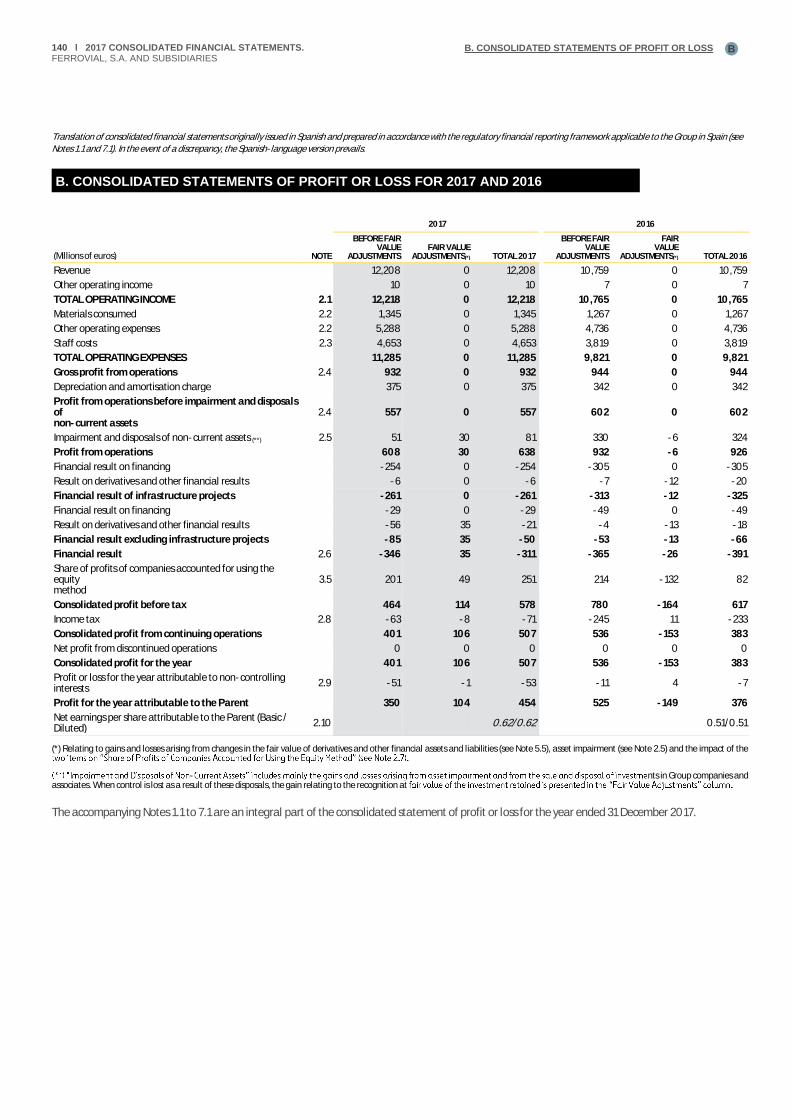
Translation of consolidated financial statements originally issued in Spanish and prepared in accordance with the regulatory financial reporting framework applicable to the Group in Spain (see Notes 1.1 and 7.1). In the event of a discrepancy, the Spanish-language version prevails.
2017 2016
(Millions of euros) NOTE
BEFORE FAIR VALUE
ADJUSTMENTS FAIR VALUE
ADJUSTMENTS(*) TOTAL 2017
BEFORE FAIR VALUE
ADJUSTMENTS
FAIR VALUE
ADJUSTMENTS(*) TOTAL 2016
Revenue 12,208 0 12,208 10,759 0 10,759
Other operating income 10 0 10 7 0 7
TOTAL OPERATING INCOME 2.1 12,218 0 12,218 10,765 0 10,765
Materials consumed 2.2 1,345 0 1,345 1,267 0 1,267
Other operating expenses 2.2 5,288 0 5,288 4,736 0 4,736
Staff costs 2.3 4,653 0 4,653 3,819 0 3,819
TOTAL OPERATING EXPENSES 11,285 0 11,285 9,821 0 9,821
Gross profit from operations 2.4 932 0 932 944 0 944
Depreciation and amortisation charge 375 0 375 342 0 342
Profit from operations before impairment and disposals of non-current assets
2.4 557 0 557 602 0 602
Impairment and disposals of non-current assets (**) 2.5 51 30 81 330 -6 324
Profit from operations 608 30 638 932 -6 926
Financial result on financing -254 0 -254 -305 0 -305
Result on derivatives and other financial results -6 0 -6 -7 -12 -20
Financial result of infrastructure projects -261 0 -261 -313 -12 -325
Financial result on financing -29 0 -29 -49 0 -49
Result on derivatives and other financial results -56 35 -21 -4 -13 -18
Financial result excluding infrastructure projects -85 35 -50 -53 -13 -66
Financial result 2.6 -346 35 -311 -365 -26 -391
Share of profits of companies accounted for using the equity method
3.5 201 49 251 214 -132 82
Consolidated profit before tax 464 114 578 780 -164 617
Income tax 2.8 -63 -8 -71 -245 11 -233
Consolidated profit from continuing operations 401 106 507 536 -153 383
Net profit from discontinued operations 0 0 0 0 0 0
Consolidated profit for the year 401 106 507 536 -153 383
Profit or loss for the year attributable to non-controlling interests
2.9 -51 -1 -53 -11 4 -7
Profit for the year attributable to the Parent 350 104 454 525 -149 376
Net earnings per share attributable to the Parent (Basic / Diluted)
2.10 0.62/0.62 0.51/0.51
(*) Relating to gains and losses arising from changes in the fair value of derivatives and other financial assets and liabilities (see Note 5.5), asset impairment (see Note 2.5) and the impact of the
- nts in Group companies and associates. When control is lost as a result of these disposals, the gain relating to the recognition at
The accompanying Notes 1.1 to 7.1 are an integral part of the consolidated statement of profit or loss for the year ended 31 December 2017.
B. CONSOLIDATED STATEMENTS OF PROFIT OR LOSS FOR 2017 AND 2016
B. CONSOLIDATED STATEMENTS OF PROFIT OR LOSS
C. CONSOLIDATED STATEMENTS OF COMPREHENSIVE INCOME Ɩ 141B
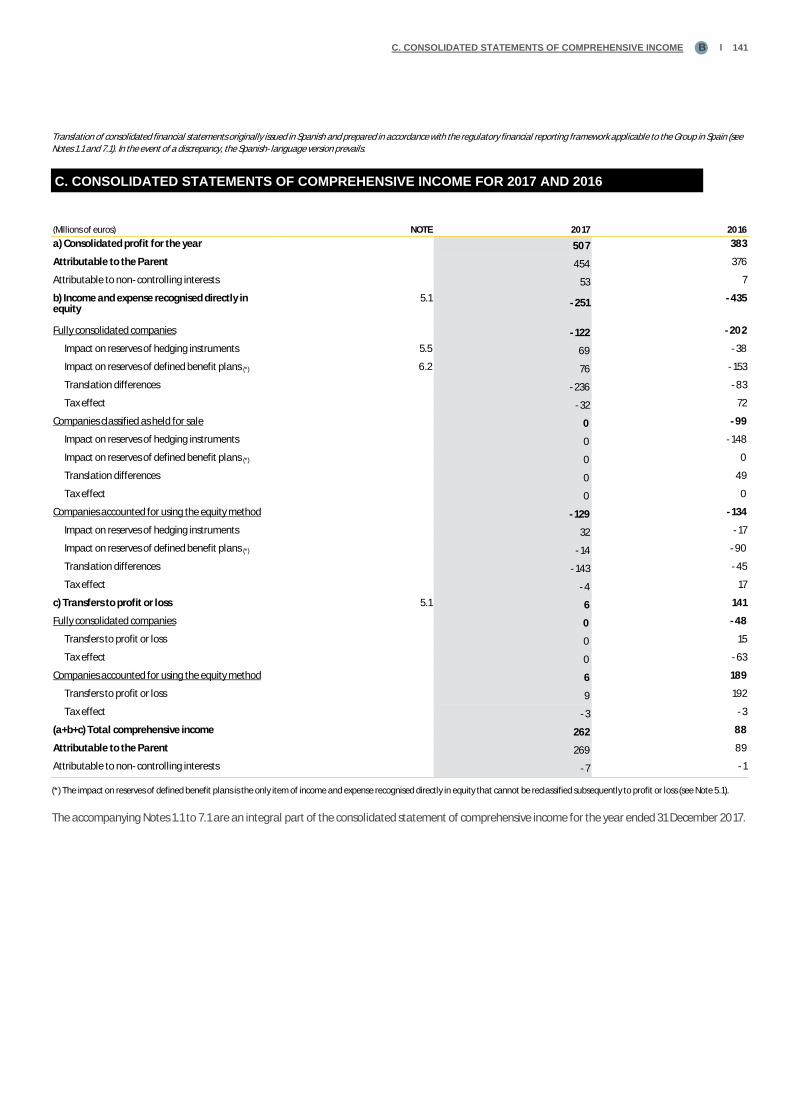
Translation of consolidated financial statements originally issued in Spanish and prepared in accordance with the regulatory financial reporting framework applicable to the Group in Spain (see Notes 1.1 and 7.1). In the event of a discrepancy, the Spanish-language version prevails.
(Millions of euros) NOTE 2017 2016
a) Consolidated profit for the year 507 383
Attributable to the Parent 454 376
Attributable to non-controlling interests 53 7
b) Income and expense recognised directly in equity
5.1 -251 -435
Fully consolidated companies -122 -202
Impact on reserves of hedging instruments 5.5 69 -38
Impact on reserves of defined benefit plans (*) 6.2 76 -153
Translation differences -236 -83
Tax effect -32 72
Companies classified as held for sale 0 -99
Impact on reserves of hedging instruments 0 -148
Impact on reserves of defined benefit plans (*) 0 0
Translation differences 0 49
Tax effect 0 0
Companies accounted for using the equity method -129 -134
Impact on reserves of hedging instruments 32 -17
Impact on reserves of defined benefit plans (*) -14 -90
Translation differences -143 -45
Tax effect -4 17
c) Transfers to profit or loss 5.1 6 141
Fully consolidated companies 0 -48
Transfers to profit or loss 0 15
Tax effect 0 -63
Companies accounted for using the equity method 6 189
Transfers to profit or loss 9 192
Tax effect -3 -3
(a+b+c) Total comprehensive income 262 88
Attributable to the Parent 269 89
Attributable to non-controlling interests -7 -1
(*) The impact on reserves of defined benefit plans is the only item of income and expense recognised directly in equity that cannot be reclassified subsequently to profit or loss (see Note 5.1).
The accompanying Notes 1.1 to 7.1 are an integral part of the consolidated statement of comprehensive income for the year ended 31 December 2017.
C. CONSOLIDATED STATEMENTS OF COMPREHENSIVE INCOME FOR 2017 AND 2016
142 Ɩ 2017 CONSOLIDATED FINANCIAL STATEMENTS. FERROVIAL, S.A. AND SUBSIDIARIES
E. CONSOLIDATED STATEMENTS OF CHANGES IN EQUITY B
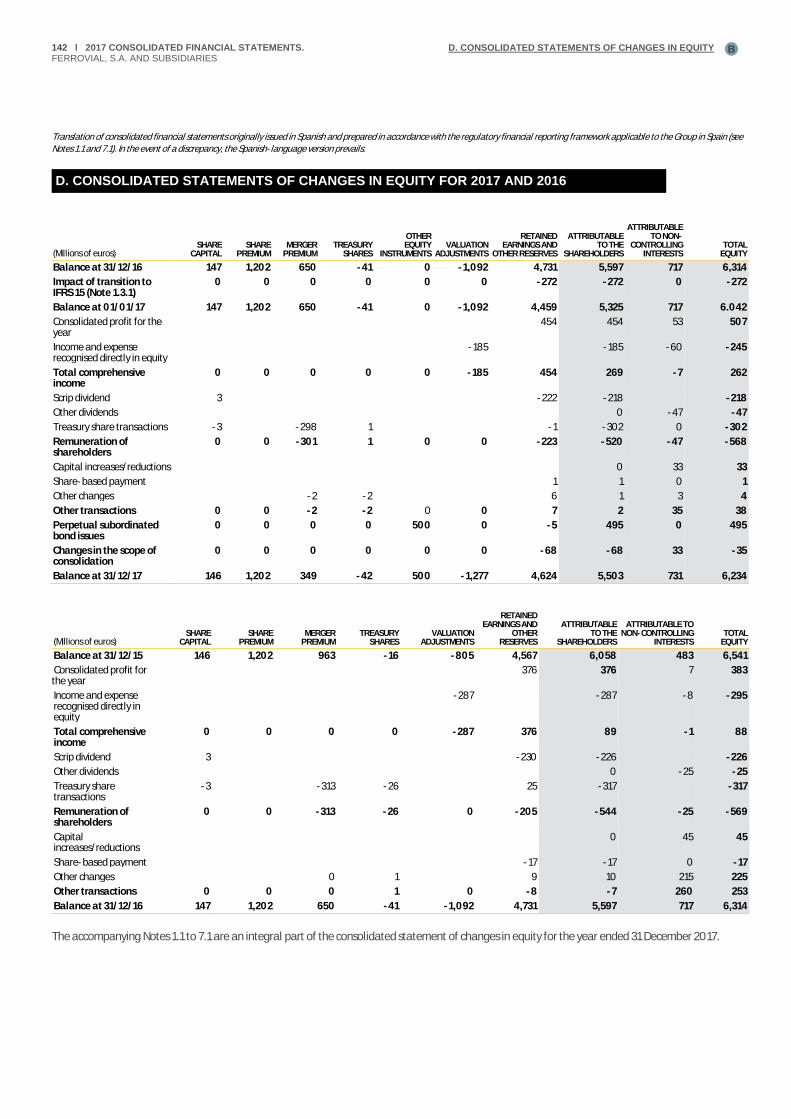
Translation of consolidated financial statements originally issued in Spanish and prepared in accordance with the regulatory financial reporting framework applicable to the Group in Spain (see Notes 1.1 and 7.1). In the event of a discrepancy, the Spanish-language version prevails.
(Millions of euros) SHARE
CAPITAL SHARE
PREMIUM MERGER
PREMIUM TREASURY
SHARES
OTHER EQUITY
INSTRUMENTS VALUATION
ADJUSTMENTS
RETAINED EARNINGS AND
OTHER RESERVES
ATTRIBUTABLE TO THE
SHAREHOLDERS
ATTRIBUTABLE TO NON-
CONTROLLING INTERESTS
TOTAL EQUITY
Balance at 31/12/16 147 1,202 650 -41 0 -1,092 4,731 5,597 717 6,314
Impact of transition to IFRS 15 (Note 1.3.1)
0 0 0 0 0 0 -272 -272 0 -272
Balance at 01/01/17 147 1,202 650 -41 0 -1,092 4,459 5,325 717 6.042
Consolidated profit for the year
454 454 53 507
Income and expense recognised directly in equity
-185 -185 -60 -245
Total comprehensive income
0 0 0 0 0 -185 454 269 -7 262
Scrip dividend 3 -222 -218 -218
Other dividends 0 -47 -47
Treasury share transactions -3 -298 1 -1 -302 0 -302
Remuneration of shareholders
0 0 -301 1 0 0 -223 -520 -47 -568
Capital increases/reductions 0 33 33
Share-based payment 1 1 0 1
Other changes -2 -2 6 1 3 4
Other transactions 0 0 -2 -2 0 0 7 2 35 38
Perpetual subordinated bond issues
0 0 0 0 500 0 -5 495 0 495
Changes in the scope of consolidation
0 0 0 0 0 0 -68 -68 33 -35
Balance at 31/12/17 146 1,202 349 -42 500 -1,277 4,624 5,503 731 6,234
(Millions of euros) SHARE
CAPITAL SHARE
PREMIUM MERGER
PREMIUM TREASURY
SHARES VALUATION
ADJUSTMENTS
RETAINED EARNINGS AND
OTHER RESERVES
ATTRIBUTABLE TO THE
SHAREHOLDERS
ATTRIBUTABLE TO NON-CONTROLLING
INTERESTS TOTAL
EQUITY
Balance at 31/12/15 146 1,202 963 -16 -805 4,567 6,058 483 6,541
Consolidated profit for the year
376 376 7 383
Income and expense recognised directly in equity
-287 -287 -8 -295
Total comprehensive income
0 0 0 0 -287 376 89 -1 88
Scrip dividend 3 -230 -226 -226
Other dividends 0 -25 -25
Treasury share transactions
-3 -313 -26 25 -317 -317
Remuneration of shareholders
0 0 -313 -26 0 -205 -544 -25 -569
Capital increases/reductions
0 45 45
Share-based payment -17 -17 0 -17
Other changes 0 1 9 10 215 225
Other transactions 0 0 0 1 0 -8 -7 260 253
Balance at 31/12/16 147 1,202 650 -41 -1,092 4,731 5,597 717 6,314
The accompanying Notes 1.1 to 7.1 are an integral part of the consolidated statement of changes in equity for the year ended 31 December 2017.
D. CONSOLIDATED STATEMENTS OF CHANGES IN EQUITY FOR 2017 AND 2016
D. CONSOLIDATED STATEMENTS OF CHANGES IN EQUITY

D. CONSOLIDATED STATEMENT OF CASH FLOWS Ɩ 143B
Translation of consolidated financial statements originally issued in Spanish and prepared in accordance with the regulatory financial reporting framework applicable to the Group in Spain (see Notes 1.1 and 7.1). In the event of a discrepancy, the Spanish-language version prevails.
(Millions of euros) NOTE 2017 2016
Net profit attributable to the Parent 2.10 454 376
Adjustments for: 479 568
Non-controlling interests 53 7
Tax 71 233
Result of companies accounted for using the equity method -251 -82
Financial result 311 391
Impairment and disposals of non-current assets -81 -324
Depreciation and amortisation charge 375 342
Gross profit from operations 2.4 932 944
Income taxes paid 2.8.2 -142 -147
Change in working capital (receivables, payables and other)
5.3 -53 -52
Dividends from infrastructure project companies received
3.5 543 427
Cash flows from operating activities 5.3 1,280 1,172
Investments in property, plant and equipment and intangible assets
3.2 and 3.4 -135 -177
Investments in infrastructure projects 3.3 -371 -388
Loans granted to associates/acquisition of companies
-178 -736
Interest received 2.6 34 34
Long-term restricted cash -66 12
Divestment of infrastructure projects 0 0
Divestment/Sale of companies 1.1.3 248 340
Cash flows from investing activities -468 -915
Cash flows before financing activities 812 256
Capital proceeds from non-controlling interests 35 53
Scrip dividend -218 -226
Acquisition of treasury shares -302 -317
Remuneration of shareholders 5.1 -520 -544
Dividends paid to non-controlling shareholders of investees
-49 -24
Subordinated hybrid bond issue 500 0
1.3.3.3 and 5.1.2 -2 0
Cash flows from shareholders and non-controlling interests
-36 -515
Interest paid 2.6 -270 -385
Increase in borrowings 1,184 1,505
Decrease in borrowings -554 -548
Cash flows from financing activities 324 57
Effect of foreign exchange rate changes on cash and cash equivalents
-71 18
Change in cash and cash equivalents due to changes in the scope of consolidation
-43 -32
Change in cash and cash equivalents 5.2 1,023 299
Cash and cash equivalents at beginning of year 3,578 3,279
Cash and cash equivalents at end of year 4,601 3,578
The accompanying Notes 1.1 to 7.1 are an integral part of the consolidated statement of cash flows for the year ended 31 December 2017.
E. CONSOLIDATED STATEMENT OF CASH FLOWS FOR 2017
E. CONSOLIDATED STATEMENT OF CASH FLOWS

144 2017 CONSOLIDATED FINANCIAL STATEMENTS. FERROVIAL, S.A. AND SUBSIDIARIES
F. NOTES TO THE CONSOLIDATED FINANCIAL STATEMENTS B
Translation of consolidated financial statements originally issued in Spanish and prepared in accordance with the regulatory financial reporting framework applicable to the Group in Spain (see Notes 1.1 and 7.1). In the event of a discrepancy, the Spanish-language version prevails.
SECTION 1: BASIS OF PRESENTATION AND SCOPE OF CONSOLIDATION
This section presents the information considered important to know prior to reading the consolidated financial statements of Ferrovial.
Basis of presentation and new accounting standards
The consolidated financial statements of Ferrovial were prepared in accordance with the IFRSs adopted by the European Union. The accounting policies applied are disclosed in Note 1.3 of this section.
In 2017 the change in accounting policies with the greatest impact was the early adoption of IFRS 15, Revenue from Contracts with Customers.
Although this standard is not mandatorily applicable until 2018, the Company decided to apply it in 2017. The most noteworthy impacts relate to the definition of distinct performance obligations in long-term services contracts and the allocation of a price to each obligation; the change in the method for recognising revenue from contract modifications and transactions subject to variable consideration; and the establishment of a consistent revenue recognition method for contracts with similar characteristics. This change in standards gave rise to an impact of EUR -272 million on equity attributable to the Parent (Note 1.3.1 contains a more in-depth explanation of the impacts of application of IFRS 15). In addition, an analysis is provided of the possible impact of IFRS 9, Financial Instruments and IFRS 16, Leases.
Company activities
The disclosures presented in these consolidated financial statements include most notably, due to their importance, those relating to the distinction between infrastructure project companies and non-infrastructure project companies (see Note 1.1.2 for a definition). Also noteworthy are the disclosures relating to two of the Group's main assets, the 25% ownership interest in Heathrow Airport Holdings (HAH), the company that owns Heathrow Airport, and the 43.23% ownership
interest in the concession operator of the ETR 407 toll road in Toronto (Canada).
Changes in the scope of consolidation and assets and liabilities held for sale:
Note 1.1.3 provides detailed information on the main changes in the scope of consolidation in 2017, including primarily the partial sale of the investment in the Portuguese toll roads Norte Litoral and Autoestrada do Algarve, which are now accounted for using the equity method.
Use of judgements and estimates
This section includes the main estimates made by Ferrovial when measuring its assets, liabilities, income, expenses and obligations (see Note 1.3.4).
Exchange rates
Although Ferrovial's functional currency is the euro, a significant portion of its activities is carried on in countries outside the eurozone, its exposure including most notably that to the pound sterling, the US dollar, the Canadian dollar, the Australian dollar and the Polish zloty. The evolution of these currencies vis-à-vis the euro is shown in Note 1.4.
The main changes in the closing exchange rates for 2017 were the depreciation of the US dollar (-14%) and that of the Canadian dollar (-6%). The Australian dollar, the Chilean peso and the pound sterling also underwent significant declines in value, whereas the Polish zloty performed positively. The impact recognised in equity attributable to the Parent was EUR -318 million (see Note 5.1.1, Changes in equity).
1.1. Basis of presentation, Company activities, scope of consolidation and adjustment
1.1.1. Basis of presentation
The consolidated financial statements are presented in accordance with the regulatory financial reporting framework applicable to the Group and, accordingly, present fairly the Group's equity, financial position and results. The regulatory framework consists of International Financial Reporting Standards (IFRSs), as established by Regulation (EC) no. 1606/2002 of the European Parliament and of the Council of 19 July 2002.
1.1.2. Company activities
Ferrovial comprises the Parent, Ferrovial, S.A., and its subsidiaries, which are detailed in Appendix II. Its registered office is in Madrid, at calle Príncipe de Vergara 135.
Through these companies, Ferrovial engages in the following lines of business, which are its reporting segments pursuant to IFRS 8:
• Construction: design and performance of all manner of public and private works, including most notably the construction of public infrastructure.
• Services: maintenance and upkeep of infrastructure, facilities and buildings; waste collection and treatment; maintenance of energy and industrial facilities and rendering of other kinds of public services.
• Toll roads: development, financing and operation of toll roads.
• Airports: development, financing and operation of airports.
For a more detailed description of the various areas of activity in which the consolidated Group conducts its business operations, please consult the Group's website: www.ferrovial.com.
F. NOTES TO THE CONSOLIDATED FINANCIAL STATEMENTS FOR 2017
F. NOTES TO THE CONSOLIDATED FINANCIAL STATEMENTS Ɩ 145 B
For the purpose of understanding these consolidated financial statements, it should be noted that a part of the activity carried on by the Group's business divisions consists of the performance of infrastructure projects, primarily in the toll road and airport areas, but also in the construction and services fields.
These projects are conducted through long-term arrangements with public authorities under which the concession operator, in which the Group generally has an ownership interest together with other shareholders, finances the construction or upgrade of public infrastructure, mainly with borrowings secured by the cash flows from the project and with the shareholders' capital contributions, and subsequently maintains the infrastructure. The investment is recovered by means of the collection of tolls or regulated charges for the use of the infrastructure or through amounts paid by the grantor public authority based on the availability for use of the related asset. In most cases the construction and subsequent maintenance of the infrastructure is subcontracted by the concession operators to the Group's Construction and Services Divisions.
From the accounting standpoint, most of these arrangements fall within the scope of application of IFRIC 12.
Accordingly, and in order to aid understanding of the Group inancial performance, these consolidated financial statements present the
intangible asset model is applied and those to which the financial asset model is applied), in non-current financial assets and, mainly, in the net cash position and the cash flow disclosures, in which the cash flows called
-the Construction and Services businesses, the dividends from the capital invested in infrastructure projects and investments in or divestments of the share capital of these projects, are presented separately from the cash flows of the infrastructure projects, which include the flows generated by the related concession operators. In addition, a list of the companies regarded as infrastructure project companies can be consulted in Appendix II.
It is also important to highlight that two of the Group's main assets are its 25% ownership interest in Heathrow Airport Holdings (HAH), the company that owns Heathrow Airport in London (UK), and its 43.23% ownership interest in ETR 407, the concession operator of the ETR 407 toll road in Toronto (Canada), which have been accounted for using the equity method since 2011 and 2010, respectively. In order to provide detailed information on the two companies, Note 3.5 on investments in companies accounted for using the equity method includes information relating to the changes in the two companies' balance sheets and statements of profit or loss, and this information is completed in other Notes with data considered to be of interest.
1.1.3. Changes in the scope of consolidation
Set forth below is a description of the most significant changes in the scope of consolidation in 2017. The information was prepared taking into account IFRS 3, and the other disclosures required by the standard that do not appear in this Note are included in the Note on goodwill arising on consolidation (see Note 3.1).
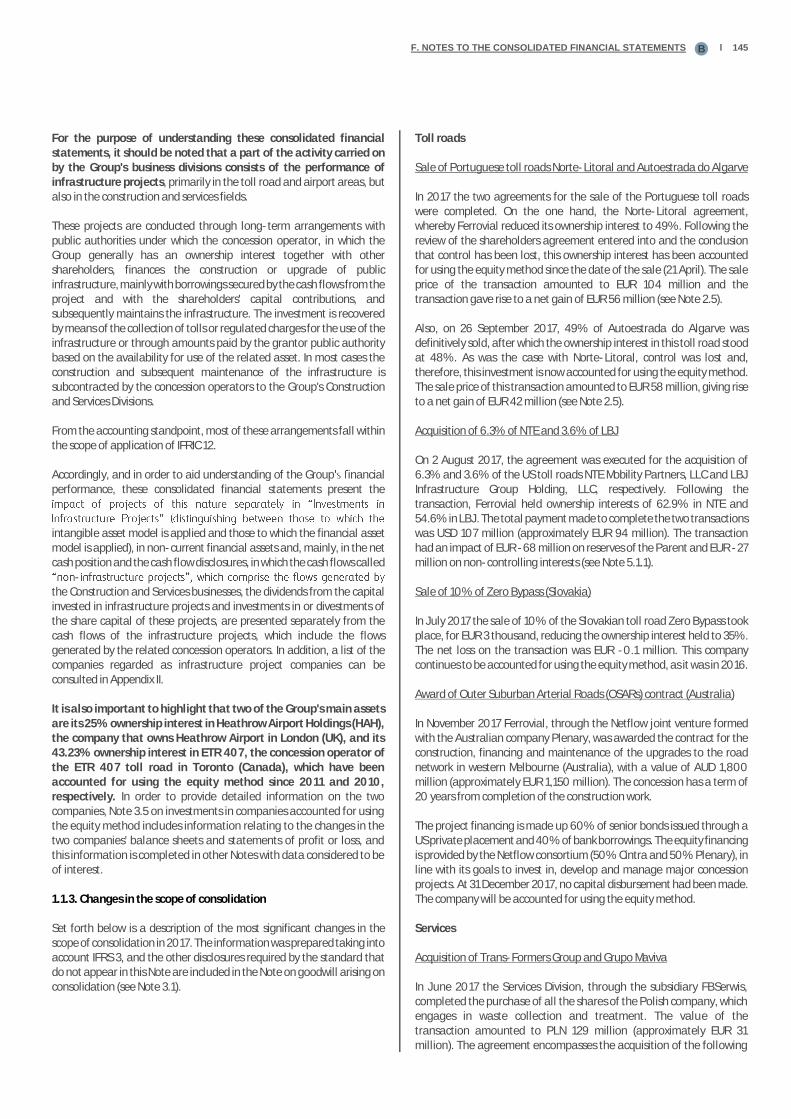
Toll roads
Sale of Portuguese toll roads Norte-Litoral and Autoestrada do Algarve
In 2017 the two agreements for the sale of the Portuguese toll roads were completed. On the one hand, the Norte-Litoral agreement, whereby Ferrovial reduced its ownership interest to 49%. Following the review of the shareholders agreement entered into and the conclusion that control has been lost, this ownership interest has been accounted for using the equity method since the date of the sale (21 April). The sale price of the transaction amounted to EUR 104 million and the transaction gave rise to a net gain of EUR 56 million (see Note 2.5).
Also, on 26 September 2017, 49% of Autoestrada do Algarve was definitively sold, after which the ownership interest in this toll road stood at 48%. As was the case with Norte-Litoral, control was lost and, therefore, this investment is now accounted for using the equity method. The sale price of this transaction amounted to EUR 58 million, giving rise to a net gain of EUR 42 million (see Note 2.5).
Acquisition of 6.3% of NTE and 3.6% of LBJ
On 2 August 2017, the agreement was executed for the acquisition of 6.3% and 3.6% of the US toll roads NTE Mobility Partners, LLC and LBJ Infrastructure Group Holding, LLC, respectively. Following the transaction, Ferrovial held ownership interests of 62.9% in NTE and 54.6% in LBJ. The total payment made to complete the two transactions was USD 107 million (approximately EUR 94 million). The transaction had an impact of EUR -68 million on reserves of the Parent and EUR -27 million on non-controlling interests (see Note 5.1.1).
Sale of 10% of Zero Bypass (Slovakia)
In July 2017 the sale of 10% of the Slovakian toll road Zero Bypass took place, for EUR 3 thousand, reducing the ownership interest held to 35%. The net loss on the transaction was EUR -0.1 million. This company continues to be accounted for using the equity method, as it was in 2016.
Award of Outer Suburban Arterial Roads (OSARs) contract (Australia)
In November 2017 Ferrovial, through the Netflow joint venture formed with the Australian company Plenary, was awarded the contract for the construction, financing and maintenance of the upgrades to the road network in western Melbourne (Australia), with a value of AUD 1,800 million (approximately EUR 1,150 million). The concession has a term of 20 years from completion of the construction work.
The project financing is made up 60% of senior bonds issued through a US private placement and 40% of bank borrowings. The equity financing is provided by the Netflow consortium (50% Cintra and 50% Plenary), in line with its goals to invest in, develop and manage major concession projects. At 31 December 2017, no capital disbursement had been made. The company will be accounted for using the equity method.
Services
Acquisition of Trans-Formers Group and Grupo Maviva
In June 2017 the Services Division, through the subsidiary FBSerwis, completed the purchase of all the shares of the Polish company, which engages in waste collection and treatment. The value of the transaction amounted to PLN 129 million (approximately EUR 31 million). The agreement encompasses the acquisition of the following

146 Ɩ 2017 CONSOLIDATED FINANCIAL STATEMENTS. FERROVIAL, S.A. AND SUBSIDIARIES
F. NOTES TO THE CONSOLIDATED FINANCIAL STATEMENTS B
companies: Trans-Formers Group, Trans-Formers Wroclaw and Trans-Formers Karpatia.
At 31 December 2017, seven months of Trans-Formers Group's results were included in the consolidated financial statements of the Ferrovial Group; its sales amounted to EUR 16 million (EUR 27 million for 2017 as a whole) and it contributed a net profit of EUR 2 million (EUR 4 million for 2017 as a whole).
Also, in July 2017 Ferrovial Servicios acquired, for EUR 18 million, all the shares of Grupo Maviva, a company specialising in high value-added logistics operations, quality control and pre-assembly of components for the automotive industry. Its sales volume amounted to EUR 10 million (EUR 24 million for 2017 as a whole) and its net profit in both cases was EUR 0 million.
Construction
Sale of 3.9% of Budimex
share capital) were sold, with no impact on the consolidated statement of profit or loss because a controlling interest is still held in the company (55.1%). The cash impact of the transaction amounted to EUR 59 million (PLN 252 million). The difference between the price of the transaction and the carrying amount of the ownership interest sold (EUR 48 million) was recognised as reserves attributable to non-controlling interests.
Airports
Award of Denver Great Hall contract
In August 2017 the agreement for the redevelopment and commercial operation of the Jeppesen Terminal at Denver International Airport was entered into between the Great Hall Partners consortium, led by Ferrovial Aeropuertos, and the City and County of Denver. The concession operator under the contract is Denver Great Hall LLC, which is 80% owned by Ferrovial and is fully consolidated.
This project is a 34-year administrative concession arrangement, and is accounted for using the financial asset model under IFRIC 12.
The financial close was reached in December 2017. The total investment will be financed through a combination of payments by Denver City and County government, capital commitments made by the consortium partners (USD 68 million) and a USD 189 million bond issue.
The construction and redevelopment work will be carried out by Ferrovial Agroman (70%) and Saunders Construction at a cost of USD 650 million.
1.1.4. Adjustment of the comparable consolidated statement of financial position as at 31 December 2016
As discussed in Note 3.1, Goodwill, the consolidated statement of financial position as at 31 December 2016 has been adjusted, although this did not have any material impacts on the other financial statements. The allocation of the purchase price of Broadspectrum includes the impact of new information obtained about facts and circumstances that existed at the acquisition date relating to the duration of the existing contracts and the probability of renewal. The aforementioned adjustment was made within twelve months from the acquisition date, as required by IFRS 3.45.
The adjustment resulted in the recognition of a reduction of EUR -15 million in goodwill, with a EUR 41 million increase in intangible assets, an increase of EUR 13 in provisions and impacts on other line items (receivables/payables) amounting to EUR -7 million, as well as the related deferred tax liabilities of EUR -6 million.
1.2. Assets and liabilities classified as held for sale
In 2017 the agreement initiated in 2016 for the sale of the Portuguese toll roads Norte Litoral (51%) and Autoestrada do Algarve (49%), for a total price of EUR 162 million, was completed. The two transactions gave rise to a net gain of EUR 98 million. Following the sale of these holdings, non-controlling interests of 49% and 48%, respectively, have been retained.
ASSETS (Millions of euros)
AUTO-ESTRADAS NORTE
ALGARVE TOLL ROAD TOTAL
Balance at 01/01/17 378 246 624
Investments in infrastructure projects -284 -154 -438
Restricted cash and cash and cash equivalents
-31 -34 -65
Other assets -63 -58 -121
Balance at 31/12/17 0 0 0
LIABILITIES (Millions of euros)
AUTO-ESTRADAS NORTE
EUROSCUT ALGARVE TOTAL
Balance at 01/01/17 256 183 440
Borrowings -211 -177 -388
Derivative financial instruments at fair value
-33 0 -30
Other liabilities -12 -6 -22
Balance at 31/12/17 0 0 0
F. NOTES TO THE CONSOLIDATED FINANCIAL STATEMENTS Ɩ 147 B
1.3 Accounting policies
1.3.1. New accounting standards
1.3.1.a) Early application of IFRS 15, Revenue from Contracts with Customers
Although the new standard is not mandatorily applicable until 1 January 2018, as stated in the consolidated financial statements for 2016, Ferrovial decided, making use of the option included in IFRS 15, to early apply the standard effective 1 January 2017. As a result of this decision, Ferrovial has changed its accounting policies and updated its internal processes and controls relating to revenue recognition.
IFRS 15 was applied retrospectively, recognising the cumulative effect of initially applying this standard as an adjustment to the opening balances for 2017 of the consolidated statement of financial position, calculated only for those contracts that were not completed contracts at 1 January 2017. Therefore, the comparative information for 2016 was not restated and continues to be presented in accordance with IAS 11 and IAS 18.
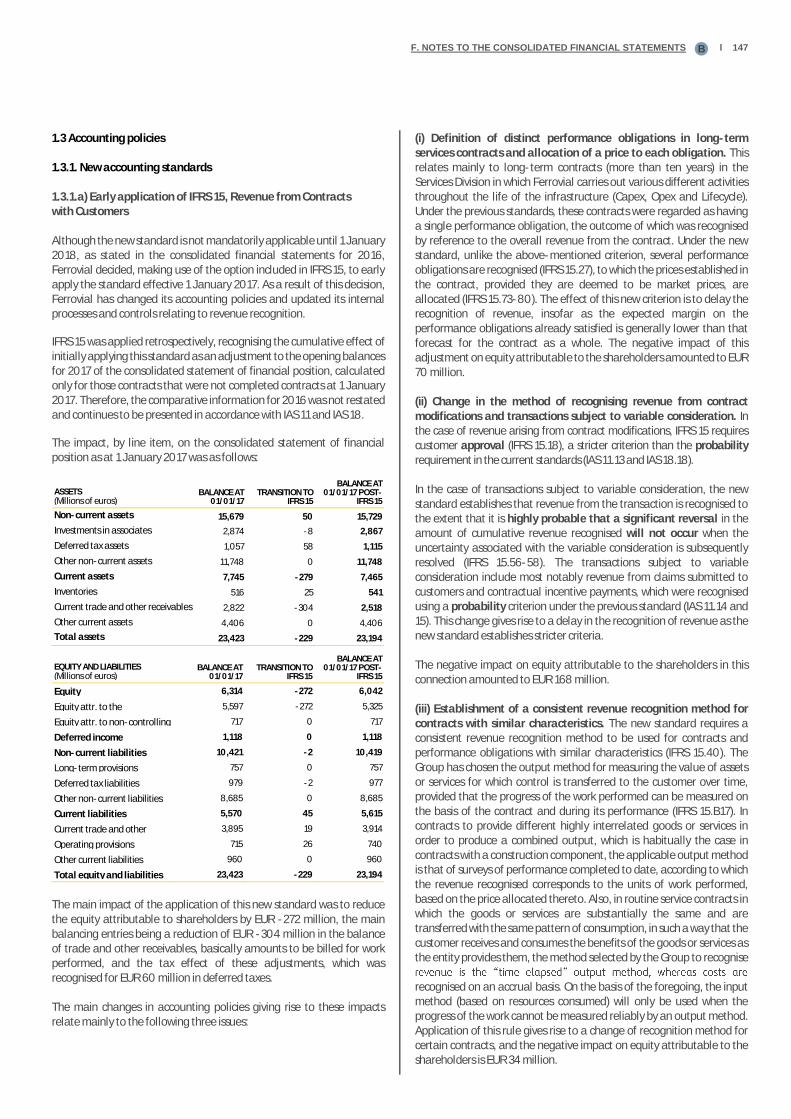
The impact, by line item, on the consolidated statement of financial position as at 1 January 2017 was as follows:
ASSETS (Millions of euros)
BALANCE AT 01/01/17
TRANSITION TO IFRS 15
BALANCE AT 01/01/17 POST-
IFRS 15
Non-current assets 15,679 50 15,729
Investments in associates 2,874 -8 2,867
Deferred tax assets 1,057 58 1,115
Other non-current assets 11,748 0 11,748
Current assets 7,745 -279 7,465
Inventories 516 25 541
Current trade and other receivables 2,822 -304 2,518
Other current assets 4,406 0 4,406
Total assets 23,423 -229 23,194
EQUITY AND LIABILITIES (Millions of euros)
BALANCE AT 01/01/17
TRANSITION TO IFRS 15
BALANCE AT 01/01/17 POST-
IFRS 15
Equity 6,314 -272 6,042
Equity attr. to the
shareholders
5,597 -272 5,325
Equity attr. to non-controlling
interests
717 0 717
Deferred income 1,118 0 1,118
Non-current liabilities 10,421 -2 10,419
Long-term provisions 757 0 757
Deferred tax liabilities 979 -2 977
Other non-current liabilities 8,685 0 8,685
Current liabilities 5,570 45 5,615
Current trade and other
payables
3,895 19 3,914
Operating provisions 715 26 740
Other current liabilities 960 0 960
Total equity and liabilities 23,423 -229 23,194
The main impact of the application of this new standard was to reduce the equity attributable to shareholders by EUR -272 million, the main balancing entries being a reduction of EUR -304 million in the balance of trade and other receivables, basically amounts to be billed for work performed, and the tax effect of these adjustments, which was recognised for EUR 60 million in deferred taxes.
The main changes in accounting policies giving rise to these impacts relate mainly to the following three issues:
(i) Definition of distinct performance obligations in long-term services contracts and allocation of a price to each obligation. This relates mainly to long-term contracts (more than ten years) in the Services Division in which Ferrovial carries out various different activities throughout the life of the infrastructure (Capex, Opex and Lifecycle). Under the previous standards, these contracts were regarded as having a single performance obligation, the outcome of which was recognised by reference to the overall revenue from the contract. Under the new standard, unlike the above-mentioned criterion, several performance obligations are recognised (IFRS 15.27), to which the prices established in the contract, provided they are deemed to be market prices, are allocated (IFRS 15.73-80). The effect of this new criterion is to delay the recognition of revenue, insofar as the expected margin on the performance obligations already satisfied is generally lower than that forecast for the contract as a whole. The negative impact of this adjustment on equity attributable to the shareholders amounted to EUR 70 million.
(ii) Change in the method of recognising revenue from contract modifications and transactions subject to variable consideration. In the case of revenue arising from contract modifications, IFRS 15 requires customer approval (IFRS 15.18), a stricter criterion than the probability requirement in the current standards (IAS 11.13 and IAS 18.18).
In the case of transactions subject to variable consideration, the new standard establishes that revenue from the transaction is recognised to the extent that it is highly probable that a significant reversal in the amount of cumulative revenue recognised will not occur when the uncertainty associated with the variable consideration is subsequently resolved (IFRS 15.56-58). The transactions subject to variable consideration include most notably revenue from claims submitted to customers and contractual incentive payments, which were recognised using a probability criterion under the previous standard (IAS 11.14 and 15). This change gives rise to a delay in the recognition of revenue as the new standard establishes stricter criteria.
The negative impact on equity attributable to the shareholders in this connection amounted to EUR 168 million.
(iii) Establishment of a consistent revenue recognition method for contracts with similar characteristics. The new standard requires a consistent revenue recognition method to be used for contracts and performance obligations with similar characteristics (IFRS 15.40). The Group has chosen the output method for measuring the value of assets or services for which control is transferred to the customer over time, provided that the progress of the work performed can be measured on the basis of the contract and during its performance (IFRS 15.B17). In contracts to provide different highly interrelated goods or services in order to produce a combined output, which is habitually the case in contracts with a construction component, the applicable output method is that of surveys of performance completed to date, according to which the revenue recognised corresponds to the units of work performed, based on the price allocated thereto. Also, in routine service contracts in which the goods or services are substantially the same and are transferred with the same pattern of consumption, in such a way that the customer receives and consumes the benefits of the goods or services as the entity provides them, the method selected by the Group to recognise
recognised on an accrual basis. On the basis of the foregoing, the input method (based on resources consumed) will only be used when the progress of the work cannot be measured reliably by an output method. Application of this rule gives rise to a change of recognition method for certain contracts, and the negative impact on equity attributable to the shareholders is EUR 34 million.
148 Ɩ 2017 CONSOLIDATED FINANCIAL STATEMENTS. FERROVIAL, S.A. AND SUBSIDIARIES
F. NOTES TO THE CONSOLIDATED FINANCIAL STATEMENTS B
1.3.1.b) New standards, amendments and interpretations adopted by the European Union mandatorily applicable for the first time in 2017
On 1 January 2017, the following standards which might have an impact on the consolidated financial statements came into force in the European Union: Amendments to IAS 7, Disclosure Initiative, Annual Improvements to IFRSs, 2014-2016 Cycle and Amendments to IAS 12, Recognition of Deferred Tax Assets for Unrealised Losses. With regard to IAS 7, a new disclosure has been added to Note 5.2, Consolidated net debt, including a reconciliation of net debt to the financing cash flows shown in the consolidated statement of cash flows; this reconciliation is only provided for the current year, since the amendment does not require disclosure of comparative information for the period preceding the date of adoption. No significant impact on the Groupstatements has been identified as a result of the amendments to IAS 12.
1.3.1.c) New standards, amendments and interpretations mandatorily applicable in annual reporting periods subsequent to 2017:
The new standards, amendments and interpretations approved by the IASB but not mandatorily applicable at 31 December 2017 that might have an effect on the Group are as follows:
IFRS 9, Financial Instruments:
The impacts identified are less important than those of IFRS 15, since the entities most affected by IFRS 9 are financial institutions. The mandatory application date is 1 January 2018.
Set forth below is a summary of the main impacts, following an analysis of the three phases of the standard:
i) Hedge accounting. The standard attempts to align hedge accounting more closely with risk management, and the new requirements establish a principle-based approach. IFRS 9 generally permits the designation of specific components of non-financial items and of financial instruments as hedged items, provided that they are separately identifiable and reliably measurable and that there is a liquid market for the items concerned (IFRS 9 B.6.3.8 et seq), and, in certain cases, it specifically permits the hedging of the inflation component of certain financial instruments (IFRS 9 B6.3.13 to 6.3.15). In this connection, the Group has identified as a possible impact that relating to the index-linked derivatives arranged at HAH, which, as indicated above, could meet the requirements for hedge accounting from 2018 onwards. The analysis of this impact has not yet been completed. The hedge accounting requirements of IFRS 9 must be applied prospectively and, therefore, there will be no adjustment on initial application and the impact of adopting this standard will be disclosed in the Group's consolidated financial statements for 2018. This impact will depend both on the financial instruments held in 2018, on the changes in the economic conditions affecting the valuation of those instruments, and on the specific results relating to the effectiveness of the future hedging relationships and, therefore, at the date of preparation of these consolidated financial statements, it cannot be estimated reliably.
ii) Impairment of financial assets. IFRS 9 replaces the incurred loss model of IAS 39 with a model based on expected credit losses. Under the new standard, the loss allowance for a financial instrument will be calculated at an amount equal to 12-month expected credit losses, or lifetime expected credit losses if there has been a significant increase in the credit risk on the instrument. The Group
intends to avail itself of the simplified approach (measuring the loss allowance at an amount equal to lifetime expected credit losses) for its accounts receivable relating to contracts with customers. To this end, in order to implement this approach the Group has established a procedure which not only provides for the write-down of accounts receivable when they are no longer recoverable (incurred losses), but also takes into consideration possible expected losses, based on the evolution of the specific credit risk of the customer, its industry and its country. The estimated negative impact on equity attributable to the shareholders as a result of the impairment of financial assets amounts to EUR 10 million.
iii) Classification and measurement of financial assets. A new classification is introduced that reflects the business model within which financial assets are held by the company. No significant impacts are expected to arise as a result of this new classification. The only potential impact for the Group relates to equity instruments, which by defect must be measured at fair value through profit or loss, since at initial recognition it may elect to present subsequent changes in the fair value of these instruments in other comprehensive income. This election is irrevocable and is made for each asset on an individual basis. Assets of this kind amounted to EUR 34 million at 31 December 2017. With regard to financial liabilities, IFRS 9 does not introduce any changes with respect to IAS 39, except for the change in the treatment of renegotiations of financial liabilities that did not result in the derecognition of those liabilities. Nevertheless, no significant impact is expected, since most of the Group's financial assets and liabilities will continue to be measured at amortised cost.
IFRS 16, Leases:
The analysis of the impact of IFRS 16 is at an earlier stage than that of the aforementioned standards. IFRS 16 is mandatorily applicable in 2019 and the Group does not intend to apply the standard early.
The impact is no different to that at other companies, where the amounts in the statement of financial position will be increased due to the recognition of right-of-use assets and financial liabilities for future payment obligations relating to leases classified to date as operating leases. The Group expects to adopt the recognition exemptions permitted for short-term leases (less than twelve months) and leases for which the underlying asset is of low value. The detail of operating leases is included in Note 6.5.3 to the consolidated financial statements and the related expense amounts to approximately EUR 523 million (detail of commitments under operating leases in the consolidated financial statements as at 31 December 2017). In addition, the aforementioned note includes a detail, by maturity and business line, of the amount of the future minimum lease payments for non-cancellable operating leases. From its preliminary analysis of the operating leases at the end of the reporting period, the Group identified EUR 350 million relating to the non-cancellable future minimum lease payments, discounted at the interest rate implicit in each lease considering the type of underlying asset and the country concerned, which could be comparable to the right-of-use asset and the financial liability that would have to be recognised in the statement of financial position. This estimate was made by reference to the lease portfolio and market conditions existing at 31 December 2018, although it could change as a result of variations in the two variables until the standard is effectively applied at 1 January 2019.

F. NOTES TO THE CONSOLIDATED FINANCIAL STATEMENTS Ɩ 149 B
The new standards, amendments and interpretations approved by the IASB but not yet approved for use in the European Union at 31 December 2017 that might have an effect on the Group are as follows:
NEW STANDARDS, AMENDMENTS AND INTERPRETATIONS
OBLIGATORY APPLICATION IN ANNUAL REPORTING
PERIODS BEGINNING ON OR AFTER:
IFRIC Interpretation 22 Foreign Currency Transactions and Advance Consideration
1 January 2018
IFRIC Interpretation 23 Uncertainty Over Income Tax Treatments
1 January 2019
Amendments to IFRS 2
Classification and Measurement of Share-based Payment Transactions
1 January 2018
Amendments to IAS 40 Investment Property 1 January 2018
Amendments to IFRS 9 Prepayment Features with Negative Compensation
1 January 2019
Amendments to IAS 28 Long-term Interests in Associates and Joint Ventures
1 January 2019
Annual improvements 2015-2017 cycle 1 January 2019
Amendments to IAS 19 Plan Amendments, Curtailments and Settlements
1 January 2019
None of these standards is expected to have a significant impact for Ferrovial.
1.3.2. Basis of consolidation
In 2017 and 2016 the reporting dates of the separate financial statements of all the companies included in the scope of consolidation were either the same as, or were temporarily brought into line with, that of the Parent.
As indicated above, the consolidated Group applied consolidation criteria in accordance with IFRSs as adopted by the European Union (EU-IFRSs). In this regard, in order to determine whether it has control, joint control or significant influence over each Group company, the Group reviews whether the shareholding owned is consistent with the voting control held over the company by virtue of the relevant bylaws and shareholder agreements.
Companies over which it is determined that the Group exercises joint control are generally accounted for using the equity method.
In relation to these jointly controlled businesses, apart from the situations in which there are two venturers, each with a 50% ownership interest, the cases requiring a more in-depth analysis are those relating to infrastructure projects in which Ferrovial is the shareholder with the largest ownership interest (less than or equal to 50%) and has the right to propose the Chief Executive Officer or other executives of the investee, while the other shareholders, mainly infrastructure funds, have a direct participation in the Board of Directors. In all these cases, it was concluded that the projects must be accounted for using the equity method because Ferrovial does not have the right to appoint the majority of the Board of Directors of the companies concerned, the Board decisions require a simple or qualified majority in all cases, including for the appointment of the main executives, and, in the event of a stalemate on a given decision, Ferrovial does not have the capacity to break the deadlock on its own. The most noteworthy examples of such cases are the investments in the concession operators of the following toll road projects (showing the respective percentages of ownership in
brackets): I-66 (50%), 407 ETR (43.2%), Slovakia (35%), Toowoomba (40%) and OSARS (50%).
Contracts undertaken through unincorporated temporary joint ventures (UTEs) or similar entities that meet the IFRS 11 requirements to be
rtionately consolidated. In these cases of joint control, the venturers are considered to have direct control over the assets, liabilities, income and expenses, and to have joint and several liability for the obligations, of the venture. Operations of this nature contributed to the consolidated Group assets, profit or loss and sales of EUR 913 million, EUR -19 million and EUR 1,406 million, respectively (EUR 829 million, EUR 55 million and EUR 1,380 million in 2016). Particularly worthy of note due to their materiality (sales representing more than 0.5% of consolidated sales) are the following companies relating to construction projects:
CONSTRUCTION PROJECT % OWNERSHIP
Northern Line / Thames Tideway Tunnel
Design and construction of the Thames Tideway tunnel and Northern Line extension of the London Underground
50% 192
UTE Toowoomba
Construction of a ring road in the city of Toowomba, Australia
50% 136
407 East Extension Construction of the 407 East highway in Toronto
50% 76
Northern Beaches
Design and construction of improvements to the road network around the hospital of Northern Beaches in Australia
70% 67
Total 471
The companies over which Ferrovial, S.A. exercises significant influence or joint control and which do not meet the requirements in IFRS 11 to be
method. A detail of the companies accounted for using this method can be found in Note 3.5. and in Appendix II.
With regard to the companies over which it is considered that the Group has significant influence, it should be noted that certain companies in which an ownership interest of less than 20% is held (directly or indirectly) are accounted for using the equity method, provided that Ferrovial can appoint a member of their Boards of Directors.
Intra-Group balances and transactions are eliminated on consolidation. However, the transactions recognised in the statement of profit or loss in relation to construction contracts performed by the Construction Division for infrastructure project concession operators are not eliminated on consolidation, since contracts of this kind are treated as construction contracts under which the Group performs work for the concession grantor or regulator in exchange for the right to operate the infrastructure under the terms pre-established by the grantor or regulator. The grantor or regulator thus controls the asset from inception and grants the above-mentioned right in exchange for the work performed, and, therefore, the conclusion may be reached that at Group level the work has been performed for third parties. This is in line with IFRIC 12. The non-elimination of these transactions had an impact of EUR 18 million on the consolidated statement of profit or loss, after

150 Ɩ 2017 CONSOLIDATED FINANCIAL STATEMENTS. FERROVIAL, S.A. AND SUBSIDIARIES
F. NOTES TO THE CONSOLIDATED FINANCIAL STATEMENTS B
taxes and non-controlling interests (2016: EUR 35 million). The detail of the transactions not eliminated on the basis of the foregoing is shown in Note 6.8, Related party transactions.
Appendix II contains a list of subsidiaries and associates.
Lastly, in acquisitions or disposals of ownership interests that do not result in a change in control, the non-controlling (minority) interest may be measured either at fair value or at the non-controlling interest's proportionate share of the acquiree's identifiable net assets.
The general method applied by the Group shall be that which avoids the early recognition of gains in the C -controlling interest is recognised at its fair value in the case of the sale of ownership interests for more than their carrying amount or the purchase of ownership interests for less than their carrying amount. Similarly, the related losses are recognised in the C in the case of the sale of ownership interests for less than their carrying amount or the purchase of ownership interests for more than their carrying amount.
1.3.3. Accounting policies applied to items in the consolidated statement of financial position and consolidated statement of profit or loss
Set forth below is a detail of only those accounting policies that were adopted by the consolidated Group in preparing these consolidated financial statements either as an option permitted by IFRSs or, as the case may be, due to the specific nature of the industry in which it operates or the materiality of the policy concerned.
1.3.3.1. Property, plant and equipment, investment property and intangible assets
• Subsequent to initial recognition, the items included u
are measured at cost less any accumulated depreciation or amortisation and any accumulated impairment losses.
• The Group uses the straight-line method to calculate the depreciation
except in the case of certain machinery in the construction business, which is depreciated using the diminishing balance method.
The consolidated companies depreciate their various items of property, plant and equipment basically within the following ranges of years of useful life:
YEARS OF USEFUL LIFE
Buildings and other structures 10-50
Machinery, fixtures and tools 2-25
Furniture 2-15
Transport equipment 3-20
Other items of property, plant and equipment
2-20
1.3.3.2. Investments in infrastructure projects
This line item includes the investments made in infrastructure by infrastructure concession operators within the scope of IFRIC 12 (mainly toll roads), the remuneration for which consists of an unconditional right to receive cash or another asset or the right to collect the related charges based on the level of usage of the public service.
The assets acquired by the concession operator to provide the concession services but which do not form part of the infrastructure (vehicles, furniture, computer hardware, etc.) are not included in this line item because they are not returned to the concession grantor. Assets of this nature are classified
useful life, using a method that reflects the pattern of consumption of their future economic benefits.
IFRIC 12 intangible asset model
All initial investments relating to the infrastructure that is subsequently returned to the grantor, including compulsory purchase costs and borrowing costs capitalised during construction, are amortised on the basis of the expected pattern of consumption applicable in each case (normally forecast vehicle numbers in the case of toll roads) over the term of the concession.
The investments contractually agreed on at the start of the concession on a final and irrevocable basis to be made at a later date during the term of the concession, and provided they are not investments made to upgrade infrastructure, are considered to be initial investments. For investments of this nature, an asset and an initial provision are recognised for the present value of the future investment, applying a discount rate to calculate the present value that is equal to the cost of the borrowings associated with the project. The asset is amortised based on the pattern of consumption over the entire term of the concession and the provision is increased by the related interest cost during the period until the investment is made.
Where a payment is made to the grantor to obtain the right to operate the concession, this amount is also amortised based on the pattern of consumption over the concession term.
A provision is recognised systematically for replacement investments over the period in which the related obligations accrue, and it must be set up in full by the time the replacement becomes operational. The provision is recognised on the basis of the pattern of consumption over the period in which the obligation arises, on a time proportion basis.
Infrastructure upgrade investments are those that increase the infrastructure's capacity to generate revenue or reduce its costs. In the case of investments that will be recovered over the concession term, since the upgrade investments increase the capacity of the infrastructure, they are treated as an extension of the right granted and, therefore, they are recognised in the consolidated statement of financial position when they come into service. They are amortised as from the date on which they come into service based on the difference in the pattern of consumption arising from the increase in capacity. However, if, on the basis of the terms and conditions of the concession, these investments will not be offset by the possibility of obtaining increased revenue from the date on which they are made, a provision is recognised for the best estimate of the present value of the cash outflow required to settle the obligations related to the investments that will not be offset by the possibility of obtaining increased revenue from the date on which the investments are made. The balancing item is an addition to the acquisition cost of the intangible asset.
In the case of the proportional part of the upgrade or increase in capacity that is expected to be recovered through the generation of increased future revenue, the general accounting treatment used for investments that will be recovered in the concession term will be applied.
The main assumptions used in relation to these arrangements correspond to vehicle number and replacement investment estimates, which are updated each year by technical departments.
F. NOTES TO THE CONSOLIDATED FINANCIAL STATEMENTS Ɩ 151 B
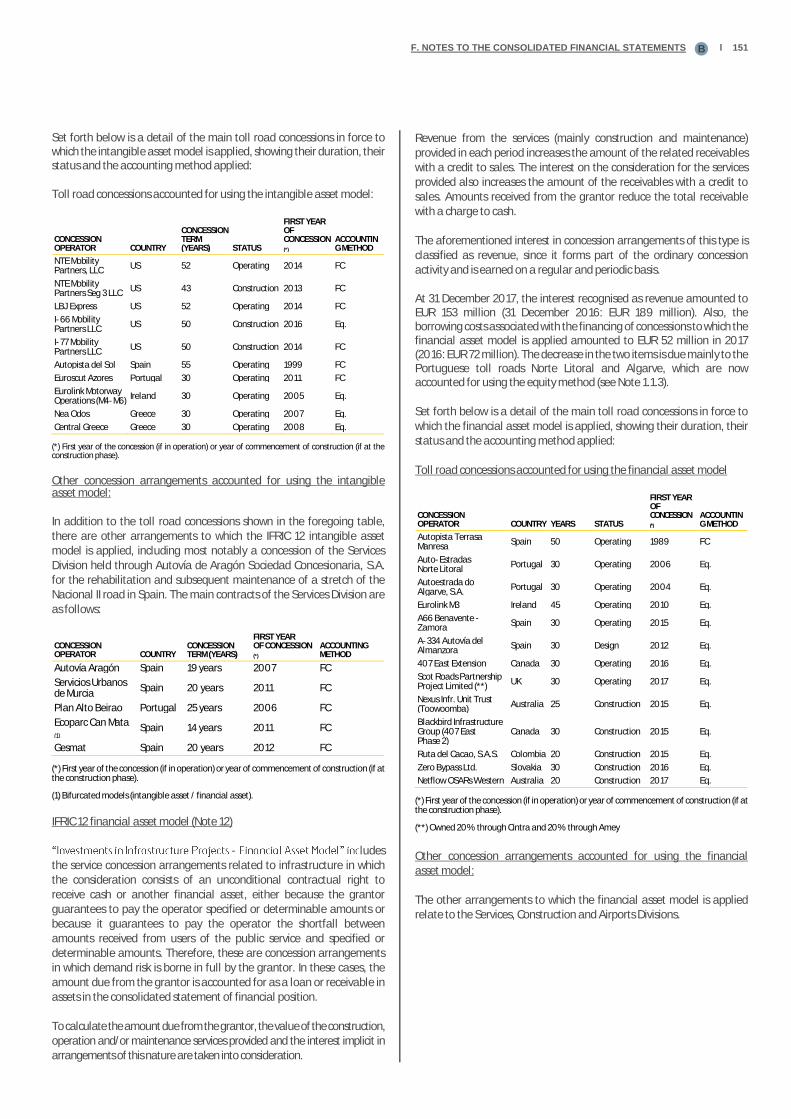
Set forth below is a detail of the main toll road concessions in force to which the intangible asset model is applied, showing their duration, their status and the accounting method applied:
Toll road concessions accounted for using the intangible asset model:
CONCESSION OPERATOR COUNTRY
CONCESSION TERM (YEARS) STATUS
FIRST YEAR OF CONCESSION (*)
ACCOUNTING METHOD
NTE Mobility Partners, LLC
US 52 Operating 2014 FC
NTE Mobility Partners Seg 3 LLC
US 43 Construction 2013 FC
LBJ Express US 52 Operating 2014 FC
I-66 Mobility Partners LLC
US 50 Construction 2016 Eq.
I-77 Mobility Partners LLC
US 50 Construction 2014 FC
Autopista del Sol Spain 55 Operating 1999 FC
Euroscut Azores Portugal 30 Operating 2011 FC
Eurolink Motorway Operations (M4-M6)
Ireland 30 Operating 2005 Eq.
Nea Odos Greece 30 Operating 2007 Eq.
Central Greece Greece 30 Operating 2008 Eq.
(*) First year of the concession (if in operation) or year of commencement of construction (if at the construction phase).
Other concession arrangements accounted for using the intangible asset model:
In addition to the toll road concessions shown in the foregoing table, there are other arrangements to which the IFRIC 12 intangible asset model is applied, including most notably a concession of the Services Division held through Autovía de Aragón Sociedad Concesionaria, S.A. for the rehabilitation and subsequent maintenance of a stretch of the Nacional II road in Spain. The main contracts of the Services Division are as follows:
CONCESSION OPERATOR COUNTRY
CONCESSION TERM (YEARS)
FIRST YEAR OF CONCESSION (*)
ACCOUNTING METHOD
Autovía Aragón Spain 19 years 2007 FC
Servicios Urbanos de Murcia
Spain 20 years 2011 FC
Plan Alto Beirao Portugal 25 years 2006 FC
Ecoparc Can Mata (1)
Spain 14 years 2011 FC
Gesmat Spain 20 years 2012 FC
(*) First year of the concession (if in operation) or year of commencement of construction (if at the construction phase).
(1) Bifurcated models (intangible asset / financial asset).
IFRIC 12 financial asset model (Note 12)
- ludes the service concession arrangements related to infrastructure in which the consideration consists of an unconditional contractual right to receive cash or another financial asset, either because the grantor guarantees to pay the operator specified or determinable amounts or because it guarantees to pay the operator the shortfall between amounts received from users of the public service and specified or determinable amounts. Therefore, these are concession arrangements in which demand risk is borne in full by the grantor. In these cases, the amount due from the grantor is accounted for as a loan or receivable in assets in the consolidated statement of financial position.
To calculate the amount due from the grantor, the value of the construction, operation and/or maintenance services provided and the interest implicit in arrangements of this nature are taken into consideration.
Revenue from the services (mainly construction and maintenance) provided in each period increases the amount of the related receivables with a credit to sales. The interest on the consideration for the services provided also increases the amount of the receivables with a credit to sales. Amounts received from the grantor reduce the total receivable with a charge to cash.
The aforementioned interest in concession arrangements of this type is classified as revenue, since it forms part of the ordinary concession activity and is earned on a regular and periodic basis.
At 31 December 2017, the interest recognised as revenue amounted to EUR 153 million (31 December 2016: EUR 189 million). Also, the borrowing costs associated with the financing of concessions to which the financial asset model is applied amounted to EUR 52 million in 2017 (2016: EUR 72 million). The decrease in the two items is due mainly to the Portuguese toll roads Norte Litoral and Algarve, which are now accounted for using the equity method (see Note 1.1.3).
Set forth below is a detail of the main toll road concessions in force to which the financial asset model is applied, showing their duration, their status and the accounting method applied:
Toll road concessions accounted for using the financial asset model
CONCESSION OPERATOR COUNTRY YEARS STATUS
FIRST YEAR OF CONCESSION (*)
ACCOUNTING METHOD
Autopista Terrasa Manresa
Spain 50 Operating 1989 FC
Auto-Estradas Norte Litoral
Portugal 30 Operating 2006 Eq.
Autoestrada do Algarve, S.A.
Portugal 30 Operating 2004 Eq.
Eurolink M3 Ireland 45 Operating 2010 Eq.
A66 Benavente - Zamora
Spain 30 Operating 2015 Eq.
A-334 Autovía del Almanzora
Spain 30 Design 2012 Eq.
407 East Extension Canada 30 Operating 2016 Eq.
Scot Roads Partnership Project Limited (**)
UK 30 Operating 2017 Eq.
Nexus Infr. Unit Trust (Toowoomba)
Australia 25 Construction 2015 Eq.
Blackbird Infrastructure Group (407 East Phase 2)
Canada 30 Construction 2015 Eq.
Ruta del Cacao, S.A.S. Colombia 20 Construction 2015 Eq.
Zero Bypass Ltd. Slovakia 30 Construction 2016 Eq.
Netflow OSARs Western Australia 20 Construction 2017 Eq.
(*) First year of the concession (if in operation) or year of commencement of construction (if at the construction phase).
(**) Owned 20% through Cintra and 20% through Amey
Other concession arrangements accounted for using the financial asset model:
The other arrangements to which the financial asset model is applied relate to the Services, Construction and Airports Divisions.

152 Ɩ 2017 CONSOLIDATED FINANCIAL STATEMENTS. FERROVIAL, S.A. AND SUBSIDIARIES
F. NOTES TO THE CONSOLIDATED FINANCIAL STATEMENTS B
Following is a detail of the most significant concession arrangements of the Construction Division:
CONCESSION OPERATOR COUNTRY
CONCESSION TERM (YEARS)
FIRST YEAR OF CONCESSION (*)
ACCOUNTING METHOD
Concesionaria de Prisiones Lledoners
Spain 32 2008 FC
Conc. Prisiones Figueras, S.A.U.
Spain 32 2011 FC
Depusa Aragón, S.A.
Spain 25 2015 FC
Aparcamiento Wroclaw Budimex
Poland 30 years and 4 months
2012 FC
Urbicsa Ciudad de la Justicia
Spain 35 years 2008 Eq.
Concesionaria Vía Olmedo Pedralba
Spain 25 years 2013 Eq.
(*) First year of the concession (if in operation) or year of commencement of construction (if at the construction phase).
As regards the Services Division, the most significant arrangements are as follows:
CONCESSION OPERATOR COUNTRY
CONCESSION TERM (YEARS) STATUS(*)
FIRST YEAR OF CONCESSION (**)
ACCOUNTING METHOD
CTR Oris Spain 16 years 1 2014 FC
Juan Grande Spain 18 years 3 2014 Prop.
Salto del Negro Spain 16 years 3 2014 Prop.
Smart Hospital Cantabria
Spain 20 years 1 2014 FC
Toll Road IM08 DDS Poland 6 years 1 2014 FC
IM009 DDS Poland 5 years 1 2016 FC
AmeyCespa WM East UK 28 years 1 2008 FC
AmeyCespa MK SPV UK 18 years 2 2013 FC
Amey (IoW) SPV Ltd UK 25 years 3 2015 FC
Madrid Calle 30 Spain 35 years 1 2005 Eq.
Integrated Bradford SPV One Ltd
UK 27 years 1 2006 Eq.
Integrated Bradford SPV Two Ltd
UK 27 years 1 2009 Eq.
Amey Lagan Roads Ltd
UK 30 years 1 2007 Eq.
Amey Lighting Norfolk Limited
UK 25 years 1 2007 Eq.
E4D&G Project Co Ltd
UK 32 years 1 2008 Eq.
Amey Belfast Schools Partnership Pfi Co Ltd
UK 31 years 1 2008 Eq.
The Renfrewshire Schools Partnership Ltd
UK 33 years 1 2005 Eq.
Amey Birmingham Highways Ltd
UK 25 years 2 2010 Eq.
Amey Highways Lighting Manchester Limited
UK 25 years 1 2004 Eq.
Amey Highways Lighting Wakefield Limited
UK 25 years 1 2003 Eq.
Services Support A&S Ltd
UK 30 years 1 2004 Eq.
Scot Roads Partnership Project Ltd (***)
UK 30 years 1 2017 Eq.
Amey Hallam Highways
UK 25 years 2 2012 Eq.
(*) 1: Operating; 2: Construction; 3: Construction/Operating.
(**) First year of the concession (if in operation) or year of commencement of construction (if at the construction phase).
(***) Owned 20% through Cintra and 20% through Amey.
The Airports Division has the following concession arrangement:
CONCESSION OPERATOR COUNTRY
CONCESSION TERM (YEARS) STATUS
FIRST YEAR OF CONCESSION (*)
ACCOUNTING METHOD
Denver Great Hall
US 30 Construction 2017 FC
(*) First year of the concession (if in operation) or year of commencement of construction (if at the construction phase).
1.3.3.3. Other items in the consolidated statement of financial position and consolidated statement of profit or loss
Cash and cash equivalents of infrastructure project companies: Restricted cash (Note 5.2)
- Infrastructure Projects - includes short-term, highly liquid investments assigned to the financing of certain infrastructure projects, the availability of which is restricted under the financing contracts as security for certain obligations relating to the payment of debt principal and interest and to the maintenance and operation of the infrastructure.
Fair value measurement
The Group only uses fair value measurements in the case of derivative financial instruments. In such measurements, the credit risk of the parties to the related agreement is taken into account. The impact of credit risk is recognised in profit or loss, except when the derivatives qualify as effective hedges, in which case it is recognised in reserves. The Group uses appropriate measurement techniques based on the circumstances and on the volume of inputs available for each item, attempting to maximise the use of relevant observable inputs and avoiding the use of unobservable inputs. The Group establishes a fair value hierarchy that categorises the inputs to valuation techniques used to measure fair value into the following three levels:
• Level 1: quoted prices for identical assets or liabilities.
• Level 2: inputs other than quoted prices that are observable for the asset or liability, either directly or indirectly.
• Level 3: unobservable inputs for the asset or liability.
As indicated in Note 5.5, Derivative financial instruments at fair value, all the Group's derivative financial instruments fall into Level 2.
Other equity instruments
These relate to perpetual bonds for which payment of the related coupon is at the discretion of the issuer and which do not satisfy the condition to be accounted for as financial liabilities, since they do not include a contractual obligation to deliver cash or another financial asset or an obligation to exchange financial assets or financial liabilities. Accordingly, they are recognised und
Non-refundable grants related to assets
Non-refundable grants related to assets are recognised at the amount granted under "Deferred Income" (see Note 6.1) in the consolidated statement of financial position, and are taken to profit or loss gradually in proportion to the period depreciation on the assets financed with these grants and are allocated to the same line as those assets under
standpoint, the amount of the grants collected in the year is presented as a reduction of the amount of the investments made.
F. NOTES TO THE CONSOLIDATED FINANCIAL STATEMENTS Ɩ 153B
Trade payables
reverse factoring arrangements with banks.
These balances are classified as trade payables and the payments relating thereto as cash flows from operating activities, since payment is made to the banks under the same terms and conditions as those agreed upon with the supplier, and the company that has the obligation to pay the latter does not obtain from the banks any extension to the due dates agreed with the supplier; the cost of the reverse factoring arrangement is borne by the supplier and no special guarantees have been provided as security for the payments to be made.
1.3.3.4 Revenue recognition
As indicated in Note 1.3.1 on the first-time application of IFRS 15, the Company changed its revenue recognition policies to adapt them to the provisions of this standard, which was applied early effective 1 January 2017. In order to ensure a uniform application across the various business areas, Ferrovial has developed a common policy. Set forth below are specific details of the methods applied as part of this policy, which affect mainly the Construction and Services businesses. Certain specific aspects
are summarised in the last section.
i) General revenue recognition criterion
The first step for revenue recognition purposes is to identify the contracts and the performance obligations contained therein. The number of performance obligations that a contract has will depend on the type of
business segments.
In general, the performance obligations in the Construction and Services businesses that Ferrovial engages in are satisfied over time and not at a specific point in time, since the customer simultaneously receives and
ance as the service is performed.
With respect to the method for recognising revenue over time (i.e. the method for measuring progress towards complete satisfaction of a performance obligation), Ferrovial has established certain criteria that are applied consistently for similar performance obligations.
In this regard, the method chosen by the Group to measure the value of goods or services for which control is transferred to the customer over time is the output method; this method is applied provided that the progress of the work performed can be measured on the basis of the contract and during its performance.
In contracts to provide different highly interrelated goods or services in order to produce a combined output, which is habitually the case in contracts with a construction activity, the applicable output method is that of surveys of performance completed to date (or measured unit of work), according to which revenue is recognised corresponding to the units of work performed and on the basis of the price allocated thereto. Under this method, on a regular basis, the units of work completed under each contract are measured and the corresponding output is recognised as revenue. Costs of work or services projects performed are recognised on an accrual basis, and the costs actually incurred in completing the units performed are recognised as an expense, together with those which, even though they are expected to be incurred in the future, have to be allocated to the units of work completed to date.
Also, in routine or recurring service contracts (in which the services are substantially the same), such as maintenance and cleaning services, which are transferred with the same pattern of consumption over time and whose remuneration consists of a recurring fixed amount over the term of the contract (e.g. monthly or annual payment), in such a way that the customer receives and consumes the benefits of the services as the entity provides them, the method selected by the Group to recognise revenue is the time elapsed output method. Under this method, revenue is recognised on a straight-line basis over the term of the contract and costs are recognised on an accrual basis.
Lastly, only in those contracts that are not for routine or recurring services and for which the unitary price of the units to be performed cannot be determined, use of the of the stage of completion measured in terms of the costs incurred (input method) is permitted. Under this method, the entity recognises revenue based on the proportion that costs incurred to date bear to the total costs expected to be incurred to complete the work, taking into account the expected margins of the whole project per the latest updated budget. This method involves measuring the proportion of the costs incurred in the work completed to date to the total costs envisaged, and recognising revenue in proportion to total expected revenue. Under this method, the proportion that contract costs incurred bear to the estimated total contract costs is used to determine the revenue to be recognised, by reference to the estimated margin for the entire term of the contract. As indicated above, this method is only applied to complex construction or service contracts with
own the units produced and measure them.
ii) Recognition of revenue from contract modifications, claimsand disputes
Contract modifications are defined as changes in the scope of the work, other than changes envisaged in the original contract, that may result in a change in the revenue associated with that contract. Modifications to
approval before billings can be issued and the amounts relating to the additional work can be collected. The Group does not recognise the revenue from such additional work until the customer's approval has been obtained. In cases where the additional work has been approved but the corresponding change in price has not been determined, the requirement described below for variable consideration is applied: namely, to recognise revenue for an amount with respect to which it is highly probable that a significant reversal will not occur. The costs associated with these additional units or services performed are recognised when incurred, irrespective of whether or not the modification has been approved.
A claim is a request for payment or compensation from the customer (for example, for compensation, reimbursement of costs, or a legally compulsory inflation review) that is made directly to the customer. The method followed by the Group with respect to claims is to apply the method described above for modifications, when the claims are not covered by the contract, or the method used for variable consideration, when the claims are covered by the contract but need to be quantified.
A dispute is the result of a disconformity or rejection following a claim made to the customer under the contract, the resolution of which is dependent on a procedure conducted directly with the customer or a court or arbitration proceeding. Per the criteria followed by the Group, revenue relating to disputes in which the enforceability of the amount claimed is questioned is not recognised, and previously recognised revenue is derecognised, since the dispute demonstrates the absence of
154 Ɩ 2017 CONSOLIDATED FINANCIAL STATEMENTS. FERROVIAL, S.A. AND SUBSIDIARIES
F. NOTES TO THE CONSOLIDATED FINANCIAL STATEMENTS B
questions the price, revenue recognition is based on the criterion applied in cases of variable consideration discussed below.
Only in those cases in which there is a legal report confirming that the rights under dispute are clearly due and enforceable and that, therefore, at least the costs directly associated with the related service will be recovered, may revenue be recognised up to the limit of the amount of the costs incurred.
iii) Variable consideration
If the consideration promised in a contract includes a variable amount, this amount is recognised only to the extent that it is highly probable that a significant reversal in the amount recognised will not occur when the uncertainty associated with the variable consideration is subsequently resolved.
iv) Statement of financial position balances relating torevenue recognition
Amounts to be billed for work performed/amounts billed in advance for construction work
Unlike the method used to recognise contract revenue, the amounts billed to the customer are based on achievement of the various milestones established in the contract and on acknowledgement thereof by the customer, which takes the form of a contractual
amounts recognised as revenue for a given year do not necessarily coincide with the amounts billed to or certified by the customer. In the case of contracts in which the goods or services transferred to the customer exceed the related amount billed or certified, the difference
and Servitransferred are lower than the amount billed to or certified by the customer, the difference is recognised (as a contract liability) in a
truction
Bid costs and mobilisation costs
In addition to the aforementioned statement of financial position balances, the Group also recognises assets relating to the costs of obtaining a contract (bid costs) and to the costs incurred to fulfil a contract or setup costs (mobilisation costs) that are directly related to the principal contract, provided they will be recovered through performance of the contract. These balances are presented in a separate account
financial position (see Note 4.1).
Bid costs are only capitalised when they are directly related to a contract and it is probable that they will be recovered in the future and the contract has been awarded to the company or the company has been selected as the preferred bidder. Costs incurred that would have been incurred regardless of whether the contract was obtained are recognised as an expense, unless those costs are explicitly chargeable to the customer in any case (whether or not the contract is obtained). The capitalised costs are amortised on a systematic basis that is consistent with the transfer to the customer of the goods or services to which the asset relates.
Costs required to set up the contract, mobilisation costs, are capitalised provided that it is probable that they will be recovered in the future and
that they do not include expenses that would normally have been incurred by the company if the contract had not been obtained. They are gradually recognised as an expense on the basis of the proportion of actual output to estimated output under each contract. If the above conditions are not met, these costs are taken directly to profit or loss.
v) Provisions relating to contracts with customers
The main provisions relating to contracts with customers are provisions for deferred expenses and for budgeted losses
• Provisions for deferred expenses. These provisions cover the expenses that will foreseeably arise on completion of a contract, such as those for the removal of construction machinery or dismantling costs, as well as the estimated repairs to be carried out within the guarantee period. These provisions relate to a present obligation stipulated in the contract that is based on the fact that in order tosettle the obligation there will probably be an outflow of resources from the company the amount of which can be estimated reliably. Provisions are recognised on the basis of the best possible estimates of the total expenditure required to settle the obligations. They can be determined as a percentage of the total expected revenue from the contract if historical information on similar contracts is available.
The guarantee obligations included in this type of provisions are not considered to be a separate performance obligation unless the customer has the option of arranging the guarantee separately, and, accordingly, they are recognised as indicated in IAS 37 on provisions and contingent assets and liabilities.
• Provisions for budgeted losses. These provisions are recognised as soon as it becomes evident that the total costs expected to be incurred in a contract exceed the total expected revenue from that contract. For the purpose of determining , if appropriate, the amount of the related provision, the criterion established in IAS 37.14 (b) is applied. Thus, the estimate of the total budget for the contract includes the expected revenue that is considered to be probable. This criterion is different from that established in IFRS 15, discussed above in Note 1.3.3.4, Revenue recognition, on the basis of which such revenue is only recognised to the extent that it is deemed to be highly probable. Also, if the total expected profit on a contract is less than that recognised under the aforementioned revenue recognition rules, the difference is recognised as a provision for losses.
vi) Financing component
In general, in order to calculate the price of a performance obligation, an implicit financing component is calculated, in those cases in which the period between when the entity transfers a promised good or service to a customer and when the customer will foreseeably pay for that good or service is more than one year. This component is accounted for as finance income.
With respect to performance obligations for which the period between when the entity transfers a promised good or service to the customer and when the customer pays for that good or service is less than one year, the Group applies the practical expedient permitted by IFRS 15 and does not adjust the promised amount of consideration for the effects of a significant financing component.
In those cases in which there is a contractual or legal right to charge late-payment interest owing to the delay in collection with respect to the contractually established periods, such interest is only recognised when it is highly probable that it will actually be collected.

F. NOTES TO THE CONSOLIDATED FINANCIAL STATEMENTS Ɩ 155B
vii) Specific revenue recognition criteria by segment
Construction business
As a general rule, a single performance obligation is identified for construction contracts owing to the high degree of integration and customisation of the various goods and services to provide a combined output that is transferred to the customer over time.
As discussed above, the Group has chosen as its preference the measured unit of work method (output method), which is applied provided that the progress of the work completed can be measured during the performance of the contract and that a price can be allocated to each unit of work.
Only in those contracts for which the unitary price of the units to be performed cannot be determined is it permitted to use the input method (stage of completion measured in terms of costs incurred).
Services business
There is no single contract type in the case of the Services business due to the considerable diversity of the services rendered. In general, the contracts involve various tasks and unit prices and the related revenue is recognised in the consolidated statement of profit or loss as the services are provided, based on the time elapsed, i.e. when the customer simultaneously receives and consumes the benefits provided by the
example in routine or recurring services such as facility management, street cleaning or waste collection services.
Certain contracts include different types of activities that are subject to fixed unit price tables for the services provided and which form part of the contract as a whole. In such contracts the customer requests each of the services by means of a work order, which is considered to be a separate performance obligation, and the associated revenue is recognised depending on the specific requirements established in the contract for the approval of the service.
In the case of complex long-term contracts involving the provision of several services that constitute separate performance obligations (construction, maintenance, operation, etc.), payment for which is made on a periodic basis and in which the price for those performance obligations is indicated in the contract or can be determined, revenue is recognised using the time elapsed method for the recurring services, whereas the stage of completion method is used for those more complex performance obligations for which it is not possible to allocate a price to each of the units of work performed.
Lastly, it should be noted that the revenue from certain contracts that fall within the scope of IFRIC 12 is recognised as described in Note 1.3.3.2.
Toll Road business
The arrangements included in this line of business are accounted for in accordance with IFRIC 12, which provides for the classification of the assets assigned to such arrangements on the basis of the intangible asset model and the financial asset model (bifurcated arrangements can also exist) (see Note 1.3.3.2).
The new IFRS 15, Revenue from Contracts with Customers does not give rise to a change with respect to the revenue recognition method used to date. In the case of concession arrangements accounted for using the intangible asset model, the customer is the user of the infrastructure and, therefore, each use made of the infrastructure by users is considered a performance obligation, and the related revenue is recognised at a point in time. In the case of concession arrangements accounted for using the financial asset model, in which the customer is the concession grantor, revenue recognition depends on the various services provided (e.g. operation or maintenance), which will be accounted for as different performance obligations, to which market prices have to be allocated. In those cases in which a stand-alone selling price is not directly observable, it is estimated on the basis of the best possible estimate, using the expected margin for that activity.
Airports business
In general, the services provided in this business are short-term services to customers (airline or airport users) for which regulated revenue is recognised at a point in time; therefore, there are no changes with respect to revenue recognition for this business. It should be noted that the revenue from certain contracts that fall within the scope of IFRIC 12 is recognised as described in Note 1.3.3.2.
Real estate business
The revenue from this business relates mainly to the sale of apartments, commercial premises and garage spaces, and is recognised when the buyer receives legal title to, and takes physical possession of, the asset. Each unit (apartment, etc.) is considered to be a separate performance obligation and the related revenue is recognised when the asset is legally and economically transferred to the buyer; this does not constitute any change in the revenue recognition method currently applied.
Energy distribution business
The contracts in this business involve a series of services that are substantially the same and have the same pattern of transfer to the customer. The monthly rate reflects the value of the services provided. Contracts of this kind have a single performance obligation that is satisfied over time and the related revenue is recognised by applying the output method.
156 Ɩ 2017 CONSOLIDATED FINANCIAL STATEMENTS. FERROVIAL, S.A. AND SUBSIDIARIES
F. NOTES TO THE CONSOLIDATED FINANCIAL STATEMENTS B
1.3.4. Accounting estimates and judgements
In the consolidated financial statements for 2017 estimates were made to measure certain of the assets, liabilities, income, expenses and obligations reported herein. These estimates relate basically to the following:
i) Estimates taken into consideration for the purpose of recognising revenue from contracts with customers (see Note 1.3.3.4), including most notably those associated with:
• determining whether enforceable rights exist, in order torecognise revenue;
• determining whether a contract modification has been approved;
• establishing whether the conditions for recognising revenue forvariable consideration are met;
• recognising revenue in relation to a claim or a dispute;
• establishing whether the contract includes one or severalperformance obligations, and determining the price allocable toeach of them;
• defining for each performance obligation the applicable method forrecognising revenue over time, taking into account that, based onthe accounting policy established by the Company, the preferred
method (schedule of values or based on time elapsed), and the stage of completion measured in terms of the costs incurred
input model is applied in those cases in which the services provided are not routine and recurring services and in which the unit price of the units of work to be performed cannot be determined;
• in the case of contracts recognised using the survey of performancecompleted to date method, measuring the units completed and theprice that can be allocated thereto;
• percentage of completion method e costs incurred relative to total contract costs, and the expected profit margin for the contract;
• determining whether to capitalise bid costs and mobilisation costs;
• making estimates relating to the calculation of the provision for expected losses and deferred expenses.
ii) The assessment of possible legal contingencies (see Note 6.5, Contingent liabilities, contingent assets, obligations and commitments and Note 6.3, Provisions).
iii) The recognition for accounting purposes of the subordinated guaranteed hybrid bond (see disclosure on equity instruments in Note 5.1.2.).
iv) The estimates for the selection of the accounting method to be applied in relation to the loss of control, as in the case of the Portuguese toll roads (see Note 1.3.2, Basis of consolidation).
v) Estimates regarding the valuation of derivatives and the expected flows associated with them in order to determine the existence of hedging relationships (see Note 5.5, Derivative financial instruments at fair value).
vi) The assessment of possible impairment losses on certain assets (see Note 3.1, Goodwill and acquisitions, and Note 3.5, Investments in associates).
vii) Business performance projections that affect the estimates of the recoverability of tax assets (see Note 2.8 on tax matters).
viii) Estimates relating to the fair value of assets and liabilities acquired in the business combinations detailed in Note 1.1.3, Changes in the scope of consolidation.
ix) Estimates taking into account the future vehicle numbers on toll roads for the purpose of preparing financial information for toll roads pursuant to IFRIC 12 (see Note 3.3, Investments in infrastructure projects and Note 6.3, Provisions).
x) The assumptions used in the actuarial calculation of pension and otherobligations to employees (see Note 6.2, Pension plan deficit).
xi) The measurement of share award plans (see Note 6.7, Share-based payment).
Although these estimates were made on the basis of the best information available at 31 December 2017 on the events analysed, events that take place in the future might make it necessary to change these estimates. Changes in accounting estimates would be applied prospectively in accordance with the requirements of IAS 8.
1.3.5. Disclosures
It should also be noted that in preparing these consolidated financial statements the Group omitted any information or disclosures which, not requiring disclosure due to their qualitative importance, were considered not to be material in accordance with the concept of materiality defined in the IFRS Conceptual Framework.

F. NOTES TO THE CONSOLIDATED FINANCIAL STATEMENTS Ɩ 157B
1.4. Exchange rates
As indicated above, Ferrovial conducts business outside the eurozone through various subsidiaries. The exchange rates used to translate their financial statements for their inclusion in the consolidated Group's consolidated financial statements are as follows:
Items in the balance sheets (closing exchange rates at 31 December 2017 and at 31 December 2016 for the comparative figures):
CLOSING EXCHANGE RATE 2017 2016 CHANGE 17/16 (*)
Pound sterling 0.8889 0.8545 4.03%
US dollar 1.2022 1.0547 13.99%
Canadian dollar 1.5059 1.41849 6.16%
Australian dollar 1.5389 1.4615 5.29%
Polish zloty 4.1755 4.4046 -5.20%
Chilean peso 739.8 705.71 4.83%
(*) A negative change represents a depreciation of the euro against the reference currency and a positive change represents an appreciation.
Items in the statements of profit or loss and statements of cash flows (cumulative average rates at 31 December 2017 and at 31 December 2016 for the comparative figures):
AVERAGE EXCHANGE RATE 2017 2016 CHANGE 17/16 (*)
Pound sterling 0.8751 0.8230 6.33%
US dollar 1.1391 1.1034 3.24%
Canadian dollar 1.4755 1.459 1.13%
Australian dollar 1.4813 1.4853 -0.27%
Polish zloty 4.2455 4.3606 -2.64%
Chilean peso 737.7217 742.4625 -0.64%
(*) A negative change represents a depreciation of the euro against the reference currency and a positive change represents an appreciation.
The main changes in the closing exchange rates vis-à-vis the euro were the depreciation of the pound sterling and the Chilean peso, as well as that of the US dollar, the Canadian dollar and the Australian dollar. By contrast, the Polish zloty appreciated against the euro. The impact in this connection recognised in equity attributable to the Parent was EUR -318 million (see Note 5.1.1, Changes in equity).
Note 5.4 provides an explanation of foreign currency risk management. It also contains an analysis of the impact that Brexit has had or might have in the future vis-à-vis the different financial risks affecting Ferrovial. This perspective is supplemented by a global analysis of Brexit in the Risks section of the directors' report.
In addition, a detail is provided of the exchange rate effect in those notes in which this effect is material.
1.5. Segment reporting
The segment statements of financial position and segment statements of profit or loss, for both 2017 and the comparative period, are shown in Appendix III.
Additionally, a breakdown by segment is included in those sections of this report where this information is material or is required by accounting legislation.
158 Ɩ 2017 CONSOLIDATED FINANCIAL STATEMENTS. FERROVIAL, S.A. AND SUBSIDIARIES
F. NOTES TO THE CONSOLIDATED FINANCIAL STATEMENTS B
SECTION 2: PROFIT FOR THE YEAR
This section comprises the Notes relating to the profit for the year.
Net profit for the year amounted to EUR 454 million, an improvement of 20.6% on 2016 (EUR 376 million).
This increase is affected by a series of non-recurring results related mainly to divestments, derivatives and taxes, per the following breakdown, and which are explained in more detail in the Notes indicated in the table:
Notwithstanding these non-recurring impacts, revenue grew by 13.5%, due mainly to the inclusion of a whole year of Broadspectrum (compared with seven months in 2016). However, profit from operations was down 7.4% on 2016, due mainly to the worsening of the margin of the Construction business. In like-for-like terms (see definition in the section on alternative performance measures), the aforementioned changes were growth of 7.2% and a fall of -8.6%, respectively (see the directors' report for a detailed explanation of the changes by business division).
BALANCES AT 31/12/17 BALANCES AT 31/12/16
NON-RECURRING IMPACTS (MILLIONS OF EUROS) PROFIT BEFORE TAX NET PROFIT PROFIT BEFORE TAX NET PROFIT
Impact of financial derivatives (Note 2.6) 35 26 -26 -18
Divestment, exclusion from consolidation and impairment of infrastructure projects (Note 2.5)
81 83 324 153
Non-recurring impacts, HAH (Note 2.7) 48 48 -105 -105
US tax reform (Note 2.8) 0 31 0 0
Other non-recurring tax effects (Note 2.8) 0 -14 0 20
Other impacts 0 0 0 -11
TOTAL 163 173 193 40
2.1. Operating income
The detail of the Group's operating income at 31 December 2017 is as follows:
(Millions of euros) 2017 2016
Revenue 12,208 10,759
Other operating income 10 7
Total operating income 12,218 10,765
The Group's revenue at 31 December 2017 relating to contracts with customers amounted to EUR 11,872 million (see Note 1.3.3.4, Revenue recognition).
by the concession operators that apply the financial asset model, amounting to EUR 153 million (2016: EUR 189 million), as described in Note 1.3.3.2.
received in 2017 amounting to EUR 10 million (2016: EUR 7 million).
The detail, by segment, of revenue in 2017 and 2016 is as follows:
31/12/17
(Millions of euros) EXTERNAL
SALES INTER-SEGMENT
SALES TOTAL CHANGE 17/16
Construction 4,139 489 4,628 10%
Toll roads 457 4 461 -5%
Airports 20 0 21 383%
Services 7,056 13 7,069 16%
Other segments 125 137 262 21%
Adjustments 0 -232 -232 5%
Total 11,797 411 12,208 13%
2016
(Millions of euros) EXTERNAL SALES INTER-SEGMENT
SALES TOTAL
Construction 3,721 474 4,194
Toll roads 486 1 486
Airports 4 0 4
Services 6,067 11 6,078
Other segments 305 132 217
Adjustments 0 -221 -221
Total 10,362 397 10,759
The inter-segment sales that are not eliminated in the Group's consolidated financial statements are the sales made by the Construction Division to the infrastructure concession operators, as discussed in Notes 1.3.3.2 and 6.8.
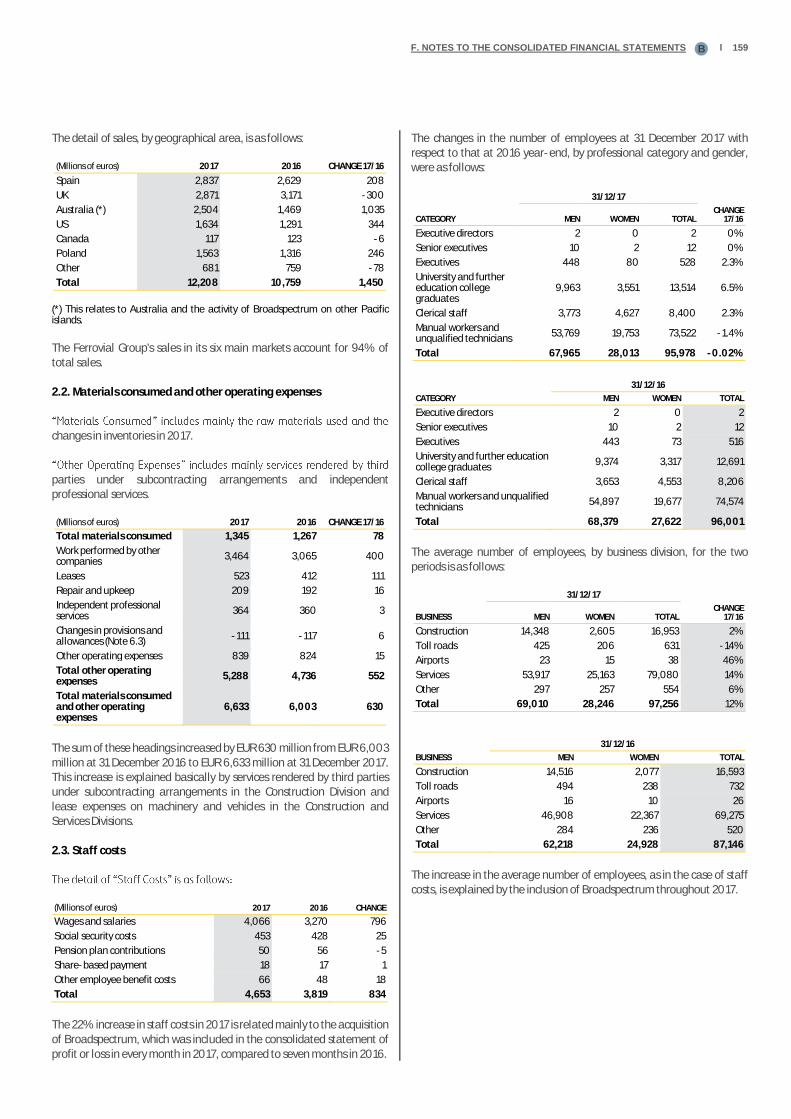
F. NOTES TO THE CONSOLIDATED FINANCIAL STATEMENTS Ɩ 159B
The detail of sales, by geographical area, is as follows:
(Millions of euros) 2017 2016 CHANGE 17/16
Spain 2,837 2,629 208
UK 2,871 3,171 -300
Australia (*) 2,504 1,469 1,035
US 1,634 1,291 344
Canada 117 123 -6
Poland 1,563 1,316 246
Other 681 759 -78
Total 12,208 10,759 1,450
(*) This relates to Australia and the activity of Broadspectrum on other Pacific islands.
The Ferrovial Group's sales in its six main markets account for 94% of total sales.
2.2. Materials consumed and other operating expenses
changes in inventories in 2017.
parties under subcontracting arrangements and independent professional services.
(Millions of euros) 2017 2016 CHANGE 17/16
Total materials consumed 1,345 1,267 78
Work performed by other companies
3,464 3,065 400
Leases 523 412 111
Repair and upkeep 209 192 16
Independent professional services
364 360 3
Changes in provisions and allowances (Note 6.3)
-111 -117 6
Other operating expenses 839 824 15
Total other operating expenses
5,288 4,736 552
Total materials consumed and other operating expenses
6,633 6,003 630
The sum of these headings increased by EUR 630 million from EUR 6,003 million at 31 December 2016 to EUR 6,633 million at 31 December 2017. This increase is explained basically by services rendered by third parties under subcontracting arrangements in the Construction Division and lease expenses on machinery and vehicles in the Construction and Services Divisions.
2.3. Staff costs
(Millions of euros) 2017 2016 CHANGE
Wages and salaries 4,066 3,270 796
Social security costs 453 428 25
Pension plan contributions 50 56 -5
Share-based payment 18 17 1
Other employee benefit costs 66 48 18
Total 4,653 3,819 834
The 22% increase in staff costs in 2017 is related mainly to the acquisition of Broadspectrum, which was included in the consolidated statement of profit or loss in every month in 2017, compared to seven months in 2016.
The changes in the number of employees at 31 December 2017 with respect to that at 2016 year-end, by professional category and gender, were as follows:
31/12/17
CATEGORY MEN WOMEN TOTAL CHANGE
17/16
Executive directors 2 0 2 0%
Senior executives 10 2 12 0%
Executives 448 80 528 2.3%
University and further education college graduates
9,963 3,551 13,514 6.5%
Clerical staff 3,773 4,627 8,400 2.3%
Manual workers and unqualified technicians
53,769 19,753 73,522 -1.4%
Total 67,965 28,013 95,978 -0.02%
CATEGORY
31/12/16
MEN WOMEN TOTAL
Executive directors 2 0 2
Senior executives 10 2 12
Executives 443 73 516
University and further education college graduates
9,374 3,317 12,691
Clerical staff 3,653 4,553 8,206
Manual workers and unqualified technicians
54,897 19,677 74,574
Total 68,379 27,622 96,001
The average number of employees, by business division, for the two periods is as follows:
BUSINESS
31/12/17
MEN WOMEN TOTAL CHANGE
17/16
Construction 14,348 2,605 16,953 2%
Toll roads 425 206 631 -14%
Airports 23 15 38 46%
Services 53,917 25,163 79,080 14%
Other 297 257 554 6%
Total 69,010 28,246 97,256 12%
BUSINESS
31/12/16
MEN WOMEN TOTAL
Construction 14,516 2,077 16,593
Toll roads 494 238 732
Airports 16 10 26
Services 46,908 22,367 69,275
Other 284 236 520
Total 62,218 24,928 87,146
The increase in the average number of employees, as in the case of staff costs, is explained by the inclusion of Broadspectrum throughout 2017.
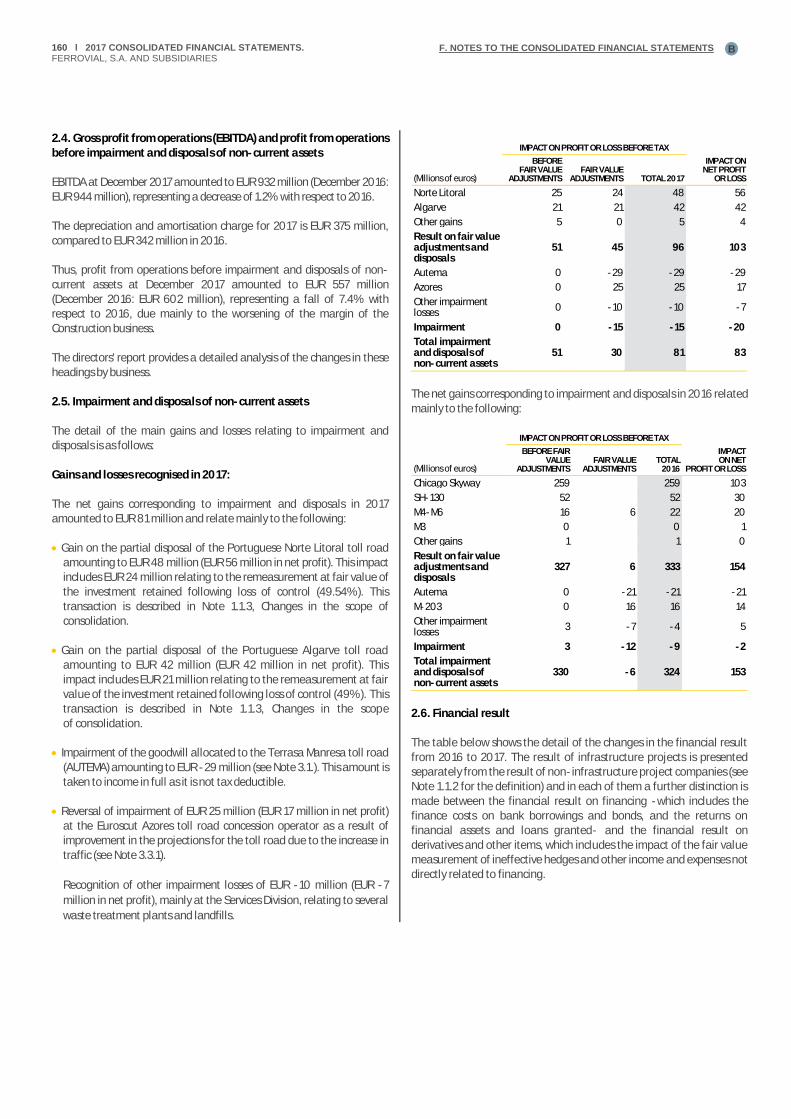
160 Ɩ 2017 CONSOLIDATED FINANCIAL STATEMENTS. FERROVIAL, S.A. AND SUBSIDIARIES
F. NOTES TO THE CONSOLIDATED FINANCIAL STATEMENTS B
2.4. Gross profit from operations (EBITDA) and profit from operations before impairment and disposals of non-current assets
EBITDA at December 2017 amounted to EUR 932 million (December 2016: EUR 944 million), representing a decrease of 1.2% with respect to 2016.
The depreciation and amortisation charge for 2017 is EUR 375 million, compared to EUR 342 million in 2016.
Thus, profit from operations before impairment and disposals of non-current assets at December 2017 amounted to EUR 557 million (December 2016: EUR 602 million), representing a fall of 7.4% with respect to 2016, due mainly to the worsening of the margin of the Construction business.
The directors' report provides a detailed analysis of the changes in these headings by business.
2.5. Impairment and disposals of non-current assets
The detail of the main gains and losses relating to impairment and disposals is as follows:
Gains and losses recognised in 2017:
The net gains corresponding to impairment and disposals in 2017 amounted to EUR 81 million and relate mainly to the following:
• Gain on the partial disposal of the Portuguese Norte Litoral toll roadamounting to EUR 48 million (EUR 56 million in net profit). This impactincludes EUR 24 million relating to the remeasurement at fair value of the investment retained following loss of control (49.54%). This transaction is described in Note 1.1.3, Changes in the scope of consolidation.
• Gain on the partial disposal of the Portuguese Algarve toll roadamounting to EUR 42 million (EUR 42 million in net profit). Thisimpact includes EUR 21 million relating to the remeasurement at fairvalue of the investment retained following loss of control (49%). Thistransaction is described in Note 1.1.3, Changes in the scope of consolidation.
• Impairment of the goodwill allocated to the Terrasa Manresa toll road(AUTEMA) amounting to EUR -29 million (see Note 3.1.). This amount is taken to income in full as it is not tax deductible.
• Reversal of impairment of EUR 25 million (EUR 17 million in net profit) at the Euroscut Azores toll road concession operator as a result of improvement in the projections for the toll road due to the increase in traffic (see Note 3.3.1).
Recognition of other impairment losses of EUR -10 million (EUR -7
million in net profit), mainly at the Services Division, relating to several
waste treatment plants and landfills.
IMPACT ON PROFIT OR LOSS BEFORE TAX
(Millions of euros)
BEFORE FAIR VALUE
ADJUSTMENTS FAIR VALUE
ADJUSTMENTS TOTAL 2017
IMPACT ON NET PROFIT
OR LOSS
Norte Litoral 25 24 48 56
Algarve 21 21 42 42
Other gains 5 0 5 4
Result on fair value adjustments and disposals
51 45 96 103
Autema 0 -29 -29 -29
Azores 0 25 25 17
Other impairment losses
0 -10 -10 -7
Impairment 0 -15 -15 -20
Total impairment and disposals of non-current assets
51 30 81 83
The net gains corresponding to impairment and disposals in 2016 related mainly to the following:
IMPACT ON PROFIT OR LOSS BEFORE TAX
(Millions of euros)
BEFORE FAIR VALUE
ADJUSTMENTS FAIR VALUE
ADJUSTMENTS TOTAL
2016
IMPACT ON NET
PROFIT OR LOSS
Chicago Skyway 259 259 103
SH-130 52 52 30
M4-M6 16 6 22 20
M3 0 0 1
Other gains 1 1 0
Result on fair value adjustments and disposals
327 6 333 154
Autema 0 -21 -21 -21
M-203 0 16 16 14
Other impairment losses
3 -7 -4 5
Impairment 3 -12 -9 -2
Total impairment and disposals of non-current assets
330 -6 324 153
2.6. Financial result
The table below shows the detail of the changes in the financial result from 2016 to 2017. The result of infrastructure projects is presented separately from the result of non-infrastructure project companies (see Note 1.1.2 for the definition) and in each of them a further distinction is made between the financial result on financing -which includes the finance costs on bank borrowings and bonds, and the returns on financial assets and loans granted- and the financial result on derivatives and other items, which includes the impact of the fair value measurement of ineffective hedges and other income and expenses not directly related to financing.

F. NOTES TO THE CONSOLIDATED FINANCIAL STATEMENTS Ɩ 161B
(Millions of euros) 2017 2016 CHANGE
Finance income on financing 2 1 160%
Finance costs on financing -256 -306 16%
Financial result on financing of infrastructure projects
-254 -305 17%
Result on derivatives (*) 0 -12 100%
Other financial results -6 -7 17%
Other financial results of infrastructure projects
-6 -20 69%
Total financial result of infrastructure projects
-261 -325 20%
Finance income on financing 54 43 24%
Finance costs on financing -83 -92 10%
Financial result on financing excluding infrastructure projects
-29 -49 40%
Result on derivatives (*) 35 -13 -361%
Other financial results -56 -4 n.m.
Other financial results excluding infrastructure projects
-21 -18 20%
Total financial result excluding infrastructure projects
-50 -66 -24%
Financial result -311 -391 20%
the consolidated statement of profit or loss for a total amount of EUR 35 million (2016: EUR -26 million).
• The financial result on the financing of the infrastructure projectcompanies: amounted to EUR -254 million in 2017 (31 December 2016: EUR -305 million). Of this result, EUR -256 million relate to these
costs. The following table shows a detail of these borrowing costs, which include the capitalised costs of toll roads under construction:
BORROWING COSTS OF INFRASTRUCTURE PROJECT COMPANIES (Millions of euros) 2017 2016
Accrued finance costs -298 -342
Borrowing costs capitalised during the construction period
42 36
Finance costs recognised in profit or loss -256 -306
The improved financial result on financing is due mainly to the changes in the scope of consolidation in 2016 (sale of the Chicago Skyway toll road and the Irish M3 and M4/M6 toll roads and the filing for Chapter 11 insolvency of the SH-130 toll road); in 2016 these companies contributed a financial result on financing of EUR -36 million. In addition to the above impact, it should be noted that in 2017 partial divestments, with the consequent loss of control, were made of the Portuguese Norte Litoral (April) and Algarve (September) toll roads, as a result of which a finance cost of only EUR -12 million accrued, compared with EUR -22 million in 2016.
• Other financial results of infrastructure projects: include mainlyother financial results, which include exchange differences and other results considered to be of a financial nature but not directly related to financing. The change compared to 2016 (EUR 14 million) is due mainly to the impact in 2016 of the result on derivatives (EUR -12 million), most notably Autopista del Sol (EUR -11 million) as a result of the termination of the interest rate swap held by it, as part of the refinancing of its debt, which did not take place in 2017.
• The financial result on financing excluding infrastructure projects in 2017 amounted to EUR -29 million (31 December 2016: EUR -49million), corresponding to borrowing costs (EUR -83 million) net of the interest obtained mainly from financial investments (EUR 54 million). The improvement compared with 2016 is due mainly to the higherreturns on available cash than in 2016 (larger position in Canadian
dollars, which is remunerated at better rates than the eurozone) and the reduction of debt in 2017 (mainly the repayment of the High Yield Bonds at Broadspectrum in April 2017 for AUD 325 million -EUR 243 million-), the net amount of the cross-currency swap.
• Other financial results excluding infrastructure projects includethe impact of derivatives and other fair value adjustments relatingmainly to the impact of the derivatives not designated as hedges,including most notably Canadian dollar-denominated optionsamounting to EUR 22 million, aimed at hedging the cash balancesthe Group holds in that currency, and the equity swaps arranged bythe Group to hedge the impact on equity of share-based variableremuneration schemes (see Note 6.7) with a positive impact in 2017of EUR 5 million due to the positive performance of the share pricein 2017.
Excluding the impact of derivatives, the detail of other financial results excluding infrastructure projects is as follows:
OTHER FINANCIAL RESULTS EXCLUDING INFRASTRUCTURE PROJECTS (Millions of euros) 2017 2016 CHANGE 17/16
Cost of guarantees -30 -30 0
Late-payment interest 5 12 -7
Exchange differences -8 5 -12
Interest on loans to companies accounted for using the equity method
17 24 -8
Finance costs on pension plans -4 -1 -3
Interest on tax assessments -7 -7 -1
Other -30 -8 -22
Total -56 -4 -52
This sub-heading includes mainly the cost of guarantees, late-payment interest, exchange differences, interest on loans granted to companies accounted for using the equity method, finance costs on pension plans and interest on tax assessments. The other items in 2017 include basically the impact of EUR -15 million relating to the repayment of the High Yield Bonds at Broadspectrum (see Note 5.2.2). These borrowings bore very high finance costs (8.38%) and, therefore, the repayment -infrastructure project finance costs.
The same line item also includes the costs relating to the penalty incurred for the delay in delivering a waste treatment plant in the UK (EUR -10 million), which was calculated as a specific rate of interest on the amount of the borrowings of the concession operator.
• Impact on cash flows: As can be observed in the following table, the difference between the financial result on financing and the interest cash flows reported in the statement of cash flows is EUR -90 million.
(Millions of euros)
FINANCIAL RESULT ON
UNCAPITALISED FINANCING
INTEREST CASH FLOWS DIFFERENCE
Infrastructure projects -296 -204 -92
Excluding infrastructure projects
-29 -32 2
Total -326 -236 -90
This difference at infrastructure project level arose mainly at the US toll roads (NTE, LBJ, NTE Segment 3 and I-77), whose financing arrangements allow for the compounding of interest in the first years of the concession,

162 Ɩ 2017 CONSOLIDATED FINANCIAL STATEMENTS.
FERROVIAL, S.A. AND SUBSIDIARIES
F. NOTES TO THE CONSOLIDATED FINANCIAL STATEMENTS
B
as a result of which the interest is added to the principal and does not represent a cash outflow in the year (EUR -83 million).
2.7. Share of profits of companies accounted for using the equity method
The share of the net profit of companies accounted for using the equity method in 2017 amounted to EUR 251 million (2016: EUR 82 million). The detail of the most significant companies is as follows:
RESULT OF COMPANIES ACCOUNTED FOR USING THE EQUITY METHOD (Millions of euros) 2017 2016
HAH 87 -57 407 ETR 125 98 Other 39 41 Total 251 82
In 2017 HAH's results include most notably non-recurring impacts totalling EUR 48 million, due to the effect of fair value adjustments, relating mainly to the measurement of index-linked derivatives (EUR 33 million). The difference compared to 2016 is because HAH's loss for 2016 included non-recurring losses of EUR -105 million relating to derivatives and taxes.
Note 3.5 provides greater detail on the results of these companies.
2.8. Income tax and deferred taxes
2.8.1. Explanation of the income tax expense for the year and the applicable tax rate
The income tax expense for 2017 amounted to EUR 71 million (2016: EUR 233 million), a figure which:
• Does not include the income tax expense relating to the companies accounted for using the equity method (see Notes 2.7 and 3.5), since, in accordance with accounting legislation, their results are presented net of the related tax effect.
• Includes income tax benefit amounting to EUR 17 million relating to prior years’ income tax, mainly as a result of the reduction in the US tax rate from 35% to 21% (EUR 31 million) and other regularizations (EUR -14 million).
Excluding the result of these companies accounted for using the equity method (profit after tax of EUR 251 million), permanent differences (EUR -32 million), results arising from consolidation with no tax impact ((EUR 4 million) and taking into consideration the income tax expense incurred in 2017 (EUR 88 million), the resulting effective income tax rate is 25%, as evidenced in the table below.
This effective tax rate is in line with the rates applicable in the main countries in which Ferrovial has a presence.
2017 (Millions of euros) SPAIN UK
AUSTRALIA (*) US POLAND CANADA
OTHER COUNTRIES(**) TOTAL
Profit/Loss before tax 139 61 -44 16 135 117 154 578
Result of companies accounted for using the equity method
-14 -100 -4 12 0 -130 -14 -251
Permanent differences 15 9 -19 5 3 37 -18 32
Results arising from consolidation with no tax impact
34 3 0 15 0 4 -59 -4
Taxable profit/Tax loss 174 -28 -67 47 137 28 63 355
Current income tax expense/ benefit
-49 7 20 5 -27 -12 -15 -71
Change in estimate of prior years' taxes
6 -1 -7 -22 0 4 4 -17
Adjusted tax expense/benefit -43 5 13 -16 -27 -7 -11 -88
Effective rate applicable to taxable profit
25% 19% 19% 35% 20% 27% 18% 25%
Effective tax rate of the country 25% 19% 20%(*) 35% 19% 27%
(*) This relates to Australia and the activity of Broadspectrum on other Pacific islands. The effective income tax rate of the country is obtained by combining the tax rates of the various countries.
(**) "Other Countries" includes mainly the profit generated in Portugal.
Following is an explanation of the various items that must be adjusted in order to calculate the effective tax rate:
Permanent differences. This item relates to period expenses or income which, pursuant to the tax legislation applicable in each of the countries, are not deductible (expenses) or taxable (income) in the year, and are not expected to be deductible or taxable in future years. The cumulative balance in this connection is an expense of EUR 32 million. The detail of the most significant of these adjustments is as follows:
• Gains on the sale of the Portuguese toll roads (EUR 46 million), which are exempt from taxation.
• Losses on specific construction and services projects performed outside Spain that do not give rise to a tax asset (EUR -86 million).
• Recovery for tax purposes, pursuant to Royal Decree 3/2016, of the impairment losses on investments, which increase the taxable profit by EUR 14 million. The recovery is made within five years, with last year application in 2020.
Results arising from consolidation with no tax impact. This item relates to results derived from accounting consolidation criteria which do not have any tax implications. The cumulative balance in this connection is income of EUR 4 million. The detail of the most significant of these adjustments is as follows:
• Losses of infrastructure project companies in the US in which other companies have ownership interests and which are fully consolidated. The tax asset is recognised solely at Ferrovial's percentage of ownership as these companies are taxed under the pass-through tax rules; the shareholders of these companies are the taxpayers, at the percentage of ownership that they hold therein. The adjustment in this connection amounts to EUR -15 million and relates to the tax asset allocable to the other shareholders.

F. NOTES TO THE CONSOLIDATED FINANCIAL STATEMENTS Ɩ 163B
• Impairment of EUR -29 million of the goodwill of the Autema toll road, with no tax impact (see Note 2.5).
• Gain arising from the revaluation of the ownership interest in the Portuguese toll roads (EUR 45 million), which under current legislation is not subject to taxation.
The following table includes the detail of the calculation of the effective tax rate for 2016.
2016 (Millions of euros) SPAIN UK US POLAND CANADA
OTHER COUNTRIES
(*) TOTAL
Profit/Loss before tax 113 -81 259 115 112 99 617
Result of companies accounted for using the equity method
-10 45 0 0 -103 -13 -82
Permanent differences -19 10 4 6 14 -2 13
Results arising from consolidation with no tax impact
2 0 186 0 0 -17 171
Taxable profit/Tax loss 87 -26 450 121 22 67 719
Current income tax expense/benefit
7 5 -208 -24 -10 -4 -233
Change in estimate of prior years' taxes -29 0 32 1 4 -3 5
Adjusted tax expense/benefit -22 5 -176 -23 -6 -7 -229
Effective rate applicable to taxable profit
25% 19% 39% 19% 27% 11% 32%
Effective tax rate of the country 25% 20% 39% 19% 27%
(*) "Other Countries" includes mainly the profit generated in Portugal, Ireland and Australia.
2.8.2 Detail of the current and deferred tax expense and the tax paid in the year
The breakdown of the income tax expense for 2017 and 2016, differentiating between current tax, deferred tax and changes in estimates of prior years' taxes, is as follows:
(Millions of euros) 2017 2016
Current income tax expense/benefit
-71 -233
Current tax expense -70 -74
Deferred tax expense -43 -128
Tax effect of consolidation adjustments in equity
25 -26
Change in estimate of prior years' taxes and other adjustments
17 -5
The amount of income tax paid in the year was EUR 142 million, as shown in the note on cash flows (see Note 5.3).
2.8.3. Changes in deferred tax assets and liabilities
The detail of the changes in the deferred tax assets and deferred tax liabilities in 2017 is as follows:
ASSETS (Millions of euros)
BALANCE AT
01/01/17
TRANSFERS AND
OTHER
CHANGE IN
ESTIMATE OF
PRIOR
TAXES
CHARGE/CREDIT TO
PROFIT OR LOSS
CHARGE/ CREDIT
TO EQUITY
EXCHANGE
RATE EFFECT
IFRS 15
BALANCE AT
31/12/17
Tax assets 311 15 17 17 0 -6 0 353
Differences between tax and accounting income and expense recognition methods
557 -17 -18 -67 3 2 3 462
Deferred tax assets arising from valuation adjustments
144 -2 0 0 -29 -1 0 112
Other 45 16 -3 1 0 -5 55 107
Total 1,056 11 -4 -50 -26 -11 58 1,035
LIABILITIES (Millions of euros)
BALANCE AT
01/01/17
TRANSFERS AND
OTHER
CHANGE IN
ESTIMATE OF
PRIOR
TAXES
CHARGE/CREDIT TO
PROFIT OR LOSS
CHARGE/ CREDIT
TO EQUITY
EXCHANGE
RATE EFFECT
IFRS 15
BALANCE AT
31/12/17
Deferred tax liabilities relating to goodwill
270 -53 -8 13 0 1 0 223
Differences between tax and accounting income and expense recognition methods
243 44 -1 -8 1 -2 0 278
Deferred tax liabilities arising from valuation adjustments
416 -1 -25 -9 4 -38 -2 344
Other 51 12 2 -4 0 -6 0 55
Total 979 2 -32 -7 5 -45 -2 900
The changes in the deferred tax assets and liabilities include most notably the impact recognised as a result of the early application of IFRS 15, Revenue from contracts with customers (see Note 1.3.1-a), totalling EUR 60 million (net of deferred assets and liabilities).
The deferred tax assets and liabilities recognised at 31 December 2017 arose mainly from:
a) Tax assets
These relate to tax assets which have not yet been deducted by the Group companies. This item does not include all the existing tax assets, but rather only those that, based on the Group's projections, are expected to be able to be used before they expire. The balance recognised totalled EUR 353 million, of which EUR 298 million related to recognised tax losses and the remainder to unused double taxation, reinvestment and other tax credits totalling EUR 228 million at 31 December 2017 (2016: EUR 207 million), of which EUR 55 million have been recognised.

164 Ɩ 2017 CONSOLIDATED FINANCIAL STATEMENTS. FERROVIAL, S.A. AND SUBSIDIARIES
F. NOTES TO THE CONSOLIDATED FINANCIAL STATEMENTS B
The detail of the total tax loss carryforwards, distinguishing between the maximum tax asset and the tax asset recognised based on the projected recoverability thereof, is as follows:
COUNTRY TAX LOSS LAST YEARS FOR OFFSET
MAXIMUM TAX ASSET
TAX ASSET RECOGNISED
Spanish consolidated tax group
755 No expiry date
190 190
US consolidated tax group
82 2030-2038 17 0
Australia 246 No expiry date
74 72
UK 76 No expiry date
13 8
Other 455 2018-No expiry date
118 28
Total 1,614 412 298
Spanish consolidated tax group:
The tax loss carryforwards of the consolidated tax group in Spain at 2017 year-end totalled EUR 190 million. For the purpose of ascertaining the recoverability of these assets, a model was designed that takes into account the changes introduced by Royal Decree 3/2016 and uses the Group companies' latest available earnings projections. Based on this model, the Group will recover all the tax loss carryforwards, since profits will be generated on a recurring basis in the projected period, as well as the tax credits already recognised (EUR 41 million), and, accordingly, they have been retained in the consolidated statement of financial position.
US consolidated tax group:
At 31 December 2017, the balance of tax loss carryforwards of the consolidated tax group in the US totalled EUR 82 million, of which EUR 17 million had been recognised in prior years. In a similar fashion to the consolidated tax group in Spain, a model was designed that uses the latest available earnings projections of the US consolidated tax group companies. In line with the approach adopted in previous years, it was decided to not to recognise the full amount of the tax assets since profit is not expected to be reported until 2024 and the projections could vary significantly depending on the new infrastructure projects that may be awarded.
Australian consolidated tax group:
Following the acquisition of Broadspectrum, Ferrovial established a consolidated tax group with all of its Australian companies. The tax losses recognised relate mainly to historical losses incurred by Broadspectrum (EUR 63 million) and the Construction Division (EUR 10 million). As in the foregoing cases, a projections model was prepared in which it is concluded that the group will generate taxable profits on a systematic basis in the coming years. On the basis of this conclusion, a decision was made to continue to recognise the tax losses.
UK:
The new UK tax regime came into effect on 1 April 2017 and gave rise to new regulations with an impact on the UK consolidated tax group. The main changes relate to the limitation of the use of tax loss carryforwards; the possibility of using them to offset 100% of taxable profit of up to GBP 5 million and 50% of the remaining amount of taxable profit, with no time limit and irrespective of whether the losses were generated before or after the entry into force of the reform. Also, tax loss carryforwards can be used by any company in the consolidated tax group. Under the new regime, in 2017 tax losses totalling EUR 8 million were recognised in the UK.
b) Assets and liabilities arising from timing differences between the accounting and tax income and expense recognition methods
This item relates to the tax impact resulting from the fact that the timing of recognition of certain expenses or depreciation and amortisation charges is different for accounting and tax purposes.
The recognition of a tax asset in this connection means that certain expenses have been recognised for accounting purposes before their recognition for tax purposes and, therefore, the Company will recover these expenses for tax purposes in future years. Conversely, a liability in this connection represents an expense that is recognised for tax purposes before its recognition for accounting purposes.
The deferred tax assets include most notably:
• Provisions recognised for accounting purposes which do not have a tax effect until they are materialised (EUR 200 million).
• Deferred tax assets of EUR 132 million arising as a result of differencesbetween the tax and accounting methods used to recognise income, mainly in the Construction Division.
• Differences relating to borrowing costs at concession operators in Spain,which for tax purposes are recognised as an asset and subsequently amortised whereas for accounting purposes they are expensed currently (EUR 84 million).
• Accelerated depreciation and amortisation for accounting purposes(EUR 44 million).
Within liabilities, the balance is related mainly to:
• Differences between tax and accounting criteria in relation to therecognition of provisions (EUR 353 million).
• Deferred tax liabilities of EUR 40 million arising as a result of differencesbetween the tax and accounting methods used to recognise income in conformity with IFRIC 12, mainly in the Toll Road Division.
c) Deferred taxes arising from valuation adjustments
This reflects the cumulative tax impact resulting from valuation adjustments recognised in reserves. This impact appears as an asset or liability since there is generally no direct tax effect until this amount in reserves is transferred to profit or loss.
The asset balance relates to accumulated losses in reserves that will have a tax impact when they are recognised in profit or loss. Conversely, the liability balance relates to gains not yet recognised for tax purposes. Noteworthy are the deferred tax asset and liability relating to financial derivatives amounting to EUR 101 million and EUR 81 million, respectively.
d) Deferred taxes relating to goodwill
These correspond to deferred tax liabilities relating to the tax credit for goodwill amounting to EUR 223 million, which mainly include those related to the amortisation of the of Amey and Swissport goodwill, as discussed in Note 6.5.1.b.
The detail of the changes in the deferred tax assets and deferred tax liabilities in 2016 is as follows:
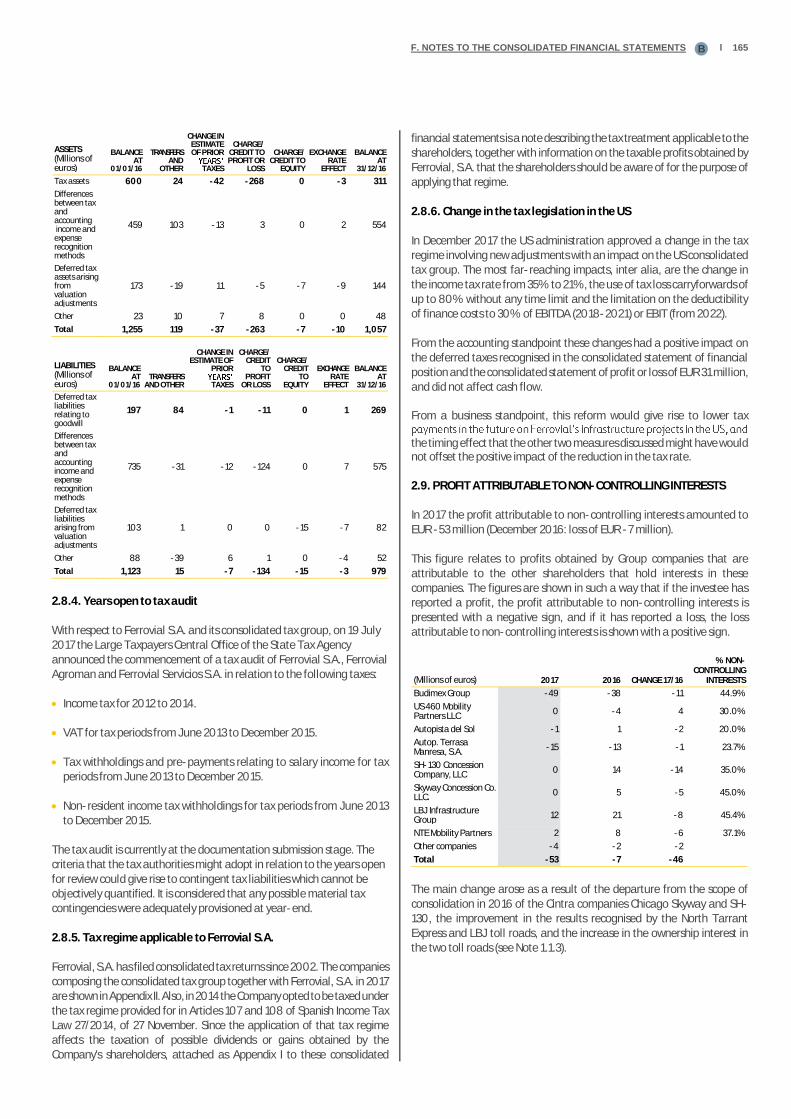
F. NOTES TO THE CONSOLIDATED FINANCIAL STATEMENTS Ɩ 165B
ASSETS (Millions of euros)
BALANCE AT
01/01/16
TRANSFERS AND
OTHER
CHANGE IN ESTIMATE OF PRIOR
TAXES
CHARGE/ CREDIT TO PROFIT OR
LOSS
CHARGE/ CREDIT TO
EQUITY
EXCHANGE RATE
EFFECT
BALANCE AT
31/12/16
Tax assets 600 24 -42 -268 0 -3 311
Differences between tax and accounting income and expense recognition methods
459 103 -13 3 0 2 554
Deferred tax assets arising from valuation adjustments
173 -19 11 -5 -7 -9 144
Other 23 10 7 8 0 0 48
Total 1,255 119 -37 -263 -7 -10 1,057
LIABILITIES (Millions of euros)
BALANCE AT
01/01/16 TRANSFERS
AND OTHER
CHANGE IN ESTIMATE OF
PRIOR
TAXES
CHARGE/ CREDIT
TO PROFIT
OR LOSS
CHARGE/ CREDIT
TO EQUITY
EXCHANGE RATE
EFFECT
BALANCE AT
31/12/16
Deferred tax liabilities relating to goodwill
197 84 -1 -11 0 1 269
Differences between tax and accounting income and expense recognition methods
735 -31 -12 -124 0 7 575
Deferred tax liabilities arising from valuation adjustments
103 1 0 0 -15 -7 82
Other 88 -39 6 1 0 -4 52
Total 1,123 15 -7 -134 -15 -3 979
2.8.4. Years open to tax audit
With respect to Ferrovial S.A. and its consolidated tax group, on 19 July 2017 the Large Taxpayers Central Office of the State Tax Agency announced the commencement of a tax audit of Ferrovial S.A., Ferrovial Agroman and Ferrovial Servicios S.A. in relation to the following taxes:
• Income tax for 2012 to 2014.
• VAT for tax periods from June 2013 to December 2015.
• Tax withholdings and pre-payments relating to salary income for tax periods from June 2013 to December 2015.
• Non-resident income tax withholdings for tax periods from June 2013 to December 2015.
The tax audit is currently at the documentation submission stage. The criteria that the tax authorities might adopt in relation to the years open for review could give rise to contingent tax liabilities which cannot be objectively quantified. It is considered that any possible material tax contingencies were adequately provisioned at year-end.
2.8.5. Tax regime applicable to Ferrovial S.A.
Ferrovial, S.A. has filed consolidated tax returns since 2002. The companies composing the consolidated tax group together with Ferrovial, S.A. in 2017 are shown in Appendix II. Also, in 2014 the Company opted to be taxed under the tax regime provided for in Articles 107 and 108 of Spanish Income Tax Law 27/2014, of 27 November. Since the application of that tax regime affects the taxation of possible dividends or gains obtained by the Company's shareholders, attached as Appendix I to these consolidated
financial statements is a note describing the tax treatment applicable to the shareholders, together with information on the taxable profits obtained by Ferrovial, S.A. that the shareholders should be aware of for the purpose of applying that regime.
2.8.6. Change in the tax legislation in the US
In December 2017 the US administration approved a change in the tax regime involving new adjustments with an impact on the US consolidated tax group. The most far-reaching impacts, inter alia, are the change in the income tax rate from 35% to 21%, the use of tax loss carryforwards of up to 80% without any time limit and the limitation on the deductibility of finance costs to 30% of EBITDA (2018-2021) or EBIT (from 2022).
From the accounting standpoint these changes had a positive impact on the deferred taxes recognised in the consolidated statement of financial position and the consolidated statement of profit or loss of EUR 31 million, and did not affect cash flow.
From a business standpoint, this reform would give rise to lower tax
the timing effect that the other two measures discussed might have would not offset the positive impact of the reduction in the tax rate.
2.9. PROFIT ATTRIBUTABLE TO NON-CONTROLLING INTERESTS
In 2017 the profit attributable to non-controlling interests amounted to EUR -53 million (December 2016: loss of EUR -7 million).
This figure relates to profits obtained by Group companies that are attributable to the other shareholders that hold interests in these companies. The figures are shown in such a way that if the investee has reported a profit, the profit attributable to non-controlling interests is presented with a negative sign, and if it has reported a loss, the loss attributable to non-controlling interests is shown with a positive sign.
(Millions of euros) 2017 2016 CHANGE 17/16
% NON-CONTROLLING
INTERESTS
Budimex Group -49 -38 -11 44.9%
US 460 Mobility Partners LLC
0 -4 4 30.0%
Autopista del Sol -1 1 -2 20.0%
Autop. Terrasa Manresa, S.A.
-15 -13 -1 23.7%
SH-130 Concession Company, LLC
0 14 -14 35.0%
Skyway Concession Co. LLC.
0 5 -5 45.0%
LBJ Infrastructure Group
12 21 -8 45.4%
NTE Mobility Partners 2 8 -6 37.1%
Other companies -4 -2 -2
Total -53 -7 -46
The main change arose as a result of the departure from the scope of consolidation in 2016 of the Cintra companies Chicago Skyway and SH-130, the improvement in the results recognised by the North Tarrant Express and LBJ toll roads, and the increase in the ownership interest in the two toll roads (see Note 1.1.3).

166 Ɩ 2017 CONSOLIDATED FINANCIAL STATEMENTS. FERROVIAL, S.A. AND SUBSIDIARIES
F. NOTES TO THE CONSOLIDATED FINANCIAL STATEMENTS B
2.10. NET PROFIT AND EARNINGS PER SHARE
The calculation of basic earnings per share attributable to the Parent is as follows:
(Millions of euros) 2017 2016
Net profit attributable to the Parent (millions of euros)
454 376
Weighted average number of shares outstanding (thousands of shares)
738,216 738,112
Less average number of treasury shares (thousands of shares)
-7,324 -7,188
Average number of shares to calculate basic earnings per share
730,892 730,923
Basic/diluted earnings per share (euros)
0.62 0.51
Diluted earnings per share. At 31 December 2017 and 2016, the Group did not have any dilutive potential ordinary shares, since no convertible debt instruments were issued and the share-based remuneration schemes described in Note 6.7 will not give rise to any capital increases at the Group, as explained in that Note. Consequently, no dilutive impact is envisaged when employee rights under the plans are exercised.
The detail of net profit by geographical area is as follows:
(Millions of euros) 2017 2016 CHANGE 17/16
Spain 73 101 -28
UK 66 -113 179
US 34 87 -53
Australia (*) -23 5 -28
Canada 105 93 12
Poland 60 53 7
Other 138 151 -13
Total 454 376 78
(*) The information reported relates to Australia and the other Pacific islands.
The earnings by business segment are shown in Appendix III.
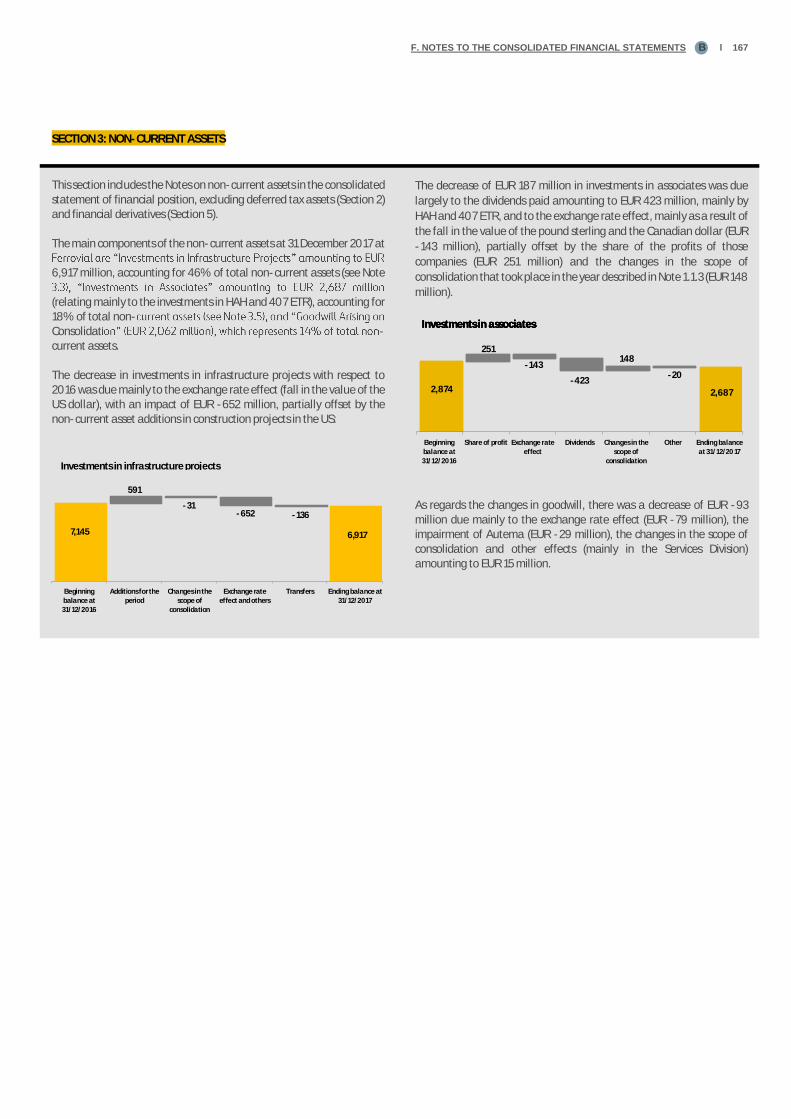
F. NOTES TO THE CONSOLIDATED FINANCIAL STATEMENTS Ɩ 167B
7,145
591
-31-652 -136
6,917
Beginning
balance at
31/12/2016
Additions for the
period
Changes in the
scope of
consolidation
Exchange rate
effect and others
Transfers Ending balance at
31/12/2017
Investments in infrastructure projects
SECTION 3: NON-CURRENT ASSETS
This section includes the Notes on non-current assets in the consolidated statement of financial position, excluding deferred tax assets (Section 2) and financial derivatives (Section 5).
The main components of the non-current assets at 31 December 2017 at
6,917 million, accounting for 46% of total non-current assets (see Note
(relating mainly to the investments in HAH and 407 ETR), accounting for 18% of total non-Consolidat -current assets.
The decrease in investments in infrastructure projects with respect to 2016 was due mainly to the exchange rate effect (fall in the value of the US dollar), with an impact of EUR -652 million, partially offset by the non-current asset additions in construction projects in the US:
The decrease of EUR 187 million in investments in associates was due
largely to the dividends paid amounting to EUR 423 million, mainly by
HAH and 407 ETR, and to the exchange rate effect, mainly as a result of
the fall in the value of the pound sterling and the Canadian dollar (EUR
-143 million), partially offset by the share of the profits of those
companies (EUR 251 million) and the changes in the scope of
consolidation that took place in the year described in Note 1.1.3 (EUR 148
million).
As regards the changes in goodwill, there was a decrease of EUR -93 million due mainly to the exchange rate effect (EUR -79 million), the impairment of Autema (EUR -29 million), the changes in the scope of consolidation and other effects (mainly in the Services Division) amounting to EUR 15 million.
2,874
251
-143
-423
148
-20
2,687
Beginning
balance at
31/12/2016
Share of profit Exchange rate
effect
Dividends Changes in the
scope of
consolidation
Other Ending balance
at 31/12/2017
Investments in associatesInvestments in associatesInvestments in associatesInvestments in associates
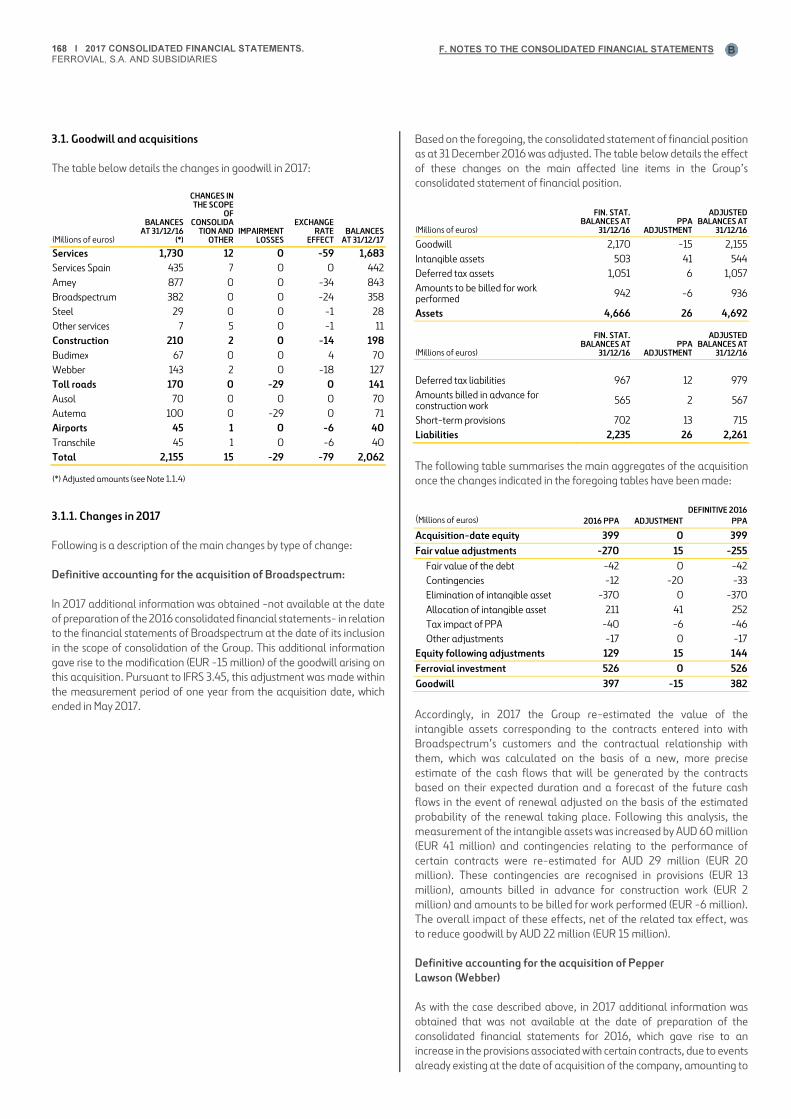
168 Ɩ 2017 CONSOLIDATED FINANCIAL STATEMENTS.
FERROVIAL, S.A. AND SUBSIDIARIES
F. NOTES TO THE CONSOLIDATED FINANCIAL STATEMENTS
B
3.1. Goodwill and acquisitions
The table below details the changes in goodwill in 2017:
(Millions of euros)
BALANCES AT 31/12/16
(*)
CHANGES IN THE SCOPE
OF CONSOLIDA
TION AND OTHER
IMPAIRMENT LOSSES
EXCHANGE RATE
EFFECT BALANCES
AT 31/12/17
Services 1,730 12 0 -59 1,683 Services Spain 435 7 0 0 442 Amey 877 0 0 -34 843 Broadspectrum 382 0 0 -24 358 Steel 29 0 0 -1 28 Other services 7 5 0 -1 11 Construction 210 2 0 -14 198 Budimex 67 0 0 4 70 Webber 143 2 0 -18 127 Toll roads 170 0 -29 0 141 Ausol 70 0 0 0 70 Autema 100 0 -29 0 71 Airports 45 1 0 -6 40 Transchile 45 1 0 -6 40 Total 2,155 15 -29 -79 2,062
(*) Adjusted amounts (see Note 1.1.4)
3.1.1. Changes in 2017
Following is a description of the main changes by type of change:
Definitive accounting for the acquisition of Broadspectrum:
In 2017 additional information was obtained -not available at the date of preparation of the 2016 consolidated financial statements- in relation to the financial statements of Broadspectrum at the date of its inclusion in the scope of consolidation of the Group. This additional information gave rise to the modification (EUR -15 million) of the goodwill arising on this acquisition. Pursuant to IFRS 3.45, this adjustment was made within the measurement period of one year from the acquisition date, which ended in May 2017.
Based on the foregoing, the consolidated statement of financial position as at 31 December 2016 was adjusted. The table below details the effect of these changes on the main affected line items in the Group’s consolidated statement of financial position.
(Millions of euros)
FIN. STAT. BALANCES AT
31/12/16 PPA
ADJUSTMENT
ADJUSTED BALANCES AT
31/12/16
Goodwill 2,170 -15 2,155 Intangible assets 503 41 544 Deferred tax assets 1,051 6 1,057 Amounts to be billed for work performed 942 -6 936
Assets 4,666 26 4,692
(Millions of euros)
FIN. STAT. BALANCES AT
31/12/16 PPA
ADJUSTMENT
ADJUSTED BALANCES AT
31/12/16
Deferred tax liabilities 967 12 979 Amounts billed in advance for construction work 565 2 567
Short-term provisions 702 13 715 Liabilities 2,235 26 2,261
The following table summarises the main aggregates of the acquisition once the changes indicated in the foregoing tables have been made:
(Millions of euros) 2016 PPA ADJUSTMENT DEFINITIVE 2016
PPA
Acquisition-date equity 399 0 399 Fair value adjustments -270 15 -255
Fair value of the debt -42 0 -42 Contingencies -12 -20 -33 Elimination of intangible asset -370 0 -370 Allocation of intangible asset 211 41 252 Tax impact of PPA -40 -6 -46 Other adjustments -17 0 -17
Equity following adjustments 129 15 144 Ferrovial investment 526 0 526 Goodwill 397 -15 382
Accordingly, in 2017 the Group re-estimated the value of the intangible assets corresponding to the contracts entered into with Broadspectrum’s customers and the contractual relationship with them, which was calculated on the basis of a new, more precise estimate of the cash flows that will be generated by the contracts based on their expected duration and a forecast of the future cash flows in the event of renewal adjusted on the basis of the estimated probability of the renewal taking place. Following this analysis, the measurement of the intangible assets was increased by AUD 60 million (EUR 41 million) and contingencies relating to the performance of certain contracts were re-estimated for AUD 29 million (EUR 20 million). These contingencies are recognised in provisions (EUR 13 million), amounts billed in advance for construction work (EUR 2 million) and amounts to be billed for work performed (EUR -6 million). The overall impact of these effects, net of the related tax effect, was to reduce goodwill by AUD 22 million (EUR 15 million).
Definitive accounting for the acquisition of Pepper Lawson (Webber)
As with the case described above, in 2017 additional information was obtained that was not available at the date of preparation of the consolidated financial statements for 2016, which gave rise to an increase in the provisions associated with certain contracts, due to events already existing at the date of acquisition of the company, amounting to
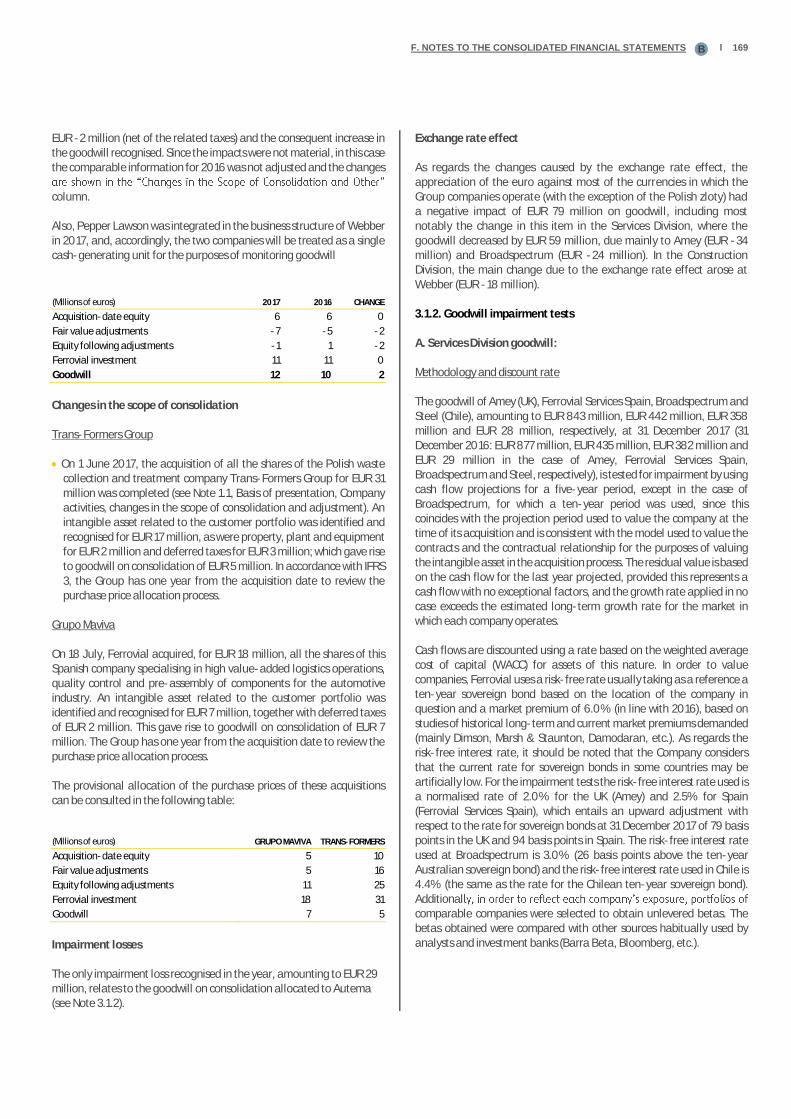
F. NOTES TO THE CONSOLIDATED FINANCIAL STATEMENTS Ɩ 169B
EUR -2 million (net of the related taxes) and the consequent increase in the goodwill recognised. Since the impacts were not material, in this case the comparable information for 2016 was not adjusted and the changes
column.
Also, Pepper Lawson was integrated in the business structure of Webber in 2017, and, accordingly, the two companies will be treated as a single cash-generating unit for the purposes of monitoring goodwill
(Millions of euros) 2017 2016 CHANGE
Acquisition-date equity 6 6 0
Fair value adjustments -7 -5 -2
Equity following adjustments -1 1 -2
Ferrovial investment 11 11 0
Goodwill 12 10 2
Changes in the scope of consolidation
Trans-Formers Group
• On 1 June 2017, the acquisition of all the shares of the Polish waste collection and treatment company Trans-Formers Group for EUR 31 million was completed (see Note 1.1, Basis of presentation, Company activities, changes in the scope of consolidation and adjustment). An intangible asset related to the customer portfolio was identified and recognised for EUR 17 million, as were property, plant and equipment for EUR 2 million and deferred taxes for EUR 3 million; which gave rise to goodwill on consolidation of EUR 5 million. In accordance with IFRS 3, the Group has one year from the acquisition date to review the purchase price allocation process.
Grupo Maviva
On 18 July, Ferrovial acquired, for EUR 18 million, all the shares of this Spanish company specialising in high value-added logistics operations, quality control and pre-assembly of components for the automotive industry. An intangible asset related to the customer portfolio was identified and recognised for EUR 7 million, together with deferred taxes of EUR 2 million. This gave rise to goodwill on consolidation of EUR 7 million. The Group has one year from the acquisition date to review the purchase price allocation process.
The provisional allocation of the purchase prices of these acquisitions can be consulted in the following table:
(Millions of euros) GRUPO MAVIVA TRANS-FORMERS
Acquisition-date equity 5 10
Fair value adjustments 5 16
Equity following adjustments 11 25
Ferrovial investment 18 31
Goodwill 7 5
Impairment losses
The only impairment loss recognised in the year, amounting to EUR 29 million, relates to the goodwill on consolidation allocated to Autema (see Note 3.1.2).
Exchange rate effect
As regards the changes caused by the exchange rate effect, the appreciation of the euro against most of the currencies in which the Group companies operate (with the exception of the Polish zloty) had a negative impact of EUR 79 million on goodwill, including most notably the change in this item in the Services Division, where the goodwill decreased by EUR 59 million, due mainly to Amey (EUR -34 million) and Broadspectrum (EUR -24 million). In the Construction Division, the main change due to the exchange rate effect arose at Webber (EUR -18 million).
3.1.2. Goodwill impairment tests
A. Services Division goodwill:
Methodology and discount rate
The goodwill of Amey (UK), Ferrovial Services Spain, Broadspectrum and Steel (Chile), amounting to EUR 843 million, EUR 442 million, EUR 358 million and EUR 28 million, respectively, at 31 December 2017 (31 December 2016: EUR 877 million, EUR 435 million, EUR 382 million and EUR 29 million in the case of Amey, Ferrovial Services Spain, Broadspectrum and Steel, respectively), is tested for impairment by using cash flow projections for a five-year period, except in the case of Broadspectrum, for which a ten-year period was used, since this coincides with the projection period used to value the company at the time of its acquisition and is consistent with the model used to value the contracts and the contractual relationship for the purposes of valuing the intangible asset in the acquisition process. The residual value is based on the cash flow for the last year projected, provided this represents a cash flow with no exceptional factors, and the growth rate applied in no case exceeds the estimated long-term growth rate for the market in which each company operates.
Cash flows are discounted using a rate based on the weighted average cost of capital (WACC) for assets of this nature. In order to value companies, Ferrovial uses a risk-free rate usually taking as a reference a ten-year sovereign bond based on the location of the company in question and a market premium of 6.0% (in line with 2016), based on studies of historical long-term and current market premiums demanded (mainly Dimson, Marsh & Staunton, Damodaran, etc.). As regards the risk-free interest rate, it should be noted that the Company considers that the current rate for sovereign bonds in some countries may be artificially low. For the impairment tests the risk-free interest rate used is a normalised rate of 2.0% for the UK (Amey) and 2.5% for Spain (Ferrovial Services Spain), which entails an upward adjustment with respect to the rate for sovereign bonds at 31 December 2017 of 79 basis points in the UK and 94 basis points in Spain. The risk-free interest rate used at Broadspectrum is 3.0% (26 basis points above the ten-year Australian sovereign bond) and the risk-free interest rate used in Chile is 4.4% (the same as the rate for the Chilean ten-year sovereign bond). Additionalcomparable companies were selected to obtain unlevered betas. The betas obtained were compared with other sources habitually used by analysts and investment banks (Barra Beta, Bloomberg, etc.).
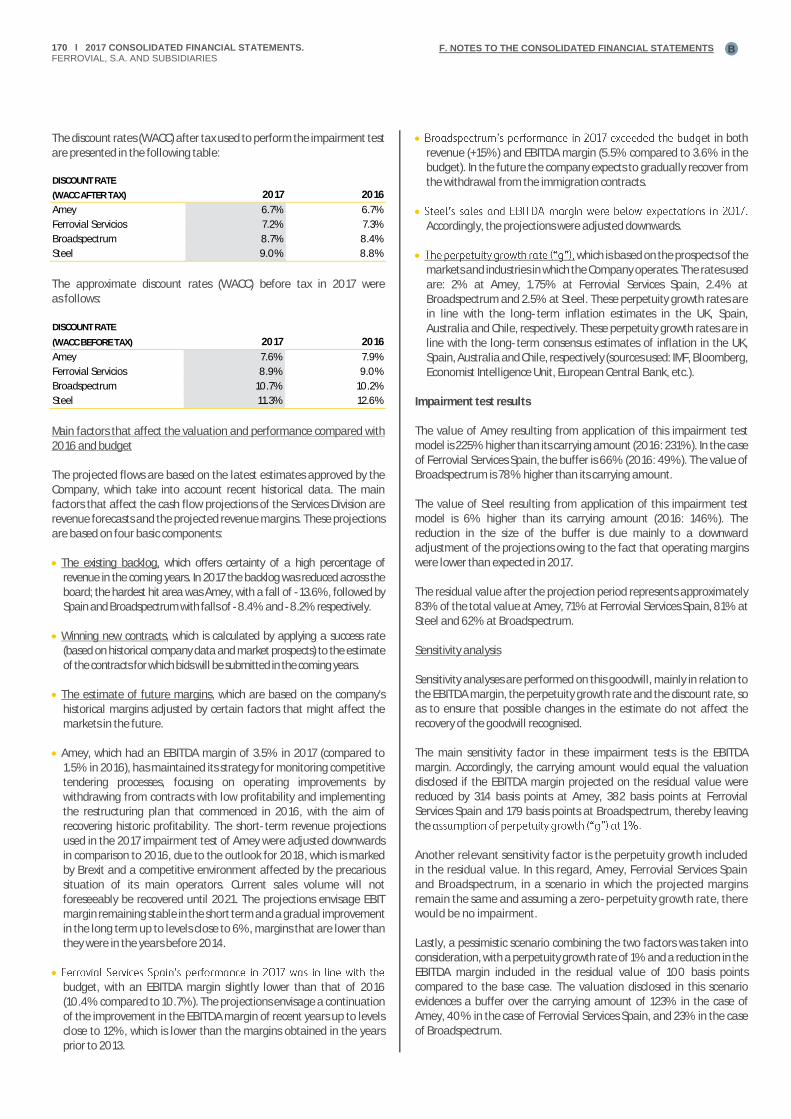
170 Ɩ 2017 CONSOLIDATED FINANCIAL STATEMENTS. FERROVIAL, S.A. AND SUBSIDIARIES
F. NOTES TO THE CONSOLIDATED FINANCIAL STATEMENTS B
The discount rates (WACC) after tax used to perform the impairment test are presented in the following table:
DISCOUNT RATE
(WACC AFTER TAX) 2017 2016
Amey 6.7% 6.7%
Ferrovial Servicios 7.2% 7.3%
Broadspectrum 8.7% 8.4%
Steel 9.0% 8.8%
The approximate discount rates (WACC) before tax in 2017 were as follows:
DISCOUNT RATE
(WACC BEFORE TAX) 2017 2016
Amey 7.6% 7.9%
Ferrovial Servicios 8.9% 9.0%
Broadspectrum 10.7% 10.2%
Steel 11.3% 12.6%
Main factors that affect the valuation and performance compared with 2016 and budget
The projected flows are based on the latest estimates approved by the Company, which take into account recent historical data. The main factors that affect the cash flow projections of the Services Division are revenue forecasts and the projected revenue margins. These projections are based on four basic components:
• The existing backlog, which offers certainty of a high percentage of revenue in the coming years. In 2017 the backlog was reduced across the board; the hardest hit area was Amey, with a fall of -13.6%, followed by Spain and Broadspectrum with falls of -8.4% and -8.2% respectively.
• Winning new contracts, which is calculated by applying a success rate (based on historical company data and market prospects) to the estimate of the contracts for which bids will be submitted in the coming years.
• The estimate of future margins, which are based on the company's historical margins adjusted by certain factors that might affect the markets in the future.
• Amey, which had an EBITDA margin of 3.5% in 2017 (compared to1.5% in 2016), has maintained its strategy for monitoring competitive tendering processes, focusing on operating improvements by withdrawing from contracts with low profitability and implementing the restructuring plan that commenced in 2016, with the aim of recovering historic profitability. The short-term revenue projections used in the 2017 impairment test of Amey were adjusted downwards in comparison to 2016, due to the outlook for 2018, which is marked by Brexit and a competitive environment affected by the precarious situation of its main operators. Current sales volume will not foreseeably be recovered until 2021. The projections envisage EBIT margin remaining stable in the short term and a gradual improvement in the long term up to levels close to 6%, margins that are lower thanthey were in the years before 2014.
• budget, with an EBITDA margin slightly lower than that of 2016 (10.4% compared to 10.7%). The projections envisage a continuation of the improvement in the EBITDA margin of recent years up to levels close to 12%, which is lower than the margins obtained in the years prior to 2013.
• et in both revenue (+15%) and EBITDA margin (5.5% compared to 3.6% in the budget). In the future the company expects to gradually recover from the withdrawal from the immigration contracts.
• Accordingly, the projections were adjusted downwards.
• which is based on the prospects of the markets and industries in which the Company operates. The rates used are: 2% at Amey, 1.75% at Ferrovial Services Spain, 2.4% at Broadspectrum and 2.5% at Steel. These perpetuity growth rates are in line with the long-term inflation estimates in the UK, Spain, Australia and Chile, respectively. These perpetuity growth rates are in line with the long-term consensus estimates of inflation in the UK, Spain, Australia and Chile, respectively (sources used: IMF, Bloomberg, Economist Intelligence Unit, European Central Bank, etc.).
Impairment test results
The value of Amey resulting from application of this impairment test model is 225% higher than its carrying amount (2016: 231%). In the case of Ferrovial Services Spain, the buffer is 66% (2016: 49%). The value of Broadspectrum is 78% higher than its carrying amount.
The value of Steel resulting from application of this impairment test model is 6% higher than its carrying amount (2016: 146%). The reduction in the size of the buffer is due mainly to a downward adjustment of the projections owing to the fact that operating margins were lower than expected in 2017.
The residual value after the projection period represents approximately 83% of the total value at Amey, 71% at Ferrovial Services Spain, 81% at Steel and 62% at Broadspectrum.
Sensitivity analysis
Sensitivity analyses are performed on this goodwill, mainly in relation to the EBITDA margin, the perpetuity growth rate and the discount rate, so as to ensure that possible changes in the estimate do not affect the recovery of the goodwill recognised.
The main sensitivity factor in these impairment tests is the EBITDA margin. Accordingly, the carrying amount would equal the valuation disclosed if the EBITDA margin projected on the residual value were reduced by 314 basis points at Amey, 382 basis points at Ferrovial Services Spain and 179 basis points at Broadspectrum, thereby leaving the
Another relevant sensitivity factor is the perpetuity growth included in the residual value. In this regard, Amey, Ferrovial Services Spain and Broadspectrum, in a scenario in which the projected margins remain the same and assuming a zero-perpetuity growth rate, there would be no impairment.
Lastly, a pessimistic scenario combining the two factors was taken into consideration, with a perpetuity growth rate of 1% and a reduction in the EBITDA margin included in the residual value of 100 basis points compared to the base case. The valuation disclosed in this scenario evidences a buffer over the carrying amount of 123% in the case of Amey, 40% in the case of Ferrovial Services Spain, and 23% in the case of Broadspectrum.

F. NOTES TO THE CONSOLIDATED FINANCIAL STATEMENTS Ɩ 171B
The valuation of Steel disclosed a smaller buffer and, accordingly, a small variance in the projections could give rise to impairment.
B. Construction Division goodwill (Webber and Budimex):
Methodology and discount rate
The goodwill of Webber (US) and Budimex (Poland) amounted to EUR 127 million and EUR 70 million, respectively, at 31 December 2017 (31 December 2016: EUR 143 million and EUR 67 million, respectively).
The impairment test methodology used for Webber was similar to that described above for the Services companies and included a discount rate (WACC) after tax of 8.9% (compared to 8.7% in 2016) and a perpetuity growth rate of 2.0% (same rate as in 2016). The risk-free interest rate used to calculate the WACC was 2.4%, the same as the rate of the ten-year US bond at 31 December 2017.
The approximate discount rate (WACC) before tax was 10.6% in 2017 (compared to 12.1% in 2016). It is important to bear in mind the reduction in the federal tax rate in the US from 35% to 21% approved in December.
In the case of Budimex, since it is listed on the Warsaw Stock Exchange, the goodwill was tested for impairment by ascertaining whether the closing market price at 31 December 2017 of Budimex shares was higher than its carrying amount plus the allocated goodwill. The test did not evidence the existence of any impairment.
Main factors that affect the valuation and performance compared with 2016 and budget
The projected free cash flows are based on the latest estimates approved by the Company, which take into account recent historical data. The main factors that affect the cash flow projections of Webber are revenue forecasts and the projected operating margins. These projections are based on four basic components, similar to those described in the preceding section on Services (the existing backlog, the obtainment of new contracts, the estimate of future margins and the perpetuity growth rate). It should be noted that the projected operating margins are lower than the historical margins of recent years, in line with average margins in the industry. The perpetuity growth rate used was 2%, which is similar to long-term inflation forecasts for the US without considering actual economic growth.
Impairment test results
The value of Webber resulting from application of this impairment test model is 59% higher than its carrying amount (compared to 23% in 2016).
The residual value of Webber represents 40% of the total value after the explicit projection period.
The quoted market price of the Budimex share at 31 December 2017 was 491% higher than its carrying amount (compared to 321% in 2016).
Sensitivity analysis
particularly in relation to the profit from operations, the discount rate and the perpetuity growth rate, so as to ensure that possible changes in the estimate do not have an impact on the possible recovery of the goodwill recognised.
Specifically, a pessimistic scenario was taken into consideration with a perpetuity growth rate of 1% and a reduction in the profit from operations of 50 basis points. The value disclosed in this scenario evidences a buffer of 40% over the carrying amount.
On this basis, the valuation disclosed would equal the carrying amount if the reduction in the margin with respect to the projection was of 265
at 1%.
Lastly, it should be stated that in a scenario in which the margins remain the same but assuming a zero perpetuity-growth rate (compared to 2.0%), there would be no impairment.
At Budimex, due to the significant buffer of the quoted market price over the carrying amount, the company believes that there is no evidence of impairment.
C. Toll Road Division goodwill:
Methodology and discount rate
The goodwill of the Toll Road business at 31 December 2017 amounted to EUR 141 million (31 December 2016: EUR 170 million). This goodwill arose on the merger transaction performed in 2009 by Ferrovial, S.A. and Cintra, S.A., and corresponds to the acquisition of the percentage of ownership of the non-controlling shareholders of Cintra. The goodwill arising on the difference between the acquisition price of the ownership interest and the carrying amount thereof was allocated by calculating the difference between the fair value of the main shareholdings in concession operators held by Cintra, S.A. at that time and the carrying amount thereof, adjusted by the percentage acquired.
The recoverable amount of the toll roads was calculated as the higher of fair value less estimated costs to sell and value in use. The recoverable amount of concession operators with an independent financial structure and limited duration was calculated by discounting the cash flows expected to be received by shareholders until the end of the concession term. The Group considers that value in use must be obtained using models that cover the entire concession term, as the assets are in different phases of investment and growth and there is sufficient visibility to use a specific economic and financial plan for each phase during the concession term. Therefore, no residual value is considered to exist in these valuations. The projections were updated based on the historical evolution and specific features of each asset, using long-term modelling tools to estimate traffic, extraordinary maintenance, etc.
To calculate the discount rates shown in the table below, the cost of
equity was estimated using the CAPM model. For this purpose, a
normalised risk-free rate usually referenced to a 30-year bond, taking
into account the location of each concession operator, a beta
coefficient reflecting the company's leverage and risk, and a market
premium of 6.0% (the same as in 2016) are used. The table below
shows the discount rate after tax used for each asset in 2017 and 2016.
DISCOUNT RATE (COST OF EQUITY OR KE) 2017 2016
Autema 8.9% 8.4%
Ausol 9.7% 10.0%
The approximate discount rates (WACC) before tax in 2017 were 12.3% at Autema (2016: 12.7%) and 12.0% at Ausol (2016: 12.6%).
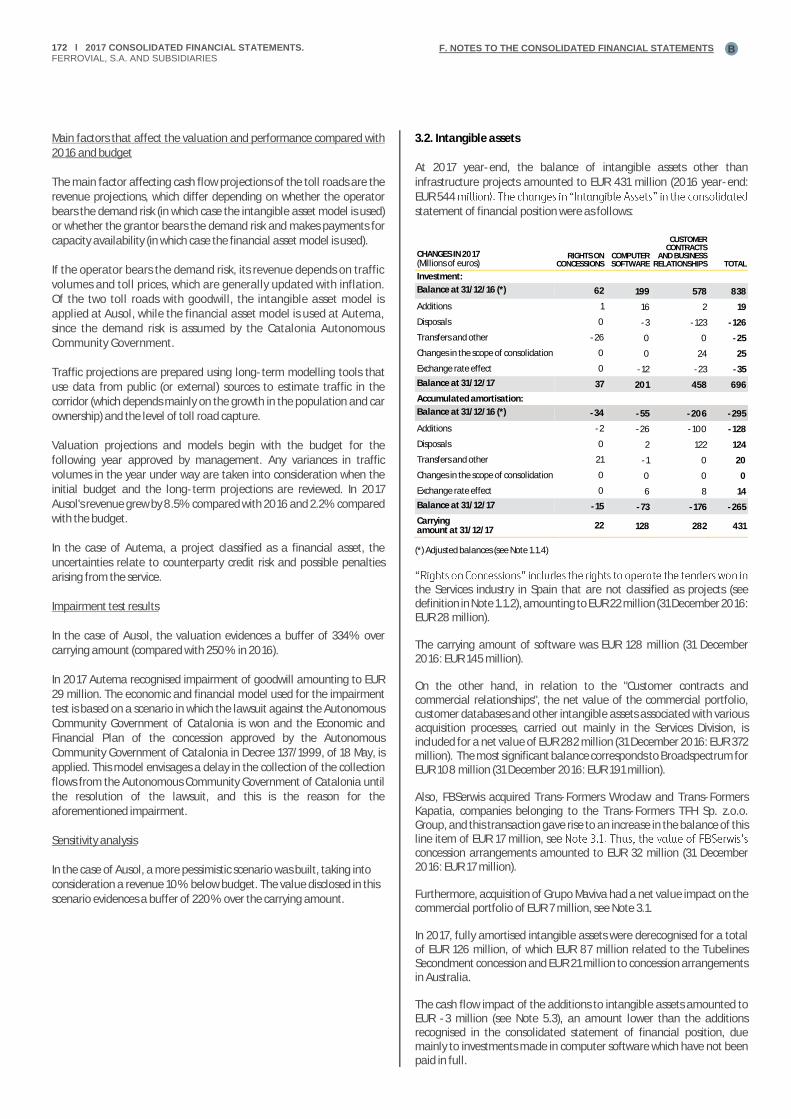
172 Ɩ 2017 CONSOLIDATED FINANCIAL STATEMENTS. FERROVIAL, S.A. AND SUBSIDIARIES
F. NOTES TO THE CONSOLIDATED FINANCIAL STATEMENTS B
Main factors that affect the valuation and performance compared with 2016 and budget
The main factor affecting cash flow projections of the toll roads are the revenue projections, which differ depending on whether the operator bears the demand risk (in which case the intangible asset model is used) or whether the grantor bears the demand risk and makes payments for capacity availability (in which case the financial asset model is used).
If the operator bears the demand risk, its revenue depends on traffic volumes and toll prices, which are generally updated with inflation. Of the two toll roads with goodwill, the intangible asset model is applied at Ausol, while the financial asset model is used at Autema, since the demand risk is assumed by the Catalonia Autonomous Community Government.
Traffic projections are prepared using long-term modelling tools that use data from public (or external) sources to estimate traffic in the corridor (which depends mainly on the growth in the population and car ownership) and the level of toll road capture.
Valuation projections and models begin with the budget for the following year approved by management. Any variances in traffic volumes in the year under way are taken into consideration when the initial budget and the long-term projections are reviewed. In 2017 Ausol's revenue grew by 8.5% compared with 2016 and 2.2% compared with the budget.
In the case of Autema, a project classified as a financial asset, the uncertainties relate to counterparty credit risk and possible penalties arising from the service.
Impairment test results
In the case of Ausol, the valuation evidences a buffer of 334% over carrying amount (compared with 250% in 2016).
In 2017 Autema recognised impairment of goodwill amounting to EUR 29 million. The economic and financial model used for the impairment test is based on a scenario in which the lawsuit against the Autonomous Community Government of Catalonia is won and the Economic and Financial Plan of the concession approved by the Autonomous Community Government of Catalonia in Decree 137/1999, of 18 May, is applied. This model envisages a delay in the collection of the collection flows from the Autonomous Community Government of Catalonia until the resolution of the lawsuit, and this is the reason for the aforementioned impairment.
Sensitivity analysis
In the case of Ausol, a more pessimistic scenario was built, taking into consideration a revenue 10% below budget. The value disclosed in this scenario evidences a buffer of 220% over the carrying amount.
3.2. Intangible assets
At 2017 year-end, the balance of intangible assets other than infrastructure projects amounted to EUR 431 million (2016 year-end: EUR 544 statement of financial position were as follows:
CHANGES IN 2017 (Millions of euros)
RIGHTS ON CONCESSIONS
COMPUTER SOFTWARE
CUSTOMER CONTRACTS
AND BUSINESS RELATIONSHIPS TOTAL
Investment:
Balance at 31/12/16 (*) 62 199 578 838
Additions 1 16 2 19
Disposals 0 -3 -123 -126
Transfers and other -26 0 0 -25
Changes in the scope of consolidation 0 0 24 25
Exchange rate effect 0 -12 -23 -35
Balance at 31/12/17 37 201 458 696
Accumulated amortisation:
Balance at 31/12/16 (*) -34 -55 -206 -295
Additions -2 -26 -100 -128
Disposals 0 2 122 124
Transfers and other 21 -1 0 20
Changes in the scope of consolidation 0 0 0 0
Exchange rate effect 0 6 8 14
Balance at 31/12/17 -15 -73 -176 -265
Carrying amount at 31/12/17
22 128 282 431
(*) Adjusted balances (see Note 1.1.4)
the Services industry in Spain that are not classified as projects (see definition in Note 1.1.2), amounting to EUR 22 million (31 December 2016: EUR 28 million).
The carrying amount of software was EUR 128 million (31 December 2016: EUR 145 million).
On the other hand, in relation to the "Customer contracts and commercial relationships", the net value of the commercial portfolio, customer databases and other intangible assets associated with various acquisition processes, carried out mainly in the Services Division, is included for a net value of EUR 282 million (31 December 2016: EUR 372 million). The most significant balance corresponds to Broadspectrum for EUR 108 million (31 December 2016: EUR 191 million).
Also, FBSerwis acquired Trans-Formers Wroclaw and Trans-Formers Kapatia, companies belonging to the Trans-Formers TFH Sp. z.o.o. Group, and this transaction gave rise to an increase in the balance of this line item of EUR 17 million, see concession arrangements amounted to EUR 32 million (31 December 2016: EUR 17 million).
Furthermore, acquisition of Grupo Maviva had a net value impact on the commercial portfolio of EUR 7 million, see Note 3.1.
In 2017, fully amortised intangible assets were derecognised for a total of EUR 126 million, of which EUR 87 million related to the Tubelines Secondment concession and EUR 21 million to concession arrangements in Australia.
The cash flow impact of the additions to intangible assets amounted to EUR -3 million (see Note 5.3), an amount lower than the additions recognised in the consolidated statement of financial position, due mainly to investments made in computer software which have not been paid in full.

F. NOTES TO THE CONSOLIDATED FINANCIAL STATEMENTS Ɩ 173B
No impairment losses were recognised or reversed in relation to these assets in 2017.
3.3. Investments in infrastructure projects
3.3.1. Intangible asset model
(Millions of euros)
BALANCE AT
01/01/17 TOTAL
ADDITIONS TOTAL
DISPOSALS
CHANGES IN THE SCOPE OF CONSOLIDATI
ON AND TRANSFERS
EXCHANGE RATE
EFFECT BALANCES
AT 31/12/17
Spanish toll roads 793 5 0 -64 0 734
US toll roads 5,025 477 0 0 -659 4,842
Other toll roads 384 0 0 0 0 384
Investment in toll roads
6,201 483 0 -64 -659 5,960
Accumulated amortisation
-300 -61 0 0 9 -351
Impairment losses
-25 1 25 0 0 0
Net investment in toll roads
5,876 423 25 -64 -650 5,609
Investment in other infrast. projects
487 10 -5 28 0 521
Amortisation - Other infrast. projects
-196 -27 -1 -23 0 -246
Total net investment - Other infrast. projects
291 -16 -6 5 0 274
Total investment
6,689 493 -5 -37 -659 6,480
Total amortisation and impairment losses
-521 -87 23 -23 9 -598
Total net investment
6,168 406 19 -60 -650 5,883
The most significant changes in 2017 were as follows:
• Exchange rate fluctuations resulted in a reduction of EUR -650 million(2016: increase of EUR 195 million) in the balance of these assets, the full amount of which was attributable to the change in the euro/US dollar exchange rate at the US toll roads (see Note 1.4).
• The assets relating to the US toll roads increased by EUR 477 million. The most significant of these increases in assets centred on the extension of the North Tarrant Express toll road (EUR 262 million -2016: EUR 281 million-) and the I-77 Mobility Partners LLC toll road (EUR 165 million -2016: EUR 67 million-), which are currently in the construction phase. The total investment in these toll roads includes a balance at 31 December 2017 of EUR 1,129 million (2016: EUR 807million) relating to property, plant and equipment in the course ofconstruction (see Note 5.3).
• arrangements to which no goodwill has been allocated. These possible impairment losses were calculated using the same method as that indicated in Section 3.1. In 2017 the impairment loss recognised on the Euroscut Azores toll road was reversed (EUR 25 million) as a result of the improved projections for the toll road due to an increase in vehicle numbers (see Note 2.5).
• arrangements awarded to the Services Division that are classified as intangible assets under IFRIC 12, basically those relating to Autovía de Aragón Sociedad Concesionaria, S.A., with a net investment of EUR 115 million (2016: EUR 127 million) and various integral waste treatment plants located in Spain, mainly in Barcelona, Toledo and
Murcia (Ecoparc de Can Mata, S.L.U., Gestión Medioambiental de Toledo, S.A. and Servicios Urbanos de Murcia, S.A.) among others, for a net amount of EUR 159 million (2016: EUR 162 million).
In the case of the infrastructure project companies, all their concession assets have been pledged as security for the existing borrowings (see Note 5.2). The borrowing costs capitalised in this connection in 2017 are detailed in Note 2.6.
The changes in these assets in 2016 were as follows:
(Millions of euros)
BALANCE AT
01/01/16 TOTAL
ADDITIONS TOTAL
DISPOSALS
CHANGES IN THE SCOPE
OF CONSOLIDATI
ON AND TRANSFERS
EXCHANGE RATE
EFFECT
BALANCES AT
31/12/16
Spanish toll roads 793 0 0 0 0 793
US toll roads 5,764 437 0 -1,375 198 5,025
Other toll roads 384 0 0 0 0 384
Investment in toll roads
6,941 437 0 -1,375 198 6,202
Accumulated amortisation
-261 -75 0 40 -4 -300
Impairment losses -28 0 3 0 0 -25
Net investment in toll roads
6,651 362 3 -1,334 195 5,876
Investment in other infrastructure projects
485 12 -11 0 0 486
Amortisation - Other infrast. projects
-179 -27 11 0 0 -195
Total net investment - Other infrast. projects
306 -15 0 0 0 291
Total investment 7,426 449 -11 -1,375 198 6,689
Total amortisation and impairment losses
-469 -102 14 40 -4 -521
Total net investment
6,957 347 3 -1,334 195 6,168
3.3.2. Financial asset model
The assets accounted for using the financial asset model pursuant to IFRIC 12 relate mainly to amounts receivable at long term (more than twelve months) from governments in return for services rendered or investments made under a concession arrangement. The changes in the years ended 31 December 2017 and 2016 were as follows:
CHANGES (Millions of euros)
2017 INFRASTRUCTURE
PROJECT RECEIVABLES
2016 INFRASTRUCTURE
PROJECT RECEIVABLES
Beginning balance 977 1,586
Additions 185 298
Disposals -50 -215
Transfers and other -75 -664
Changes in the scope of consolidation
0 0
Exchange rate effect -2 -29
Ending balance 1,035 977
Note: balances presented net of allowances.
With respect to the account receivable relating to the Autema project, both the decree published in 2015 and the new decree published in 2016 have been appealed against cumulatively in one proceeding and, in this connection, no substantial changes were considered in addition to those already considered in relation to the treatment of the account receivable (see Note 6.5.1-a). As indicated in 6.5.1-a, the Company considers that there are very sound legal arguments to win the appeal and, therefore, it was resolved to continue to recognise the project as a financial asset. An
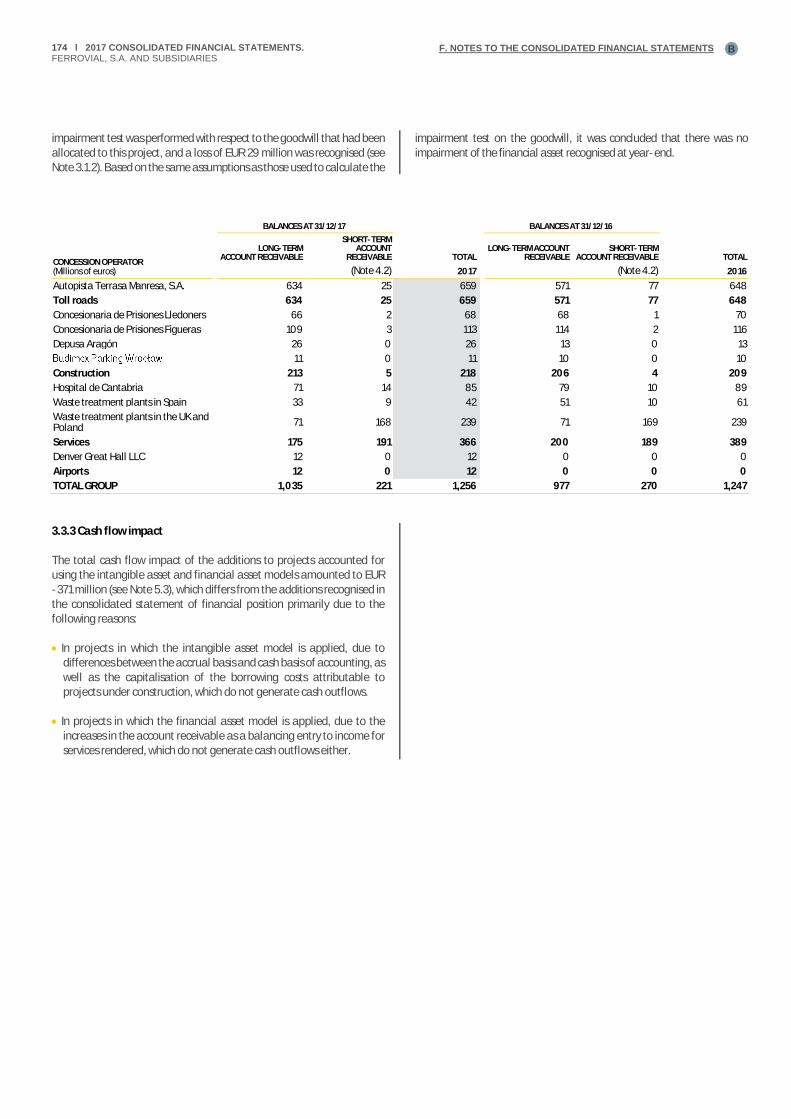
174 Ɩ 2017 CONSOLIDATED FINANCIAL STATEMENTS. FERROVIAL, S.A. AND SUBSIDIARIES
F. NOTES TO THE CONSOLIDATED FINANCIAL STATEMENTS B
impairment test was performed with respect to the goodwill that had been allocated to this project, and a loss of EUR 29 million was recognised (see Note 3.1.2). Based on the same assumptions as those used to calculate the
impairment test on the goodwill, it was concluded that there was no impairment of the financial asset recognised at year-end.
BALANCES AT 31/12/17 BALANCES AT 31/12/16
CONCESSION OPERATOR (Millions of euros)
LONG-TERM ACCOUNT RECEIVABLE
SHORT-TERM ACCOUNT
RECEIVABLE TOTAL LONG-TERM ACCOUNT
RECEIVABLE SHORT-TERM
ACCOUNT RECEIVABLE TOTAL
(Note 4.2) 2017 (Note 4.2) 2016
Autopista Terrasa Manresa, S.A. 634 25 659 571 77 648
Toll roads 634 25 659 571 77 648
Concesionaria de Prisiones Lledoners 66 2 68 68 1 70
Concesionaria de Prisiones Figueras 109 3 113 114 2 116
Depusa Aragón 26 0 26 13 0 13
11 0 11 10 0 10
Construction 213 5 218 206 4 209
Hospital de Cantabria 71 14 85 79 10 89
Waste treatment plants in Spain 33 9 42 51 10 61
Waste treatment plants in the UK and Poland
71 168 239 71 169 239
Services 175 191 366 200 189 389
Denver Great Hall LLC 12 0 12 0 0 0
Airports 12 0 12 0 0 0
TOTAL GROUP 1,035 221 1,256 977 270 1,247
3.3.3 Cash flow impact
The total cash flow impact of the additions to projects accounted for using the intangible asset and financial asset models amounted to EUR -371 million (see Note 5.3), which differs from the additions recognised in the consolidated statement of financial position primarily due to thefollowing reasons:
• In projects in which the intangible asset model is applied, due todifferences between the accrual basis and cash basis of accounting, as well as the capitalisation of the borrowing costs attributable to projects under construction, which do not generate cash outflows.
• In projects in which the financial asset model is applied, due to the increases in the account receivable as a balancing entry to income for services rendered, which do not generate cash outflows either.
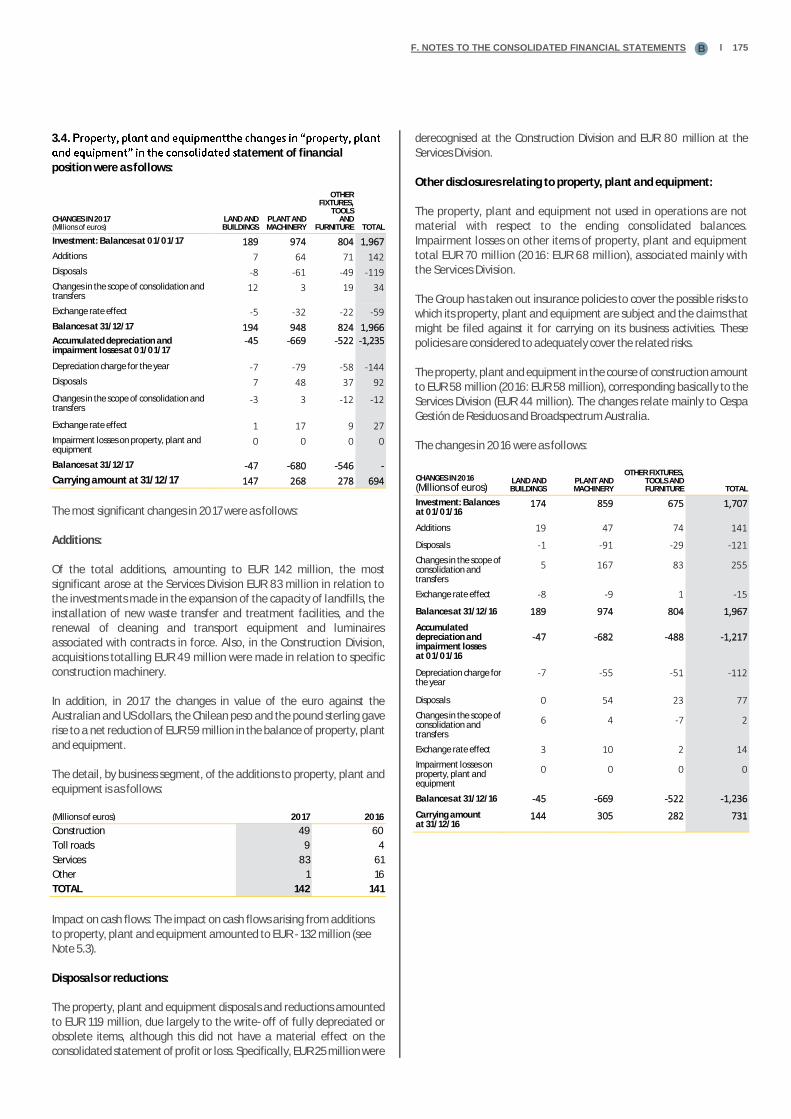
F. NOTES TO THE CONSOLIDATED FINANCIAL STATEMENTS Ɩ 175B
3.4. tatement of financial
position were as follows:
CHANGES IN 2017 (Millions of euros)
LAND AND BUILDINGS
PLANT AND MACHINERY
OTHER FIXTURES,
TOOLS AND
FURNITURE TOTAL
Investment: Balances at 01/01/17 189 974 804 1,967
Additions 7 64 71 142
Disposals -8 -61 -49 -119
Changes in the scope of consolidation and transfers
12 3 19 34
Exchange rate effect -5 -32 -22 -59
Balances at 31/12/17 194 948 824 1,966 Accumulated depreciation and impairment losses at 01/01/17
-45 -669 -522 -1,235
Depreciation charge for the year -7 -79 -58 -144
Disposals 7 48 37 92
Changes in the scope of consolidation and transfers
-3 3 -12 -12
Exchange rate effect 1 17 9 27
Impairment losses on property, plant and equipment
0 0 0 0
Balances at 31/12/17 -47 -680 -546 -1,2721,272
Carrying amount at 31/12/17 147 268 278 694
The most significant changes in 2017 were as follows:
Additions:
Of the total additions, amounting to EUR 142 million, the most significant arose at the Services Division EUR 83 million in relation to the investments made in the expansion of the capacity of landfills, the installation of new waste transfer and treatment facilities, and the renewal of cleaning and transport equipment and luminaires associated with contracts in force. Also, in the Construction Division, acquisitions totalling EUR 49 million were made in relation to specific construction machinery.
In addition, in 2017 the changes in value of the euro against the Australian and US dollars, the Chilean peso and the pound sterling gave rise to a net reduction of EUR 59 million in the balance of property, plant and equipment.
The detail, by business segment, of the additions to property, plant and equipment is as follows:
(Millions of euros) 2017 2016
Construction 49 60
Toll roads 9 4
Services 83 61
Other 1 16
TOTAL 142 141
Impact on cash flows: The impact on cash flows arising from additions to property, plant and equipment amounted to EUR -132 million (see Note 5.3).
Disposals or reductions:
The property, plant and equipment disposals and reductions amounted to EUR 119 million, due largely to the write-off of fully depreciated or obsolete items, although this did not have a material effect on the consolidated statement of profit or loss. Specifically, EUR 25 million were
derecognised at the Construction Division and EUR 80 million at the Services Division.
Other disclosures relating to property, plant and equipment:
The property, plant and equipment not used in operations are not material with respect to the ending consolidated balances. Impairment losses on other items of property, plant and equipment total EUR 70 million (2016: EUR 68 million), associated mainly with the Services Division.
The Group has taken out insurance policies to cover the possible risks to which its property, plant and equipment are subject and the claims that might be filed against it for carrying on its business activities. These policies are considered to adequately cover the related risks.
The property, plant and equipment in the course of construction amount to EUR 58 million (2016: EUR 58 million), corresponding basically to the Services Division (EUR 44 million). The changes relate mainly to Cespa Gestión de Residuos and Broadspectrum Australia.
The changes in 2016 were as follows:
CHANGES IN 2016
(Millions of euros) LAND AND BUILDINGS
PLANT AND MACHINERY
OTHER FIXTURES, TOOLS AND FURNITURE TOTAL
Investment: Balances at 01/01/16
174 859 675 1,707
Additions 19 47 74 141
Disposals -1 -91 -29 -121
Changes in the scope of consolidation and transfers
5 167 83 255
Exchange rate effect -8 -9 1 -15
Balances at 31/12/16 189 974 804 1,967
Accumulated depreciation and impairment losses at 01/01/16
-47 -682 -488 -1,217
Depreciation charge for the year
-7 -55 -51 -112
Disposals 0 54 23 77
Changes in the scope of consolidation and transfers
6 4 -7 2
Exchange rate effect 3 10 2 14
Impairment losses on property, plant and equipment
0 0 0 0
Balances at 31/12/16 -45 -669 -522 -1,236
Carrying amount at 31/12/16
144 305 282 731
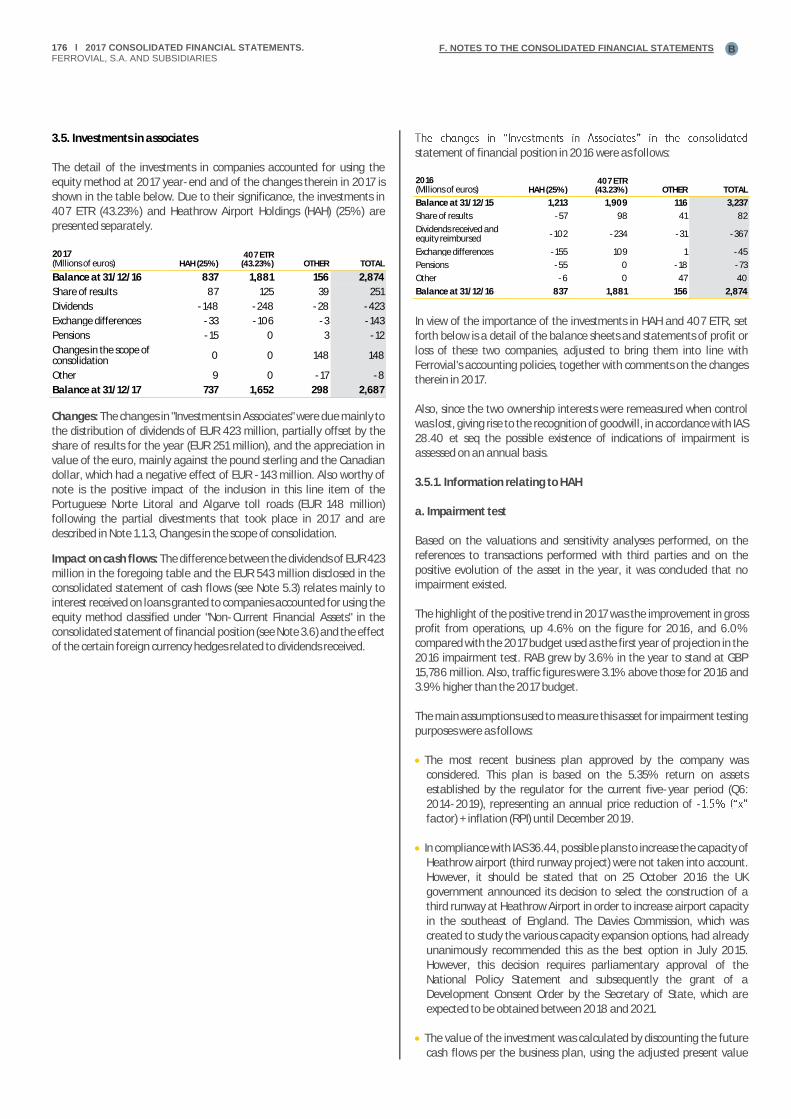
176 Ɩ 2017 CONSOLIDATED FINANCIAL STATEMENTS. FERROVIAL, S.A. AND SUBSIDIARIES
F. NOTES TO THE CONSOLIDATED FINANCIAL STATEMENTS B
3.5. Investments in associates
The detail of the investments in companies accounted for using the equity method at 2017 year-end and of the changes therein in 2017 is shown in the table below. Due to their significance, the investments in 407 ETR (43.23%) and Heathrow Airport Holdings (HAH) (25%) are presented separately.
2017 (Millions of euros) HAH (25%)
407 ETR (43.23%) OTHER TOTAL
Balance at 31/12/16 837 1,881 156 2,874
Share of results 87 125 39 251
Dividends -148 -248 -28 -423
Exchange differences -33 -106 -3 -143
Pensions -15 0 3 -12
Changes in the scope of consolidation
0 0 148 148
Other 9 0 -17 -8
Balance at 31/12/17 737 1,652 298 2,687
Changes: The changes in "Investments in Associates" were due mainly to the distribution of dividends of EUR 423 million, partially offset by the share of results for the year (EUR 251 million), and the appreciation in value of the euro, mainly against the pound sterling and the Canadian dollar, which had a negative effect of EUR -143 million. Also worthy of note is the positive impact of the inclusion in this line item of the Portuguese Norte Litoral and Algarve toll roads (EUR 148 million) following the partial divestments that took place in 2017 and are described in Note 1.1.3, Changes in the scope of consolidation.
Impact on cash flows: The difference between the dividends of EUR 423 million in the foregoing table and the EUR 543 million disclosed in the consolidated statement of cash flows (see Note 5.3) relates mainly to interest received on loans granted to companies accounted for using the equity method classified under "Non-Current Financial Assets" in the consolidated statement of financial position (see Note 3.6) and the effect of the certain foreign currency hedges related to dividends received.
statement of financial position in 2016 were as follows:
2016 (Millions of euros) HAH (25%)
407 ETR (43.23%) OTHER TOTAL
Balance at 31/12/15 1,213 1,909 116 3,237
Share of results -57 98 41 82
Dividends received and equity reimbursed
-102 -234 -31 -367
Exchange differences -155 109 1 -45
Pensions -55 0 -18 -73
Other -6 0 47 40
Balance at 31/12/16 837 1,881 156 2,874
In view of the importance of the investments in HAH and 407 ETR, set forth below is a detail of the balance sheets and statements of profit or loss of these two companies, adjusted to bring them into line with Ferrovial's accounting policies, together with comments on the changes therein in 2017.
Also, since the two ownership interests were remeasured when control was lost, giving rise to the recognition of goodwill, in accordance with IAS 28.40 et seq the possible existence of indications of impairment is assessed on an annual basis.
3.5.1. Information relating to HAH
a. Impairment test
Based on the valuations and sensitivity analyses performed, on the references to transactions performed with third parties and on the positive evolution of the asset in the year, it was concluded that no impairment existed.
The highlight of the positive trend in 2017 was the improvement in gross profit from operations, up 4.6% on the figure for 2016, and 6.0% compared with the 2017 budget used as the first year of projection in the 2016 impairment test. RAB grew by 3.6% in the year to stand at GBP 15,786 million. Also, traffic figures were 3.1% above those for 2016 and 3.9% higher than the 2017 budget.
The main assumptions used to measure this asset for impairment testing purposes were as follows:
• The most recent business plan approved by the company was considered. This plan is based on the 5.35% return on assets established by the regulator for the current five-year period (Q6:2014-2019), representing an annual price reduction of -factor) + inflation (RPI) until December 2019.
• In compliance with IAS 36.44, possible plans to increase the capacity of Heathrow airport (third runway project) were not taken into account. However, it should be stated that on 25 October 2016 the UK government announced its decision to select the construction of a third runway at Heathrow Airport in order to increase airport capacity in the southeast of England. The Davies Commission, which wascreated to study the various capacity expansion options, had already unanimously recommended this as the best option in July 2015. However, this decision requires parliamentary approval of the National Policy Statement and subsequently the grant of a Development Consent Order by the Secretary of State, which areexpected to be obtained between 2018 and 2021.
• The value of the investment was calculated by discounting the future cash flows per the business plan, using the adjusted present value
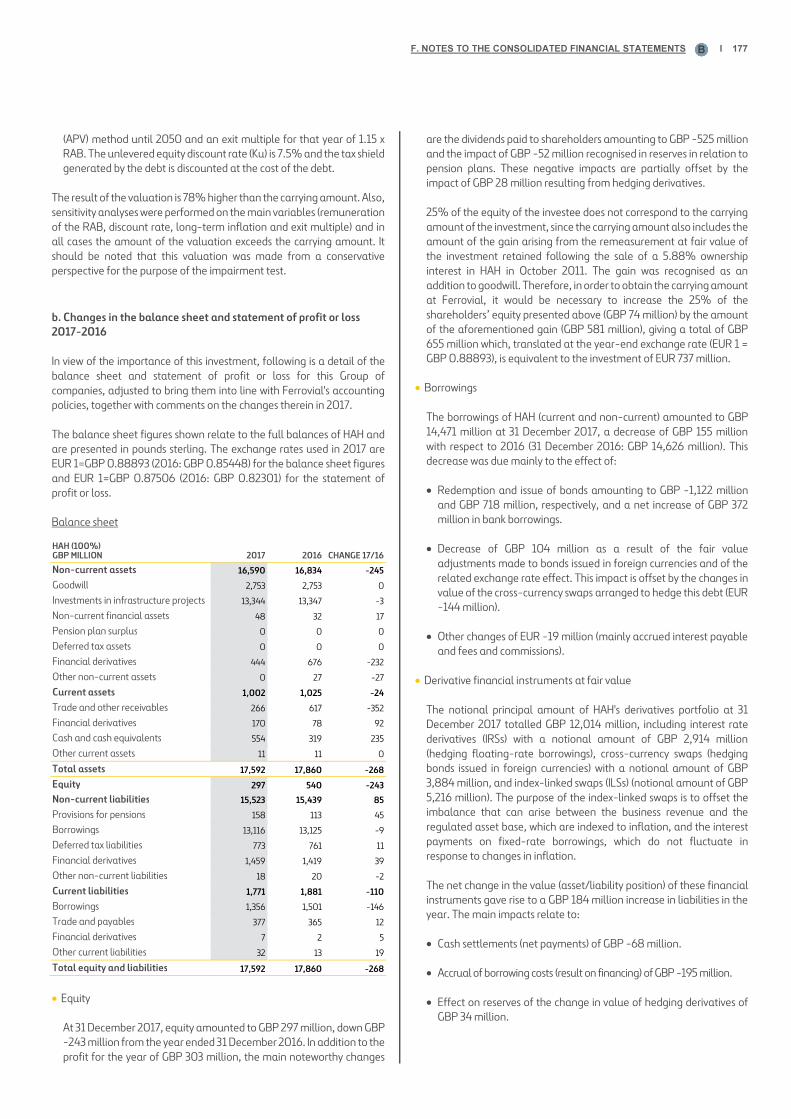
F. NOTES TO THE CONSOLIDATED FINANCIAL STATEMENTS Ɩ 177
B
(APV) method until 2050 and an exit multiple for that year of 1.15 x RAB. The unlevered equity discount rate (Ku) is 7.5% and the tax shield generated by the debt is discounted at the cost of the debt.
The result of the valuation is 78% higher than the carrying amount. Also, sensitivity analyses were performed on the main variables (remuneration of the RAB, discount rate, long-term inflation and exit multiple) and in all cases the amount of the valuation exceeds the carrying amount. It should be noted that this valuation was made from a conservative perspective for the purpose of the impairment test.
b. Changes in the balance sheet and statement of profit or loss 2017-2016
In view of the importance of this investment, following is a detail of the balance sheet and statement of profit or loss for this Group of companies, adjusted to bring them into line with Ferrovial's accounting policies, together with comments on the changes therein in 2017.
The balance sheet figures shown relate to the full balances of HAH and are presented in pounds sterling. The exchange rates used in 2017 are EUR 1=GBP 0.88893 (2016: GBP 0.85448) for the balance sheet figures and EUR 1=GBP 0.87506 (2016: GBP 0.82301) for the statement of profit or loss.
Balance sheet
HAH (100%) GBP MILLION 2017 2016 CHANGE 17/16
Non-current assets 16,590 16,834 -245
Goodwill 2,753 2,753 0
Investments in infrastructure projects 13,344 13,347 -3
Non-current financial assets 48 32 17
Pension plan surplus 0 0 0
Deferred tax assets 0 0 0
Financial derivatives 444 676 -232
Other non-current assets 0 27 -27
Current assets 1,002 1,025 -24
Trade and other receivables 266 617 -352
Financial derivatives 170 78 92
Cash and cash equivalents 554 319 235
Other current assets 11 11 0
Total assets 17,592 17,860 -268
Equity 297 540 -243
Non-current liabilities 15,523 15,439 85
Provisions for pensions 158 113 45
Borrowings 13,116 13,125 -9
Deferred tax liabilities 773 761 11
Financial derivatives 1,459 1,419 39
Other non-current liabilities 18 20 -2
Current liabilities 1,771 1,881 -110
Borrowings 1,356 1,501 -146
Trade and payables 377 365 12
Financial derivatives 7 2 5
Other current liabilities 32 13 19
Total equity and liabilities 17,592 17,860 -268
• Equity
At 31 December 2017, equity amounted to GBP 297 million, down GBP -243 million from the year ended 31 December 2016. In addition to the profit for the year of GBP 303 million, the main noteworthy changes
are the dividends paid to shareholders amounting to GBP -525 million and the impact of GBP -52 million recognised in reserves in relation to pension plans. These negative impacts are partially offset by the impact of GBP 28 million resulting from hedging derivatives.
25% of the equity of the investee does not correspond to the carrying amount of the investment, since the carrying amount also includes the amount of the gain arising from the remeasurement at fair value of the investment retained following the sale of a 5.88% ownership interest in HAH in October 2011. The gain was recognised as an addition to goodwill. Therefore, in order to obtain the carrying amount at Ferrovial, it would be necessary to increase the 25% of the shareholders’ equity presented above (GBP 74 million) by the amount of the aforementioned gain (GBP 581 million), giving a total of GBP 655 million which, translated at the year-end exchange rate (EUR 1 = GBP 0.88893), is equivalent to the investment of EUR 737 million.
• Borrowings
The borrowings of HAH (current and non-current) amounted to GBP 14,471 million at 31 December 2017, a decrease of GBP 155 million with respect to 2016 (31 December 2016: GBP 14,626 million). This decrease was due mainly to the effect of:
• Redemption and issue of bonds amounting to GBP -1,122 million and GBP 718 million, respectively, and a net increase of GBP 372 million in bank borrowings.
• Decrease of GBP 104 million as a result of the fair value adjustments made to bonds issued in foreign currencies and of the related exchange rate effect. This impact is offset by the changes in value of the cross-currency swaps arranged to hedge this debt (EUR -144 million).
• Other changes of EUR -19 million (mainly accrued interest payable and fees and commissions).
• Derivative financial instruments at fair value
The notional principal amount of HAH's derivatives portfolio at 31 December 2017 totalled GBP 12,014 million, including interest rate derivatives (IRSs) with a notional amount of GBP 2,914 million (hedging floating-rate borrowings), cross-currency swaps (hedging bonds issued in foreign currencies) with a notional amount of GBP 3,884 million, and index-linked swaps (ILSs) (notional amount of GBP 5,216 million). The purpose of the index-linked swaps is to offset the imbalance that can arise between the business revenue and the regulated asset base, which are indexed to inflation, and the interest payments on fixed-rate borrowings, which do not fluctuate in response to changes in inflation.
The net change in the value (asset/liability position) of these financial instruments gave rise to a GBP 184 million increase in liabilities in the year. The main impacts relate to:
• Cash settlements (net payments) of GBP -68 million.
• Accrual of borrowing costs (result on financing) of GBP -195 million.
• Effect on reserves of the change in value of hedging derivatives of GBP 34 million.

178 Ɩ 2017 CONSOLIDATED FINANCIAL STATEMENTS. FERROVIAL, S.A. AND SUBSIDIARIES
F. NOTES TO THE CONSOLIDATED FINANCIAL STATEMENTS B
• Fair value adjustments to these instruments (fair value-related result) of GBP 44 million, due mainly to the index linked swaps (GBP +137 million), interest rate swaps (GBP +51 million) and cross-currency swaps (GBP -144 million, although these are partially offset by the fair value adjustments of the bonds issued in foreign currency and hedged by these instruments).
Statement of profit or loss 2017-2016
The following table shows the changes in HAH's statement of profit or loss in 2017 with respect to 2016.
HAH (100%) GBP MILLION 2017 2016 CHANGE 17/16
Operating income 2,883 2,809 74
Operating expenses -1,123 -1,126 3
Gross profit from operations
1,760 1,683 77
Depreciation and amortisation charge
-750 -708 -41
Profit from operations before impairment and disposals of non-current assets
1,010 975 35
Impairment and disposals of non-current assets
0 -7 7
Profit from operations 1,010 969 42
Financial result -628 -1,231 603
Profit or loss before tax 383 -263 645
Income tax -79 74 -153
Profit or loss from continuing operations
303 -189 492
Profit from discontinued operations
0 0 0
Net profit/loss 303 -189 492
Profit or loss attributable to Ferrovial (Millions of euros)
87 -57 144
Operating income improved mainly as a result of the good performance of commercial and aeronautical revenues, which was due basically to the increase in passenger numbers. Costs were in line with 2016. These effects are reflected in the 4.6% rise in gross profit from operations.
The most significant improvement, however, was that in the financial result, which was affected by the fair value adjustments to derivatives and liabilities at fair value (mainly index-linked swaps and interest-rate swaps), totalling GBP +203 million (EUR +48 million net attributable to Ferrovial), caused mainly by the inflation and interest rate forecasts. At 31 December 2016, these adjustments totalled GBP -479 million (effect of EUR -121 million on the net profit of Ferrovial).
3.5.2. Information relating to 407 ETR
remeasured when control was lost and implicit goodwill was considered to exist, pursuant to IAS 28.40 et seq, the possible existence of indications of impairment is assessed on an annual basis.
a. Impairment test
Based on the valuation of this concession conducted by Ferrovial, the positive evolution of the asset in recent years and the sensitivity analyses performed, it was concluded that no impairment existed.
The evolution of this asset over the last ten years has been very positive, with average annual growth of 10% in revenue, 12% in EBITDA and 23% in dividends. In 2017 the 407 ETR toll road revenue outperformed by 2.9%, in local currency terms, the estimates in the budget used as the starting point for the impairment test in the previous year. On a year-on-year basis revenue increased by 11.7% due to the 8.9% increase in tolls and a 2.3% increase in traffic. Along similar lines, EBITDA increased by 12.1% with respect to 2016 and was 3.4% higher than budgeted.
The valuation of this concession performed by Ferrovial evidences a buffer over the carrying amount of 400%. Sensibility analyses have been performed of the growth in revenue and the discount rate and the buffer continues to be ample.
The valuation methodology followed is similar to the one described for the other toll roads (see Note 3.1.2-c, Toll road division goodwill). To calculate the discount rates, a normalised risk-free rate referenced to the Canadian 30-year bond, a beta coefficient reflecting the company's leverage and risk, and a market premium of 6.0% (the same as in 2016) were used. The result is a discount rate (cost of equity or Ke) after tax of 6.5% (8.2% before tax).
Based on the valuation and the positive evolution of the asset in recent years, no indications of impairment were identified.
b. Changes in the balance sheet and statement of profit or loss for 2017-2016 relating to this Group of companies at 31 December2017 and 2016
These figures relate to the full balances of 407 ETR and are presented in millions of Canadian dollars. The exchange rates used in 2017 are EUR 1=CAD 1.5059 (2016: CAD 1.4185) for the balance sheet figures and EUR 1=CAD 1.4755 (2016: CAD 1.4590) for the statement of profit or loss.
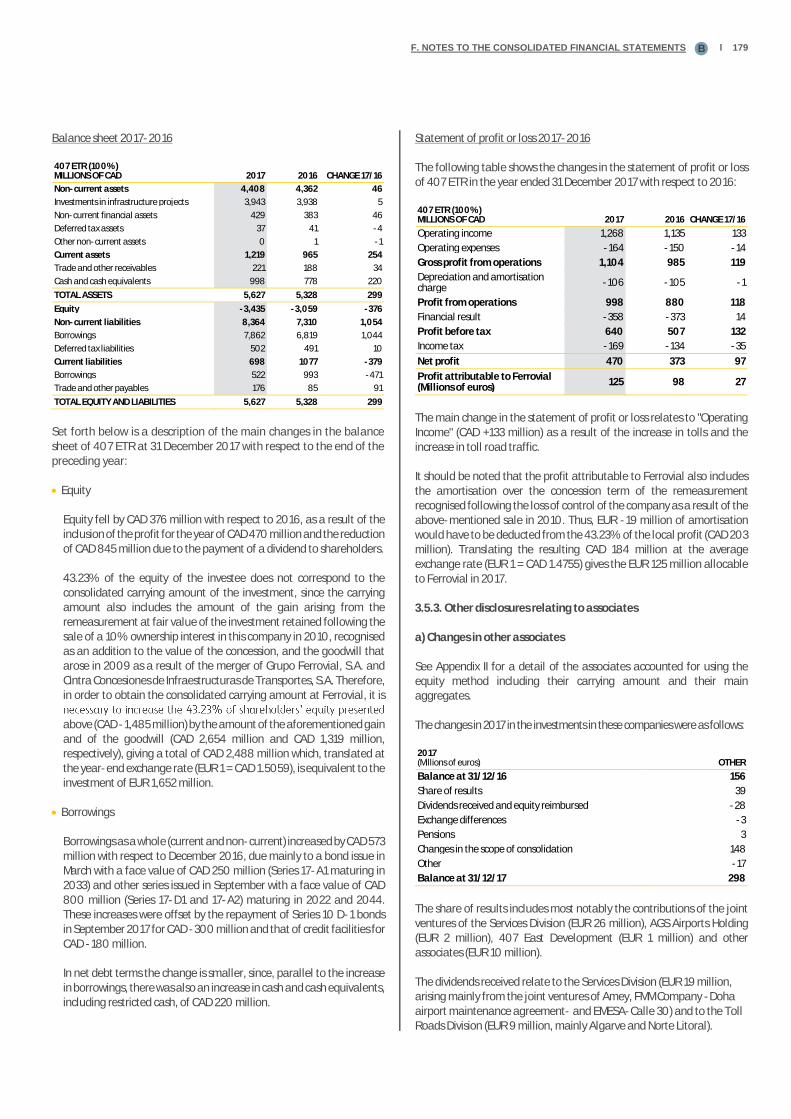
F. NOTES TO THE CONSOLIDATED FINANCIAL STATEMENTS Ɩ 179B
Balance sheet 2017-2016
407 ETR (100%) MILLIONS OF CAD 2017 2016 CHANGE 17/16
Non-current assets 4,408 4,362 46
Investments in infrastructure projects 3,943 3,938 5
Non-current financial assets 429 383 46
Deferred tax assets 37 41 -4
Other non-current assets 0 1 -1
Current assets 1,219 965 254
Trade and other receivables 221 188 34
Cash and cash equivalents 998 778 220
TOTAL ASSETS 5,627 5,328 299
Equity -3,435 -3,059 -376
Non-current liabilities 8,364 7,310 1,054
Borrowings 7,862 6,819 1,044
Deferred tax liabilities 502 491 10
Current liabilities 698 1077 -379
Borrowings 522 993 -471
Trade and other payables 176 85 91
TOTAL EQUITY AND LIABILITIES 5,627 5,328 299
Set forth below is a description of the main changes in the balance sheet of 407 ETR at 31 December 2017 with respect to the end of the preceding year:
• Equity
Equity fell by CAD 376 million with respect to 2016, as a result of the inclusion of the profit for the year of CAD 470 million and the reduction of CAD 845 million due to the payment of a dividend to shareholders.
43.23% of the equity of the investee does not correspond to the consolidated carrying amount of the investment, since the carrying amount also includes the amount of the gain arising from the remeasurement at fair value of the investment retained following the sale of a 10% ownership interest in this company in 2010, recognised as an addition to the value of the concession, and the goodwill that arose in 2009 as a result of the merger of Grupo Ferrovial, S.A. and Cintra Concesiones de Infraestructuras de Transportes, S.A. Therefore, in order to obtain the consolidated carrying amount at Ferrovial, it is
above (CAD -1,485 million) by the amount of the aforementioned gain and of the goodwill (CAD 2,654 million and CAD 1,319 million, respectively), giving a total of CAD 2,488 million which, translated at the year-end exchange rate (EUR 1 = CAD 1.5059), is equivalent to the investment of EUR 1,652 million.
• Borrowings
Borrowings as a whole (current and non-current) increased by CAD 573 million with respect to December 2016, due mainly to a bond issue in March with a face value of CAD 250 million (Series 17-A1 maturing in 2033) and other series issued in September with a face value of CAD 800 million (Series 17-D1 and 17-A2) maturing in 2022 and 2044. These increases were offset by the repayment of Series 10 D-1 bonds in September 2017 for CAD -300 million and that of credit facilities for CAD -180 million.
In net debt terms the change is smaller, since, parallel to the increase in borrowings, there was also an increase in cash and cash equivalents, including restricted cash, of CAD 220 million.
Statement of profit or loss 2017-2016
The following table shows the changes in the statement of profit or loss of 407 ETR in the year ended 31 December 2017 with respect to 2016:
407 ETR (100%) MILLIONS OF CAD 2017 2016 CHANGE 17/16
Operating income 1,268 1,135 133
Operating expenses -164 -150 -14
Gross profit from operations 1,104 985 119
Depreciation and amortisation charge
-106 -105 -1
Profit from operations 998 880 118
Financial result -358 -373 14
Profit before tax 640 507 132
Income tax -169 -134 -35
Net profit 470 373 97
Profit attributable to Ferrovial (Millions of euros)
125 98 27
The main change in the statement of profit or loss relates to "Operating Income" (CAD +133 million) as a result of the increase in tolls and the increase in toll road traffic.
It should be noted that the profit attributable to Ferrovial also includes the amortisation over the concession term of the remeasurement recognised following the loss of control of the company as a result of the above-mentioned sale in 2010. Thus, EUR -19 million of amortisation would have to be deducted from the 43.23% of the local profit (CAD 203 million). Translating the resulting CAD 184 million at the average exchange rate (EUR 1 = CAD 1.4755) gives the EUR 125 million allocable to Ferrovial in 2017.
3.5.3. Other disclosures relating to associates
a) Changes in other associates
See Appendix II for a detail of the associates accounted for using the equity method including their carrying amount and their main aggregates.
The changes in 2017 in the investments in these companies were as follows:
2017 (Millions of euros) OTHER
Balance at 31/12/16 156
Share of results 39
Dividends received and equity reimbursed -28
Exchange differences -3
Pensions 3
Changes in the scope of consolidation 148
Other -17
Balance at 31/12/17 298
The share of results includes most notably the contributions of the joint ventures of the Services Division (EUR 26 million), AGS Airports Holding (EUR 2 million), 407 East Development (EUR 1 million) and other associates (EUR 10 million).
The dividends received relate to the Services Division (EUR 19 million, arising mainly from the joint ventures of Amey, FMM Company -Doha airport maintenance agreement- and EMESA-Calle 30) and to the Toll Roads Division (EUR 9 million, mainly Algarve and Norte Litoral).

180 Ɩ 2017 CONSOLIDATED FINANCIAL STATEMENTS. FERROVIAL, S.A. AND SUBSIDIARIES
F. NOTES TO THE CONSOLIDATED FINANCIAL STATEMENTS B
The changes in the scope of consolidation, as indicated above, include the reclassification to this line item of the Portuguese toll roads Norte Litoral and Algarve (EUR 148 million).
b) Other disclosures relating to companies accounted for using the equity method
b.1) Investment in AGS
The companies accounted for using the equity method include most notably AGS Airports, which owns Aberdeen, Glasgow and Southampton airports. Since goodwill was generated on the acquisition date, an impairment test was performed. The carrying amount of AGS is EUR 180 million, the aggregate of the investment of EUR 5 million and the value of the participating loan recognised at EUR 175 million (see Note 3.6, Non-current financial assets). AGS was valued using a discount rate (Ke) of around 7.5% (approximately 8.5% before tax) and evidences a buffer of 381% over its carrying amount. In addition, the analysts' average
amount. It must be stated that this asset performed well in 2017, with increases in the number of passengers and in EBITDA over 2016 of 4.9% and 10.7%, respectively, in like-for-like terms.
b.2) I-66 toll road
In November 2017 the financial close of the project for the I-66 toll road in Virginia took place. The Group has a 50% ownership interest in the concession operator, which is accounted for using the equity method.
Although at 2017 year-end the investment in the capital of this company was not material, there is a commitment to invest an additional EUR 633 million in the next five years. b.3) Other disclosures
In addition, there are other associates with a carrying amount of zero. s or
exceeds its interest in the associate, the investor discontinues recognising its share of further losses, unless the investor has incurred legal or constructive obligations that make it necessary to recognise a liability for additional
There are no significant restrictions on the capacity of associates to transfer funds to the Parent in the form of dividends, debt repayments or advances other than such restrictions as might arise from the financing agreements of those associates or from their own financial situation, and there are no contingent liabilities relating to associates that might ultimately be assumed by the Group.
The most significant companies accounted for using the equity method in which the ownership interest is below 20% are Madrid Calle 30 and Amey Ventures Investment Limited (AVIL). The equity method is used because, although Ferrovial only has an indirect ownership interest of 10% and has the power to appoint one member of the Board of Directors in the two cases, it retains the capacity to block important decisions in matters that are not of a protective nature.
There are no significant companies in which the ownership interest exceeds 20% that are not accounted for using the equity method.
The guarantees granted by Group companies to companies accounted for using the equity method are detailed in Note 6.5.
3.6. Non-current financial assets
The changes in the year ended 31 December 2017 were as follows:
CHANGES IN 2017 (Millions of euros)
NON-CURRENT LOANS TO
ASSOCIATES
RESTRICTED CASH RELATING TO INFRASTRUCTURE
PROJECTS AND OTHER FINANCIAL ASSETS
OTHER LONG-TERM
ACCOUNTS RECEIVABLE TOTAL
Balance at 01/01/17 374 249 112 735
Additions 28 168 15 211
Disposals -82 -102 -10 -194
Transfers and other 6 0 58 64
Exchange rate effect -14 -30 -3 -47
Balance at 31/12/17 312 285 172 769
Note: balances presented net of allowances.
• - ludes mainly the loan granted to AGS amounting to EUR 175 million; participating loans to associates amounting to EUR 40 million (2016: EUR 38 million) and other ordinary loans to associates totalling EUR 97 million (2016: EUR 85 million).
• Relating to Infrastructure Projects and Other
concession operators, the use of which is limited to certain purposes established in the concession arrangement, such as payment of future investments, operating expenses or debt servicing. The net changes in this item relate mainly to two projects: LBJ Infrastructure Group, for EUR 22 million, net, and NTE Mobility Partners, for EUR 35 million, net. The Note on Net cash position provides a detail of the main balances and changes recognised under this heading.
•
• Trade accounts receivable by the Services Division from various public authorities, mainly municipal councils and autonomous community governments, which had been renegotiated at long term, amounting to approximately EUR 21 million (2016: EUR 26 million).
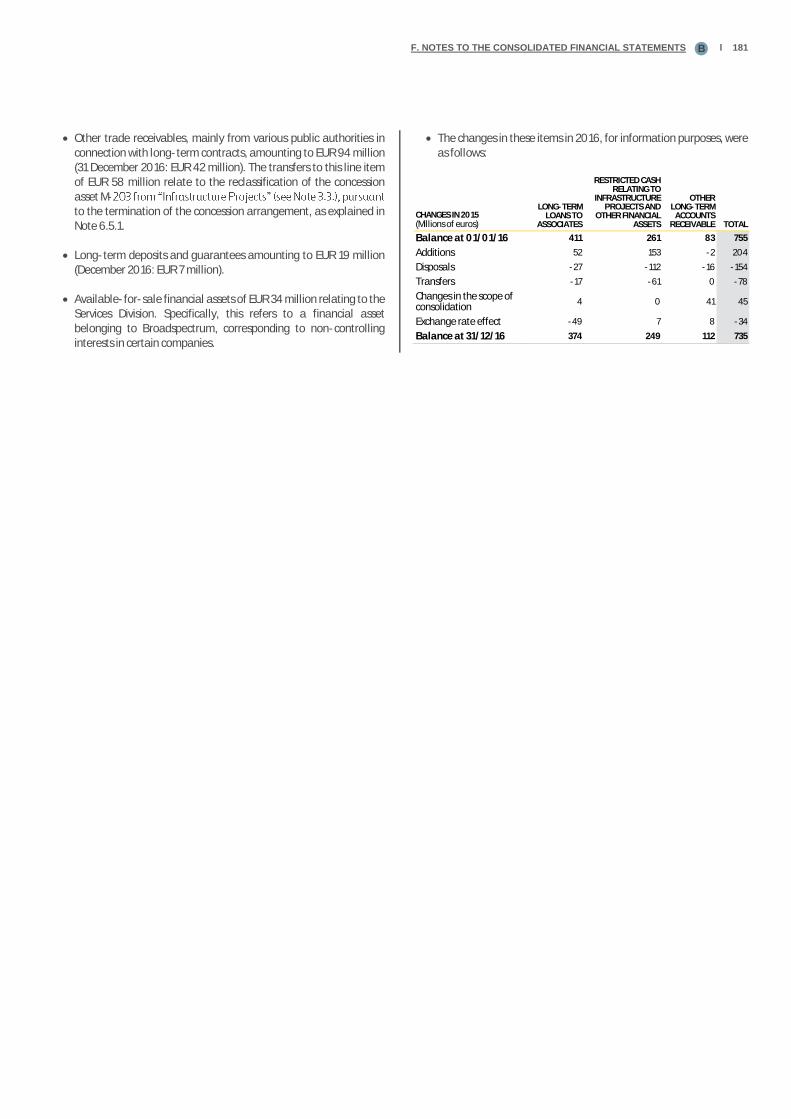
F. NOTES TO THE CONSOLIDATED FINANCIAL STATEMENTS Ɩ 181B
• Other trade receivables, mainly from various public authorities in connection with long-term contracts, amounting to EUR 94 million(31 December 2016: EUR 42 million). The transfers to this line item of EUR 58 million relate to the reclassification of the concession asset M-to the termination of the concession arrangement, as explained in Note 6.5.1.
• Long-term deposits and guarantees amounting to EUR 19 million (December 2016: EUR 7 million).
• Available-for-sale financial assets of EUR 34 million relating to theServices Division. Specifically, this refers to a financial asset belonging to Broadspectrum, corresponding to non-controllinginterests in certain companies.
• The changes in these items in 2016, for information purposes, were as follows:
CHANGES IN 2015 (Millions of euros)
LONG-TERM LOANS TO
ASSOCIATES
RESTRICTED CASH RELATING TO
INFRASTRUCTURE PROJECTS AND
OTHER FINANCIAL ASSETS
OTHER LONG-TERM
ACCOUNTS RECEIVABLE TOTAL
Balance at 01/01/16 411 261 83 755
Additions 52 153 -2 204
Disposals -27 -112 -16 -154
Transfers -17 -61 0 -78
Changes in the scope of consolidation
4 0 41 45
Exchange rate effect -49 7 8 -34
Balance at 31/12/16 374 249 112 735

182 Ɩ 2017 CONSOLIDATED FINANCIAL STATEMENTS. FERROVIAL, S.A. AND SUBSIDIARIES
F. NOTES TO THE CONSOLIDATED FINANCIAL STATEMENTS B
SECTION 4: WORKING CAPITAL
This section contains the Notes on inventories (see Note 4.1), current trade and other receivables (see Note 4.2) and current trade and other payables (see Note 4.3). The net balance of these items is called working capital.
(Millions of euros) 2016 IFRS 15
EXCHANGE RATE EFFECT
CHANGES IN THE SCOPE
OF CONSOLIDATION OTHER 2017
Inventories 516 25 -2 1 89 629
Current trade and other receivables
2,822 -304 -69 14 172 2,635
Current trade and other payables
-3,895 -19 89 -5 -391 -4,221
Total -557 -298 18 10 -130 -957
The early application of IFRS 15 (see Note 4.4) was the main reason for the change in working capital, especially with respect to trade and other receivables, which decreased by EUR 304 million.
Excluding the impact of IFRS 15, the exchange rate effect and the changes in the scope of consolidation, the most noteworthy change is the increase in Current trade and other payables, which is due mainly to the rise in the balance of advances received from customers in the Construction business in 2017.
Section 4.4 includes a more detailed analysis of the items in the consolidated statement of financial position relating to the recognition of revenue from contracts with customers in the Construction and Services businesses, and includes the disclosures required by IFRS 15 in relation to such contracts.
4.1. Inventories
The detail of inventories at 31 December 2017 and 2016 is as follows:
(Millions of euros) 2016 IFRS 15
EXCHANGE RATE
EFFECT
CHANGES IN THE SCOPE OF
CONSOLIDATION OTHER 2017
Commercial inventories
319 0 12 0 29 360
Raw materials and other supplies
128 0 -6 0 23 145
Bid and mobilisation costs
69 25 -8 1 37 124
Inventories 516 25 -2 1 89 629
Of the commercial inventories recognised at 31 December 2017, EUR 286 million (EUR 239 million in 2016) relate to the Real Estate business in Poland, of which EUR 128 million (EUR 100 million in 2016) relate to land and building lots and EUR 158 million (EUR 139 million in 2016) relate to property developments at different stages of completion.
EUR 126 million of raw materials and other supplies relate to the Construction Division, mainly at its subsidiaries in the US and Canada, amounting to EUR 53 million (EUR 49 million in 2016), and Budimex, amounting to EUR 54 million (EUR 32 million in 2016). In addition, at the end of 2017 EUR 17 million had been recognised in relation to the Services Division, mainly at its subsidiary Amey amounting to EUR 13 million (EUR 22 million in 2016).
Lastly, bid and mobilisation costs includes contract costs for EUR 124 million (EUR 69 million in 2016). As explained in Note 1.3.3.4, Revenue recognition, assets related to the costs of obtaining a contract (bid costs) and to the costs incurred to fulfil a contract (mobilisation costs) are recognised. As regards bid costs, the Group recognised EUR 23 million (EUR 9 million in 2016) corresponding to construction contracts.
Additionally, there are mobilisation costs amounting to EUR 101 million (EUR 60 million in 2016), of which EUR 27 million relate to service contracts and EUR 74 million to construction contracts. The change of EUR 25 million under this heading is due to the application of IFRS 15 (see Note 1.3.1.1) and corresponds to a reclassification from the Receivables heading, since certain mobilisation costs had been recognised under that heading.
Both for bid and mobilisation costs, amortisation is carried out systematically, in accordance with the transfer of goods and services to which the asset
corresponds. In 2017, EUR 1 million of bid costs and EUR 31 million of mobilisation costs were amortised.
4.2. Current trade and other receivables
r 2017 and 2016 is as follows:
Millions of euros 2016 IFRS 15
EXCHANGE RATE
EFFECT
CHANGES IN THE SCOPE OF
CONSOLIDATION OTHER 2017
Trade receivables for sales and services
2,193 -292 -53 13 171 2,032
Other receivables
629 -12 -16 1 0 603
Total receivables
2,822 -304 -69 14 172 2,635
a) Trade receivables for sales and services
2017 and 2016 is as follows:
(Millions of euros) 2016 IFRS 15
Exchange rate
effect
Changes in the scope of
consolidation Other 2017
Trade receivables
1,439 -30 -28 12 90 1,483
Write-downs relating to trade receivables
-287 -2 0 0 13 -276
Net trade receivables
1,152 -32 -28 12 100 1,207
Amounts to be billed for work performed
936 -259 -20 1 58 716
Retentions 105 -1 -5 0 13 112
Trade receivables for sales and services
2,193 -292 -53 13 171 2,032
from EUR 2,193 million at 31 December 2016 to EUR 2,032 million at 31 December 2017. This change is explained fundamentally by:

F. NOTES TO THE CONSOLIDATED FINANCIAL STATEMENTS Ɩ 183
B
• The early application of IFRS 15 (see Note 1.3, Accounting policies), which gave rise to a reduction in the balance of “Trade Receivables for Sales and Services” of EUR 292 million.
• The exchange rate effect, which reduced the balance of this line item by EUR 53 million. This reduction is a result mainly of the fall in value of the main currencies in which the Group operates (except for the Polish zloty, which had a positive impact of EUR 10 million).
• The remainder of the change is explained mainly by the increase in this line item in Construction Poland (EUR +79 million) and Services UK (EUR +58 million).
Also, at 31 December 2017 a total of EUR 88 million had been deducted from “Trade Receivables for Sales and Services” relating to assets derecognised as a result of factoring arrangements, since it was considered that they met the conditions stipulated in IAS 39.20 regarding the derecognition of financial assets (31 December 2016: EUR 84 million).
Following is a detail, by type of debtor, of the main trade receivables:
CONSTRUCTION SERVICES
OTHER AND ADJUSTMENTS TOTAL
Public sector customers
429 53% 772 61% 12 n/a 1,213 60%
Private sector customers
265 33% 424 34% 8 n/a 697 34%
Group companies and associates
115 14% 67 5% -59 n/a 122 6%
Total 808 100% 1,263 100% -40 n/a 2,032 100%
This detail shows that 60% of the Group's customers are public authorities and the rest are private sector customers.
In order to manage credit risk relating to private sector customers, the Group has implemented pre- and post-contracting measures. Pre-contracting measures include the consultation of debtor registers, ratings and solvency studies, while post-contracting measures during the execution of construction work include the follow-up of contractual incidents, non-payment events, etc.
The changes in the write-down of trade receivables were as follows:
(Millions of euros) 2016 2017
Beginning balance 283 287 Changes in the scope of consolidation 9 0
IFRS 15 0 2 Amounts charged to profit or loss -1 9
Charge for the year 22 20 Reversals -22 -11 Amounts used -4 -22 Exchange rate effect -2 0 Transfers and other 1 0 Ending balance 287 276
Group management considers that the carrying amount of trade receivables approximates their fair value.
b) Other receivables
The detail of “Other Receivables” at 31 December 2017 and 2016 is as follows:
Millions of euros 2016 IFRS
15
EXCHANGE RATE
EFFECT
CHANGES IN THE SCOPE OF CONSOLIDATION OTHER 2017
Advances to suppliers 97 -12 -4 0 13 94 Sundry accounts receivable 159 0 -4 1 1 157
Infrastructure project receivables 270 0 -7 0 -42 221
Receivable from public authorities 103 0 -1 0 29 131
Other receivables 629 -12 -16 1 1 603
“Sundry Accounts Receivable” includes mainly receivables not relating to normal business activities. There are no items included in the change that are material taken individually.
Also, “Accounts Receivable Relating to Infrastructure Projects” includes current financial assets arising from the application of IFRIC 12 relating mainly to amounts receivable from public authorities in return for services rendered or investments made under a concession arrangement, as detailed in Note 3.3. The main change in this heading arose as a result of the payments made by public authorities of balances payable to Autema of EUR 52 million.
Lastly, “Receivable from Public Authorities” includes tax receivables from public authorities other than income tax receivables.
4.3. Current trade and other payables
The detail of “Current Trade and Other Payables” at 31 December 2017 and 2016 is as follows:
Millions of euros 2016 IFRS 15
EXCHANGE RATE
EFFECT
CHANGES IN THE SCOPE OF
CONSOLIDATION OTHER 2017
Trade payables 2,299 1 -51 4 30 2,283
Amounts billed in advance for construction work
567 18 -27 0 61 619
Advances 424 0 0 0 228 652 Other non-trade payables 605 0 -11 1 72 667
Trade and other payables
3,895 19 -89 5 391 4,221
a) Trade payables
The detail of the trade payables at 31 December 2017 and 2016 is as follows:
Millions of euros 2016 IFRS 15
EXCHANGE RATE
EFFECT
CHANGES IN THE SCOPE OF
CONSOLIDATION OTHER 2017
Trade payables 1,819 1 -51 4 -13 1,760
Trade payables sent for reverse factoring
253 0 0 0 33 286
Retentions made from suppliers
227 0 0 0 10 237
Trade payables 2,299 1 -51 4 30 2,283
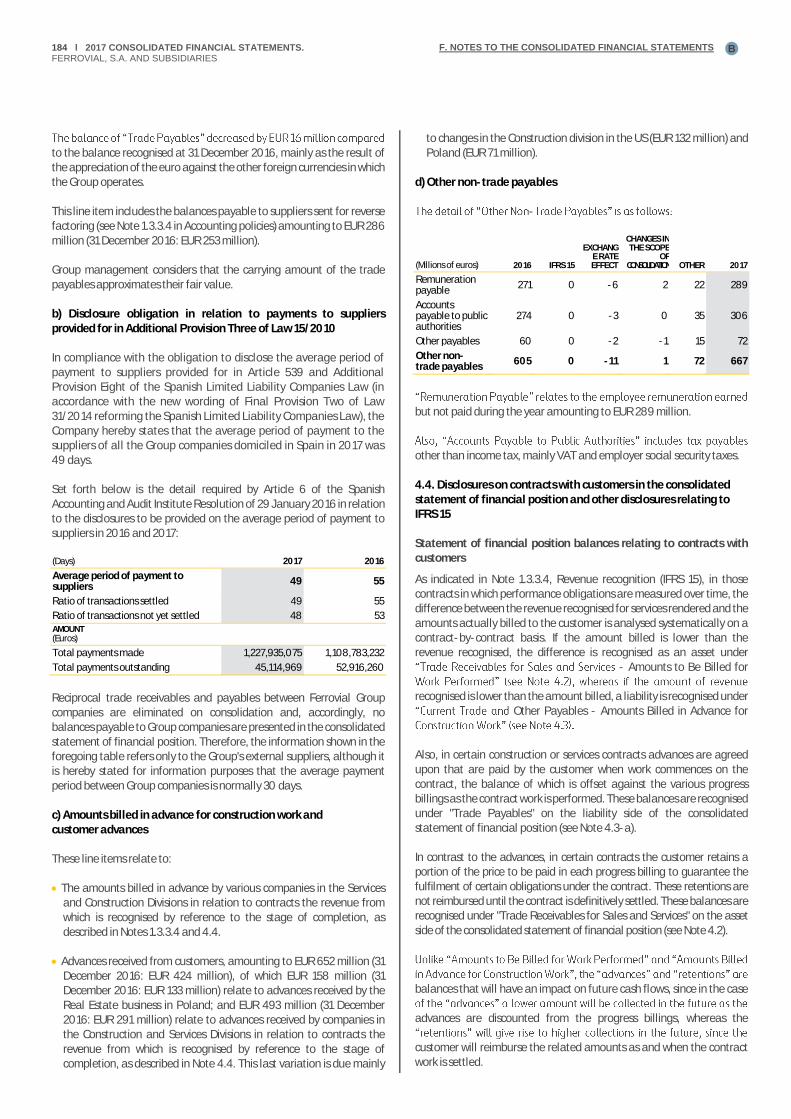
184 Ɩ 2017 CONSOLIDATED FINANCIAL STATEMENTS. FERROVIAL, S.A. AND SUBSIDIARIES
F. NOTES TO THE CONSOLIDATED FINANCIAL STATEMENTS B
to the balance recognised at 31 December 2016, mainly as the result of the appreciation of the euro against the other foreign currencies in which the Group operates.
This line item includes the balances payable to suppliers sent for reverse factoring (see Note 1.3.3.4 in Accounting policies) amounting to EUR 286 million (31 December 2016: EUR 253 million).
Group management considers that the carrying amount of the trade payables approximates their fair value.
b) Disclosure obligation in relation to payments to suppliers provided for in Additional Provision Three of Law 15/2010
In compliance with the obligation to disclose the average period of payment to suppliers provided for in Article 539 and Additional Provision Eight of the Spanish Limited Liability Companies Law (in accordance with the new wording of Final Provision Two of Law 31/2014 reforming the Spanish Limited Liability Companies Law), the Company hereby states that the average period of payment to the suppliers of all the Group companies domiciled in Spain in 2017 was 49 days.
Set forth below is the detail required by Article 6 of the Spanish Accounting and Audit Institute Resolution of 29 January 2016 in relation to the disclosures to be provided on the average period of payment to suppliers in 2016 and 2017:
(Days) 2017 2016
Average period of payment to suppliers
49 55
Ratio of transactions settled 49 55
Ratio of transactions not yet settled 48 53 AMOUNT (Euros) Total payments made 1,227,935,075 1,108,783,232
Total payments outstanding 45,114,969 52,916,260
Reciprocal trade receivables and payables between Ferrovial Group companies are eliminated on consolidation and, accordingly, no balances payable to Group companies are presented in the consolidated statement of financial position. Therefore, the information shown in the foregoing table refers only to the Group's external suppliers, although it is hereby stated for information purposes that the average payment period between Group companies is normally 30 days.
c) Amounts billed in advance for construction work andcustomer advances
These line items relate to:
• The amounts billed in advance by various companies in the Servicesand Construction Divisions in relation to contracts the revenue from which is recognised by reference to the stage of completion, as described in Notes 1.3.3.4 and 4.4.
• Advances received from customers, amounting to EUR 652 million (31 December 2016: EUR 424 million), of which EUR 158 million (31 December 2016: EUR 133 million) relate to advances received by the Real Estate business in Poland; and EUR 493 million (31 December2016: EUR 291 million) relate to advances received by companies in the Construction and Services Divisions in relation to contracts the revenue from which is recognised by reference to the stage of completion, as described in Note 4.4. This last variation is due mainly
to changes in the Construction division in the US (EUR 132 million) and Poland (EUR 71 million).
d) Other non-trade payables
-
(Millions of euros) 2016 IFRS 15
EXCHANGE RATE EFFECT
CHANGES IN THE SCOPE
OF CONSOLIDATION OTHER 2017
Remuneration payable
271 0 -6 2 22 289
Accounts payable to public authorities
274 0 -3 0 35 306
Other payables 60 0 -2 -1 15 72
Other non-trade payables
605 0 -11 1 72 667
but not paid during the year amounting to EUR 289 million.
other than income tax, mainly VAT and employer social security taxes.
4.4. Disclosures on contracts with customers in the consolidated statement of financial position and other disclosures relating to IFRS 15
Statement of financial position balances relating to contracts with customers
As indicated in Note 1.3.3.4, Revenue recognition (IFRS 15), in those contracts in which performance obligations are measured over time, the difference between the revenue recognised for services rendered and the amounts actually billed to the customer is analysed systematically on a contract-by-contract basis. If the amount billed is lower than the revenue recognised, the difference is recognised as an asset under
- Amounts to Be Billed for
recognised is lower than the amount billed, a liability is recognised under Other Payables - Amounts Billed in Advance for
Also, in certain construction or services contracts advances are agreed upon that are paid by the customer when work commences on the contract, the balance of which is offset against the various progress billings as the contract work is performed. These balances are recognised under "Trade Payables" on the liability side of the consolidated statement of financial position (see Note 4.3-a).
In contrast to the advances, in certain contracts the customer retains a portion of the price to be paid in each progress billing to guarantee the fulfilment of certain obligations under the contract. These retentions are not reimbursed until the contract is definitively settled. These balances are recognised under "Trade Receivables for Sales and Services" on the asset side of the consolidated statement of financial position (see Note 4.2).
balances that will have an impact on future cash flows, since in the case
advances are discounted from the progress billings, whereas the
customer will reimburse the related amounts as and when the contract work is settled.
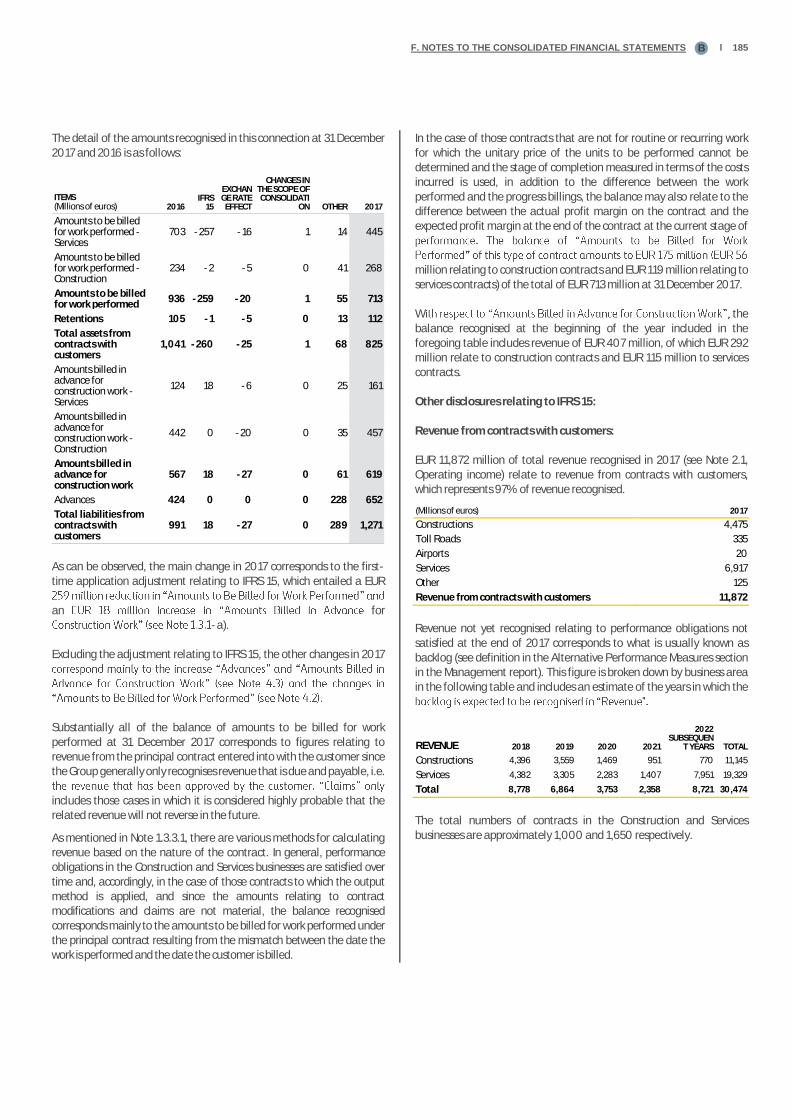
F. NOTES TO THE CONSOLIDATED FINANCIAL STATEMENTS Ɩ 185B
The detail of the amounts recognised in this connection at 31 December 2017 and 2016 is as follows:
ITEMS (Millions of euros) 2016
IFRS 15
EXCHANGE RATE
EFFECT
CHANGES IN THE SCOPE OF CONSOLIDATI
ON OTHER 2017
Amounts to be billed for work performed - Services
703 -257 -16 1 14 445
Amounts to be billed for work performed - Construction
234 -2 -5 0 41 268
Amounts to be billed for work performed
936 -259 -20 1 55 713
Retentions 105 -1 -5 0 13 112
Total assets from contracts with customers
1,041 -260 -25 1 68 825
Amounts billed in advance for construction work - Services
124 18 -6 0 25 161
Amounts billed in advance for construction work - Construction
442 0 -20 0 35 457
Amounts billed in advance for construction work
567 18 -27 0 61 619
Advances 424 0 0 0 228 652
Total liabilities from contracts with customers
991 18 -27 0 289 1,271
As can be observed, the main change in 2017 corresponds to the first-time application adjustment relating to IFRS 15, which entailed a EUR
an for -a).
Excluding the adjustment relating to IFRS 15, the other changes in 2017
Substantially all of the balance of amounts to be billed for work performed at 31 December 2017 corresponds to figures relating to revenue from the principal contract entered into with the customer since the Group generally only recognises revenue that is due and payable, i.e.
includes those cases in which it is considered highly probable that the related revenue will not reverse in the future.
As mentioned in Note 1.3.3.1, there are various methods for calculating revenue based on the nature of the contract. In general, performance obligations in the Construction and Services businesses are satisfied over time and, accordingly, in the case of those contracts to which the output method is applied, and since the amounts relating to contract modifications and claims are not material, the balance recognised corresponds mainly to the amounts to be billed for work performed under the principal contract resulting from the mismatch between the date the work is performed and the date the customer is billed.
In the case of those contracts that are not for routine or recurring work for which the unitary price of the units to be performed cannot be determined and the stage of completion measured in terms of the costs incurred is used, in addition to the difference between the work performed and the progress billings, the balance may also relate to the difference between the actual profit margin on the contract and the expected profit margin at the end of the contract at the current stage of
million relating to construction contracts and EUR 119 million relating to services contracts) of the total of EUR 713 million at 31 December 2017.
W the balance recognised at the beginning of the year included in the foregoing table includes revenue of EUR 407 million, of which EUR 292 million relate to construction contracts and EUR 115 million to services contracts.
Other disclosures relating to IFRS 15:
Revenue from contracts with customers:
EUR 11,872 million of total revenue recognised in 2017 (see Note 2.1, Operating income) relate to revenue from contracts with customers, which represents 97% of revenue recognised.
(Millions of euros) 2017
Constructions 4,475
Toll Roads 335
Airports 20
Services 6,917
Other 125
Revenue from contracts with customers 11,872
Revenue not yet recognised relating to performance obligations not satisfied at the end of 2017 corresponds to what is usually known as backlog (see definition in the Alternative Performance Measures section in the Management report). This figure is broken down by business area in the following table and includes an estimate of the years in which the
REVENUE 2018 2019 2020 2021
2022 SUBSEQUEN
T YEARS TOTAL
Constructions 4,396 3,559 1,469 951 770 11,145
Services 4,382 3,305 2,283 1,407 7,951 19,329
Total 8,778 6,864 3,753 2,358 8,721 30,474
The total numbers of contracts in the Construction and Services businesses are approximately 1,000 and 1,650 respectively.

186 Ɩ 2017 CONSOLIDATED FINANCIAL STATEMENTS. FERROVIAL, S.A. AND SUBSIDIARIES
F. NOTES TO THE CONSOLIDATED FINANCIAL STATEMENTS B
Additionally, EUR 63 million of performance obligations of construction contracts executed in previous years (EUR 42 million and EUR 21 million relating to the Construction and Services businesses), were recognised as income, of which EUR 4 million were recognised as amounts billed in advance for construction work at the beginning of the year.
Other quantitative and qualitative disclosures
The disclosures relating to the description of when performance obligations are satisfied in the various contracts, the existence of a
significant financing component, how the variable consideration is recognised, including the conditions that must be satisfied to recognise the revenue in this connection, and the concept of guarantees are included in Note 1.3.3.4. Also, the main judgements and estimates used to recognise revenue are disclosed in Note 1.3.4.
As to assets relating to bid costs and to mobilisation costs corresponding to contracts with customers, the balances recognised in the consolidated statements of financial position as at 31 December 2017 are disclosed in Note 4.1, Inventories.

F. NOTES TO THE CONSOLIDATED FINANCIAL STATEMENTS Ɩ 187B
SECTION 5: CAPITAL STRUCTURE AND FINANCING
The Notes in this section describe the changes in the financial structure of Ferrovial as a result of changes in equity (see Note 5.1) and in its consolidated net debt (see Note 5.2), taken to be the balance of cash and cash equivalents net of the financial debt, bank borrowings and debt securities, making a distinction between non-infrastructure project companies and infrastructure projects. They also describe the Group's exposure to the main financial risks and the policies for managing them (see Note 5.4), as well as the derivatives arranged in connection with those policies (see Note 5.5).
The equity attributable to the shareholders (see Note 5.1) decreased with respect to 2016, due to the impact of the early application of IFRS 15 (discussed in Note 1.3.1), the expense recognised directly in equity (arising from the exchange rate effect, pensions and derivatives) and to shareholder remuneration, which was offset in part by the increase in the consolidated net profit and the subordinated hybrid bond issue.
EQUITY ATTRIBUTABLE TO THE SHAREHOLDERS (Millions of euros)
Beginning balance at 01/01/17 5,597
Transition to IFRS 15 -272
Net profit 454
Income and expense recognised directly in equity
-191
Transfers to profit or loss 6
Shareholder remuneration -520
Subordinated hybrid bond issue 495
Other -66
Ending balance at 31/12/17 5,503
At 31 December 2015, the consolidated net debt of Ferrovial's non-infrastructure project companies was a positive net cash position of EUR 1,341 million, higher than that at December 2016 (EUR 697 million). This amount includes the cash obtained through the subordinated hybrid bond issue, which is treated as an equity instrument. Excluding this effect, mention should be made of the positive cash flows from activity generated in the year (EUR 896 million), offset by the payment of dividends (EUR -520 million). The other changes are analysed through cash .
The consolidated net debt continues to make it possible to amply achieve the objective of maintaining an investment grade rating, where the Company considers a relevant metric a ratio, for non-infrastructure projects, of net debt (gross debt less cash) to gross profit from operations (EBITDA) plus dividends from projects of no more than 2:1. Ferrovial's rating remains unchanged at BBB.
The borrowings of infrastructure projects remained at similar levels to those of 2016 (EUR 5,570 million in December 2017 compared to EUR 5,510 million in December 2016), most noteworthy being the impact of the net drawdowns (EUR 501 million), partially offset by the positive exchange rate effect (EUR 441 million), due mainly to the increase in value of the US dollar.
5,510
-441
5015,570
Begining balance
at 31/12/2017
Exchange rate
effect
Net drawdowns Ending balance at
31/12/2017
BORROWINGS OF INFRAESTRUCTURE PROJECTS
697
488 -42
553
-102
-520 500 -233
1,341
NCP Dec. 2016 EBITDA Ex. Infra.
Projects
Working Capital Dividends from
projects
Net investments Shareholder
remuneration
Hybrid Bond Others NCP Dec.2017
NET CASH POSITION EX INFRAESTRUCTURES PROJECT:
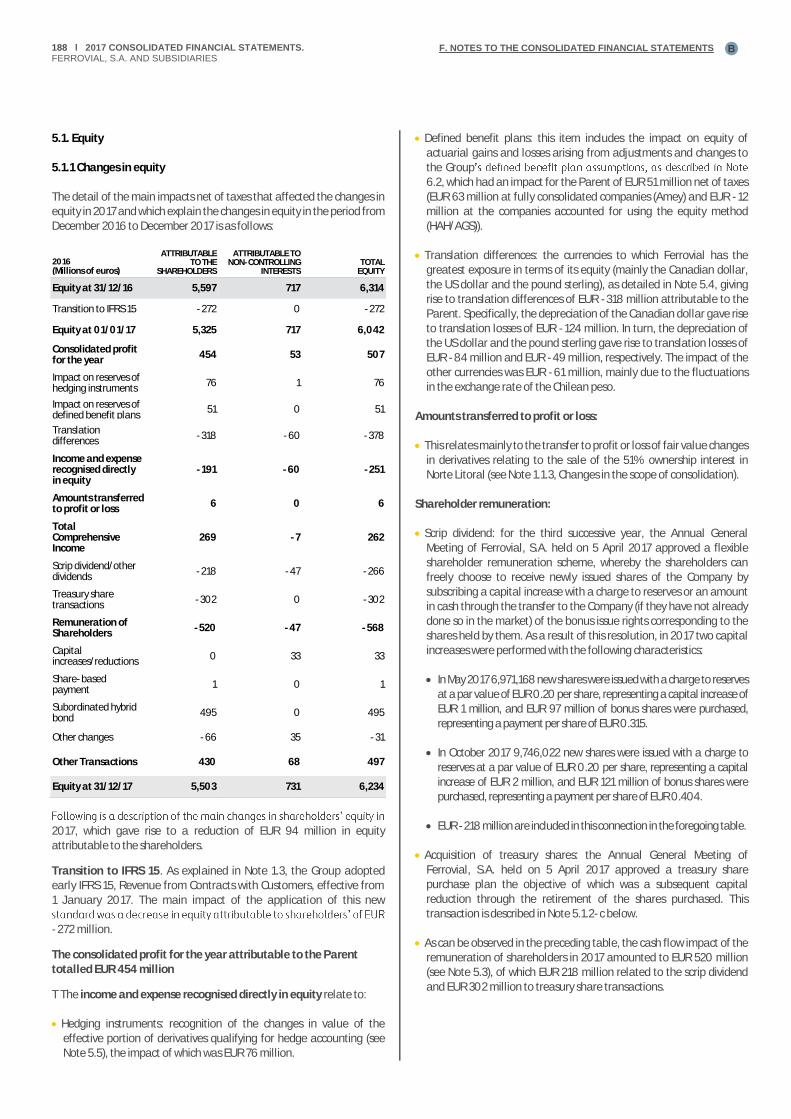
188 Ɩ 2017 CONSOLIDATED FINANCIAL STATEMENTS. FERROVIAL, S.A. AND SUBSIDIARIES
F. NOTES TO THE CONSOLIDATED FINANCIAL STATEMENTS B
5.1. Equity
5.1.1 Changes in equity
The detail of the main impacts net of taxes that affected the changes in equity in 2017 and which explain the changes in equity in the period from December 2016 to December 2017 is as follows:
2016 (Millions of euros)
ATTRIBUTABLE TO THE
SHAREHOLDERS
ATTRIBUTABLE TO NON-CONTROLLING
INTERESTS TOTAL
EQUITY
Equity at 31/12/16 5,597 717 6,314
Transition to IFRS 15 -272 0 -272
Equity at 01/01/17 5,325 717 6,042
Consolidated profit for the year
454 53 507
Impact on reserves of hedging instruments
76 1 76
Impact on reserves of defined benefit plans
51 0 51
Translation differences
-318 -60 -378
Income and expense recognised directly in equity
-191 -60 -251
Amounts transferred to profit or loss
6 0 6
Total Comprehensive Income
269 -7 262
Scrip dividend/other dividends
-218 -47 -266
Treasury share transactions
-302 0 -302
Remuneration of Shareholders
-520 -47 -568
Capital increases/reductions
0 33 33
Share-based payment
1 0 1
Subordinated hybrid bond
495 0 495
Other changes -66 35 -31
Other Transactions 430 68 497
Equity at 31/12/17 5,503 731 6,234
2017, which gave rise to a reduction of EUR 94 million in equity attributable to the shareholders.
Transition to IFRS 15. As explained in Note 1.3, the Group adopted early IFRS 15, Revenue from Contracts with Customers, effective from 1 January 2017. The main impact of the application of this new
-272 million.
The consolidated profit for the year attributable to the Parent totalled EUR 454 million
T The income and expense recognised directly in equity relate to:
• Hedging instruments: recognition of the changes in value of the effective portion of derivatives qualifying for hedge accounting (see Note 5.5), the impact of which was EUR 76 million.
• Defined benefit plans: this item includes the impact on equity ofactuarial gains and losses arising from adjustments and changes to the Group6.2, which had an impact for the Parent of EUR 51 million net of taxes (EUR 63 million at fully consolidated companies (Amey) and EUR -12 million at the companies accounted for using the equity method (HAH/AGS)).
• Translation differences: the currencies to which Ferrovial has the greatest exposure in terms of its equity (mainly the Canadian dollar, the US dollar and the pound sterling), as detailed in Note 5.4, giving rise to translation differences of EUR -318 million attributable to the Parent. Specifically, the depreciation of the Canadian dollar gave rise to translation losses of EUR -124 million. In turn, the depreciation of the US dollar and the pound sterling gave rise to translation losses of EUR -84 million and EUR -49 million, respectively. The impact of the other currencies was EUR -61 million, mainly due to the fluctuations in the exchange rate of the Chilean peso.
Amounts transferred to profit or loss:
• This relates mainly to the transfer to profit or loss of fair value changes in derivatives relating to the sale of the 51% ownership interest in Norte Litoral (see Note 1.1.3, Changes in the scope of consolidation).
Shareholder remuneration:
• Scrip dividend: for the third successive year, the Annual General Meeting of Ferrovial, S.A. held on 5 April 2017 approved a flexible shareholder remuneration scheme, whereby the shareholders canfreely choose to receive newly issued shares of the Company by subscribing a capital increase with a charge to reserves or an amount in cash through the transfer to the Company (if they have not already done so in the market) of the bonus issue rights corresponding to the shares held by them. As a result of this resolution, in 2017 two capital increases were performed with the following characteristics:
• In May 2017 6,971,168 new shares were issued with a charge to reserves at a par value of EUR 0.20 per share, representing a capital increase of EUR 1 million, and EUR 97 million of bonus shares were purchased, representing a payment per share of EUR 0.315.
• In October 2017 9,746,022 new shares were issued with a charge to reserves at a par value of EUR 0.20 per share, representing a capital increase of EUR 2 million, and EUR 121 million of bonus shares were purchased, representing a payment per share of EUR 0.404.
• EUR -218 million are included in this connection in the foregoing table.
• Acquisition of treasury shares: the Annual General Meeting ofFerrovial, S.A. held on 5 April 2017 approved a treasury share purchase plan the objective of which was a subsequent capital reduction through the retirement of the shares purchased. This transaction is described in Note 5.1.2-c below.
• As can be observed in the preceding table, the cash flow impact of the remuneration of shareholders in 2017 amounted to EUR 520 million (see Note 5.3), of which EUR 218 million related to the scrip dividend and EUR 302 million to treasury share transactions.
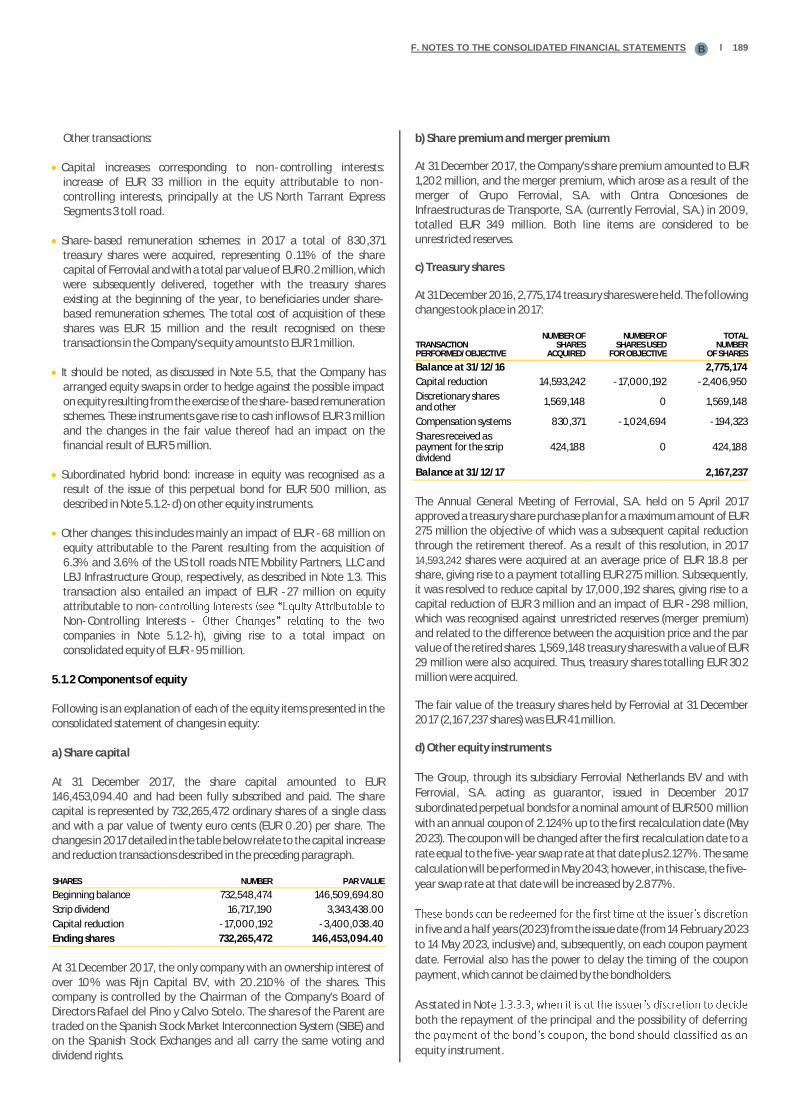
F. NOTES TO THE CONSOLIDATED FINANCIAL STATEMENTS Ɩ 189B
Other transactions:
• Capital increases corresponding to non-controlling interests:increase of EUR 33 million in the equity attributable to non-controlling interests, principally at the US North Tarrant Express Segments 3 toll road.
• Share-based remuneration schemes: in 2017 a total of 830,371 treasury shares were acquired, representing 0.11% of the share capital of Ferrovial and with a total par value of EUR 0.2 million, which were subsequently delivered, together with the treasury shares existing at the beginning of the year, to beneficiaries under share-based remuneration schemes. The total cost of acquisition of these shares was EUR 15 million and the result recognised on these transactions in the Company's equity amounts to EUR 1 million.
• It should be noted, as discussed in Note 5.5, that the Company has arranged equity swaps in order to hedge against the possible impact on equity resulting from the exercise of the share-based remuneration schemes. These instruments gave rise to cash inflows of EUR 3 million and the changes in the fair value thereof had an impact on the financial result of EUR 5 million.
• Subordinated hybrid bond: increase in equity was recognised as a result of the issue of this perpetual bond for EUR 500 million, as described in Note 5.1.2-d) on other equity instruments.
• Other changes: this includes mainly an impact of EUR -68 million on equity attributable to the Parent resulting from the acquisition of 6.3% and 3.6% of the US toll roads NTE Mobility Partners, LLC and LBJ Infrastructure Group, respectively, as described in Note 1.3. This transaction also entailed an impact of EUR -27 million on equity attributable to non-Non-Controlling Interests - companies in Note 5.1.2-h), giving rise to a total impact onconsolidated equity of EUR -95 million.
5.1.2 Components of equity
Following is an explanation of each of the equity items presented in the consolidated statement of changes in equity:
a) Share capital
At 31 December 2017, the share capital amounted to EUR 146,453,094.40 and had been fully subscribed and paid. The share capital is represented by 732,265,472 ordinary shares of a single class and with a par value of twenty euro cents (EUR 0.20) per share. The changes in 2017 detailed in the table below relate to the capital increase and reduction transactions described in the preceding paragraph.
SHARES NUMBER PAR VALUE
Beginning balance 732,548,474 146,509,694.80
Scrip dividend 16,717,190 3,343,438.00
Capital reduction -17,000,192 -3,400,038.40
Ending shares 732,265,472 146,453,094.40
At 31 December 2017, the only company with an ownership interest of over 10% was Rijn Capital BV, with 20.210% of the shares. This company is controlled by the Chairman of the Company's Board of Directors Rafael del Pino y Calvo Sotelo. The shares of the Parent are traded on the Spanish Stock Market Interconnection System (SIBE) and on the Spanish Stock Exchanges and all carry the same voting and dividend rights.
b) Share premium and merger premium
At 31 December 2017, the Company's share premium amounted to EUR 1,202 million, and the merger premium, which arose as a result of the merger of Grupo Ferrovial, S.A. with Cintra Concesiones de Infraestructuras de Transporte, S.A. (currently Ferrovial, S.A.) in 2009, totalled EUR 349 million. Both line items are considered to be unrestricted reserves.
c) Treasury shares
At 31 December 2016, 2,775,174 treasury shares were held. The following changes took place in 2017:
TRANSACTION PERFORMED/OBJECTIVE
NUMBER OF SHARES
ACQUIRED
NUMBER OF SHARES USED
FOR OBJECTIVE
TOTAL NUMBER
OF SHARES
Balance at 31/12/16 2,775,174
Capital reduction 14,593,242 -17,000,192 -2,406,950
Discretionary shares and other
1,569,148 0 1,569,148
Compensation systems 830,371 -1,024,694 -194,323
Shares received as payment for the scrip dividend
424,188 0 424,188
Balance at 31/12/17 2,167,237
The Annual General Meeting of Ferrovial, S.A. held on 5 April 2017 approved a treasury share purchase plan for a maximum amount of EUR 275 million the objective of which was a subsequent capital reduction through the retirement thereof. As a result of this resolution, in 2017 14,593,242 shares were acquired at an average price of EUR 18.8 per share, giving rise to a payment totalling EUR 275 million. Subsequently, it was resolved to reduce capital by 17,000,192 shares, giving rise to a capital reduction of EUR 3 million and an impact of EUR -298 million, which was recognised against unrestricted reserves (merger premium) and related to the difference between the acquisition price and the par value of the retired shares. 1,569,148 treasury shares with a value of EUR 29 million were also acquired. Thus, treasury shares totalling EUR 302 million were acquired.
The fair value of the treasury shares held by Ferrovial at 31 December 2017 (2,167,237 shares) was EUR 41 million.
d) Other equity instruments
The Group, through its subsidiary Ferrovial Netherlands BV and with
Ferrovial, S.A. acting as guarantor, issued in December 2017
subordinated perpetual bonds for a nominal amount of EUR 500 million
with an annual coupon of 2.124% up to the first recalculation date (May
2023). The coupon will be changed after the first recalculation date to a
rate equal to the five-year swap rate at that date plus 2.127%. The same
calculation will be performed in May 2043; however, in this case, the five-
year swap rate at that date will be increased by 2.877%.
in five and a half years (2023) from the issue date (from 14 February 2023
to 14 May 2023, inclusive) and, subsequently, on each coupon payment
date. Ferrovial also has the power to delay the timing of the coupon
payment, which cannot be claimed by the bondholders.
As stated in Not
both the repayment of the principal and the possibility of deferring
equity instrument.

190 Ɩ 2017 CONSOLIDATED FINANCIAL STATEMENTS. FERROVIAL, S.A. AND SUBSIDIARIES
F. NOTES TO THE CONSOLIDATED FINANCIAL STATEMENTS B
Thus, these subordinated perpetual bonds are recognised under
bonds and the accrued interest, which at the end of 2017 amounted to
EUR -
similar way to dividends.
Irrespective of this type of instrument being classified as equity from an
accounting standpoint, the method followed by the rating agencies for the
issue fully or partially as debt and/or partially as equity, according to the
current methodologies applied by each of these rating agencies.
e) Valuation adjustments
equity, the balance of which at 31 December 2017 was EUR -1,277 million, includes mainly the accumulated amount in reserves of the valuation adjustments made to derivatives (EUR -608 million), pension plans (EUR -511 million) and translation differences (EUR -453 million).
As regards the requirements of IAS 1 in relation to the disclosure of
note that the only items that under the related accounting legislation may not be transferred in a future period to profit or loss are the valuation adjustments relating to pension plans.
f) Retained earnings and other reserves
totalling EUR 4,624 million (2016: EUR 4,731 million). The other reserves include restricted reserves of the Parent, relating mainly to the legal reserve of EUR 29 million.
Adjustments relating to share-based remuneration schemes and the
costs are also recognised under this heading.
g) Proposed distribution of profit for 2017
convened Annual General Meeting that the profit of FERROVIAL, S.A. be distributed as follows:
(Millions of euros) AMOUNT
Profit of FERROVIAL, S.A. (euros) 97,589,632.72
Distribution (euros)
To voluntary reserves (euros) 97,589,632.72
The legal reserve has reached the legally required minimum.
h) Non-Group companies with significant ownership interests in subsidiaries
At 31 December 2017, the non-controlling interests in the share capital of the most significant fully consolidated Group companies were as follows:
FERROVIAL GROUP SUBSIDIARY NON-GROUP %
NON-GROUP SHAREHOLDER
Toll roads
Autopista Terrassa-Manresa, S.A.
23.72% Acesa (Autopista Concesionaria Española, S.A.)
Autopista del Sol, C.E.S.A.
20% Unicaja
LBJ Infrastructure Group Holding LLC
28.3272%-17.0689% LBJ Blocker (APG)- Meridiam Infr. S.a.r.l. (MI LBJ)
NTE Mobility Partners Holding, LLC
37.033% Meridiam Infrastructure S.a.r.l.
NTE Mobility Partners SEG 3 Holding LLC
28.8399%-17.4949%
NTE Segments 3 Blocker, Inc. (APG) - Meridiam Infrastructure NTE 3A/3B LLC
Construction
Budimex, S.A. 9.2%-5.4%-30.3%
AVIVA OFE Aviva BZ WBK-Nationale Nederlanden OPE (listed on the stock exchange)
The main financial statement aggregates of the most significant Group companies in which other shareholders own interests are as follows (data in 100% terms):
2017 (Millions of euros) ASSETS LIABILITIES EQUITY NET CASH POSITION NET PROFIT
Autopista Terrasa Manresa 1,105 316 789 39 18
Autopista del Sol 760 701 60 -467 3
LBJ Express 2,139 1,744 395 -1,217 -13
NTE Mobility Partners, LLC 1,749 1,485 264 -855 -4
NTE Mobility Partners Segment 3 LLC 926 626 300 -587 0
Budimex 1,480 1,214 267 538 61
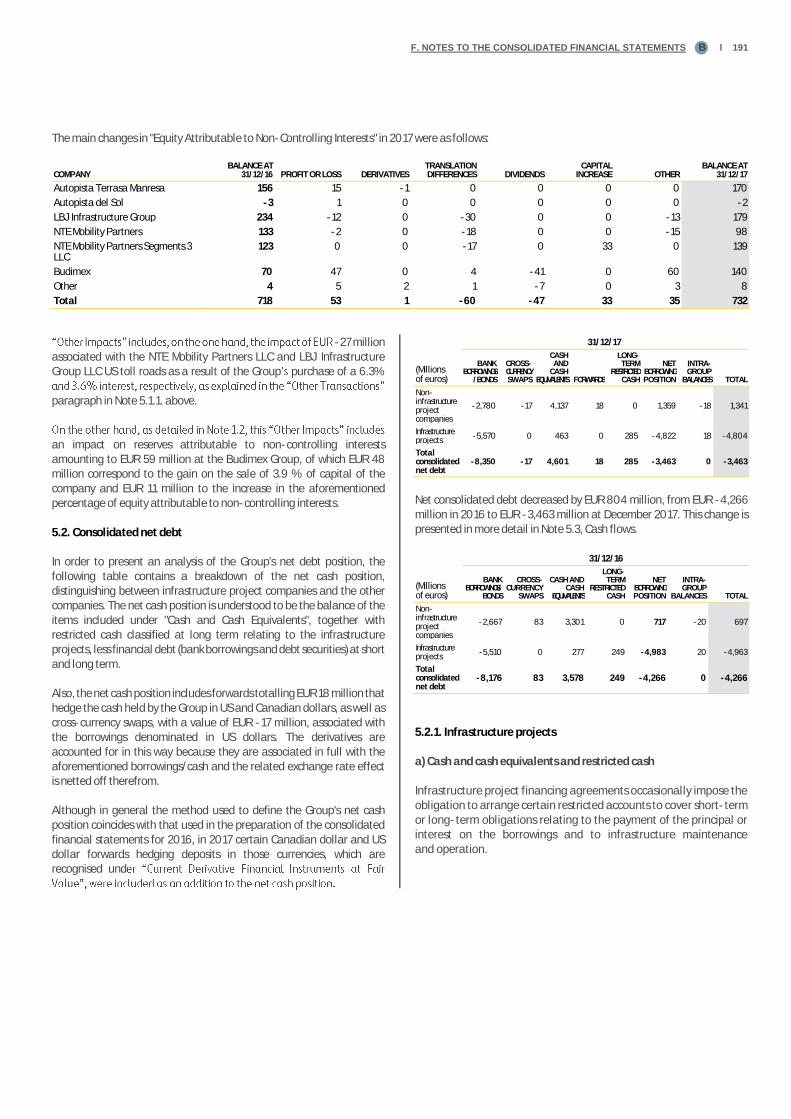
F. NOTES TO THE CONSOLIDATED FINANCIAL STATEMENTS Ɩ 191B
The main changes in "Equity Attributable to Non-Controlling Interests" in 2017 were as follows:
COMPANY BALANCE AT
31/12/16 PROFIT OR LOSS DERIVATIVES TRANSLATION DIFFERENCES DIVIDENDS
CAPITAL INCREASE OTHER
BALANCE AT 31/12/17
Autopista Terrasa Manresa 156 15 -1 0 0 0 0 170
Autopista del Sol -3 1 0 0 0 0 0 -2
LBJ Infrastructure Group 234 -12 0 -30 0 0 -13 179
NTE Mobility Partners 133 -2 0 -18 0 0 -15 98
NTE Mobility Partners Segments 3 LLC
123 0 0 -17 0 33 0 139
Budimex 70 47 0 4 -41 0 60 140
Other 4 5 2 1 -7 0 3 8
Total 718 53 1 -60 -47 33 35 732
-27 million associated with the NTE Mobility Partners LLC and LBJ Infrastructure Group LLC US toll roads as a result of the Group purchase of a 6.3%
paragraph in Note 5.1.1. above.
an impact on reserves attributable to non-controlling interests amounting to EUR 59 million at the Budimex Group, of which EUR 48 million correspond to the gain on the sale of 3.9 % of capital of the company and EUR 11 million to the increase in the aforementioned percentage of equity attributable to non-controlling interests.
5.2. Consolidated net debt
In order to present an analysis of the Group's net debt position, the following table contains a breakdown of the net cash position, distinguishing between infrastructure project companies and the other companies. The net cash position is understood to be the balance of the items included under "Cash and Cash Equivalents", together with restricted cash classified at long term relating to the infrastructure projects, less financial debt (bank borrowings and debt securities) at short and long term.
Also, the net cash position includes forwards totalling EUR 18 million that hedge the cash held by the Group in US and Canadian dollars, as well as cross-currency swaps, with a value of EUR -17 million, associated with the borrowings denominated in US dollars. The derivatives are accounted for in this way because they are associated in full with the aforementioned borrowings/cash and the related exchange rate effect is netted off therefrom.
Although in general the method used to define the Group's net cash position coincides with that used in the preparation of the consolidated financial statements for 2016, in 2017 certain Canadian dollar and US dollar forwards hedging deposits in those currencies, which are recognised und
31/12/17
(Millions of euros)
BANK BORROWINGS
/BONDS
CROSS-CURRENCY SWAPS
CASH AND
CASH EQUIVALENTS FORWARDS
LONG-TERM
RESTRICTED CASH
NET BORROWING POSITION
INTRA-GROUP
BALANCES TOTAL
Non-infrastructure project companies
-2,780 -17 4,137 18 0 1,359 -18 1,341
Infrastructure projects
-5,570 0 463 0 285 -4,822 18 -4,804
Total consolidated net debt
-8,350 -17 4,601 18 285 -3,463 0 -3,463
Net consolidated debt decreased by EUR 804 million, from EUR -4,266 million in 2016 to EUR -3,463 million at December 2017. This change is presented in more detail in Note 5.3, Cash flows.
31/12/16
(Millions of euros)
BANK BORROWINGS/
BONDS
CROSS-CURRENCY
SWAPS
CASH AND CASH
EQUIVALENTS
LONG-TERM
RESTRICTED CASH
NET BORROWING POSITION
INTRA- GROUP
BALANCES TOTAL
Non-infrastructure project companies
-2,667 83 3,301 0 717 -20 697
Infrastructure projects
-5,510 0 277 249 -4,983 20 -4,963
Total consolidated net debt
-8,176 83 3,578 249 -4,266 0 -4,266
5.2.1. Infrastructure projects
a) Cash and cash equivalents and restricted cash
Infrastructure project financing agreements occasionally impose the obligation to arrange certain restricted accounts to cover short-term or long-term obligations relating to the payment of the principal or interest on the borrowings and to infrastructure maintenance and operation.

192 Ɩ 2017 CONSOLIDATED FINANCIAL STATEMENTS. FERROVIAL, S.A. AND SUBSIDIARIES
F. NOTES TO THE CONSOLIDATED FINANCIAL STATEMENTS B
Restricted cash is classified as short-term or long-term depending on whether it must remain restricted for less than or more than one year. In any event, these funds are invested in highly-liquid financial products earning floating interest. The type of financial product in which the funds may be invested is also restricted by the financing agreements or, where no restrictions are stipulated, the decision is
cash surpluses.
Short-term balances, which amount to EUR 58 million (31 December d Cash
whereas long-term balances, of EUR 285 million (31 December 2016: EUR 249 million), are classified as financial assets. Therefore, the restricted cash at 31 December 2017 amounted to EUR 343 million (December 2016: EUR 311 million), including both long- and short-term amounts. Accordingly, there was a net change of EUR 32 million, due to:
• An increase therein of EUR 63 million (excluding the exchange rateeffect), mainly at the NTE and LBJ toll roads (EUR 35 million and EUR
Autopistas del Sol C.E.A.S.A., amounting to EUR 7 million, in relation to debt servicing and future investments.
• The exchange rate effect, which had a negative impact of EUR -31million, arose mainly due to fluctuations in the US dollar (see Note 1.4).
The other cash and cash equivalents relate to bank accounts and highly-liquid investments subject to interest rate risk.
b) Infrastructure project borrowings
b.1) Breakdown by project, significant changes in the year and maincharacteristics of the borrowings
Following is a breakdown of the borrowings by project, distinguishing between bonds and bank borrowings, short- and long-term, and of the changes in the year.
31/12/17 CHANGE 17/16
Millions of euros) BONDS
BANK BORROWINGS TOTAL BONDS
BANK BORROWIN
GS TOTAL
Non-current maturities
1,799 3,563 5,363 10 43 53
US toll roads 1,136 2,025 3,160 -158 88 -70
Spanish toll roads 487 672 1,159 -9 -12 -20
Portuguese toll roads 0 320 320 0 -8 -8
Airports 177 57 234 177 -9 167
Construction 0 154 154 0 11 11
Services 0 335 335 0 -27 -27
Current maturity 9 199 207 3 5 7
Spanish toll roads 9 10 19 3 1 4
US toll roads 0 0 0 0 0 0
Portuguese toll roads 0 9 9 0 2 2
Airports 0 2 2 0 0 0
Construction 0 4 4 0 0 0
Services 0 174 174 0 1 1
Total 1,808 3,762 5,570 13 48 61
31/12/16
(Millions of euros) BONDS BANK BORROWINGS TOTAL
Non-current maturities
1,790 3,520 5,310
US toll roads 1,294 1,937 3,231
Spanish toll roads 496 684 1,179
Portuguese toll roads
0 328 328
Airports 0 67 67
Construction 0 143 143
Services 0 362 362
Current maturity 6 194 200
Spanish toll roads 6 9 15
US toll roads 0 0 0
Portuguese toll roads
0 7 7
Airports 0 2 2
Construction 0 4 4
Services 0 172 172
Total 1,796 3,714 5,510
Following is a detail of the changes in gross debt of the infrastructure projects, detailing the changes in borrowings with a balancing entry in cash flow, the exchange rate effect and changes in the scope of consolidation, together with the changes in debt due to the accrual of interest, which do not give rise to changes in cash flows in the year.
(Millions of euros)
DEC 2016
INCREASE/ DECREASE
IMPACT ON CASH
EXCHANGE RATE
EFFECT
IMPACT OF CHANGES IN THE SCOPE
OF CONSOLIDATION
INTEREST ADDED TO
THE PRINCIPAL
AMOUNT/ ACCRUED OTHER
DEC 2017
Bank borrowings/ Bonds of infrastructure projects
5,510 412 -441 0 88 1 5,570
Gross debt position 5,510 412 -441 0 88 1 5,570
Infrastructure project borrowings increased by EUR 61 million with respect to December 2016, due mainly to the following:
• Exchange rate effect amounting to EUR -441 million, mainly due to the decline in value of the US dollar (EUR -433 million).
• Additional drawdowns against the borrowings already arranged at theend of 2016 and interest accrual and addition of interest to debt principal, for a net amount of EUR 501 million, of which:
• Issue of a bond amounting to USD 189 million by Denver Great Hall,the company awarded the project to design, construct and operate Denver International Airport's main terminal.
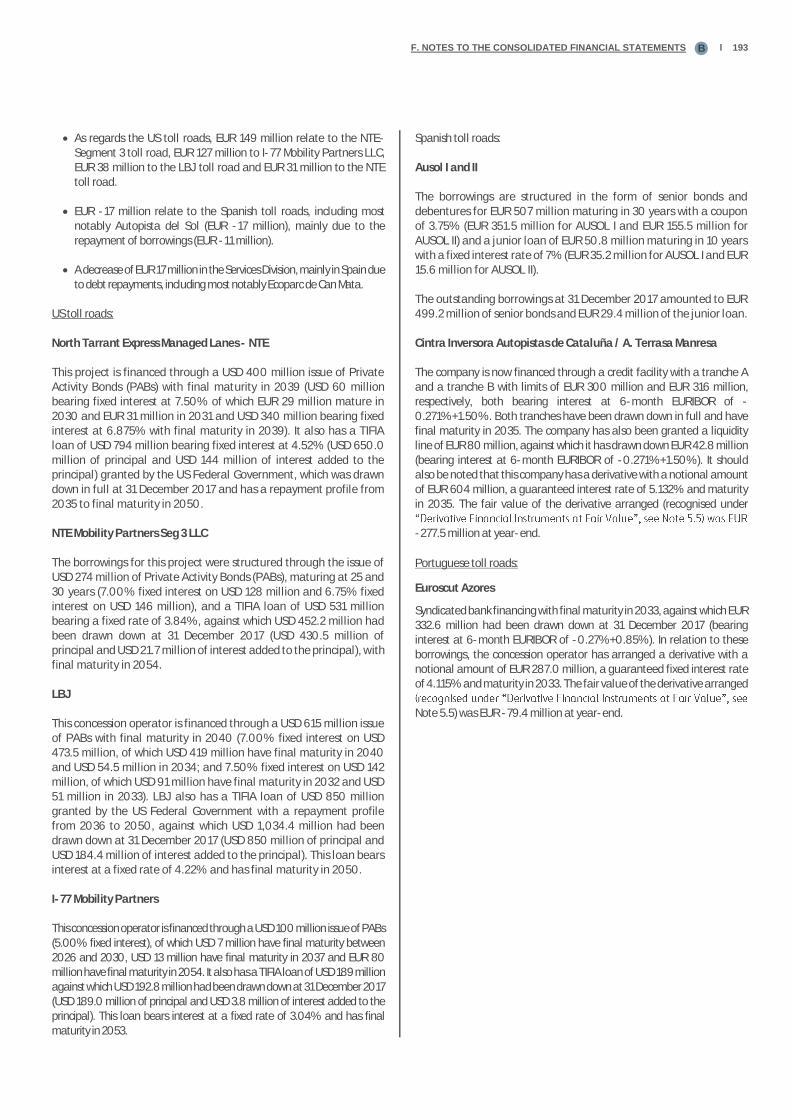
F. NOTES TO THE CONSOLIDATED FINANCIAL STATEMENTS Ɩ 193B
• As regards the US toll roads, EUR 149 million relate to the NTE-Segment 3 toll road, EUR 127 million to I-77 Mobility Partners LLC, EUR 38 million to the LBJ toll road and EUR 31 million to the NTEtoll road.
• EUR -17 million relate to the Spanish toll roads, including most notably Autopista del Sol (EUR -17 million), mainly due to the repayment of borrowings (EUR -11 million).
• A decrease of EUR 17 million in the Services Division, mainly in Spain due to debt repayments, including most notably Ecoparc de Can Mata.
US toll roads:
North Tarrant Express Managed Lanes - NTE
This project is financed through a USD 400 million issue of Private Activity Bonds (PABs) with final maturity in 2039 (USD 60 million bearing fixed interest at 7.50% of which EUR 29 million mature in 2030 and EUR 31 million in 2031 and USD 340 million bearing fixed interest at 6.875% with final maturity in 2039). It also has a TIFIA loan of USD 794 million bearing fixed interest at 4.52% (USD 650.0 million of principal and USD 144 million of interest added to the principal) granted by the US Federal Government, which was drawn down in full at 31 December 2017 and has a repayment profile from 2035 to final maturity in 2050.
NTE Mobility Partners Seg 3 LLC
The borrowings for this project were structured through the issue of USD 274 million of Private Activity Bonds (PABs), maturing at 25 and 30 years (7.00% fixed interest on USD 128 million and 6.75% fixed interest on USD 146 million), and a TIFIA loan of USD 531 million bearing a fixed rate of 3.84%, against which USD 452.2 million had been drawn down at 31 December 2017 (USD 430.5 million of principal and USD 21.7 million of interest added to the principal), with final maturity in 2054.
LBJ
This concession operator is financed through a USD 615 million issue of PABs with final maturity in 2040 (7.00% fixed interest on USD 473.5 million, of which USD 419 million have final maturity in 2040 and USD 54.5 million in 2034; and 7.50% fixed interest on USD 142 million, of which USD 91 million have final maturity in 2032 and USD 51 million in 2033). LBJ also has a TIFIA loan of USD 850 million granted by the US Federal Government with a repayment profile from 2036 to 2050, against which USD 1,034.4 million had been drawn down at 31 December 2017 (USD 850 million of principal and USD 184.4 million of interest added to the principal). This loan bears interest at a fixed rate of 4.22% and has final maturity in 2050.
I-77 Mobility Partners
This concession operator is financed through a USD 100 million issue of PABs (5.00% fixed interest), of which USD 7 million have final maturity between 2026 and 2030, USD 13 million have final maturity in 2037 and EUR 80 million have final maturity in 2054. It also has a TIFIA loan of USD 189 million against which USD 192.8 million had been drawn down at 31 December 2017 (USD 189.0 million of principal and USD 3.8 million of interest added to the principal). This loan bears interest at a fixed rate of 3.04% and has final maturity in 2053.
Spanish toll roads:
Ausol I and II
The borrowings are structured in the form of senior bonds and debentures for EUR 507 million maturing in 30 years with a coupon of 3.75% (EUR 351.5 million for AUSOL I and EUR 155.5 million for AUSOL II) and a junior loan of EUR 50.8 million maturing in 10 years with a fixed interest rate of 7% (EUR 35.2 million for AUSOL I and EUR 15.6 million for AUSOL II).
The outstanding borrowings at 31 December 2017 amounted to EUR 499.2 million of senior bonds and EUR 29.4 million of the junior loan.
Cintra Inversora Autopistas de Cataluña / A. Terrasa Manresa
The company is now financed through a credit facility with a tranche A and a tranche B with limits of EUR 300 million and EUR 316 million, respectively, both bearing interest at 6-month EURIBOR of -0.271%+1.50%. Both tranches have been drawn down in full and have final maturity in 2035. The company has also been granted a liquidity line of EUR 80 million, against which it has drawn down EUR 42.8 million (bearing interest at 6-month EURIBOR of -0.271%+1.50%). It should also be noted that this company has a derivative with a notional amount of EUR 604 million, a guaranteed interest rate of 5.132% and maturity in 2035. The fair value of the derivative arranged (recognised under
-277.5 million at year-end.
Portuguese toll roads:
Euroscut Azores
Syndicated bank financing with final maturity in 2033, against which EUR 332.6 million had been drawn down at 31 December 2017 (bearing interest at 6-month EURIBOR of -0.27%+0.85%). In relation to these borrowings, the concession operator has arranged a derivative with a notional amount of EUR 287.0 million, a guaranteed fixed interest rate of 4.115% and maturity in 2033. The fair value of the derivative arranged
Note 5.5) was EUR -79.4 million at year-end.

194 Ɩ 2017 CONSOLIDATED FINANCIAL STATEMENTS. FERROVIAL, S.A. AND SUBSIDIARIES
F. NOTES TO THE CONSOLIDATED FINANCIAL STATEMENTS B
Detail of other projects:
(Millions of euros) LONG-TERM
SHORT-TERM
TOTAL CHANGE 2017/2016
Denver Great Hall LLC 177 0 177 177
Other airports 57 2 59 -9
Airports 234 2 236 167
AmeyCespa (MK) SPV Limited
0 145 145 -6
Autovía de Aragón, Sociedad Concesionaria, S.A.
85 13 98 -3
Smart Hospital Cantabria S.A.
65 3 69 -3
Other services 185 12 197 -13
Services 335 174 509 -25
Conc. Prisiones Lledoners,S.A.
73 1 74 -1
Concesionaria de Prisiones Figueras S.A.U.
61 2 63 -2
Other construction 20 1 21 14
Construction 154 4 158 11
Total other infrastructure project borrowings
723 179 902 153
(Millions of euros) LONG-TERM
SHORT-TERM 2016
Denver Great Hall LLC 0 0 0
Other airports 67 2 68
Airports 67 2 68
AmeyCespa (MK) SPV Limited 0 151 151
Autovía de Aragón, Sociedad Concesionaria, S.A.
93 9 101
Smart Hospital Cantabria S.A.
68 3 71
Other services 201 9 210
Services 362 172 534
Conc. Prisiones Lledoners,S.A.
73 1 74
Concesionaria de Prisiones Figueras S.A.U.
63 3 65
Other construction 7 0 7
Construction 143 4 147
Total other infrastructure project borrowings
572 178 749
Other infrastructure project borrowings increased by EUR 153 million with respect to December 2016 due mainly to the financing of the project for the remodelling and commercial operation of the Jeppesen Terminal of Denver airport (see Note 1.1.3). This financing was realised through the issue, on 21 December 2017, of a bond for USD 189 million with 5% fixed interest and final maturity in 2049.

F. NOTES TO THE CONSOLIDATED FINANCIAL STATEMENTS Ɩ 195B
b.2) Maturities by currency and fair value of infrastructure project borrowings
(Millions of euros) CURRENCY FAIR
VALUE 2017 FAIR
VALUE 2016 CARRYING
AMOUNT 2017 2018 2019 2020 2021 2022
2023 AND SUBSEQUE
NT YEARS TOTAL
MATURITIES
Bonds of infrastructure projects
2,039 1,983 1,808 9 10 12 13 14 1,754 1,812
Toll Roads 1,776 1,983 1,632 9 10 12 13 13 1,598 1,655
USD 1,281 1,481 1,136 0 0 0 0 0 1,155 1,155
EUR 496 502 496 9 10 12 13 13 443 499
Airports 262 0 177 0 0 0 0 1 156 157
USD 262 0 177 0 0 0 0 1 156 157
Bank borrowings of infrastructure projects
3,762 3,714 3,762 190 52 54 107 73 3,327 3,803
Toll Roads 3,036 2,965 3,036 18 22 24 17 24 2,969 3,075
USD 2,025 1,937 2,025 0 0 0 0 0 2,054 2,054
EUR 1,012 1,028 1,012 18 22 24 17 24 915 1,021
Airports 59 68 59 2 2 2 55 0 0 60
USD 59 68 59 2 2 2 55 0 0 60
Construction 158 147 158 3 2 3 3 4 145 160
EUR 158 147 158 3 2 3 3 4 145 160
Services 509 534 509 168 26 26 32 45 213 508
GBP 203 213 203 147 1 1 1 3 51 203
EUR 306 321 306 21 25 25 31 42 162 306
Total borrowings of infrastructure projects
5,801 5,697 5,570 199 62 65 120 87 5,081 5,615
The differences between the total maturities of the bank borrowings (EUR 5,615 million) and the carrying amounts thereof at 31 December 2017 (EUR 5,570 million) are explained mainly by the difference between the nominal values and carrying amounts of the debts, as certain adjustments are made in accordance with applicable accounting legislation. Thus, the accrued interest payable and the application of the amortised cost method represent an impact of EUR 45 million, taking into account that the maturities of the borrowings do not include interest.
The fair value reflected in the table above is calculated as follows:
• For fixed-rate bonds, subject to changes in value due to fluctuations inmarket interest rates: since they are quoted in an active market, the related market value is used.
• For fixed-interest bank borrowings, also subject to changes in value due to fluctuations in rates: future cash flows are discounted using a market interest rate, calculated using an internal valuation model.
• Lastly, for floating-rate bank borrowings: no significant differences are deemed to exist between the fair value of the borrowings and their carrying amount and, therefore, the carrying amount is used.
b.3) Information on credit limits and credit drawable for infrastructure projects
Set forth below is a comparative analysis of borrowings not drawn down at year-end:
2017 (Millions of euros) DEBT LIMIT
AMOUNT DRAWN DOWN
AMOUNT DRAWABLE
CARRYING AMOUNT OF
DEBT
Toll roads 4,838 4,729 109 4,668
US toll roads 3,293 3,210 84 3,160
Spanish toll roads 1,212 1,187 25 1,178
Other toll roads 333 333 0 329
Airports 217 217 0 236
Construction 161 160 1 158
Services 514 508 6 509
Total borrowings
5,730 5,615 116 5,570
2016 (Millions of euros) DEBT LIMIT
AMOUNT DRAWN DOWN
AMOUNT DRAWABLE
CARRYING AMOUNT OF
DEBT
Toll roads 5,242 4,833 409 4,760
US toll roads 3,667 3,290 377 3,231
Spanish toll roads 1,237 1,205 32 1,195
Other toll roads 338 338 0 335
Airports 70 70 0 68
Construction 164 148 16 147
Services 542 537 6 534
Total borrowings
6,018 5,588 430 5,510
The differences between the total bank borrowings drawn down and the carrying amount of the related debt at 31 December 2017 are explained mainly by the difference between the nominal values and carrying amounts of the debts, as certain adjustments are made in accordance with applicable accounting legislation (basically accrued interest payable and the application of the amortised cost method, which are detailed in point b.2 above).
Of the EUR 116 million drawable (31 December 2016: EUR 430 million), EUR 84 million relate mainly to amounts not drawn down against borrowings that were obtained to finance toll roads under construction in the US. It should be noted that this drawable amount
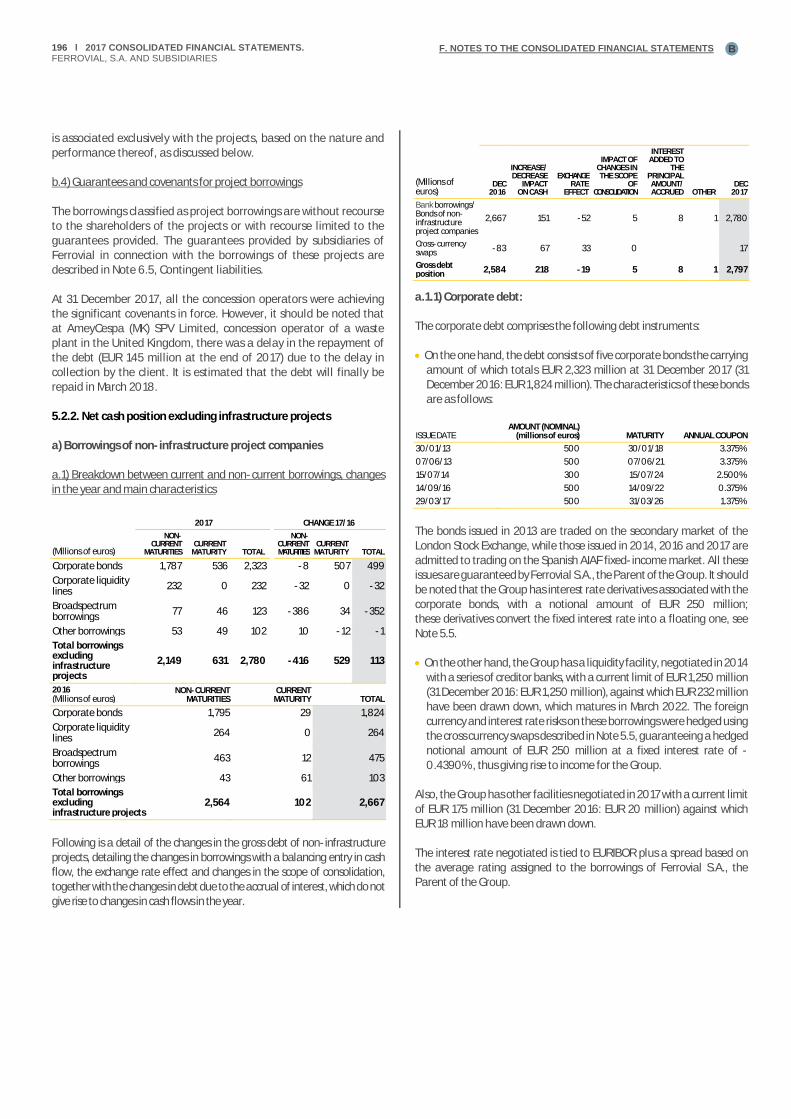
196 Ɩ 2017 CONSOLIDATED FINANCIAL STATEMENTS. FERROVIAL, S.A. AND SUBSIDIARIES
F. NOTES TO THE CONSOLIDATED FINANCIAL STATEMENTS B
is associated exclusively with the projects, based on the nature and performance thereof, as discussed below.
b.4) Guarantees and covenants for project borrowings
The borrowings classified as project borrowings are without recourse to the shareholders of the projects or with recourse limited to the guarantees provided. The guarantees provided by subsidiaries of Ferrovial in connection with the borrowings of these projects are described in Note 6.5, Contingent liabilities.
At 31 December 2017, all the concession operators were achieving the significant covenants in force. However, it should be noted that at AmeyCespa (MK) SPV Limited, concession operator of a waste plant in the United Kingdom, there was a delay in the repayment of the debt (EUR 145 million at the end of 2017) due to the delay in collection by the client. It is estimated that the debt will finally be repaid in March 2018.
5.2.2. Net cash position excluding infrastructure projects
a) Borrowings of non-infrastructure project companies
a.1) Breakdown between current and non-current borrowings, changes in the year and main characteristics
2017 CHANGE 17/16
(Millions of euros)
NON-CURRENT
MATURITIES CURRENT
MATURITY TOTAL
NON-CURRENT MATURITIES
CURRENT MATURITY TOTAL
Corporate bonds 1,787 536 2,323 -8 507 499
Corporate liquidity lines
232 0 232 -32 0 -32
Broadspectrum borrowings
77 46 123 -386 34 -352
Other borrowings 53 49 102 10 -12 -1
Total borrowings excluding infrastructure projects
2,149 631 2,780 -416 529 113
2016 (Millions of euros)
NON-CURRENT MATURITIES
CURRENT MATURITY TOTAL
Corporate bonds 1,795 29 1,824
Corporate liquidity lines
264 0 264
Broadspectrum borrowings
463 12 475
Other borrowings 43 61 103
Total borrowings excluding infrastructure projects
2,564 102 2,667
Following is a detail of the changes in the gross debt of non-infrastructure projects, detailing the changes in borrowings with a balancing entry in cash flow, the exchange rate effect and changes in the scope of consolidation, together with the changes in debt due to the accrual of interest, which do not give rise to changes in cash flows in the year.
(Millions of euros)
DEC 2016
INCREASE/ DECREASE
IMPACT ON CASH
EXCHANGE RATE
EFFECT
IMPACT OF CHANGES IN THE SCOPE
OF CONSOLIDATION
INTEREST ADDED TO
THE PRINCIPAL
AMOUNT/ ACCRUED OTHER
DEC 2017
Bank borrowings/ Bonds of non-infrastructure project companies
2,667 151 -52 5 8 1 2,780
Cross-currency swaps -83 67 33 0 17
Gross debt position 2,584 218 -19 5 8 1 2,797
a.1.1) Corporate debt:
The corporate debt comprises the following debt instruments:
• On the one hand, the debt consists of five corporate bonds the carrying amount of which totals EUR 2,323 million at 31 December 2017 (31 December 2016: EUR 1,824 million). The characteristics of these bonds are as follows:
ISSUE DATE AMOUNT (NOMINAL)
(millions of euros) MATURITY ANNUAL COUPON
30/01/13 500 30/01/18 3.375%
07/06/13 500 07/06/21 3.375%
15/07/14 300 15/07/24 2.500%
14/09/16 500 14/09/22 0.375%
29/03/17 500 31/03/26 1.375%
The bonds issued in 2013 are traded on the secondary market of the London Stock Exchange, while those issued in 2014, 2016 and 2017 are admitted to trading on the Spanish AIAF fixed-income market. All these issues are guaranteed by Ferrovial S.A., the Parent of the Group. It should be noted that the Group has interest rate derivatives associated with the corporate bonds, with a notional amount of EUR 250 million; these derivatives convert the fixed interest rate into a floating one, see Note 5.5.
• On the other hand, the Group has a liquidity facility, negotiated in 2014 with a series of creditor banks, with a current limit of EUR 1,250 million (31 December 2016: EUR 1,250 million), against which EUR 232 million have been drawn down, which matures in March 2022. The foreign currency and interest rate risks on these borrowings were hedged using the cross currency swaps described in Note 5.5, guaranteeing a hedged notional amount of EUR 250 million at a fixed interest rate of -0.4390%, thus giving rise to income for the Group.
Also, the Group has other facilities negotiated in 2017 with a current limit of EUR 175 million (31 December 2016: EUR 20 million) against which EUR 18 million have been drawn down.
The interest rate negotiated is tied to EURIBOR plus a spread based on the average rating assigned to the borrowings of Ferrovial S.A., the Parent of the Group.
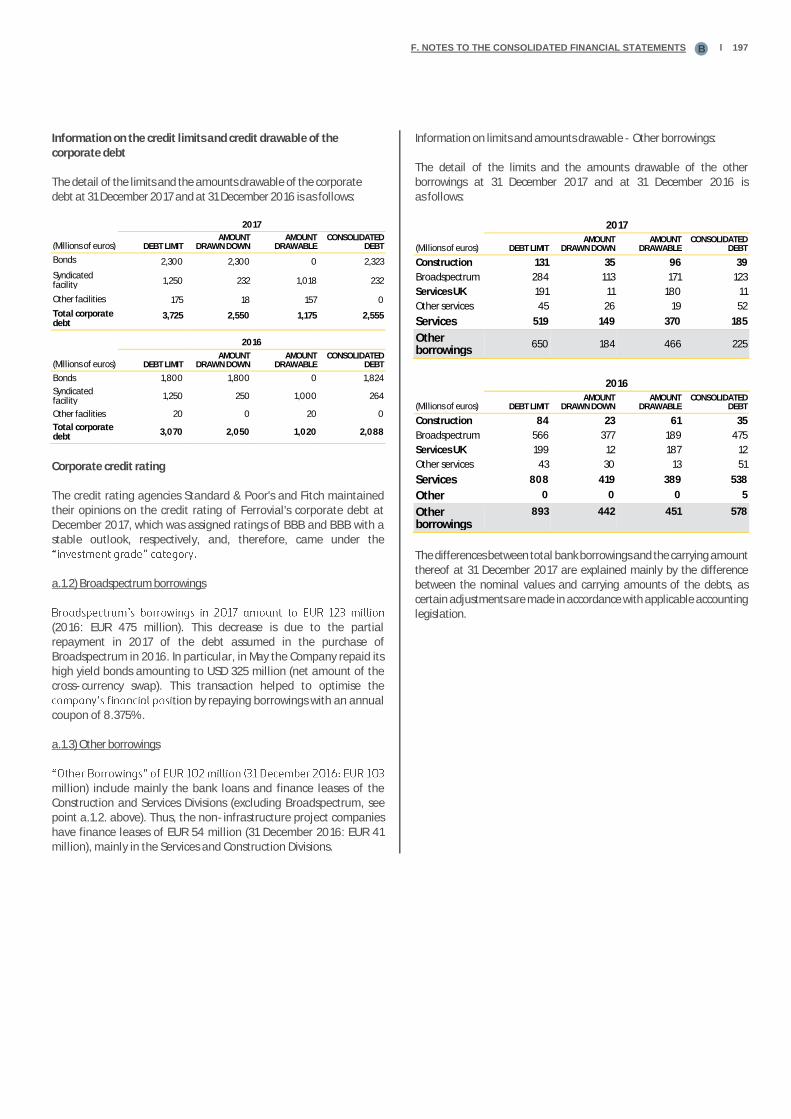
F. NOTES TO THE CONSOLIDATED FINANCIAL STATEMENTS Ɩ 197B
Information on the credit limits and credit drawable of the corporate debt
The detail of the limits and the amounts drawable of the corporate debt at 31 December 2017 and at 31 December 2016 is as follows:
2017
(Millions of euros) DEBT LIMIT AMOUNT
DRAWN DOWN AMOUNT
DRAWABLE CONSOLIDATED
DEBT
Bonds 2,300 2,300 0 2,323
Syndicated facility 1,250 232 1,018 232
Other facilities 175 18 157 0
Total corporate debt
3,725 2,550 1,175 2,555
2016
(Millions of euros) DEBT LIMIT AMOUNT
DRAWN DOWN AMOUNT
DRAWABLE CONSOLIDATED
DEBT
Bonds 1,800 1,800 0 1,824
Syndicated facility
1,250 250 1,000 264
Other facilities 20 0 20 0
Total corporate debt
3,070 2,050 1,020 2,088
Corporate credit rating
The credit rating agencies Standard & Poor's and Fitch maintained their opinions on the credit rating of Ferrovial's corporate debt at December 2017, which was assigned ratings of BBB and BBB with a stable outlook, respectively, and, therefore, came under the
a.1.2) Broadspectrum borrowings
(2016: EUR 475 million). This decrease is due to the partial repayment in 2017 of the debt assumed in the purchase of Broadspectrum in 2016. In particular, in May the Company repaid its high yield bonds amounting to USD 325 million (net amount of the cross-currency swap). This transaction helped to optimise the
tion by repaying borrowings with an annual coupon of 8.375%.
a.1.3) Other borrowings
million) include mainly the bank loans and finance leases of the Construction and Services Divisions (excluding Broadspectrum, see point a.1.2. above). Thus, the non-infrastructure project companies have finance leases of EUR 54 million (31 December 2016: EUR 41 million), mainly in the Services and Construction Divisions.
Information on limits and amounts drawable - Other borrowings:
The detail of the limits and the amounts drawable of the other borrowings at 31 December 2017 and at 31 December 2016 is as follows:
2017
(Millions of euros) DEBT LIMIT AMOUNT
DRAWN DOWN AMOUNT
DRAWABLE CONSOLIDATED
DEBT
Construction 131 35 96 39
Broadspectrum 284 113 171 123
Services UK 191 11 180 11
Other services 45 26 19 52
Services 519 149 370 185
Other borrowings
650 184 466 225
2016
(Millions of euros) DEBT LIMIT AMOUNT
DRAWN DOWN AMOUNT
DRAWABLE CONSOLIDATED
DEBT
Construction 84 23 61 35
Broadspectrum 566 377 189 475
Services UK 199 12 187 12
Other services 43 30 13 51
Services 808 419 389 538
Other 0 0 0 5
Other borrowings
893 442 451 578
The differences between total bank borrowings and the carrying amount thereof at 31 December 2017 are explained mainly by the difference between the nominal values and carrying amounts of the debts, as certain adjustments are made in accordance with applicable accounting legislation.

198 Ɩ 2017 CONSOLIDATED FINANCIAL STATEMENTS. FERROVIAL, S.A. AND SUBSIDIARIES
F. NOTES TO THE CONSOLIDATED FINANCIAL STATEMENTS B
a.2) Maturities by currency and fair value of borrowings excluding infrastructure projects
BORROWINGS (Millions of euros) CURRENCY
FAIR VALUE 2017
CARRYING AMOUNT
2017 2018 2019 2020 2021 2022
2023 AND SUBSEQUENT
YEARS TOTAL
MATURITIES
Corporate debt 2,407 2,555 500 0 0 500 750 800 2,550
EUR 2,407 2,555 500 0 0 500 750 800 2,550
Services Division debt 185 185 41 73 3 6 11 16 149
AUD 7 7 23 0 0 0 0 0 23
EUR 36 36 6 0 0 2 2 1 12
GBP 11 11 0 0 2 0 9 0 11
USD 79 79 10 70 0 0 0 0 80
CAD 9 9 0 0 0 0 0 8 8
PLN 12 12 1 0 1 2 0 6 10
CLP 31 31 0 2 1 1 0 0 5
Other borrowings 40 40 0 1 2 5 9 13 29
EUR 5 5 0 0 0 0 0 2 2
GBP 0 0 0 0 0 0 0 0 0
PLN 27 27 0 1 2 5 9 11 27
OMR 6 6 0 0 0 0 0 0 0
CLP 0 0 0 0 0 0 0 0 0
Total borrowings excluding infrastructure projects
2,632 2,780 541 74 5 510 769 829 2,729
The differences between the total maturities of borrowings and the carrying amounts of the debt at 31 December 2017 are explained mainly by the difference between the nominal values and carrying amounts of the debts, as certain adjustments are made in accordance with applicable accounting legislation (basically accrued interest payable and the application of the amortised cost method).
The fair value of bank borrowings excluding infrastructure projects coincides with the related carrying amount because the borrowings are tied to floating market interest rates and, therefore, changes in the benchmark interest rates do not affect their fair value.
As regards corporate bonds: since they are quoted in an active market, the related market value is used.
Based on the aforementioned criteria, the estimated total fair value of bank borrowings and bonds excluding infrastructure projects was EUR 2,632 million at 31 December 2017 (31 December 2016: EUR 2,735 million).
The 2018 maturities amount to EUR 541 million and relate mainly to the maturity of the first corporate bond for EUR 500 million and borrowings associated with Broadspectrum, of EUR 34 million, and Inagra, S.A., totalling EUR 6 million. The debt maturities do not include interest.
b) Cash and cash equivalents of other companies
Although in general the method used to classify the cash and cash equivalents at short- and long-term coincides with that used in the preparation of the consolidated financial statements for 2016, in 2017 certain Canadian dollar and US dollar forwards hedging
addition to the net cash position.
Also, at 31 December there were certain restricted accounts totalling EUR 31 million (31 December 2016: EUR 37 million) associated mainly with the developments in progress of Budimex.
5.3. Cash flow
The consolidated statement of cash flows was prepared in accordance with IAS 7. This Note provides an additional breakdown in this connection based on internal criteria established by the Company for business performance purposes, which in certain cases differ from the provisions of IAS 7. The main criteria applied are as follows:
• In order to provide a clearer explanation of the cash generated, theGroup
treated as financial assets and the investments in the capital of these companies are therefore included in cash flows from investing activities and the yields from the investments (dividends and capital reimbursements) are included in cash flows from operating activities,
from the operating and financing activities of infrastructure project concession operators.
• The treatment given to interest received on cash and cash equivalents differs from that in the statement of cash flows prepared inaccordance with IAS 7, since this interest is included in cash flows from financing activities as a reduction of the amount recognised under"Interest Cash Flows".
• Lastly, the statement of cash flows endeavours to present the changes in the net cash position as the net amount of borrowings, cash and cash equivalents and restricted cash. This method also departs fromthat established in IAS 7, which explains the changes in cash and cash equivalents.

F. NOTES TO THE CONSOLIDATED FINANCIAL STATEMENTS Ɩ 199B
DECEMBER 2017 (Millions of euros) CASH FLOWS EXCLUDING
INFRASTRUCTURE PROJECTS
CASH FLOWS OF INFRASTRUCTURE
PROJECTS ELIMINATIONS CONSOLIDATED CASH FLOW DECEMBER 2017 NOTE:
Ebitda (gross profit from operations) 2.4 484 449 0 932
Dividends received 3.5 553 0 -10 543
Change in working capital (receivables, payables and other)
5.3 -38 -16 0 -53
Cash flows from operating activities before tax
999 433 -10 1,422
Taxes paid in the year 2.8.1 -115 -27 0 -142
Cash flows from operating activities 883 407 -10 1,280
Investments 3.2, 3.3 & 3.4 -355 -371 43 -684
Disposals 1.1.3 253 0 -5 248
Cash flows from investing activities -102 -371 38 -436
Cash flows from operating and investing activities
781 35 28 844
Interest cash flows 2.6 -32 -204 0 -236
Capital proceeds from non-controlling interests
0 73 -38 35
Scrip dividend -218 0 0 -218
Acquisition of treasury shares -302 0 0 -302
Remuneration of shareholders 5.1 -520 0 0 -520
Dividends paid to non-controlling shareholders of investees
-48 -11 10 -49
Exchange rate effect -43 398 0 354
Changes in the scope of consolidation 1.1.3 0 -43 0 -43
Perpetual subordinated bond issue 500 0 0 500
Other changes in borrowings (not giving rise to cash flows)
6 -88 0 -82
Cash flows from financing activities -137 125 -28 -40
Change in net cash position 5.2 644 160 0 804
Opening position 697 -4.963 0 -4,266
Closing position 1.341 -4.804 0 -3,463
Change in working capital:
The change in working capital disclosed in the foregoing table is the measure that explains the difference between the Group's EBITDA (Gross profit from operations) and its cash flows from operating activities before tax; it arises from the difference between the accrual of revenue and expenses for accounting purposes and the time when such revenue and expenses are transformed into cash, and relates mainly to changes in the balances of trade receivables and payables to suppliers or other items in the consolidated statement of financial position. Thus, a reduction in the balance of trade receivables will give rise to an improvement in working capital and a reduction in the balance of payables to suppliers will give rise to a worsening of working capital.
The changes in this item do not exactly coincide with the changes in working capital reported in Section 4 of the consolidated financial statements for the following reasons:
NON-INFRASTRUCTURE PROJECT
COMPANIES
INFRASTRUCTURE
PROJECTS AND
ADJUSTMENTS TOTAL
Change in working capital (Section 4) 60 70 130
Changes in working capital with an impact on cash flows from investing activities
62 -133 -71
Changes in provisions with an impact on gross profit from operations or on working capital
-111 0 -111
Changes in other statement of financial position items with an impact on cash flows from operating activities
-50 48 -2
Total working capital reported in statement of cash flows -38 -16 -53
The positive impact of the changes in working capital in the consolidated statement of financial position (EUR +130 million) is explained by the increase in Trade receivables, due mainly to the collection of advances received in the Construction business (especially the I-66) and amounts received from infrastructure projects to which the financial asset model is applied, most noteworthy being Autema (see the detail in Section 4). This positive impact is offset by the changes in provisions (EUR -111 million), the most noteworthy of which is the net effect of the recognition/reversal of provisions with an impact on EBITDA (EUR 70 million), that do not give rise to cash outflows, in addition to the use of provisions with a balancing entry in working capital accounts (EUR -181 million), which do give rise to a cash outflow. Also, various items included in operating cash flows with an impact on other items in the consolidated statement of financial position must be borne in mind, such as pension plans and share-based remuneration schemes, as well as the effect of other financial results, (unrelated to financing) such as late-payment interest and guarantees. Taking into account all these changes, the working capital reported in cash flow amounts to EUR -53 million.
The differences mentioned above relate to the following items:
• Changes in working capital with an impact on other cash flow line items. The working capital accounts reported in Section 4, especially thepayables to suppliers, can relate to transactions that do not affect cashflows from operating activities, such as non-current asset purchases.
• Changes in provisions with an impact on gross profit from operations oron working capital. These relate to the recognition/reversal of provisions with an impact on gross profit from operations, which does not have an impact on cash, or provisions used with a balancing entry in working capital accounts (see Note 6. 3).

200 Ɩ 2017 CONSOLIDATED FINANCIAL STATEMENTS. FERROVIAL, S.A. AND SUBSIDIARIES
F. NOTES TO THE CONSOLIDATED FINANCIAL STATEMENTS B
• Changes in other statement of financial position items with an impacton cash flows from operating activities. The changes in working capital reported in Section 4 reflect only movements in items included under
Payabexpenses relate not only to items shown in working capital (current
items) but also to certain items recognised as non-current assets and liabilities, such as non-current trade receivables and non-current payables to suppliers, or even to items in equity accounts such as transactions relating to share-based remuneration schemes. Also, this line item includes other financial result items not directly related to financing, such as late-payment interest and guarantee expenses.
The cash flows reported in 2016 were as follows:
DECEMBER 2016 (Millions of euros)
CASH FLOWS EXCLUDING INFRASTRUCTURE PROJECTS
CASH FLOWS OF INFRASTRUCTURE PROJECTS ELIMINATIONS CONSOLIDATED CASH FLOW DECEMBER 2016 NOTE:
Ebitda (gross profit from operations) 2.4 502 442 0 944
Dividends received 3.5 477 0 -50 427
Change in working capital (receivables, payables and other)
16 -68 0 -52
Cash flows from operating activities before tax
995 373 -50 1,319
Taxes paid in the year 2.8.1 -125 -23 0 -147
Cash flows from operating activities
870 351 -50 1,172
Investments -985 -388 72 -1,301
Disposals 1.1 340 0 0 340
Cash flows from investing activities -645 -388 72 -961
Cash flows from operating and investing activities
226 -38 22 210
Interest cash flows 2.6 -48 -303 0 -351
Capital proceeds from non-controlling interests
2 122 -72 53
Scrip dividend -226 0 0 -226
Acquisition of treasury shares -317 0 0 -317
Remuneration of shareholders 5.1 -544 0 0 -544
Dividends paid to non-controlling shareholders of investees
-23 -50 50 -24
Exchange rate effect -9 -111 0 -119
Changes in the scope of consolidation 1.1.3 -440 1,702 0 1,262
Other changes in borrowings (not giving rise to cash flows)
18 -230 0 -212
Cash flows from financing activities -1,043 1,131 -22 66
Change in net cash position 5.2 -817 1,093 0 276
Opening position 1,514 -6,057 0 -4,542
Closing position 697 -4,963 0 -4,266
5.4. Management of financial risks and capital
s activities are exposed to changes in the financial variables affecting their accounts, particularly interest rate, foreign currency, credit, liquidity and equity risk. The policies adopted by the Group in managing these risks are explained in detail in the directors' report.
Following are specific data on the Group's exposure to each of these risks and an analysis of the sensitivity to a change in the various variables, together with a brief description of the management of each risk.
In addition, in view of the economic and political importance of the UK's decision to leave withdraw from the European Union (Brexit), this Note includes a separate in-depth analysis of the impact it has had for Ferrovial with respect to the various financial risks and how these risks are being managed.
a. Exposure to interest rate risk
Ferrovial's businesses are subject to changes in the economic cycles and interest rate risk management takes this into consideration, modelling interest rate settings against financial instrument liquidity management. When interest rates are low, the Group seeks to fix future levels at non-infrastructure project level, although such hedging can affect liquidity in the event of cancellation. At infrastructure project level, the banks and rating agencies require a higher percentage of fixed-rate debt. These strategies are achieved by issuing fixed-rate debt or by arranging hedging financial derivatives, a detail of which is provided in Note 5.5, Derivative financial instruments at fair value. The aim of these hedges is to optimise the finance costs borne by the Group.
indicating the percentage of the debt that is considered to be hedged (either by a fixed rate or by derivatives).
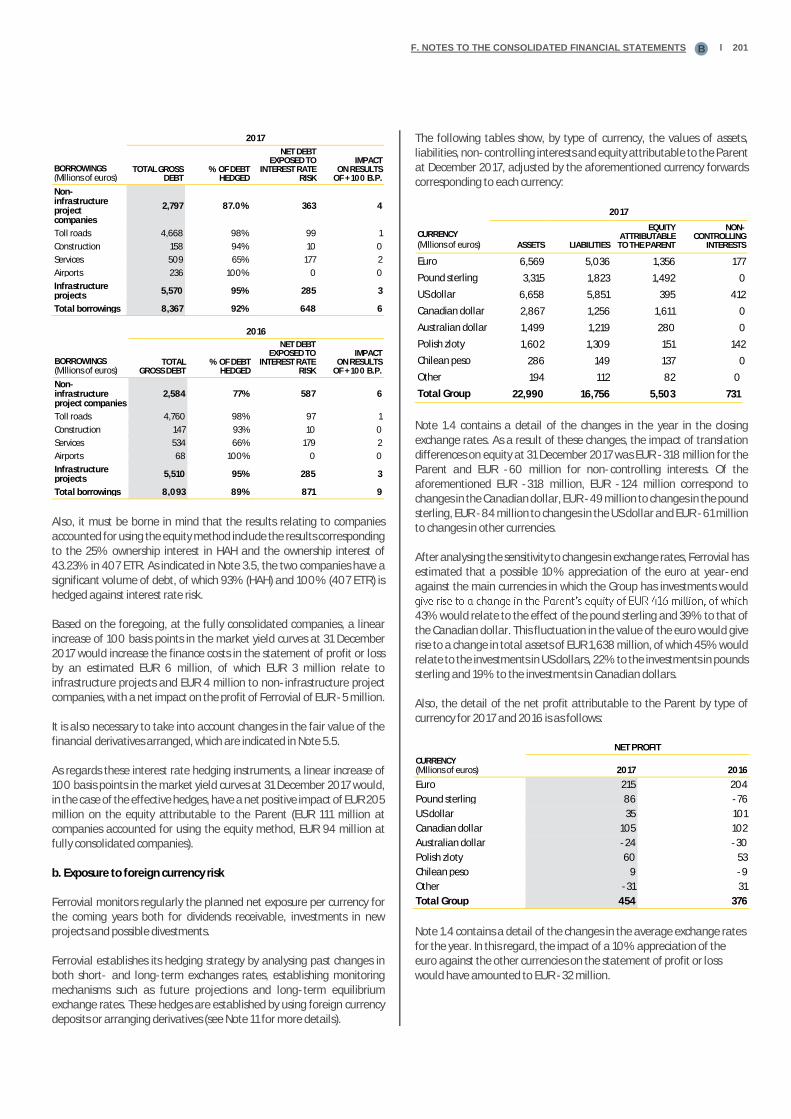
F. NOTES TO THE CONSOLIDATED FINANCIAL STATEMENTS Ɩ 201B
2017
BORROWINGS (Millions of euros)
TOTAL GROSS DEBT
% OF DEBT HEDGED
NET DEBT EXPOSED TO
INTEREST RATE RISK
IMPACT ON RESULTS
OF + 100 B.P.
Non-infrastructure project companies
2,797 87.0% 363 4
Toll roads 4,668 98% 99 1
Construction 158 94% 10 0
Services 509 65% 177 2
Airports 236 100% 0 0
Infrastructure projects
5,570 95% 285 3
Total borrowings 8,367 92% 648 6
2016
BORROWINGS (Millions of euros)
TOTAL GROSS DEBT
% OF DEBT HEDGED
NET DEBT EXPOSED TO
INTEREST RATE RISK
IMPACT ON RESULTS
OF + 100 B.P.
Non-infrastructure project companies
2,584 77% 587 6
Toll roads 4,760 98% 97 1
Construction 147 93% 10 0
Services 534 66% 179 2
Airports 68 100% 0 0
Infrastructure projects
5,510 95% 285 3
Total borrowings 8,093 89% 871 9
Also, it must be borne in mind that the results relating to companies accounted for using the equity method include the results corresponding to the 25% ownership interest in HAH and the ownership interest of 43.23% in 407 ETR. As indicated in Note 3.5, the two companies have a significant volume of debt, of which 93% (HAH) and 100% (407 ETR) is hedged against interest rate risk.
Based on the foregoing, at the fully consolidated companies, a linear increase of 100 basis points in the market yield curves at 31 December 2017 would increase the finance costs in the statement of profit or loss by an estimated EUR 6 million, of which EUR 3 million relate to infrastructure projects and EUR 4 million to non-infrastructure project companies, with a net impact on the profit of Ferrovial of EUR -5 million.
It is also necessary to take into account changes in the fair value of the financial derivatives arranged, which are indicated in Note 5.5.
As regards these interest rate hedging instruments, a linear increase of 100 basis points in the market yield curves at 31 December 2017 would, in the case of the effective hedges, have a net positive impact of EUR 205 million on the equity attributable to the Parent (EUR 111 million at companies accounted for using the equity method, EUR 94 million at fully consolidated companies).
b. Exposure to foreign currency risk
Ferrovial monitors regularly the planned net exposure per currency for the coming years both for dividends receivable, investments in new projects and possible divestments.
Ferrovial establishes its hedging strategy by analysing past changes in both short- and long-term exchanges rates, establishing monitoring mechanisms such as future projections and long-term equilibrium exchange rates. These hedges are established by using foreign currency deposits or arranging derivatives (see Note 11 for more details).
The following tables show, by type of currency, the values of assets, liabilities, non-controlling interests and equity attributable to the Parent at December 2017, adjusted by the aforementioned currency forwards corresponding to each currency:
2017
CURRENCY (Millions of euros) ASSETS LIABILITIES
EQUITY ATTRIBUTABLE
TO THE PARENT
NON-CONTROLLING
INTERESTS
Euro 6,569 5,036 1,356 177
Pound sterling 3,315 1,823 1,492 0
US dollar 6,658 5,851 395 412
Canadian dollar 2,867 1,256 1,611 0
Australian dollar 1,499 1,219 280 0
Polish zloty 1,602 1,309 151 142
Chilean peso 286 149 137 0
Other 194 112 82 0
Total Group 22,990 16,756 5,503 731
Note 1.4 contains a detail of the changes in the year in the closing exchange rates. As a result of these changes, the impact of translation differences on equity at 31 December 2017 was EUR -318 million for the Parent and EUR -60 million for non-controlling interests. Of the aforementioned EUR -318 million, EUR -124 million correspond to changes in the Canadian dollar, EUR -49 million to changes in the pound sterling, EUR -84 million to changes in the US dollar and EUR -61 million to changes in other currencies.
After analysing the sensitivity to changes in exchange rates, Ferrovial has estimated that a possible 10% appreciation of the euro at year-end against the main currencies in which the Group has investments would
43% would relate to the effect of the pound sterling and 39% to that of the Canadian dollar. This fluctuation in the value of the euro would give rise to a change in total assets of EUR 1,638 million, of which 45% would relate to the investments in US dollars, 22% to the investments in pounds sterling and 19% to the investments in Canadian dollars.
Also, the detail of the net profit attributable to the Parent by type of currency for 2017 and 2016 is as follows:
NET PROFIT
CURRENCY (Millions of euros) 2017 2016
Euro 215 204
Pound sterling 86 -76
US dollar 35 101
Canadian dollar 105 102
Australian dollar -24 -30
Polish zloty 60 53
Chilean peso 9 -9
Other -31 31
Total Group 454 376
Note 1.4 contains a detail of the changes in the average exchange rates for the year. In this regard, the impact of a 10% appreciation of the euro against the other currencies on the statement of profit or loss would have amounted to EUR -32 million.
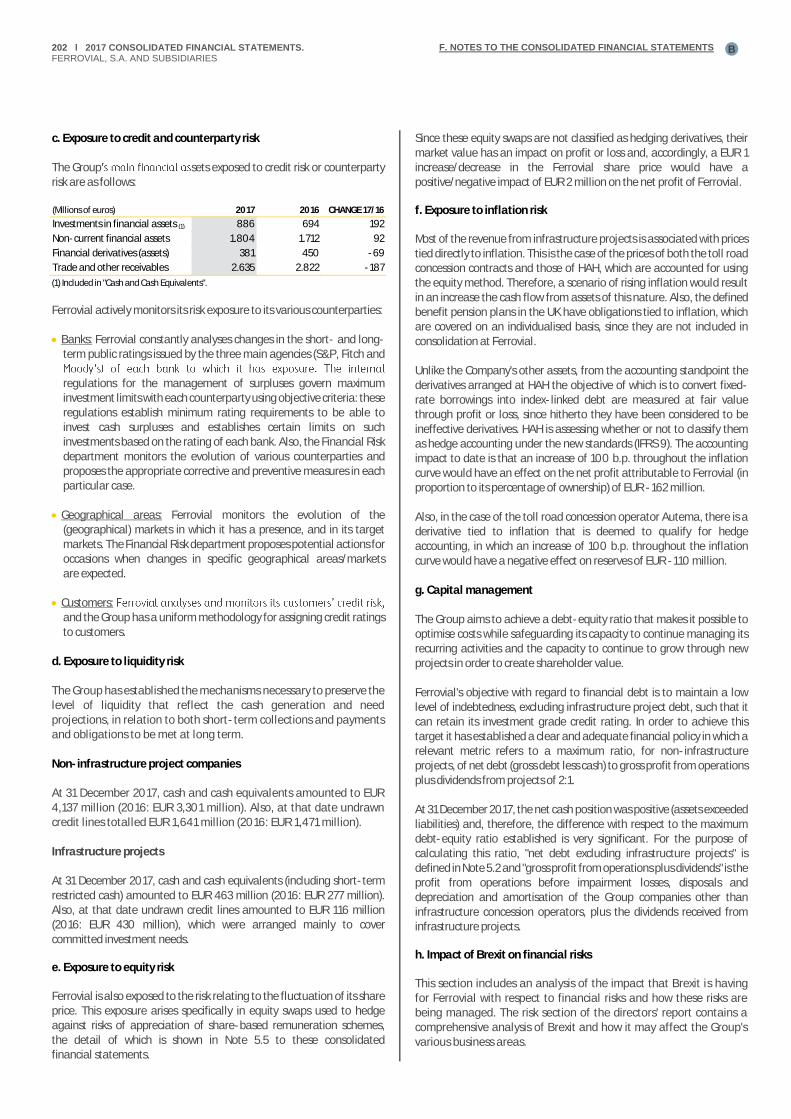
202 Ɩ 2017 CONSOLIDATED FINANCIAL STATEMENTS. FERROVIAL, S.A. AND SUBSIDIARIES
F. NOTES TO THE CONSOLIDATED FINANCIAL STATEMENTS B
c. Exposure to credit and counterparty risk
The Group sets exposed to credit risk or counterparty risk are as follows:
(Millions of euros) 2017 2016 CHANGE 17/16
Investments in financial assets (1) 886 694 192
Non-current financial assets 1.804 1.712 92
Financial derivatives (assets) 381 450 -69
Trade and other receivables 2.635 2.822 -187
(1) Included in "Cash and Cash Equivalents".
Ferrovial actively monitors its risk exposure to its various counterparties:
• Banks: Ferrovial constantly analyses changes in the short- and long-term public ratings issued by the three main agencies (S&P, Fitch and
regulations for the management of surpluses govern maximum investment limits with each counterparty using objective criteria: these regulations establish minimum rating requirements to be able to invest cash surpluses and establishes certain limits on such investments based on the rating of each bank. Also, the Financial Risk department monitors the evolution of various counterparties and proposes the appropriate corrective and preventive measures in each particular case.
• Geographical areas: Ferrovial monitors the evolution of the(geographical) markets in which it has a presence, and in its target markets. The Financial Risk department proposes potential actions for occasions when changes in specific geographical areas/markets are expected.
• Customers:and the Group has a uniform methodology for assigning credit ratings to customers.
d. Exposure to liquidity risk
The Group has established the mechanisms necessary to preserve the level of liquidity that reflect the cash generation and need projections, in relation to both short-term collections and payments and obligations to be met at long term.
Non-infrastructure project companies
At 31 December 2017, cash and cash equivalents amounted to EUR 4,137 million (2016: EUR 3,301 million). Also, at that date undrawn credit lines totalled EUR 1,641 million (2016: EUR 1,471 million).
Infrastructure projects
At 31 December 2017, cash and cash equivalents (including short-term restricted cash) amounted to EUR 463 million (2016: EUR 277 million). Also, at that date undrawn credit lines amounted to EUR 116 million (2016: EUR 430 million), which were arranged mainly to cover committed investment needs.
e. Exposure to equity risk
Ferrovial is also exposed to the risk relating to the fluctuation of its share price. This exposure arises specifically in equity swaps used to hedge against risks of appreciation of share-based remuneration schemes, the detail of which is shown in Note 5.5 to these consolidated financial statements.
Since these equity swaps are not classified as hedging derivatives, their market value has an impact on profit or loss and, accordingly, a EUR 1 increase/decrease in the Ferrovial share price would have a positive/negative impact of EUR 2 million on the net profit of Ferrovial.
f. Exposure to inflation risk
Most of the revenue from infrastructure projects is associated with prices tied directly to inflation. This is the case of the prices of both the toll road concession contracts and those of HAH, which are accounted for using the equity method. Therefore, a scenario of rising inflation would result in an increase the cash flow from assets of this nature. Also, the defined benefit pension plans in the UK have obligations tied to inflation, which are covered on an individualised basis, since they are not included in consolidation at Ferrovial.
Unlike the Company's other assets, from the accounting standpoint the derivatives arranged at HAH the objective of which is to convert fixed-rate borrowings into index-linked debt are measured at fair value through profit or loss, since hitherto they have been considered to be ineffective derivatives. HAH is assessing whether or not to classify them as hedge accounting under the new standards (IFRS 9). The accounting impact to date is that an increase of 100 b.p. throughout the inflation curve would have an effect on the net profit attributable to Ferrovial (in proportion to its percentage of ownership) of EUR -162 million.
Also, in the case of the toll road concession operator Autema, there is a derivative tied to inflation that is deemed to qualify for hedge accounting, in which an increase of 100 b.p. throughout the inflation curve would have a negative effect on reserves of EUR -110 million.
g. Capital management
The Group aims to achieve a debt-equity ratio that makes it possible to optimise costs while safeguarding its capacity to continue managing its recurring activities and the capacity to continue to grow through new projects in order to create shareholder value.
Ferrovial's objective with regard to financial debt is to maintain a low level of indebtedness, excluding infrastructure project debt, such that it can retain its investment grade credit rating. In order to achieve this target it has established a clear and adequate financial policy in which a relevant metric refers to a maximum ratio, for non-infrastructure projects, of net debt (gross debt less cash) to gross profit from operations plus dividends from projects of 2:1.
At 31 December 2017, the net cash position was positive (assets exceeded liabilities) and, therefore, the difference with respect to the maximum debt-equity ratio established is very significant. For the purpose of calculating this ratio, "net debt excluding infrastructure projects" is defined in Note 5.2 and "gross profit from operations plus dividends" is the profit from operations before impairment losses, disposals and depreciation and amortisation of the Group companies other than infrastructure concession operators, plus the dividends received from infrastructure projects.
h. Impact of Brexit on financial risks
This section includes an analysis of the impact that Brexit is having for Ferrovial with respect to financial risks and how these risks are being managed. The risk section of the directors' report contains a comprehensive analysis of Brexit and how it may affect the Group's various business areas.

F. NOTES TO THE CONSOLIDATED FINANCIAL STATEMENTS Ɩ 203B
osure on the basis of the different financial and business variables is detailed in the following table.
2017
(Millions of euros) TOTAL FERROVIAL UK EXPOSURE % OF TOTAL
Sales 12,208 2,871 24%
Gross profit from operations
932 29 3%
Net profit 454 62 14%
Equity 5,503 1,492 27%
Valuation - analyst consensus
- - 16%
Construction backlog
11,145 771 7%
Services backlog 19,329 8,895 46%
Airports managed HAH (25%), AGS (50%)
Exchange rate
In 2017 and in the midst of the negotiations between the UK and the European Union, the pound sterling continued its trend of weakness
against the euro, although to a much lesser extent than in 2016 when Brexit was announced. At 31 December 2017, the pound sterling had fallen by 4% compared with the year-ago exchange rate. In order to hedge its foreign currency risk, Ferrovial has arranged hedges with a notional amount of GBP 437 million, which approximately cover the dividends it expects to receive on its UK assets over the next three years.
Inflation and interest rates
The market has lowered its expectations with respect to the future
RPI Retail Price Index by an average of 0.20%, with a level of 3.3%
and a lower actual rate, with interest rates remaining at similar
levels.
Once again the market expectation is for current levels to be maintained, although a negative impact on Brexit would push inflation up and adversely affect the value of pension las obligations and the nominal interest rate, increasing the cost of financing.

204 Ɩ 2017 CONSOLIDATED FINANCIAL STATEMENTS.
FERROVIAL, S.A. AND SUBSIDIARIES
F. NOTES TO THE CONSOLIDATED FINANCIAL STATEMENTS
B
5.5. DERIVATIVE FINANCIAL INSTRUMENTS AT FAIR VALUE
a) Breakdown by type of derivative, changes, expiry dates and main features
The table below includes a detail of the fair values of the derivatives arranged at 31 December 2017 and 2016, as well as the maturities of the notional amounts to which the derivatives relate (maturities of notional amounts are shown as positive figures and already-arranged future increases are presented as negative amounts):
FAIR VALUE NOTIONAL MATURITIES
TYPE OF INSTRUMENT (Millions of euros)
BALANCES AT 31/12/17
BALANCES AT 31/12/16 2018 2019 2020 2021
2022 AND SUBSEQUENT
YEARS TOTAL
ASSET BALANCES 381 450 2,509 21 5 301 62 2,899 Index-linked swaps, Toll Roads 316 321 -2 -3 -1 -4 62 53
Interest rate swaps, Corporate 13 16 0 0 0 250 0 250
Cross-currency swaps, Corporate 0 16 0 0 0 0 0 0
Cross-currency swaps, Broadspectrum 0 82 0 0 0 0 0 0
Equity swaps (*) 1 0 50 0 0 0 0 50 Exchange rate derivatives, Corporate 30 5 2,058 0 0 0 0 2,058
Other derivatives 21 11 403 24 6 55 0 488 Liability balances 452 505 601 263 45 876 287 2,071 Interest rate swaps, Toll Roads 357 399 11 14 16 842 0 883
Cross-currency swaps, Corporate 17 0 0 232 0 0 0 232
Equity swaps (*) 0 4 0 0 0 0 0 0 Cross-currency swaps, Broadspectrum 0 3 0 0 0 0 0 0
Exchange rate derivatives, Corporate 3 6 56 221 0 0 0 277
Other derivatives 75 93 534 27 28 34 287 911 Net balances (liability) -71 -55 3,110 283 50 1,177 350 4,970
The cash flows composing the fair value of the derivatives mature as follows:
FAIR VALUE CASH FLOW MATURITIES
TYPE OF INSTRUMENT (Millions of euros)
BALANCES AT 31/12/17
BALANCES AT 31/12/16 2018 2019 2020 2021
2022 AND SUBSEQUENT
YEARS TOTAL
Asset balances 381 450 60 15 14 15 276 382
Index-linked swaps, Cintra (index-linked derivatives)
316 321 9 10 11 12 275 316
Interest rate swaps, Corporate 13 16 4 4 3 3 0 13
Cross currency swaps, Corporate 0 16 0 0 0 0 0 0
Cross-currency swaps, Broadspectrum
0 82 0 0 0 0 0 0
Equity swaps 1 0 1 0 0 0 0 1
Exchange rate derivatives, Corporate 30 5 30 0 0 0 0 30
Other derivatives 21 11 16 2 1 1 1 21 Liability balances 452 505 58 79 48 43 223 452
Interest rate swaps, Cintra (interest rate derivatives)
357 399 44 42 39 35 196 357
Cross currency swaps, Corporate 17 0 -6 23 0 0 0 17
Equity swaps 0 4 0 0 0 0 0 0
Cross-currency swaps, Broadspectrum
0 3 0 0 0 0 0 0
Exchange rate derivatives, Corporate 3 6 0 3 0 0 0 3
Other derivatives 75 93 21 11 9 7 27 75
Net liability balances -71 -55 2 -64 -34 -27 53 -71
(*) The items indicated are the main derivatives arranged by the Group that do not qualify for hedge accounting, as explained in this Note.
F. NOTES TO THE CONSOLIDATED FINANCIAL STATEMENTS Ɩ 205B
Following is a description of the main types of derivatives and of the most significant changes therein in 2017:
Toll Road Division derivatives
Interest rate swaps, Toll Roads
In order to hedge the interest rate risk in toll road infrastructure projects, the concession holders have arranged interest rate hedges on the
notional amount of EUR 883 million at 31 December 2017. Overall, the fair value of these hedges increased from EUR -399 million at 31 December 2016 to EUR -357 million at 31 December 2017.
In general, since these derivatives are considered to be effective, the changes in their fair value are recognised in reserves, with an impact of EUR 42 million (EUR 31 million attributable to the Parent, after tax and non-controlling interests).
The changes in settlements and accruals gave rise to an impact on the financial result of EUR -45 million and of EUR -46 million in cash.
Index-linked swaps, Toll Roads
This item relates exclusively to Autema, which in 2008 arranged an index linked swap to hedge income variability, by means of which an annual CPI of 2.50% was fixed. This hedge, which was considered effective, had an impact of EUR -5 million on reserves (EUR -3 million after tax attributable to the Parent).
Corporate derivatives
Interest rate swaps, Corporate
In relation to the bond issues launched in 2013, the Group arranged interest rate derivatives for a notional amount of EUR 250 million expiring in 2021. Since they convert a portion of the fixed interest rate on the bonds into a floating interest rate, these derivatives constitute a partial fair value economic hedge of the aforementioned bond issues and they all qualify for hedge accounting. The fair value impact of these bonds on the financial result amounted to EUR 0.4 million.
Cross-currency swaps, Corporate
In September 2016 Ferrovial arranged cross-currency swaps to hedge a drawdown of borrowings in US dollars (see Note 5.2.2). The notional amount of these instruments is USD 279 million (EUR 232 million) and they expire in 2019. The changes in value thereof are recognised in reserves (EUR 0.1 million in 2017), for the interest rate component, and Result on exchange differences, for the foreign currency hedge component (EUR -32 million in 2017).
Equity swaps
Ferrovial has arranged equity swaps in order to hedge against the possible impact on equity resulting from the exercise of the share-based remuneration schemes granted to its employees.

206 Ɩ 2017 CONSOLIDATED FINANCIAL STATEMENTS. FERROVIAL, S.A. AND SUBSIDIARIES
F. NOTES TO THE CONSOLIDATED FINANCIAL STATEMENTS B
The modus operandi of these equity swap contracts is as follows:
• The calculation base is a given number of Ferrovial shares and areference price, which is normally the market price of the share on the grant date.
• For the duration of the contract, Ferrovial pays interest equivalent to agiven interest rate (EURIBOR plus a spread, to be applied to the result of multiplying the number of shares by the exercise price) and receives remuneration equal to the dividends corresponding to those shares.
• When the swap expires, if the share price has increased, Ferrovial will receive the difference between the market price and the reference price. If the share price has fallen, Ferrovial will pay the difference tothe bank.
At 2017 year-end, these derivatives had a notional amount equivalent to 2.7 million shares, which, based on the exercise price of the equity swaps (the price at which they must be settled with the banks), represented a total notional amount of EUR 50 million.
Exchange rate derivatives, Corporate
These derivatives relate to Corporate hedges of foreign currency risk, the main aim of which is to protect against the volatility of future cash
flows in foreign currencies (basically the pound sterling, the Australian dollar, the US dollar, and the Canadian dollar). Their notional value amounted to EUR 2,335 million at 31 December 2017, of which EUR 976 million relate to the Canadian dollar, EUR 552 million relate to the US dollar, EUR 596 million to the Australian dollar, EUR 190 million to the pound sterling and EUR 21 million to the New Zealand dollar. They expire at short term. The changes in their value are recognised as translation differences and amounted to EUR 77 million in 2017 (for effective derivatives). Options, which are not classified as accounting hedges, are recognised in financial results at fair value and in 2017 represented an expense of EUR -16 million.
Derivatives, Services Division
Cross-currency swaps, Broadspectrum
The cross-currency swaps arranged at 2016 year-end hedged mainly fluctuations in the fair value of the High Yield Bonds issued in US dollars by converting this debt into Australian dollars at floating rate. Since this debt was repurchased in May 2017, this derivative was derecognised, giving rise to a variation of EUR 82 million in 2017. In addition, there was a liability balance of another EUR 3 million at December 2016 hedging debt issues denominated in Chilean pesos, which were also derecognised in 2017.
b) Main effects on profit or loss and equity
The changes for accounting purposes in the main derivatives arranged by fully consolidated companies, detailing the fair values thereof at 31 December 2017 and 2016, and the impact on reserves, profit or loss and other statement of financial position items are as follows:
FAIR VALUE IMPACTS
TYPE OF INSTRUMENT (Millions of euros)
BALANCE AT 31/12/17
BALANCE AT 31/12/16 CHANGE
IMPACT ON RESERVES (I)
IMPACT ON PROFIT OR
LOSS DUE TO FAIR VALUE
CHANGES (II)
IMPACT ON FINANCIAL
RESULT (III) IMPACT ON
CASH (IV)
EXCHANGE RATE
EFFECT (V)
OTHER IMPACTS
ON EQUITY OR PROFIT
OR LOSS (VI) TOTAL
Index-linked swaps, Cintra 316 321 -5 -5 0 0 -7 0 7 -5
Interest rate swaps, Cintra -357 -399 42 42 0 -45 46 0 0 42
Interest rate swaps, Corporate 13 16 -4 0 0 0 -4 0 0 -4
Cross currency swaps, Corporate -17 16 -32 0 0 -5 5 0 -32 -32
Cross-currency swaps, Broadspectrum 0 79 -79 9 -10 0 -76 -1 -1 -79
Equity swaps 1 -4 5 0 5 0 3 0 -3 5
Exchange rate derivatives, Corporate 27 -1 28 0 -6 0 -86 77 43 28
Other derivatives -54 -83 29 23 22 -13 -6 48 -44 29
Total -71 -55 -16 69 12 -63 -126 124 -31 -16
Derivatives are recognised at market value at the arrangement date and at fair value at subsequent dates. Changes in the value of these derivatives are recognised for accounting purposes as follows:
• The changes in the year in the fair value of the derivatives designated as cash flow hedges are recognised in reserves (column I).
• The changes in fair value of the derivatives that do not qualify forhedge accounting or that are considered to be held for speculative purposes are recognised as a fair value adjustment in Group profit or loss (column II) and are reflected separately in the statement of profit or loss.
• ects the impacts on the financial result due to financing arising from the interest flows accrued during the year.
• during the year.
• The impact of the difference between closing translation differences at December 2017 and 2016 is also presented separately (column V).
• operations, financial result (exchange rate effect) or other effects not considered in the other columns (column VI).
F. NOTES TO THE CONSOLIDATED FINANCIAL STATEMENTS Ɩ 207B
c) Derivative measurement methods
instruments carried at fair value are included in LEVEL 2 of the fair
value measurement hierarchy, since although they are not quoted
on regulated markets, the inputs on which their fair values are based
are observable, either directly or indirectly.
Although the fair value measurements are performed by the
Company using an internally developed valuation tool based on best
market practices, they are in any event compared with the valuations
received from the counterparty banks on a monthly basis.
Equity swaps are measured as the difference between the market
price of the share on the calculation date and the unit settlement
(strike) price agreed at inception, multiplied by the number of shares
under the contract.
The other instruments are measured by quantifying the net future
cash inflows and outflows, discounted to present value, with the
following specific features:
• Interest rate swaps: the future cash flows with floating reference ratesare estimated by using current market projections at the measurement date for each currency and settlement frequency; and each flow is updated using the market zero-coupon rate that is appropriate for the settlement period and currency in question at the measurement date.
• Index-linked swaps: the future cash flows are estimated by projecting the future behaviour implicit in the market curves on the measurement date for each currency and settlement frequency, forboth reference interest rates and reference inflation rates. As in the cases described above, the flows are discounted using the discount rates obtained at the measurement date for each flow settlement period and currency.
• Cross-currency swaps: the future cash flows with floating reference rates are estimated by using current market projections at the measurement date for each currency and settlement frequency; and
each flow is updated using the market zero-coupon rate that is appropriate for the settlement period and currency in question at the measurement date, including the cross-currency basis spreads. The present value of the flows in a currency other than the measurement currency is translated at the spot exchange rate prevailing at the measurement date.
• Foreign currency derivatives: as a general rule, the future cash flows are estimated by using the exchange rates and market curves associated with each currency pair (forward points curve), and eachflow is updated using the market zero-coupon rate that is appropriate for the settlement period and currency in question at themeasurement date. For other more complex instruments (options, etc.), the valuation models appropriate for each instrument are employed, taking into consideration the necessary market data (volatilities, etc.).
Lastly, credit risk, which is included in the measurement of derivatives pursuant to IFRS 13, is estimated as follows:
• in order to calculate the adjustments associated with own andcounterparty credit risk (CVAs/DVAs), Ferrovial applies amethodology based on calculating the future exposure of thevarious financial products using Monte Carlo simulations. To thispotential exposure, a probability of default and a loss given
y are applied, as well as a discount factor based on the currency and applicable maturity at the measurement date.
• In order to calculate the probabilities of default of the Ferrovial Groupcompanies, the Credit Risk Management department assesses the rating of the counterparty (company, project, etc.) using a proprietary,rating agency-based methodology. This rating is used to obtain market spread curves according to the currency and term in question (generic curves by rating level).
• In order to calculate the probabilities of default of the counterparties, the CDS curves of those companies are used, if available; otherwise, the CDS curves of a similar entity (proxy) or a generic spread curve (by rating level) are used.
208 I 2017 CONSOLIDATED FINANCIAL STATEMENTS. FERROVIAL, S.A. AND SUBSIDIARIES
F. NOTES TO THE CONSOLIDATED FINANCIAL STATEMENTS B
SECTION 6: OTHER DISCLOSURES
This section includes other Notes required under the applicable legislation.
Of particular note due to its importance is Note 6.5, Contingent liabilities and investment commitments, in which the main lawsuits that affect the Group companies are described, with particular emphasis on the guarantees provided by non-infrastructure project companies on behalf of infrastructure project companies.
The changes in liabilities other than current liabilities and borrowings, such as pension obligations (see Note 6.2) and provisions (see Note 6.3), are also analysed.
6.1. Deferred income
million at the end of 2017 (2016: EUR 1,118 million), of which EUR 1,033 million correspond to grants related to assets received from the infrastructure concession grantors, primarily in the Toll Roads Division (EUR 1,012 million) and in the Services Division (EUR 8 million).
Within the Toll Roads Division, these grants are mainly broken down into the following projects: LBJ Infrastructure Group (EUR 399 million); NTE Mobility Partners (EUR 487 million); NTE Mobility Partners Segments 3 LLC (EUR 81 million); and, lastly, I-77 Mobility Partners (EUR 45 million).
The main change in 2017 took place at NTE Mobility Partners Segments 3 and I-77 Mobility Partners, subsidiaries of Cintra in the US, which received additional grants in 2017 amounting to EUR 24 million and EUR 33 million, respectively, offset by a decrease of EUR 74 million and EUR 60 million as a result of the grants being taken to profit or loss in the framework of the NTE Mobility Partners and LBJ Infrastructures projects.
There was also a decrease of EUR 137 million at the US companies due to the depreciation of the US dollar with respect to the euro.
These grants related to assets are recognised in profit or loss over the periods and in the proportions in which depreciation expense on those assets is recognised. The impact of these grants on cash flows is presented as a reduction of cash flows from investing activities.
6.2. Pension plan deficit
This line item reflects the deficit relating to pension and other employee retirement benefit plans, including both defined benefit and defined contribution plans. The provision recognised in the consolidated statement of financial position as at 31 December 2017 amounted to EUR 66 million (31 December 2016: EUR 174 million). Of this amount, EUR 64 million (31 December 2016: EUR 172 million) relate to defined benefit plans of the Amey Group in the UK.
The accompanying table analyses the changdeficit. As the table shows, the main changes relate to the actuarial gains and losses (EUR 76 million) and the contributions made (EUR 39 million).
(Millions of euros) ASSETS LIABILITIES TOTAL
Balances at 31/12/16
944 -1,116 -172
Actuarial gains and losses (recognised in equity)
45 31 76
Contributions 39 0 39
Impact on profit or loss
20 -31 -11
Plan settlement -37 37 0
Exchange rate effect
-38 43 5
Balances at 31/12/17
973 -1,037 -64
The Amey Group has nine defined benefit plans covering a total of 7,968 employees and five defined contribution plans covering 11,389 employees. The most significant changes in 2017 that led to a EUR 108 million reduction in the deficit were as follows:
AMEY GROUP DEFINED BENEFIT PLANS 2017
Actuarial gains and losses 76
Company contributions 39
Impact on profit or loss -11
Exchange rate effect 5
Total changes 108
• An impact of EUR 76 million arising from actuarial gains and losses which reduced the contribution to the pension plan deficit (a decrease in the related liability) recognised in equity. This improvement of EUR 76 million is explained in part from the perspective of obligations (EUR 31 million), broken down into a change in the demographic assumptions (EUR 23 million) and an improvement in future expectations due to lower inflation projections (EUR 26 million) and partially reduced by the worsening in the actuarial assumptions used due to a decrease in the discount rate (EUR -18 million). The actuarial improvement relating to assets (EUR 45 million) was due to the positive performance of the markets associated therewith. More details are provided in section a) of this Note.
• Contributions of EUR 39 million made by the Company to the pension plans, which reduced the pension plan deficit (a decrease in the related liability). The ordinary contributions amounted to EUR 4 million, while the extraordinary contributions aimed at improving the pension plan deficit totalled EUR 35 million.
• A negative impact of EUR -11 million on profit or loss, which increased the pension plan deficit (an increase in the related liability), as detailed in section b) of this Note.
F. NOTES TO THE CONSOLIDATED FINANCIAL STATEMENTS Ɩ 209B
• A positive impact of EUR 5 million due to the exchange rate effect, giving rise to a decrease in the deficit.
Also, although they did not have any effect on the pension plan deficit, there were curtailments and settlements as a result of the payment of obligations to employees, which therefore reduced the related obligation at year-end and gave rise to a reduction of the same amount in the plan assets. In 2017 these curtailments and settlements totalled EUR 37 million.
a) Actuarial gains and losses recognised in reserves
The effects of changes in the actuarial assumptions relating to the defined benefit pension plans of the Amey Group are recognised directly in equity and are summarised (before taxes) in the following table:
AMEY GROUP DEFINED BENEFIT PLANS
2017 2016 (Millions of euros)
Actuarial gains/losses on obligations 31 -256
Actuarial gains/losses on plan assets due to the difference between the expected return at the beginning of the year and the actual return
45 103
Impact on equity recognised 76 -153
The main actuarial assumptions used to calculate the defined benefit pension plan obligations are summarised as follows:
AMEY GROUP DEFINED BENEFIT PLANS
2017 2016 MAIN ASSUMPTIONS
Salary increase 2.40% 2.77%
Discount rate 2.45% 2.65%
Expected inflation rate 3.25% 3.35%
Expected return on assets 2.45% 2.65%
Mortality (years) 87-90 87-91
The mortality assumptions used by the Amey Group to calculate its pension obligations are based on the actuarial mortality tables, with an estimated life expectancy of between 87 and 90 years.
The defined benefit pension plan assets stated at their fair value for 2017 and 2016 are summarised as follows:
AMEY GROUP DEFINED BENEFIT PLANS (Millions of euros) 2017 2016
Plan assets (fair value)
Equity instruments 275 277
Debt instruments 580 563
Buildings 62 62
Cash and other 56 42
Total plan assets 973 944
b) Impact on profit or loss
The detail of the impact of the defined benefit pension plans on profit or loss is as follows:
AMEY GROUP DEFINED BENEFIT PLANS
2017 2016 (Millions of euros)
Impact on profit or loss before tax
Current service cost -4 -4
Interest cost -28 -34
Expected return on plan assets 24 33
Other -3 -2
Total amount recognised in profit or loss
-11 -8
c) Complete actuarial reviews
The Amey Group performs complete actuarial valuations every three years, depending on the plan, having completed the most recent reviews of all the plans in 2016 and 2017.
Based on these reviews, the extraordinary contributions to be made in the coming years have been maintained.
For 2018 the ordinary contributions agreed with the trustees will be EUR 4 million for ordinary contributions and EUR 15 million for extraordinary contributions.
d) Sensitivity analysis
Set forth below is a sensitivity analysis showing the impact on profit or loss and on equity of a change of 50 basis points in the discount rate.
ANNUAL IMPACT ON PROFIT OR LOSS
ANNUAL IMPACT ON EQUITY
AMEY GROUP DEFINED BENEFIT PLANS SENSITIVITY ANALYSIS DISCOUNT RATE (+ / - 50 B.P.)
BEFORE TAX
AFTER TAX
BEFORE TAX
AFTER TAX
+ 50 b.p. 3 2 82 68
- 50 b.p. -2 -2 -95 -79
6.3. Provisions
The provisions recognised by the consolidated Group are intended to cover the risks arising from its various operating activities. They are recognised using the best estimates of the existing risks and uncertainties and their possible evolution.
This Note provi -Term
consolidated statement of financial position. In addition to these items, there are certain impairment losses and allowances that are presented as a reduction of certain asset line items and which are disclosed in the Notes relating to those specific assets.

210 I 2017 CONSOLIDATED FINANCIAL STATEMENTS. FERROVIAL, S.A. AND SUBSIDIARIES
F. NOTES TO THE CONSOLIDATED FINANCIAL STATEMENTS B
The changes in the long- and short-term provisions presented separately under liabilities in the consolidated statement of financial position were as follows:
(Millions of euros)
PROVISION FOR
LANDFILLS
PROVISION FOR
COMPULSORY
PURCHASES
PROVISION FOR REPLACEMENTS AND UPGRADES
PURSUANT TO IFRIC 12
PROVISIONS FOR LITIGATION AND
TAXES
PROVISIONS FOR OTHER LONG-
TERM RISKS
TOTAL LONG-TERM
PROVISIONS SHORT-TERM
PROVISIONS TOTAL
Balance at 31 December 2016
124 29 109 415 79 757 702 1,459
Transition to IFRS 15 0 0 0 43 0 43 -17 26
Changes in the scope of consolidation and transfers
-2 -4 0 29 6 30 12 42
Charges for the year: 13 0 30 17 13 72 232 304
Gross profit from operations 9 0 0 10 13 32 232 264
Financial result 4 0 5 6 0 15 0 16
Impairment and disposals of non-current assets 0 0 0 0 0 0 0 0
Income tax 0 0 0 0 0 0 0 0
Depreciation and amortisation charge 0 0 24 0 0 24 0 24
Reversals: -1 0 -5 -32 -4 -42 -157 -199
Gross profit from operations -1 0 0 -32 -4 -37 -157 -194
Financial result 0 0 0 0 0 0 0 0
Impairment and disposals of non-current assets 0 0 0 0 0 0 0 0
Income tax 0 0 0 0 0 0 0 0
Depreciation and amortisation charge 0 0 -4 0 0 -4 0 -4
Amounts used recognised in current assets or liabilities
-4 0 0 -25 -8 -37 -144 -181
Amounts used recognised in other assets
0 0 -7 0 0 -7 0 -7
Exchange differences 0 0 -2 -4 -1 -7 1 -6
Balance at 31 December 2017
130 25 126 443 84 808 629 1,437
The table above shows the changes in the year by detailing separately, on the one hand, the charges for the year and reversals that had an impact on the different lines in the consolidated statement of profit or loss and, on the other, other changes which did not have an impact thereon, such as changes in the scope of consolidation and transfers, amounts used recognised in different headings in the consolidated statement of financial position and exchange rate effect.
In this regard, on analysing the effect on the consolidated statement of profit or loss, mention should be made of the net charge (expense) of EUR (70) million with an impact on gross profit from operations, as well as EUR 181 million relating to amounts used recognised in current assets or liabilities. The sum of both figures is consistent with the EUR 111 million allocated for the purpose of working capital in cash flows (see Note 5.3).
Also, as explained in Note 1.1.3, the impact of the transition to IFRS 15 gave rise to a EUR 26 million increase in the Group's provisions, relating mainly to the Services business.
Provision for landfills
and post-closure activities relating to the landfills operated by the Ferrovial Services business in Spain and UK. The provision is calculated based on a technical estimate of the consumption to date of the total capacity of the respective landfills. This provision is recognised and reversed with a charge/credit, respectively, to changes in provisions within gross profit from operations in the consolidated statement of profit or loss, as the costs required for closure of the landfill are incurred.
Provision for compulsory purchases
The provision for compulsory purchases recognised by the Spanish toll roads, totalling EUR 25 million (31 December 2016: EUR 29 million). This provision is charged against the concession infrastructure as the costs are incurred over the concession term.
Provision for replacements and upgrades pursuant to IFRIC 12
This line item includes the provisions for investments in replacements established by IFRIC 12 (see Note 1.3.3.2). The balance of this heading increased by EUR 17 million from EUR 109 million at December 2016 to EUR 126 million at 31 December 2017. This provision is recognised and reversed with a charge/credit, respectively, to the depreciation and amortisation charge over the period in which the obligations accrue, until the replacement becomes operational.
Provisions for litigation and tax claims
The provisions for litigation amount to EUR 443 million (31 December 2016: EUR 415 million). This line item includes:
• Provisions to cover the possible risks resulting from litigation inprogress, amounting to EUR 189 million (31 December 2016: EUR 168 million), of which EUR 94 million (31 December 2016: EUR 121 million) relate to the construction business and EUR 91 million (31 December2016: EUR 42 million) relate to litigation of the Services business, the details of which are provided in Note 6.5. to these consolidated financial statements. These provisions are recognised and reversed with a charge/credit, respectively, to changes in provisions within gross profit from operations.
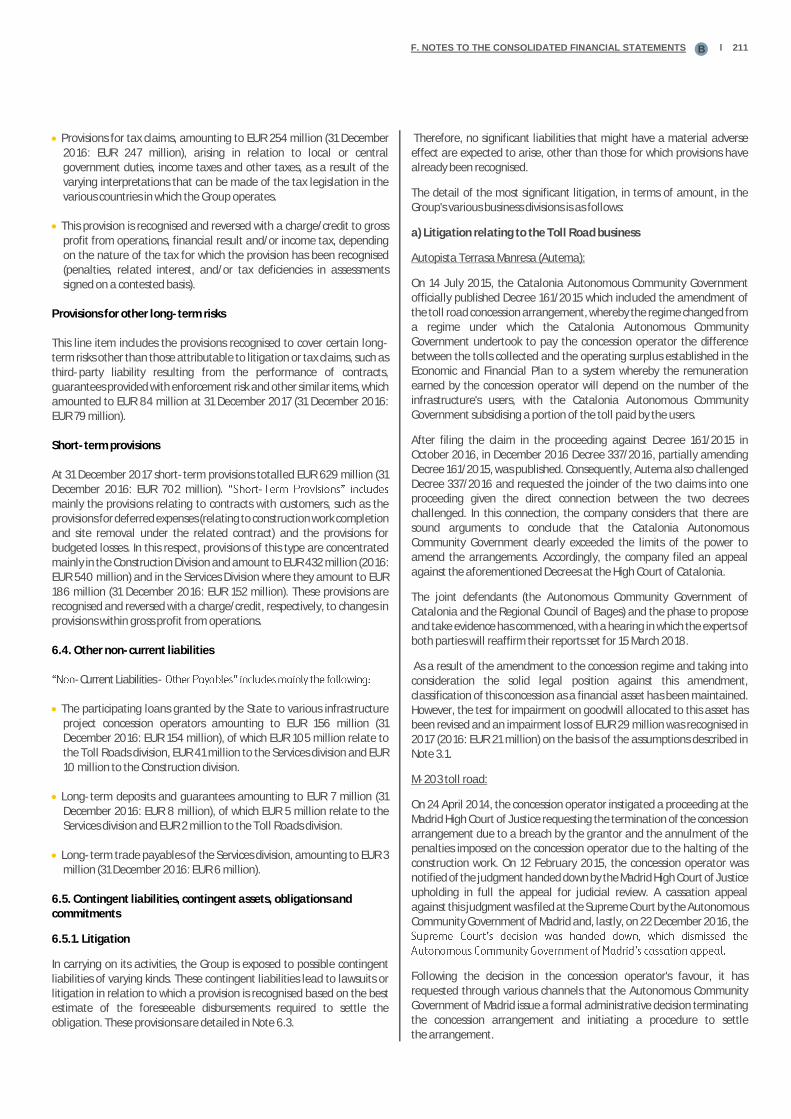
F. NOTES TO THE CONSOLIDATED FINANCIAL STATEMENTS Ɩ 211B
• Provisions for tax claims, amounting to EUR 254 million (31 December 2016: EUR 247 million), arising in relation to local or central government duties, income taxes and other taxes, as a result of thevarying interpretations that can be made of the tax legislation in thevarious countries in which the Group operates.
• This provision is recognised and reversed with a charge/credit to gross profit from operations, financial result and/or income tax, depending on the nature of the tax for which the provision has been recognised (penalties, related interest, and/or tax deficiencies in assessments signed on a contested basis).
Provisions for other long-term risks
This line item includes the provisions recognised to cover certain long-term risks other than those attributable to litigation or tax claims, such as third-party liability resulting from the performance of contracts, guarantees provided with enforcement risk and other similar items, which amounted to EUR 84 million at 31 December 2017 (31 December 2016: EUR 79 million).
Short-term provisions
At 31 December 2017 short-term provisions totalled EUR 629 million (31 December 2016: EUR 702 million) -mainly the provisions relating to contracts with customers, such as the provisions for deferred expenses (relating to construction work completion and site removal under the related contract) and the provisions for budgeted losses. In this respect, provisions of this type are concentrated mainly in the Construction Division and amount to EUR 432 million (2016: EUR 540 million) and in the Services Division where they amount to EUR 186 million (31 December 2016: EUR 152 million). These provisions are recognised and reversed with a charge/credit, respectively, to changes in provisions within gross profit from operations.
6.4. Other non-current liabilities
-Current Liabilities -
• The participating loans granted by the State to various infrastructureproject concession operators amounting to EUR 156 million (31 December 2016: EUR 154 million), of which EUR 105 million relate tothe Toll Roads division, EUR 41 million to the Services division and EUR 10 million to the Construction division.
• Long-term deposits and guarantees amounting to EUR 7 million (31December 2016: EUR 8 million), of which EUR 5 million relate to the Services division and EUR 2 million to the Toll Roads division.
• Long-term trade payables of the Services division, amounting to EUR 3million (31 December 2016: EUR 6 million).
6.5. Contingent liabilities, contingent assets, obligations and commitments
6.5.1. Litigation
In carrying on its activities, the Group is exposed to possible contingent liabilities of varying kinds. These contingent liabilities lead to lawsuits or litigation in relation to which a provision is recognised based on the best estimate of the foreseeable disbursements required to settle the obligation. These provisions are detailed in Note 6.3.
Therefore, no significant liabilities that might have a material adverse effect are expected to arise, other than those for which provisions have already been recognised.
The detail of the most significant litigation, in terms of amount, in the Group's various business divisions is as follows:
a) Litigation relating to the Toll Road business
Autopista Terrasa Manresa (Autema):
On 14 July 2015, the Catalonia Autonomous Community Government officially published Decree 161/2015 which included the amendment of the toll road concession arrangement, whereby the regime changed from a regime under which the Catalonia Autonomous Community Government undertook to pay the concession operator the difference between the tolls collected and the operating surplus established in the Economic and Financial Plan to a system whereby the remuneration earned by the concession operator will depend on the number of the infrastructure's users, with the Catalonia Autonomous Community Government subsidising a portion of the toll paid by the users.
After filing the claim in the proceeding against Decree 161/2015 in October 2016, in December 2016 Decree 337/2016, partially amending Decree 161/2015, was published. Consequently, Autema also challenged Decree 337/2016 and requested the joinder of the two claims into one proceeding given the direct connection between the two decrees challenged. In this connection, the company considers that there are sound arguments to conclude that the Catalonia Autonomous Community Government clearly exceeded the limits of the power to amend the arrangements. Accordingly, the company filed an appeal against the aforementioned Decrees at the High Court of Catalonia.
The joint defendants (the Autonomous Community Government of Catalonia and the Regional Council of Bages) and the phase to propose and take evidence has commenced, with a hearing in which the experts of both parties will reaffirm their reports set for 15 March 2018.
As a result of the amendment to the concession regime and taking into consideration the solid legal position against this amendment, classification of this concession as a financial asset has been maintained. However, the test for impairment on goodwill allocated to this asset has been revised and an impairment loss of EUR 29 million was recognised in 2017 (2016: EUR 21 million) on the basis of the assumptions described in Note 3.1.
M-203 toll road:
On 24 April 2014, the concession operator instigated a proceeding at the Madrid High Court of Justice requesting the termination of the concession arrangement due to a breach by the grantor and the annulment of the penalties imposed on the concession operator due to the halting of the construction work. On 12 February 2015, the concession operator was notified of the judgment handed down by the Madrid High Court of Justice upholding in full the appeal for judicial review. A cassation appeal against this judgment was filed at the Supreme Court by the Autonomous Community Government of Madrid and, lastly, on 22 December 2016, the
Following the decision in the concession operator's favour, it has requested through various channels that the Autonomous Community Government of Madrid issue a formal administrative decision terminating the concession arrangement and initiating a procedure to settle the arrangement.

212 Ɩ 2017 CONSOLIDATED FINANCIAL STATEMENTS. FERROVIAL, S.A. AND SUBSIDIARIES
F. NOTES TO THE CONSOLIDATED FINANCIAL STATEMENTS B
Lastly, by means of the Order of the Regional Minister for Transport, Infrastructure and Housing of the Autonomous Community Government of Madrid, the Autonomous Community Government of Madrid terminated the concession arrangement. The company is waiting for the Autonomous Community Government of Madrid to: (i) take possession of the construction work; (ii) return the bank guarantees provided as a definitive guarantee; (iii) be subrogated to the compulsory purchase proceedings; and (iv) pay the compensation for the investments made and the damage and losses suffered. This should take place within six months of the date of the aforementioned Order.
As a result of the termination of the concession arrangement, at 31 December 2017 the company reclassified the carrying amount of the asset (EUR 61 million) as an account receivable from the grantor (see Note 3.6).
AP 36 Ocaña - La Roda and Radial 4 toll roads
With respect to the insolvency proceeding of the AP 36 toll road, the company is currently being liquidated. On 14 December 2017, the insolvent parties were served the liquidation plans submitted by the insolvency managers to the judge overseeing the insolvency proceeding, which have not yet been approved.
The insolvency proceeding of the Radial 4 toll road has been in the liquidation phase since 10 May 2017. In September 2017 the insolvency managers filed the liquidation plans, which were approved in an order handed down on 24 October 2017. At the end of 2017 the grantor (Ministry of Public Works) commenced proceedings to terminate the two concession arrangements in relation to which both the insolvency managers and various creditors made submissions. With respect to the Radial 4 toll road, while the Ministry of Public Works is yet to issue a decision in relation to these submissions and definitively terminate the concession arrangement, provisional measures have been adopted that enabled SEITTSA, the public company that will take control of various toll road concession arrangements, to take control of the asset on 21 February 2018.
Furthermore, in relation to the Radial 4 toll road, the decision is yet to be handed down in a lawsuit at the Supreme Court brought by the lenders of the company against its shareholders relating to a guarantee amounting to EUR 14.9 million (in the portion attributable to Ferrovial). Although the decisions handed down previously at first instance and on appeal ruled in
contingency at 31 December 2017.
These companies were excluded from the scope of consolidation in 2015, since the circumstances indicating loss of control were evident: there is no exposure to variable returns from the involvement with the investees and there is no ability to direct the relevant activities of the investees. The performance since then has confirmed the policy applied at that time.
b) Litigation relating to the Construction business
The Group's Construction Division is involved in various lawsuits relating primarily to possible defects in the construction of completed projects and claims for third-party liability.
The provisions recognised in relation to these risks at 31 December 2017 totalled EUR 94 million (2016: EUR 121 million) and relate to a total of approximately 110 lawsuits. The most significant litigation, in terms of amount, in this business area is as follows:
• Muelle del Prat: this corresponds to a claim relating to the construction project for the new container terminal at the Port of Barcelona. Thework was performed by Ferrovial Agroman as part of an
unincorporated temporary joint venture (UTE) with other companies. The claim -for an amount of EUR 97 million- was lodged by the Port of Barcelona in September 2011 against all the companies involved in the performance of the project and arose as a result of the damage caused by an accident during construction work. A judgment was handed down in 2013 partially upholding the claim filed by the customer, ordering the defendants jointly and severally to pay EUR 20.9 million plus interest. In the first six months of 2014 the insurance companies partially covered the payment of the aforementioned judgment. On 16 March 2016, the Barcelona Provincial Appellate Court handed down a decision ruling in favour of the defendants and dismissing in full the claim lodged by the Barcelona Port Authority; the Port Authority has lodged a cassation appeal against this ruling, in relation to which a decision has not yet been handed down.
• Arbitration in relation to the construction project for Warsaw airport: This corresponds to a claim filed against the UTE formed by Ferrovial Agroman and Budimex in relation to the termination of the contract to construct Terminal 2 of Warsaw Airport. In 2007 the customer enforced a guarantee amounting to EUR 13.5 million and brought a claimagainst the construction joint venture. In turn, the construction joint venture brought a counterclaim against the customer in relation to the illegal enforcement of the guarantee and uncollected amounts; the net amount of these mutually submitted claims is EUR 18.9 million infavour of the construction joint venture. In September 2012, after thefavourable award of the Arbitration Court (confirmed in 2013 by the Supreme Court), the customer returned the enforced guarantee and paid the interest accrued from when the guarantee was enforced.
The deadline established by the Arbitration Court for each party to submit pleadings to defend their claims and to assess the evidence taken to continue with the arbitration is February 2018. In this regard, the expert evidence taken addressed, on the one side, the technical
-Poland Port Authority- unilateral termination of the contract and, on the other, the evidence supporting the amounts claimed as amounts outstanding for work performed and damage and losses, which has yet to be taken.
The company expects the arbitration to be resolved in 2019, but does not rule out a partial arbitral award being issued in the interim. In any event, the account receivable has not been written down since the company considers that the resolution of the arbitration proceeding
claims.
• Construction work relating to the SH-130 toll road in Texas: Thecompany operating segments 5 and 6 of the SH-130 toll road located between Austin and San Antonio in Texas (US) brought a claim tosubmit to arbitration a dispute with the Ferrovial Agroman investee Central Texas Highway Contractors, LLC, which built the toll road, and with Zachry Industrial, INC. and Ferrovial Agroman, S.A. as several guarantors on a pro rata basis of the former. The arbitration claim is related to the contract for the design and construction of segments 5 and 6 of the SH-130 toll road entered into in 2007. The concession
it considers to amount to at least USD 130 million, of which 50% (USD 65 million) would be attributable to the ownership interest of Ferrovial Agroman, which would not be jointly and severally liable for the ownership interest of the other shareholder.
Although the process is in an initial phase and the company has not had
advisers consider that the construction work on the toll road was

F. NOTES TO THE CONSOLIDATED FINANCIAL STATEMENTS Ɩ 213B
performed in accordance with the provisions of the contract and industry best practices and that, in any case, any potential liability arising from the litigation's resolution could be reduced by various facts, such as:
• The construction company is covered by an insurance contract;
• The liability for the alleged defects should fall to the companiessubcontracted by the construction company for both the design andconstruction of the road surface; and
• The Texas Department of Transportation and the concession operator appear to have reached an agreement to perform the workto repair the defects for USD 60 million, which is less than 50% of the amount claimed.
• Based on the foregoing, it was concluded that at year-end it was notnecessary to recognise a provision in addition to the USD 10 millionthat the company has already recognised in connection withdeferred expenses relating to the guarantee of the construction workperformed in this project.
• Arbitration relating to the Cerrejón project in Colombia: On 24 July2017, Ferrovial Agroman was served notice of the arbitral award relating to a dispute concerning the construction work of a port for themining company Cerrejón. The construction consortium in which Ferrovial Agroman held an ownership interest of 50% was ordered to pay compensation of EUR 31 million. Since the consortium was jointly and severally liable and the Colombian partner with which FerrovialAgroman participated therein was involved in insolvency proceedings, Ferrovial Agroman had to pay all of the compensation and recognised a loss for the aforementioned amount that ultimately gave rise to anoutflow of cash.
The arbitration was instigated as a result of the termination of the contract requested by the construction consortium in February 2013
on the legal reports available, it was initially considered that the construction consortium had a very sound case and, therefore, no provision was recognised in relation to the arbitration.
In the arbitral award, one of the arbitrators expressed a dissenting opinion and argued that the decision contravened Colombian law and the evidence submitted during the process. The construction consortium brought an appeal to set aside the arbitral award at the Supreme Court of Colombia in relation to which a decision has not yet been handed down.
c) Litigation relating to the Services business
The provisions relating to the Services division totalled EUR 91 million at 2017 year-end (2016 year-end: EUR 42 million). The main lawsuits in progress are as follows:
Regarding the Services business in the UK:
• The main lawsuit in which the company was involved at 31 December 2017 related to the long-term contract entered into by Amey and Birmingham City Council for the rehabilitation and subsequent maintenance and replacement of certain infrastructure in the city up to 2035. On 5 September 2016 a court decision was handed down
parties, although the other party requested permission for the case to be heard at the appeal court.
The disputed matters refer to the scope (Project Network Model and Pavement Management Model) of the construction work performed in
achievement of milestones 6 to 9 in the performance of the aforementioned work, which were initially approved by the City
certain amounts of consideration for achieving the aforementioned milestones.
During 2017 the company was involved in negotiations with Birmingham City Council to reach an out-of-court settlement, although the Council filed an appeal at the appeal court and the negotiations were finally suspended. On 22 February 2018, the appeal court found against Amey in relation to all the matters and the company intends to appeal against the decision at the Supreme Court.
At the reporting date the company was assessing the impact that might arise from the outcome of the judgment and had recognised provisions to cover the contingency of the project amounting to GBP 74.4 million, of which GBP 37.9 million relate to the provision recognised in relation to this lawsuit in 2016 and GBP 36.5 million to the portion of the adjustment due to first-time application of IFRS 15 as a result of considering that certain amounts relating to the achievement of milestones 6 to 9 (initially recognised as revenue) did not meet the requirements of that standard at 31 December 2016 since recognition was dependent on the appeal by Birmingham City Council against the judgment of September 2016.
• The Services business in the UK also received notification of claims by Aggregate Industries, the subcontractor in the Sheffield contract, amounting to GBP 32 million. Of this amount, GBP 21 million relatemainly to claims for delays and additional costs due to the sequence in which the works were executed, and GBP 11 million relate to the new estimates of the work performed. The Group considers that a significant portion of the claim made by the subcontractor, particularly in relationto the first items, has not been proven by Aggregate Industries, which has suspended the claim because it is recalculating the amounts, and it may reactivate it in the coming months. The Group considers that this contingency has been correctly provided for at year-end.
Regarding the Services business in Spain:
• The Group was involved in a lawsuit in December 2017 in relation to aresolution of the Spanish National Markets and Competition Commission (CNMC) imposing a penalty on the Group companies Cespa, S.A. and Cespa, G.R. and other companies from the waste management and urban cleaning industry for participating in a marketshare agreement. The penalty imposed on Cespa, S.A. and Cespa, G.R.amounted to EUR 14 million.
The National Appellate Court announced the judgment on 27 February which upheld in full the appeal lodged by Cespa, considering that there were no grounds for accusing it of participating in a cartel of this type. Since the appeal was upheld in full, the judgment imposed costs on the authorities. The judgment is not final and the Spanish government lawyers may prepare a cassation appeal against it within 30 days. The Group had decided not to recognise any type of provision in this connection since the company's legal advisers considered that there were robust arguments to challenge the resolution by the CNMC.
• In addition, through the company Empresa de Mantenimiento y Explotación M-30, S.A. (Emesa) in which it holds a 50% ownership interest, the Group executes the maintenance contract for the M-30 infrastructure and holds a 20% ownership interest in the semi-private

214 Ɩ 2017 CONSOLIDATED FINANCIAL STATEMENTS. FERROVIAL, S.A. AND SUBSIDIARIES
F. NOTES TO THE CONSOLIDATED FINANCIAL STATEMENTS B
company, Madrid Calle 30, the concession operator for that infrastructure. In 2017 Madrid City Council, another shareholder of Madrid Calle 30, set up a municipal investigation committee, whose main recommendations affecting the Group are to reverse the management model of Madrid Calle 30 to the original model of a 100% municipal company, and request the competent Council bodies to study who should be responsible for paying the electricity supply,
opinion, there are arguments to justify that the electricity supply should be paid by Madrid Calle 30 and not by Emesa. In addition, if the concession arrangement is terminated early, under the arrangement's specifications, Emesa's shareholders would recover the value of the participating loans granted to this company and Emesa would recover the value of the ownership interest in Madrid Calle 30, together with the subordinated loan granted to this company. It should also be noted that Emesa has filed an appeal for judicial review against the resolution by the City Council that approved the investigation committee's report, and the appeal has been admitted for consideration. Accordingly, the Group has not recognised a provision in this connection.
• Also, through Ecoparc de Can Mata, S.L.U., the Group has a contract for the construction and operation of a waste treatment centre. In 2017 notification was received from the granting body of the initiation of a proceeding to claim EUR 15.6 million in payments and penalties due to discrepancies regarding the waste recovery percentages and refuse dumping and in relation to the regularisation of the payments made on the basis of the remuneration formulas provided for in the contract. The granting body has also issued a resolution that the billing method to be used from now on should meet the requirements used by it in the proceeding. The Group has filed an appeal against the payments and penalties as well as against the resolution obliging billing to be performed in accordance with the imposed criteria. In the opinion of
amounts will have to be paid is considered to be remote and, therefore, the Group decided not to recognise a provision in this connection.
d) Tax litigation
Ferrovial is involved in various tax-related claims, mainly in relation to tax audits in Spain. The most significant claims relate to income tax and VAT for 2002 to 2013 and amount to EUR 311 million. Although the company considers that it has sound arguments to defend its position, it has recognised provisions to partially cover the contingencies in this connection amounting to EUR 254 million, as indicated in Note 6.3.
These claims include the claim relating to the amortisation for tax purposes of financial goodwill arising on the acquisition of foreign companies. Ferrovial has lodged an appeal against the European
ssifying this tax measure as state aid. Although the core issue has yet to be resolved, in 2017 the tax authorities ordered the recovery of the amortisation recognised between 2006 and 2015, and requested the payment of EUR 37 million which included EUR 8 million of late-payment interest. An account receivable from the tax authorities was recognised as a balancing entry to this payment since it was considered that these
handed down in relation to the appeal. It is important to note that the company has recognised deferred tax liabilities in relation to the goodwill forming the subject-matter of this lawsuit in order to pay a possible refund of the amounts deducted in this regard amounting to EUR 114 million (see Note 2.8.3).
e) Other litigation
In addition to the litigation discussed above, of particular note is the Group continuing to maintain its contractual position vis-à-vis certain tax claims that had been filed by Promociones Habitat, S.A., which was sold by Ferrovial Fisa, S.L. in 2016. These claims are currently pending resolution or payment and a provision for the amount thereof has been duly recognised in the consolidated financial statements.
6.5.2. Guarantees
a) Bank guarantees and other guarantees provided byinsurance companies
In carrying on its activities the Group is subject to possible contingent liabilities -uncertain by nature- relating to the liability arising from the performance of the various contracts that constitute the activity of its business divisions.
In order to cover the aforementioned liability, the Group has bank guarantees and other guarantees issued by insurance companies. At 31 December 2017, the balance amounted to EUR 7,472 million (2016: EUR 5,944 million).
The following table contains a breakdown of the risk covered in each business area.
(Millions of euros) 2017 2016
Construction 4,848 4,006
Toll roads 1,165 498
Services 1,109 1,180
Airports 90 7
Other 261 253
TOTAL 7,472 5,944
The increase in these guarantees is due mainly to the guarantees to cover the capital commitments relating to the 166 toll road and to the guarantees granted by bonding agencies in construction contracts in the US.
The EUR 7,472 million, by type of instrument, relate to: i) EUR 3,677 million of bank guarantees; ii) EUR 977 million of guarantees provided by insurance companies; and iii) EUR 2,818 million of performance bonds provided by bonding agencies.
These guarantees cover the liability to customers for correct performance in construction or services contracts involving Group companies. Thus, if a project was not performed the customer would enforce the guarantee.
Despite the significant amount of these guarantees, the impact that might arise on the consolidated financial statements is very low, since the Group companies perform contracts in accordance with the terms and conditions agreed upon with the customers and recognise provisions within the results of each contract for risks that might arise from performance thereof (see Note 6.3).
Lastly, of the total amount of the Group's bank guarantees listed in the above table, EUR 948 million (see Note 6.5.3.) secure its commitments to invest in the capital of infrastructure projects.
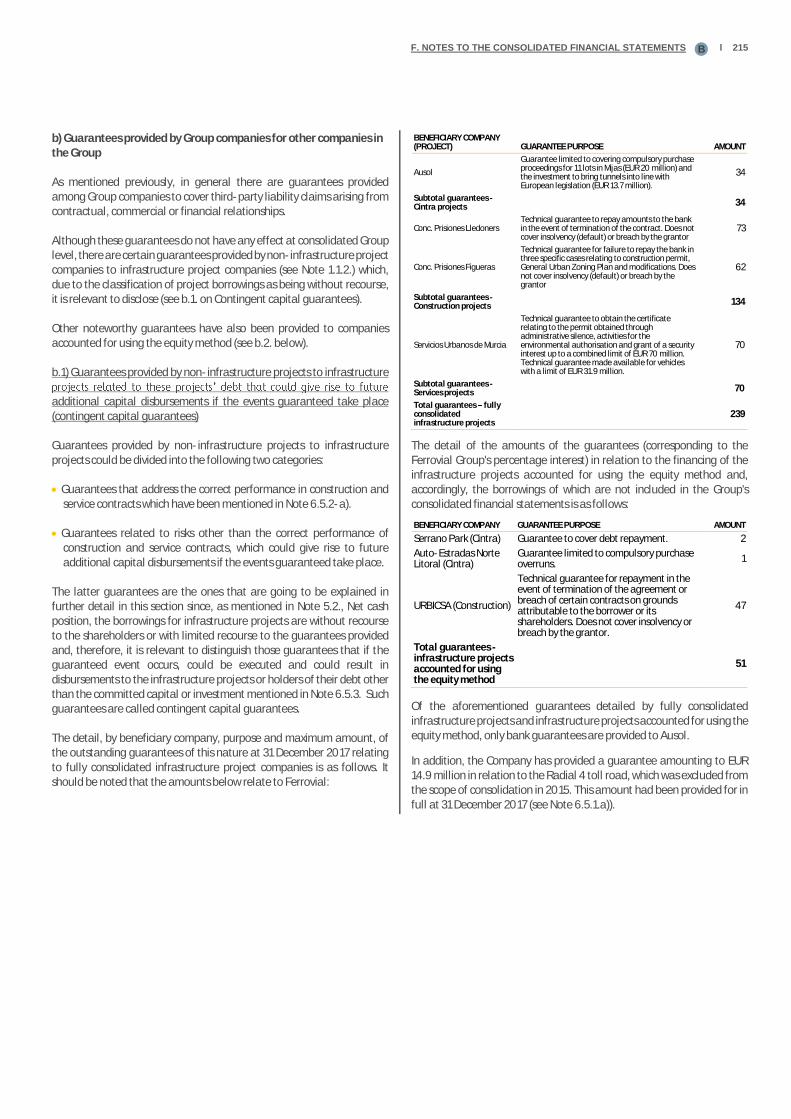
F. NOTES TO THE CONSOLIDATED FINANCIAL STATEMENTS Ɩ 215B
b) Guarantees provided by Group companies for other companies in the Group
As mentioned previously, in general there are guarantees provided among Group companies to cover third-party liability claims arising from contractual, commercial or financial relationships.
Although these guarantees do not have any effect at consolidated Group level, there are certain guarantees provided by non-infrastructure project companies to infrastructure project companies (see Note 1.1.2.) which, due to the classification of project borrowings as being without recourse, it is relevant to disclose (see b.1. on Contingent capital guarantees).
Other noteworthy guarantees have also been provided to companies accounted for using the equity method (see b.2. below).
b.1) Guarantees provided by non-infrastructure projects to infrastructure
additional capital disbursements if the events guaranteed take place (contingent capital guarantees)
Guarantees provided by non-infrastructure projects to infrastructure projects could be divided into the following two categories:
• Guarantees that address the correct performance in construction and service contracts which have been mentioned in Note 6.5.2-a).
• Guarantees related to risks other than the correct performance of construction and service contracts, which could give rise to future additional capital disbursements if the events guaranteed take place.
The latter guarantees are the ones that are going to be explained in further detail in this section since, as mentioned in Note 5.2., Net cash position, the borrowings for infrastructure projects are without recourse to the shareholders or with limited recourse to the guarantees provided and, therefore, it is relevant to distinguish those guarantees that if the guaranteed event occurs, could be executed and could result in disbursements to the infrastructure projects or holders of their debt other than the committed capital or investment mentioned in Note 6.5.3. Such guarantees are called contingent capital guarantees.
The detail, by beneficiary company, purpose and maximum amount, of the outstanding guarantees of this nature at 31 December 2017 relating to fully consolidated infrastructure project companies is as follows. It should be noted that the amounts below relate to Ferrovial:
BENEFICIARY COMPANY (PROJECT) GUARANTEE PURPOSE AMOUNT
Ausol
Guarantee limited to covering compulsory purchase proceedings for 11 lots in Mijas (EUR 20 million) and the investment to bring tunnels into line with European legislation (EUR 13.7 million).
34
Subtotal guarantees - Cintra projects 34
Conc. Prisiones Lledoners Technical guarantee to repay amounts to the bank in the event of termination of the contract. Does not cover insolvency (default) or breach by the grantor
73
Conc. Prisiones Figueras
Technical guarantee for failure to repay the bank in three specific cases relating to construction permit, General Urban Zoning Plan and modifications. Does not cover insolvency (default) or breach by the grantor
62
Subtotal guarantees - Construction projects 134
Servicios Urbanos de Murcia
Technical guarantee to obtain the certificate relating to the permit obtained through administrative silence, activities for the environmental authorisation and grant of a security interest up to a combined limit of EUR 70 million. Technical guarantee made available for vehicles with a limit of EUR 31.9 million.
70
Subtotal guarantees - Services projects 70
Total guarantees fully consolidated infrastructure projects
239
The detail of the amounts of the guarantees (corresponding to the Ferrovial Group's percentage interest) in relation to the financing of the infrastructure projects accounted for using the equity method and, accordingly, the borrowings of which are not included in the Group's consolidated financial statements is as follows:
BENEFICIARY COMPANY GUARANTEE PURPOSE AMOUNT
Serrano Park (Cintra) Guarantee to cover debt repayment. 2
Auto-Estradas Norte Litoral (Cintra)
Guarantee limited to compulsory purchase overruns.
1
URBICSA (Construction)
Technical guarantee for repayment in the event of termination of the agreement or breach of certain contracts on grounds attributable to the borrower or its shareholders. Does not cover insolvency or breach by the grantor.
47
Total guarantees - infrastructure projects accounted for using the equity method
51
Of the aforementioned guarantees detailed by fully consolidated infrastructure projects and infrastructure projects accounted for using the equity method, only bank guarantees are provided to Ausol.
In addition, the Company has provided a guarantee amounting to EUR 14.9 million in relation to the Radial 4 toll road, which was excluded from the scope of consolidation in 2015. This amount had been provided for in full at 31 December 2017 (see Note 6.5.1.a)).

216 Ɩ 2017 CONSOLIDATED FINANCIAL STATEMENTS. FERROVIAL, S.A. AND SUBSIDIARIES
F. NOTES TO THE CONSOLIDATED FINANCIAL STATEMENTS B
b.2) Other guarantees provided to companies accounted for using theequity method other than infrastructure project companies
Certain construction and services contracts are performed by companies accounted for using the equity method often created specifically to perform contracts previously awarded to their shareholders. In these cases, the shareholders of those companies provide performance bonds relating to those contracts. The liability secured is similar to that indicated in Note 6.5.2.a.
Notable in this respect are the performance bonds provided by the Services Division for various companies accounted for using the equity method totalling EUR 1,417 million, of which the most significant are those relating to contracts for the UK Ministries of Defence and Justice. It should be noted that the aforementioned amount corresponds to the
percentage of ownership.
c) Assets pledged as collateral
The assets pledged as collateral are described in the Notes as follows:
• Pledges of property, plant and equipment, see Note 3.4.
• Pledges of deposits or restricted cash, see Note 5.2.
d) Guarantees received from third parties
At 31 December 2017, Ferrovial had received guarantees from third parties totalling EUR 1,049 million (31 December 2016: EUR 1,056 million), mainly in the Construction Division in the Ferrovial Agroman companies in the United States (EUR 836 million), the Budimex Group (EUR 114 million) and other construction companies (EUR 106 million).
These guarantees received from third parties relate to technical performance bonds whereby certain subcontractors or suppliers in the Construction business guarantee full performance of their contractual obligations relating to the construction work they are engaged to carry out, and cannot be sold or pledged.
6.5.3. Obligations and commitments
As described in Note 1.1, the infrastructure projects carried out by the Group are performed through long-term contracts where the concession operator is a company in which the Group has interests, either alone or together with other partners, and the borrowings necessary for financing the project are allocated to the project itself, without recourse to the shareholders or with recourse limited to the guarantees provided, under the terms set forth in Note 5.2. From the management viewpoint, therefore, Ferrovial takes into account only the investment commitments relating to the capital of the projects, since the investment in the assets is financed by the borrowings of the projects themselves.
The investment commitments of the Group in relation to the capital of its projects are as follows:
(Millions of euros) 2018 2019 2020 2021 2022
2023 AND SUBSEQUENT
YEARS TOTAL
Toll roads 146 2 0 20 0 0 168
Airports 1 0 18 0 0 30 49
Investments in fully consolidated infrastructure projects
147 2 20 20 3 30 217
Toll roads 14 7 316 237 144 0 719
Services 32 0 0 0 0 0 32
Construction 0 0 0 0 0 0 1
Investments in infrastructure projects accounted for using the equity method
46 7 316 237 144 0 751
Total investments infrastructure projects
193 10 334 256 144 30 968
At 31 December 2017, the investment commitments amounted to EUR 968 million (2016: EUR 1,074 million). This decrease is due mainly to the investments made in US toll road projects in 2017 and the reduced investment commitments relating to the I66 toll road following the financial close (the capital committed to our ownership interest of 50% amounts to EUR 633 million compared to the EUR 723 million estimated in 2016 prior to the financial close).
As indicated in 6.5.2-a), a portion of these commitments, amounting to EUR 948 million, are secured by bank guarantees. The aforementioned amount includes EUR 34 million which are also included in the guarantees mentioned in 6.5.2.b.1), Contingent capital guarantees and which relate to Ausol. It should be noted that only these EUR 34 million were included as investment commitments because an outflow of resources of the other contingent capital relating to other projects as indicated in b.1 above was considered to be unlikely.
In relation to the I-77 toll road project, Ferrovial is guaranteeing the investment commitments of another shareholder amounting to EUR 61 million. In return for providing this guarantee, if the shareholder fails to make the related disbursements, its ownership interest will be diluted in proportion to the disbursements not made.
There are also property, plant and equipment purchase commitments in the Services Division totalling EUR 102 million (2016: EUR 121 million) which relate mainly to the acquisition of machinery or the construction of treatment plants, and EUR 15 million (2016: EUR 5 million) relating mainly to the purchase of two waste treatment companies in Poland and a logistics company in Spain. The schedule of the commitments of the Services Division is as follows:
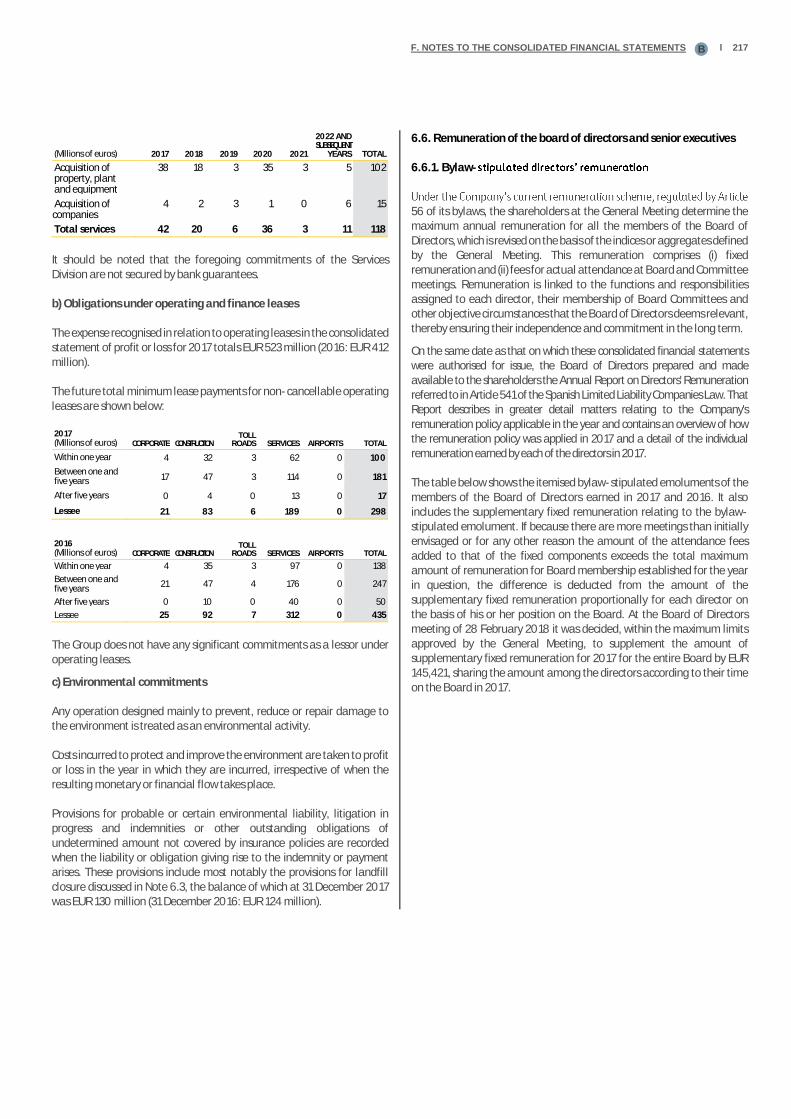
F. NOTES TO THE CONSOLIDATED FINANCIAL STATEMENTS Ɩ 217B
(Millions of euros) 2017 2018 2019 2020 2021
2022 AND SUBSEQUENT
YEARS TOTAL
Acquisition of property, plant and equipment
38 18 3 35 3 5 102
Acquisition of companies
4 2 3 1 0 6 15
Total services 42 20 6 36 3 11 118
It should be noted that the foregoing commitments of the Services Division are not secured by bank guarantees.
b) Obligations under operating and finance leases
The expense recognised in relation to operating leases in the consolidated statement of profit or loss for 2017 totals EUR 523 million (2016: EUR 412 million).
The future total minimum lease payments for non-cancellable operating leases are shown below:
2017 (Millions of euros) CORPORATE CONSTRUCTION
TOLL ROADS SERVICES AIRPORTS TOTAL
Within one year 4 32 3 62 0 100
Between one and five years 17 47 3 114 0 181
After five years 0 4 0 13 0 17
Lessee 21 83 6 189 0 298
2016 (Millions of euros) CORPORATE CONSTRUCTION
TOLL ROADS SERVICES AIRPORTS TOTAL
Within one year 4 35 3 97 0 138
Between one and five years
21 47 4 176 0 247
After five years 0 10 0 40 0 50
Lessee 25 92 7 312 0 435
The Group does not have any significant commitments as a lessor under operating leases.
c) Environmental commitments
Any operation designed mainly to prevent, reduce or repair damage to the environment is treated as an environmental activity.
Costs incurred to protect and improve the environment are taken to profit or loss in the year in which they are incurred, irrespective of when the resulting monetary or financial flow takes place.
Provisions for probable or certain environmental liability, litigation in progress and indemnities or other outstanding obligations of undetermined amount not covered by insurance policies are recorded when the liability or obligation giving rise to the indemnity or payment arises. These provisions include most notably the provisions for landfill closure discussed in Note 6.3, the balance of which at 31 December 2017 was EUR 130 million (31 December 2016: EUR 124 million).
6.6. Remuneration of the board of directors and senior executives
6.6.1. Bylaw-
56 of its bylaws, the shareholders at the General Meeting determine the maximum annual remuneration for all the members of the Board of Directors, which is revised on the basis of the indices or aggregates defined by the General Meeting. This remuneration comprises (i) fixed remuneration and (ii) fees for actual attendance at Board and Committee meetings. Remuneration is linked to the functions and responsibilities assigned to each director, their membership of Board Committees and other objective circumstances that the Board of Directors deems relevant, thereby ensuring their independence and commitment in the long term.
On the same date as that on which these consolidated financial statements were authorised for issue, the Board of Directors prepared and made available to the shareholders the Annual Report on Directors' Remuneration referred to in Article 541 of the Spanish Limited Liability Companies Law. That Report describes in greater detail matters relating to the Company's remuneration policy applicable in the year and contains an overview of how the remuneration policy was applied in 2017 and a detail of the individual remuneration earned by each of the directors in 2017.
The table below shows the itemised bylaw-stipulated emoluments of the members of the Board of Directors earned in 2017 and 2016. It also includes the supplementary fixed remuneration relating to the bylaw-stipulated emolument. If because there are more meetings than initially envisaged or for any other reason the amount of the attendance fees added to that of the fixed components exceeds the total maximum amount of remuneration for Board membership established for the year in question, the difference is deducted from the amount of the supplementary fixed remuneration proportionally for each director on the basis of his or her position on the Board. At the Board of Directors meeting of 28 February 2018 it was decided, within the maximum limits approved by the General Meeting, to supplement the amount of supplementary fixed remuneration for 2017 for the entire Board by EUR 145,421, sharing the amount among the directors according to their time on the Board in 2017.

218 Ɩ 2017 CONSOLIDATED FINANCIAL STATEMENTS. FERROVIAL, S.A. AND SUBSIDIARIES
F. NOTES TO THE CONSOLIDATED FINANCIAL STATEMENTS B
This table does not include the remuneration received by the executive directors for the discharge of their executive functions at the Company, which are described in Note 6.6.2.
2017
DIRECTOR (Thousands of euros)
FIXED REMUNERATION
ATTENDANCE FEES
SUPPLEMENTARY FIXED
REMUNERATION TOTAL
Rafael del Pino y Calvo-Sotelo 35 98 104 238
Santiago Bergareche Busquet 35 52 93 180
Joaquín Ayuso García 35 49 70 154
Iñigo Meirás Amusco 35 49 58 142
Juan Arena de la Mora 35 35 58 128
María del Pino y Calvo-Sotelo 35 47 58 140
Santiago Fernández Valbuena 35 65 58 158
José Fernando Sánchez-Junco Mans 35 62 58 156
Joaquín del Pino y Calvo-Sotelo 35 36 58 129
Oscar Fanjul Martín 35 58 58 151
Philip Bowman 35 36 58 129
Hanne Birgitte Breinbjerg Sorensen (since 05/04/17)
26 30 43 99
Total 411 618 774 1,803
2016
DIRECTOR(Thousands of euros)
FIXED REMUNERATION
ATTENDANCE FEES
SUPPLEMENTARY FIXED
REMUNERATION TOTAL
Rafael del Pino y Calvo-Sotelo 35 114 92 241
Santiago Bergareche Busquet 35 74 81 190
Joaquín Ayuso García 35 59 58 152
Iñigo Meirás Amusco 35 57 46 138
Juan Arena de la Mora 35 56 46 137
María del Pino y Calvo-Sotelo 35 57 46 138
Santiago Fernández Valbuena 35 78 46 159
José Fernando Sánchez-Junco Mans 35 68 46 149
Joaquín del Pino y Calvo-Sotelo 35 48 46 129
Oscar Fanjul Martín 35 63 46 144
Philip Bowman (since 29/07/16) 15 12 20 46
Leopoldo del Pino y Calvo-Sotelo (until 21/01/16)
2 0 3 5
Howard Lance (until 14/04/16) 10 12 13 35
Total 377 699 588 1,663
6.6.2. Individual remuneration of the executive directors
a) Remuneration earned in 2017 and 2016
The two executive directors in 2017 earned the following remuneration for discharging their functions, in addition to the remuneration discussed in the preceding section.
2017
REMUNERATION OF THE EXECUTIVE DIRECTORS * (Thousands of euros) RAFAEL DEL PINO IÑIGO MEIRÁS TOTAL
Fixed remuneration 1,455 1,200 2,655 Variable remuneration 2,393 1,978 4,371 Life insurance premiums 8 5 13 Share plans (1) 1,406 1,406 2,812
Total 2017 5,262 4,589 9,851
*Remuneration for their role as executive directors(1) In March 2017, since the agreed metrics had been complied with, a number of shares equivalent to the units allocated in 2014 were delivered, after the relevant withholdings had been made. The CNMV was notified on 13/03/17.
2016
REMUNERATION OF THE EXECUTIVE DIRECTORS (Thousands of euros)
RAFAEL DEL PIN
O
JOAQUÍN AYUSO
(3) IÑIGO MEIRÁS TOTAL
Fixed remuneration 1,455 0 1,200 2,655
Variable remuneration 2,261 0 1̂.872 4,133
Relating to boards of other subsidiaries
0 36 0 36
Exercise of share options (2) 9,383 1,616 170 11,169
Life insurance premiums 8 0 4 12
Share plans (1) 1,918 0 1,918 3,836
Total 2016 15,025 1,652 5,164 21,841
(1) In March 2016, since the agreed metrics had been complied with, a number of shares equivalent to the units allocated in 2013 were delivered, after the relevant withholdings had been made. The CNMV was notified on 15/03/16.
(2) Rafael del Pino exercised 1,179,600 share options and Íñigo Meirás exercised 20,000 share options under the 2008 Plan, which expired in 2016. As in all the share option or share-based plans granted by Ferrovial since 2000, the Executive Chairman exercised his option in the last quarter prior to expiry.
(3) Joaquín Ayuso exercised 200,000 share options. He was granted this share-option plan in 2008 when he discharged the position of executive director.
b) Share-based payment systems
Following is a detail of the targets-based remuneration schemes linked to the performance of the share, entitlement to which has not yet vested.
EXECUTIVE
PLAN SITUATION AT 31/12/16 UNITS
NO. OF VOTING RIGHTS
% OF VOTING POWER
Rafael del Pino y Calvo-Sotelo
2015 Allocation
69,800 69,800 0.01%
2016 Allocation
74,000 74,000 0.01%
2017 Allocation
76,850 76,850 0.01%
Íñigo Meirás Amusco
2015 Allocation
69,800 69,800 0.01%
2016 Allocation
74,000 74,000 0.01%
2017 Allocation
76,850 76,850 0.01%
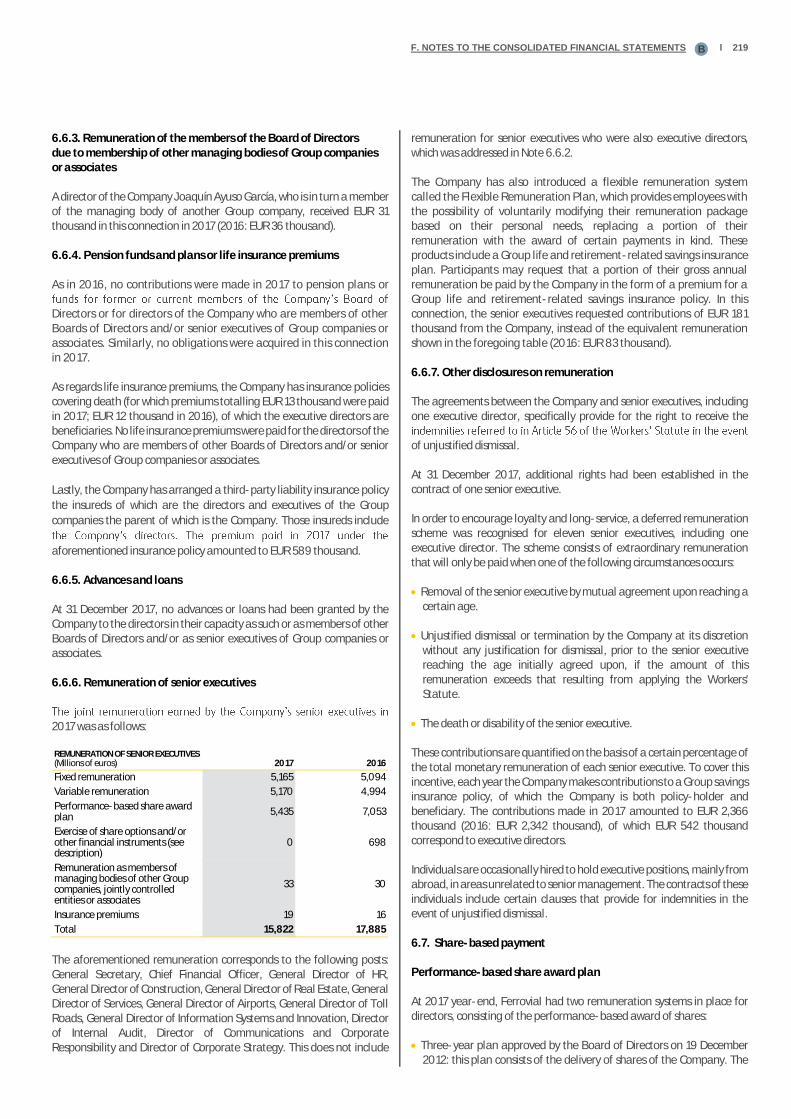
F. NOTES TO THE CONSOLIDATED FINANCIAL STATEMENTS Ɩ 219B
6.6.3. Remuneration of the members of the Board of Directors due to membership of other managing bodies of Group companies or associates
A director of the Company Joaquín Ayuso García, who is in turn a member of the managing body of another Group company, received EUR 31 thousand in this connection in 2017 (2016: EUR 36 thousand).
6.6.4. Pension funds and plans or life insurance premiums
As in 2016, no contributions were made in 2017 to pension plans or
Directors or for directors of the Company who are members of other Boards of Directors and/or senior executives of Group companies or associates. Similarly, no obligations were acquired in this connection in 2017.
As regards life insurance premiums, the Company has insurance policies covering death (for which premiums totalling EUR 13 thousand were paid in 2017; EUR 12 thousand in 2016), of which the executive directors are beneficiaries. No life insurance premiums were paid for the directors of the Company who are members of other Boards of Directors and/or senior executives of Group companies or associates.
Lastly, the Company has arranged a third-party liability insurance policy
the insureds of which are the directors and executives of the Group
companies the parent of which is the Company. Those insureds include
aforementioned insurance policy amounted to EUR 589 thousand.
6.6.5. Advances and loans
At 31 December 2017, no advances or loans had been granted by the Company to the directors in their capacity as such or as members of other Boards of Directors and/or as senior executives of Group companies or associates.
6.6.6. Remuneration of senior executives
2017 was as follows:
REMUNERATION OF SENIOR EXECUTIVES (Millions of euros) 2017 2016
Fixed remuneration 5,165 5,094
Variable remuneration 5,170 4,994
Performance-based share award plan
5,435 7,053
Exercise of share options and/or other financial instruments (see description)
0 698
Remuneration as members of managing bodies of other Group companies, jointly controlled entities or associates
33 30
Insurance premiums 19 16
Total 15,822 17,885
The aforementioned remuneration corresponds to the following posts: General Secretary, Chief Financial Officer, General Director of HR, General Director of Construction, General Director of Real Estate, General Director of Services, General Director of Airports, General Director of Toll Roads, General Director of Information Systems and Innovation, Director of Internal Audit, Director of Communications and Corporate Responsibility and Director of Corporate Strategy. This does not include
remuneration for senior executives who were also executive directors, which was addressed in Note 6.6.2.
The Company has also introduced a flexible remuneration system called the Flexible Remuneration Plan, which provides employees with the possibility of voluntarily modifying their remuneration package based on their personal needs, replacing a portion of their remuneration with the award of certain payments in kind. These products include a Group life and retirement-related savings insurance plan. Participants may request that a portion of their gross annual remuneration be paid by the Company in the form of a premium for a Group life and retirement-related savings insurance policy. In this connection, the senior executives requested contributions of EUR 181 thousand from the Company, instead of the equivalent remuneration shown in the foregoing table (2016: EUR 83 thousand).
6.6.7. Other disclosures on remuneration
The agreements between the Company and senior executives, including one executive director, specifically provide for the right to receive the
of unjustified dismissal.
At 31 December 2017, additional rights had been established in the contract of one senior executive.
In order to encourage loyalty and long-service, a deferred remuneration scheme was recognised for eleven senior executives, including one executive director. The scheme consists of extraordinary remuneration that will only be paid when one of the following circumstances occurs:
• Removal of the senior executive by mutual agreement upon reaching acertain age.
• Unjustified dismissal or termination by the Company at its discretionwithout any justification for dismissal, prior to the senior executive reaching the age initially agreed upon, if the amount of this remuneration exceeds that resulting from applying the Workers'Statute.
• The death or disability of the senior executive.
These contributions are quantified on the basis of a certain percentage of the total monetary remuneration of each senior executive. To cover this incentive, each year the Company makes contributions to a Group savings insurance policy, of which the Company is both policy-holder and beneficiary. The contributions made in 2017 amounted to EUR 2,366 thousand (2016: EUR 2,342 thousand), of which EUR 542 thousand correspond to executive directors.
Individuals are occasionally hired to hold executive positions, mainly from abroad, in areas unrelated to senior management. The contracts of these individuals include certain clauses that provide for indemnities in the event of unjustified dismissal.
6.7. Share-based payment
Performance-based share award plan
At 2017 year-end, Ferrovial had two remuneration systems in place for directors, consisting of the performance-based award of shares:
• Three-year plan approved by the Board of Directors on 19 December 2012: this plan consists of the delivery of shares of the Company. The
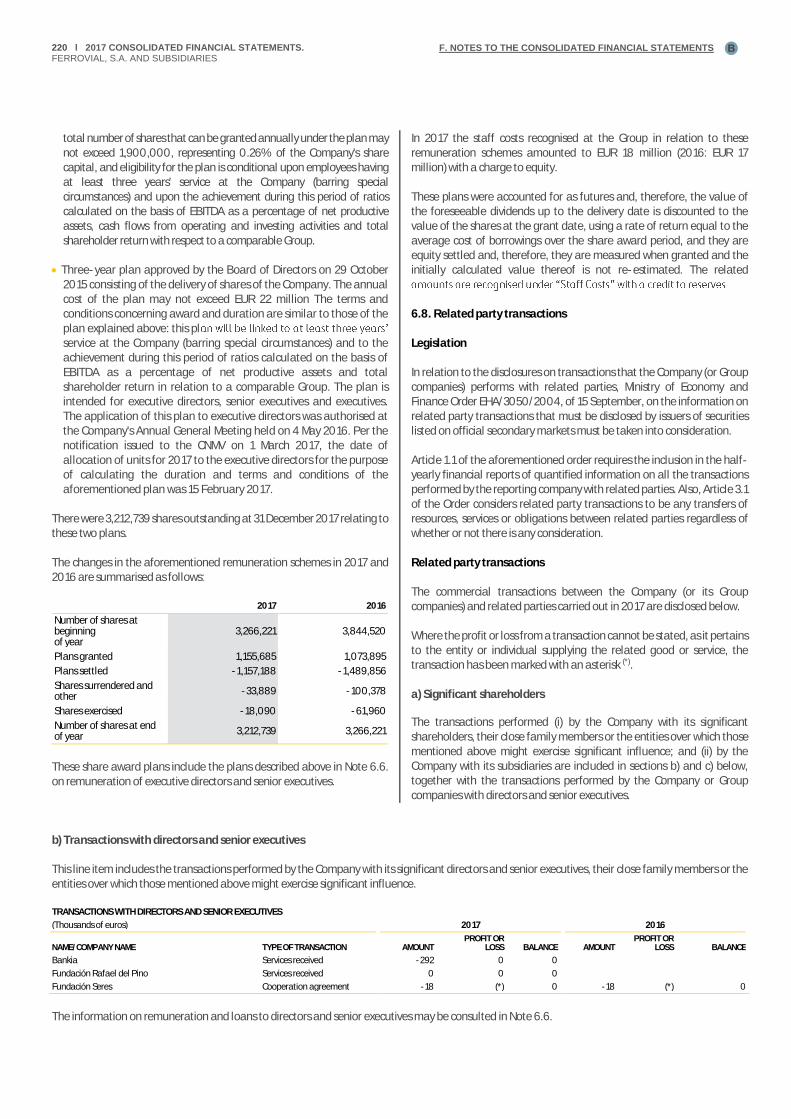
220 Ɩ 2017 CONSOLIDATED FINANCIAL STATEMENTS. FERROVIAL, S.A. AND SUBSIDIARIES
F. NOTES TO THE CONSOLIDATED FINANCIAL STATEMENTS B
total number of shares that can be granted annually under the plan may not exceed 1,900,000, representing 0.26% of the Company's share capital, and eligibility for the plan is conditional upon employees having at least three years' service at the Company (barring special circumstances) and upon the achievement during this period of ratios calculated on the basis of EBITDA as a percentage of net productive assets, cash flows from operating and investing activities and total shareholder return with respect to a comparable Group.
• Three-year plan approved by the Board of Directors on 29 October2015 consisting of the delivery of shares of the Company. The annualcost of the plan may not exceed EUR 22 million The terms andconditions concerning award and duration are similar to those of theplan explained above: this plservice at the Company (barring special circumstances) and to theachievement during this period of ratios calculated on the basis ofEBITDA as a percentage of net productive assets and totalshareholder return in relation to a comparable Group. The plan isintended for executive directors, senior executives and executives.The application of this plan to executive directors was authorised atthe Company's Annual General Meeting held on 4 May 2016. Per thenotification issued to the CNMV on 1 March 2017, the date ofallocation of units for 2017 to the executive directors for the purposeof calculating the duration and terms and conditions of theaforementioned plan was 15 February 2017.
There were 3,212,739 shares outstanding at 31 December 2017 relating to these two plans.
The changes in the aforementioned remuneration schemes in 2017 and 2016 are summarised as follows:
2017 2016
Number of shares at beginning of year
3,266,221 3,844,520
Plans granted 1,155,685 1,073,895
Plans settled -1,157,188 -1,489,856
Shares surrendered and other
-33,889 -100,378
Shares exercised -18,090 -61,960
Number of shares at end of year
3,212,739 3,266,221
These share award plans include the plans described above in Note 6.6. on remuneration of executive directors and senior executives.
In 2017 the staff costs recognised at the Group in relation to these remuneration schemes amounted to EUR 18 million (2016: EUR 17 million) with a charge to equity.
These plans were accounted for as futures and, therefore, the value of the foreseeable dividends up to the delivery date is discounted to the value of the shares at the grant date, using a rate of return equal to the average cost of borrowings over the share award period, and they are equity settled and, therefore, they are measured when granted and the initially calculated value thereof is not re-estimated. The related
6.8. Related party transactions
Legislation
In relation to the disclosures on transactions that the Company (or Group companies) performs with related parties, Ministry of Economy and Finance Order EHA/3050/2004, of 15 September, on the information on related party transactions that must be disclosed by issuers of securities listed on official secondary markets must be taken into consideration.
Article 1.1 of the aforementioned order requires the inclusion in the half-yearly financial reports of quantified information on all the transactions performed by the reporting company with related parties. Also, Article 3.1 of the Order considers related party transactions to be any transfers of resources, services or obligations between related parties regardless of whether or not there is any consideration.
Related party transactions
The commercial transactions between the Company (or its Group companies) and related parties carried out in 2017 are disclosed below.
Where the profit or loss from a transaction cannot be stated, as it pertains to the entity or individual supplying the related good or service, the transaction has been marked with an asterisk (*).
a) Significant shareholders
The transactions performed (i) by the Company with its significant shareholders, their close family members or the entities over which those mentioned above might exercise significant influence; and (ii) by the Company with its subsidiaries are included in sections b) and c) below, together with the transactions performed by the Company or Group companies with directors and senior executives.
b) Transactions with directors and senior executives
This line item includes the transactions performed by the Company with its significant directors and senior executives, their close family members or the entities over which those mentioned above might exercise significant influence.
TRANSACTIONS WITH DIRECTORS AND SENIOR EXECUTIVES
(Thousands of euros) 2017 2016
NAME/COMPANY NAME TYPE OF TRANSACTION AMOUNT PROFIT OR
LOSS BALANCE AMOUNT PROFIT OR
LOSS BALANCE
Bankia Services received -292 0 0
Fundación Rafael del Pino Services received 0 0 0
Fundación Seres Cooperation agreement -18 (*) 0 -18 (*) 0
The information on remuneration and loans to directors and senior executives may be consulted in Note 6.6.

F. NOTES TO THE CONSOLIDATED FINANCIAL STATEMENTS Ɩ 221B
c) Transactions between Group employees, companies or entities
se family members or the entities over which those mentioned above might exerexecutives, close family members or the entities over which those mentioned above might exercise significant influence. If the party related to the Company were so considered during a portion of the year, the transactions performed in that period are indicated.
TRANSACTIONS BETWEEN GROUP EMPLOYEES, COMPANIES OR ENTITIES
(Thousands of euros) 2017 2016
NAME/COMPANY NAME TYPE OF TRANSACTION AMOUNT PROFIT
OR LOSS BALANCE AMOUNT PROFIT
OR LOSS BALANCE
Rafael del Pino y Calvo-Sotelo Services rendered 188 - 186 6 0 0
María del Pino y Calvo-Sotelo Services rendered 3 - - 99 0 0
Joaquín del Pino y Calvo-Sotelo Services rendered 59 9 - 17 2 0
Ana María Calvo-Sotelo y Bustelo Services rendered 24 2 0 27 2 2
Joaquín Ayuso García Services rendered 7 - - 2 0 0
Almirall Laboratorios Services rendered 7 0 2 8 0 5
Burberry Spain Retail, S.L. Services rendered 5 0 0 - - -
Criu, S.L. Services rendered 30 2 131 476 2 131
Maxam Europe and Group companies Purchase of goods/services received -437 (*) -6 -857 (*) -74
Telefónica and Group companies Services received - - - -7,374 0 0
Services rendered - - - 800 67 0
Marsh and Group companies Receipt of insurance services -5,228 (*) -15 -4,432 (*) -65
Meliá Hotels and Group companies Receipt of hotel and catering services -10 (*) 0 -4 (*) -1
Construction, renovation/maintenance work and waste collection
5,425 845 1,005 6,771 94 1,009
Bankia Receipt of financial services -1,911 (*) 0 -525 (*) 0
Financing agreements. Guarantee -87,483 (*) -87,483 -87,456 (*) -87,456
Interest received 186 186 0 147 147 0
Payment of interest -1,093 (*) 0 -1,520 (*) 0
Balance drawn down against guarantee facilities -134,370 (*) -134,370 -125,707 (*) -125,707
Transactions with derivatives -2,984 (*) 0 -14,283 (*) 0
Services rendered 1 0 4 1 0 5
Bankinter Receipt of financial services - - - -18 (*) 0
Payment of interest - - - -176 (*) 0
Interest received - - - 261 261 0
Balance drawn down against guarantee facilities - - - -9,882 (*) -9,882
Financing agreements - - - -10,898 (*) -10,898
Services rendered - - - 176 7 0
Bimaran Pozuelo, S.L. Services rendered 537 68 - 1,207 -184 60
Polan, S.A. Services rendered 179 5 75 162 12 79
Rijn Capital BV Services rendered 23 - 23
Fundación Rafael del Pino Services rendered 0 0 0 2 0 1
Fundación Centro de Innovación de Infraestructuras Inteligentes
Cooperation agreements -1,338 0 -12
Services rendered 92 0 0
Red Eléctrica de España, S.A.U. Construction work 6,743 -1,613 865 932 -84 671
Services received -9 - -
Hispania Activos Inmobiliarios Socimi, S.A. Services rendered 204 142 25 1,764 -198 215
Los Estanquillos, S.L. Services rendered - - - 72 3 0
Lafarge Holcim Acquisition of cement and related materials -11,796 0 -1,060 -14,269 0 -1,136
La Rioja Alta Services received - - - -1 (*) 0
Mª Jesús Alcina Pérez-Gorostiaga Services rendered 2 0 0
Panda Security Services received - - - -1 (*) 0
Sidecu, S.A. Services rendered 2 0 0 0 0 0
Summit Purchase of goods - - - -20 (*) 0
Zurich Insurance Services received - - - -2,131 (*) -6
Services rendered - - - 0 0 8
Described below are transactions between the subsidiaries and the Company which, in all cases form part of their ordinary businesses as regards purpose and conditions and were not eliminated on consolidation for the following reason.
As explained in detail in Note 1.3.2, the balances and transactions relating to construction work performed by the Construction Division for the Group's infrastructure concession operators are not eliminated on consolidation
since, at consolidated level, contracts of this type are classed as construction contracts in which the work -to the extent that it is completed- is deemed to be performed for third parties, as the ultimate owner of the work is the grantor both from a financial and legal viewpoint.
for EUR 391,813 thousand (2016: EUR 112,252 thousand) for work performed and related advance payments and, in this respect, recognised sales totalling EUR 411,158 thousand (2016: EUR 397,122 thousand).
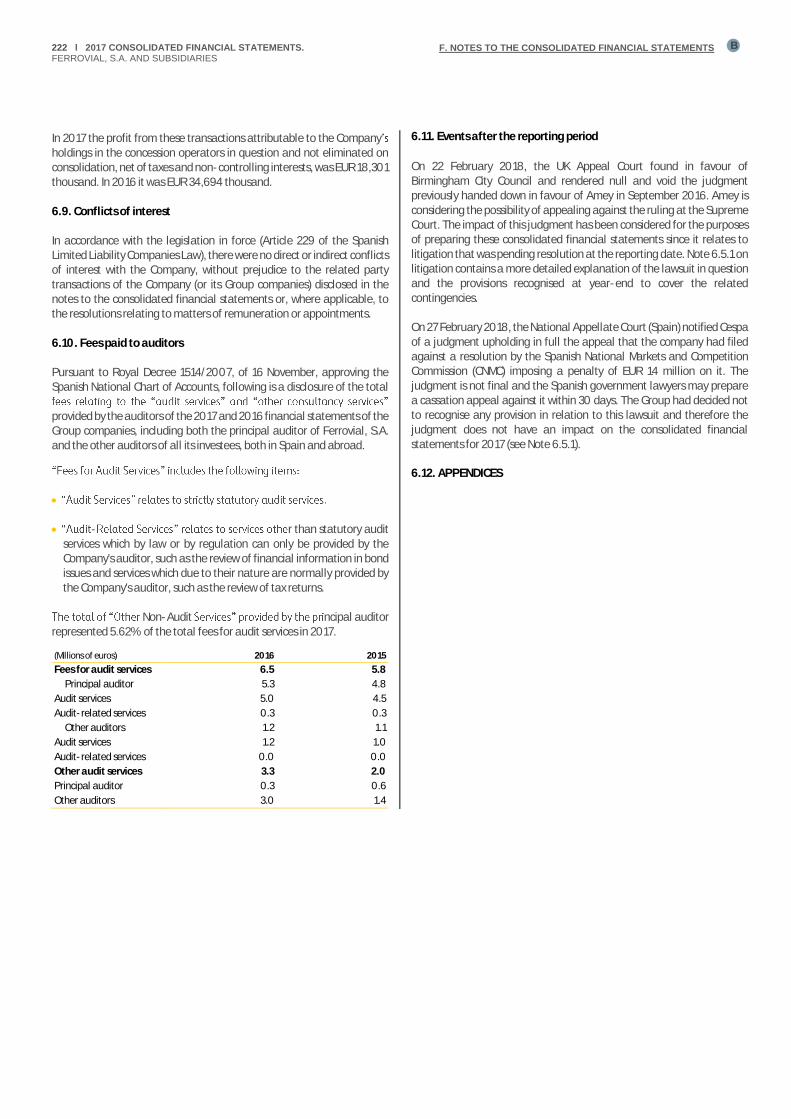
222 Ɩ 2017 CONSOLIDATED FINANCIAL STATEMENTS. FERROVIAL, S.A. AND SUBSIDIARIES
F. NOTES TO THE CONSOLIDATED FINANCIAL STATEMENTS B
In 2017 the profit from these transactions attributable to the Companyholdings in the concession operators in question and not eliminated on consolidation, net of taxes and non-controlling interests, was EUR 18,301 thousand. In 2016 it was EUR 34,694 thousand.
6.9. Conflicts of interest
In accordance with the legislation in force (Article 229 of the Spanish Limited Liability Companies Law), there were no direct or indirect conflicts of interest with the Company, without prejudice to the related party transactions of the Company (or its Group companies) disclosed in the notes to the consolidated financial statements or, where applicable, to the resolutions relating to matters of remuneration or appointments.
6.10. Fees paid to auditors
Pursuant to Royal Decree 1514/2007, of 16 November, approving the Spanish National Chart of Accounts, following is a disclosure of the total
provided by the auditors of the 2017 and 2016 financial statements of the Group companies, including both the principal auditor of Ferrovial, S.A. and the other auditors of all its investees, both in Spain and abroad.
•
• - r than statutory audit services which by law or by regulation can only be provided by the Company's auditor, such as the review of financial information in bond issues and services which due to their nature are normally provided by the Company's auditor, such as the review of tax returns.
Non-Audit ncipal auditor represented 5.62% of the total fees for audit services in 2017.
(Millions of euros) 2016 2015
Fees for audit services 6.5 5.8
Principal auditor 5.3 4.8
Audit services 5.0 4.5
Audit-related services 0.3 0.3
Other auditors 1.2 1.1
Audit services 1.2 1.0
Audit-related services 0.0 0.0
Other audit services 3.3 2.0
Principal auditor 0.3 0.6
Other auditors 3.0 1.4
6.11. Events after the reporting period
On 22 February 2018, the UK Appeal Court found in favour of Birmingham City Council and rendered null and void the judgment previously handed down in favour of Amey in September 2016. Amey is considering the possibility of appealing against the ruling at the Supreme Court. The impact of this judgment has been considered for the purposes of preparing these consolidated financial statements since it relates to litigation that was pending resolution at the reporting date. Note 6.5.1 on litigation contains a more detailed explanation of the lawsuit in question and the provisions recognised at year-end to cover the related contingencies.
On 27 February 2018, the National Appellate Court (Spain) notified Cespa of a judgment upholding in full the appeal that the company had filed against a resolution by the Spanish National Markets and Competition Commission (CNMC) imposing a penalty of EUR 14 million on it. The judgment is not final and the Spanish government lawyers may prepare a cassation appeal against it within 30 days. The Group had decided not to recognise any provision in relation to this lawsuit and therefore the judgment does not have an impact on the consolidated financial statements for 2017 (see Note 6.5.1).
6.12. APPENDICES

APPENDIX I Ɩ 223B
I In 2014 Ferrovial opted to be taxed under the regime established currently in Articles 107 and 108 of the Spanish Income Tax Law, of 27 November, which became applicable from 1 January 2014 and, consequently, applied to all of 2017. Under this tax regime:
1. Dividends and capital gains obtained by Ferrovial arising from ownership interests in non-resident operating companies (whichrepresent at least 5% of the share capital of these companies or which were acquired for more than EUR 20 million) are exempt from incometax if the requirements provided for in Article 21 of the Spanish Income
2. The dividends paid by Ferrovial with a charge to the
permanent establishments abroad to which the exemption provided for in Article 22 of the Spanish Income Tax Law is applicable are treated as follows:
(i) Where the recipient is a non-resident shareholder in Spain (and doesnot operate through tax havens or by means of a permanentestablishment in Spain), dividends are not subject to withholdings ortaxation in Spain.
(ii) Where the recipient is an entity subject to Spanish income tax, thedividends received shall give rise to the exemption in order to avoid double taxation of dividends of resident entities included in Article 21
provided for in the aforementioned law are met.
(iii) Where the recipient is a natural person resident in Spain subject topersonal income tax, the dividends received shall be consideredsavings income and the tax credit for the avoidance of double taxationin Spain may be taken in accordance with the terms of the Personal Income Tax Law, with respect to the taxes paid abroad by Ferrovial.
In 2017 all of the dividends paid by Ferrovial were paid out of "exempt income".
3. The capital gains obtained by the shareholders of Ferrovial arising from the transfer of their ownership interests in the Company aretreated as follows:
(i) Where the shareholder is a non-resident in Spain (and does notoperate through tax havens or a permanent establishment in Spain) the portion of the capital gain that relates to the reserves recognised
or to changes in value attributable to Ferrovial's investments in non-resident entities that meet the requirements to be able to apply the foreign income exemption established in Articles 21 and 22 of the Spanish Income Tax Law shall be deemed not subject to taxation in Spain.
(ii) Where the shareholder is an entity subject to Spanish income tax withan ownership interest in Ferrovial that meets the requirement (5%ownership interest in the share capital or that the acquisition cost of the ownership interest exceeds EUR 20 million and it has been heldfor one year), the exemption provided for in Article 21 of the Spanish Income Tax Law may be applied.
(iii) Where the shareholder is a natural person resident in Spain subject topersonal income tax, it shall pay tax on the capital gain obtained in accordance with the standard income tax rules.
The amount of exempt income pursuant to Article 21 and 22 of the Spanish Income Tax Law obtained by Ferrovial in 2017 and the related tax paid abroad are as follows:
A) Exemption for foreign source dividends and income
A.1 exemption for foreign source dividends
(EUR) Cintra Global Holding, LTD 3,000,000.00
Dividends 407 Toronto Highway B.V. 3,000,000.00
Cintra Infraestructuras Internacional, S.L.U. 400,200.00
Dividends Eurolink Motorway Operation (M4-M6), Ltd.
400,200.00
Cintra Infraestructuras, SE 9,193,267.06
Dividends Norte Litoral 5,389,998.57
Dividends Euroscut Algarve 2,063,994.89
Dividends Algarve BV 240,000.00
Dividends Via Livre 1,499,273.60
Ferrovial Airports International, LTD 315,000,000.00
Dividends Hubco Netherlands BV 315,000,000.00
Ferrovial Agromán Internacional, SLU 100,000,000.00
Dividends Valivala 100,000,000.00
Total 427,593,467.06
A.2 Exemption for income of permanent establishments abroad
No income was obtained from permanent establishments abroad in 2017.
B) EXEMPTION FOR FOREIGN SOURCE CAPITAL GAINS:
No capital gains were obtained to which the exemption included in Article 21 of the Spanish Income Tax Law is applicable because (i) either the sales were made between Group companies and were eliminated on preparation of the consolidated tax return, (ii) or they were reported in corporate restructuring transactions which opted for the tax neutrality regime provided for in Article 76 et seq of the Spanish Income Tax Law. Nevertheless, the capital gains that would have been reported for tax purposes had these regimes not been not applicable (consolidated tax Group or tax neutrality) are as follows:
B.1 Elimination of capital gains for intra-Group sales of foreign companies:
None took place in 2017.
B.2 Deferred capital gains arising in corporate restructuring processes:
(Amounts in euros)
Ferrovial, S.A. 2,823,955,671.45
Ferrovial Internacional, S.L.U. 572,256,055.81
Cintra Infraestructuras Internacional, S.L.U.
22,143,952.38
Total 3,418,355,679.62
In order to enable the shareholders of Ferrovial to adopt the aforementioned tax regime, the Company performed a market assessment at the end of the year of its ownership interests (held directly and indirectly through investments in other entities that have adopted this special tax regime) in non-resident entities and permanent establishments abroad that meet the requirements to be able to apply
APPENDIX I. DISCLOSURES ON THE TAX REGIME ESTABLISHED IN ARTICLES 107 AND 108 OF LAW 27/2014
224 Ɩ 2017 CONSOLIDATED FINANCIAL STATEMENTS. FERROVIAL, S.A. AND SUBSIDIARIES
APPENDIX I B
the foreign source income exemption established in Articles 21 and 22 of the Spanish Income Tax Law.
The result of this assessment means that these assets represent 91% of the total market value of Ferrovial. At 31 December 2016, this percentage amounted to 92%.
In 2017 Ferrovial S.A. implemented two shareholder remuneration
receiving newly issued bonus shares of the Company; (ii) transferring in the market the bonus issue rights corresponding to the shares held by them; or (iii) receiving a cash amount through the transfer to Ferrovial of the aforementioned bonus issue rights.
Set forth below are the main tax implications of these schemes, based on the tax legislation in force in Spain except for Navarre and the Basque Country and on the interpretation made by the Spanish Directorate-General of Taxes in its response to several requests for binding rulings.
Delivery of new shares: for tax purposes, the delivery of new shares is considered to be a delivery of bonus shares and, therefore, does not constitute income for the purposes of personal income tax, income tax or non-resident income tax, regardless of whether or not the recipients of these shares act through a permanent establishment in Spain. The delivery of new shares is not subject to withholdings or pre-payments. The acquisition cost, both of the new shares and the shares to which they correspond, will be the result of distributing the total cost of acquisition for tax purposes of the portfolio by the number of shares; both the original shares and the bonus shares that correspond to them. The age of the bonus shares will be the age that corresponds to the shares that gave rise to them. Consequently, in the event of their subsequent transfer, the income obtained will be calculated by reference to this new value.
Sale to the market of the bonus issue rights: If the shareholders sell their bonus issue rights to the market, the amount obtained will not be subject to withholdings or pre-payments and will be subject to the tax rules indicated below (applicable until the end of 2016(*)):
a) In the case of personal income tax and non-resident income tax applicable to shareholders without a permanent establishment inSpain, the amount obtained on the sale to the market of the bonusissue rights is subject to the same rules established in tax legislation forpre-emption rights. Consequently, the amount obtained on the saleof the bonus issue rights reduces the acquisition cost for tax purposes of the shares which give rise to such rights, pursuant to Article 37.1.a)of Personal Income Tax Law 35/2006, of 28 November, and pursuantto Final Provision Six of Law 26/2014, of 27 November, amendingPersonal Income Tax Law 35/2006, of 28 November, theConsolidated Spanish Non-Resident Income Tax Law approved byLegislative Royal Decree 5/2004, of 5 March, and other tax legislation.Therefore, if the amount obtained on the sale of the bonus issue rights is higher than the acquisition cost of the shares which gave rise tothem, the difference is considered to be a capital gain for the seller inthe tax period in which this occurs; all of the foregoing without prejudice to the potential application to non-resident income tax payers not operating through a permanent establishment in Spain of the tax treaties entered into by Spain to which they could be entitledor to the exemptions that may be applicable to them under Spanishdomestic law.
a) In the case of income tax and non-resident income tax applicable to shareholders operating through a permanent establishment in Spain, to the extent that a full business cycle is completed, tax will be paid in
accordance with the applicable accounting standards and, if appropriate, with any special tax rules that may apply to the shareholders subject to the aforementioned taxes.
Sale to Ferrovial of the bonus issue rights: Lastly, if the holders of bonus issue rights decide to avail themselves of the Ferrovial Purchase Commitment, the tax regime applicable to the amount obtained on the sale to Ferrovial of the bonus issue rights received in their capacity as shareholders will be as follows:
(iv) If the shareholder is a natural person resident for tax purposes in Spain or a legal entity that does not satisfy the requirements toapply the exemption provided for in Article 21 of Spanish Income TaxLaw 27/2014, the applicable tax regime shall be the regime which applies to the dividends paid directly in cash and, therefore, the amount obtained will be subject to the corresponding withholding tax;
(v) If the shareholder is a natural person or legal entity not resident for tax purposes in Spain or a tax haven, and does not operate through a permanent establishment in Spain, the amount obtained shall not be subject to taxation in Spain pursuant to Chapter XIII of Title VII of Spanish Income Tax Law 27/2014, and, therefore, shall not be subject to withholding tax. In these cases, for this regime to apply the shareholder shall be required to evidence its tax residence by providing the corresponding certificate issued by the tax authorities in question;
(vi) If the shareholder is a legal entity resident in Spain for tax purposes or,if it is not a tax resident but operates through a permanent establishment in Spain and satisfies the requirements for theapplication of the exemption provided for in Article 21 of SpanishIncome Tax Law 27/2014, the amount obtained shall be exempt from taxation in Spain and, therefore, shall not be subject to withholdingtax.
It should be borne in mind that the taxation scenarios of the various options relating to the scheme knoout above do not explain all the possible tax consequences. Accordingly, the shareholders should consult their tax advisers on the specific tax effect of the proposed scheme and pay attention to any changes that could take place, both in in-force legislation and in the criteria of the interpretation thereof, as well as the particular circumstances of each shareholder or holder of bonus issue rights.
(*) This tax regime was amended slightly in 2017.
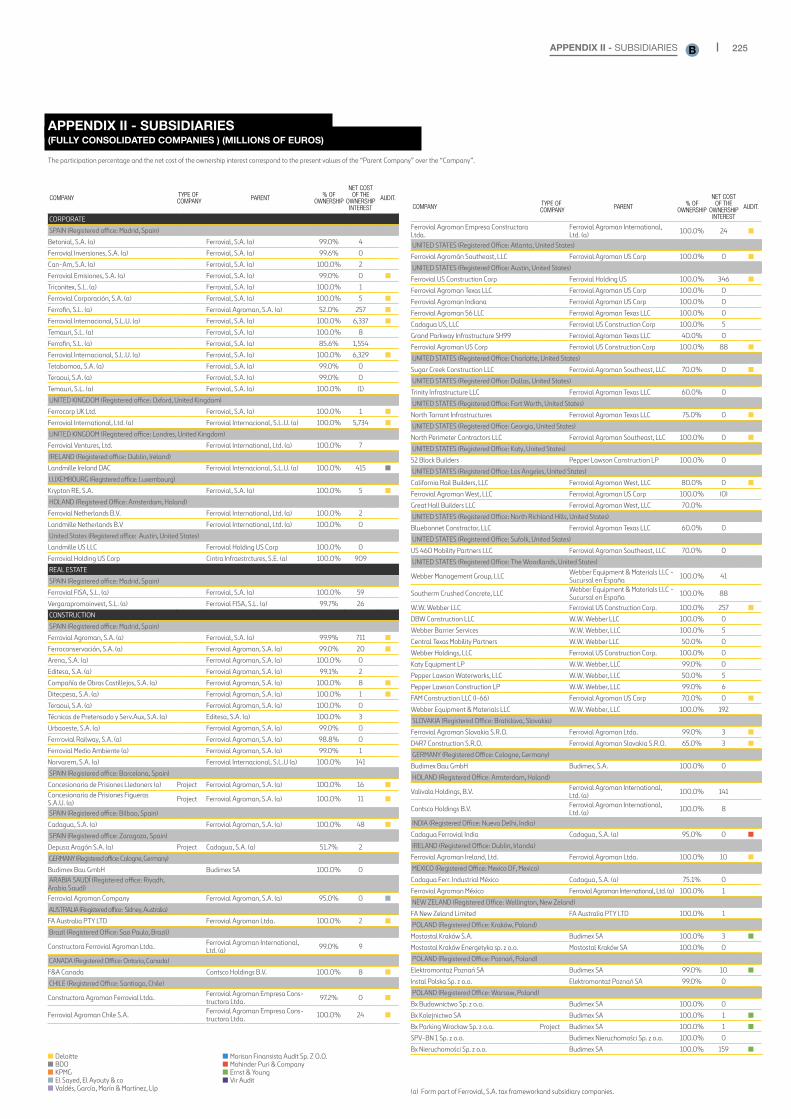
225APPENDIX II - SUBSIDIARIES B
COMPANY TYPE OF COMPANY PARENT % OF
OWNERSHIP
NET COSTOF THE
OWNERSHIPINTEREST
AUDIT.
CORPORATE
SPAIN (Registered office: Madrid, Spain)
Betonial, S.A. (a) Ferrovial, S.A. (a) 99.0% 4
Ferrovial Inversiones, S.A. (a) Ferrovial, S.A. (a) 99.6% 0
Can-Am, S.A. (a) Ferrovial, S.A. (a) 100.0% 2
Ferrovial Emisiones, S.A. (a) Ferrovial, S.A. (a) 99.0% 0 n
Triconitex, S.L. (a) Ferrovial, S.A. (a) 100.0% 1
Ferrovial Corporación, S.A. (a) Ferrovial, S.A. (a) 100.0% 5 n
Ferrofin, S.L. (a) Ferrovial Agroman, S.A. (a) 52.0% 257 n
Ferrovial Internacional, S.L.U. (a) Ferrovial, S.A. (a) 100.0% 6,337 n
Temauri, S.L. (a) Ferrovial, S.A. (a) 100.0% 8
Ferrofin, S.L. (a) Ferrovial, S.A. (a) 85.6% 1,554
Ferrovial Internacional, S.L.U. (a) Ferrovial, S.A. (a) 100.0% 6,329 n
Tetabomoa, S.A. (a) Ferrovial, S.A. (a) 99.0% 0
Teraoui, S.A. (a) Ferrovial, S.A. (a) 99.0% 0
Temauri, S.L. (a) Ferrovial, S.A. (a) 100.0% (1)
UNITED KINGDOM (Registered office: Oxford, United Kingdom)
Ferrocorp UK Ltd. Ferrovial, S.A. (a) 100.0% 1 n
Ferrovial International, Ltd. (a) Ferrovial Internacional, S.L.U. (a) 100.0% 5,734 n
UNITED KINGDOM (Registered office: Londres, United Kingdom)
Ferrovial Ventures, Ltd. Ferrovial International, Ltd. (a) 100.0% 7
IRELAND (Registered office: Dublin, Ireland)
Landmille Ireland DAC Ferrovial Internacional, S.L.U. (a) 100.0% 415 n
LUXEMBOURG (Registered office: Luxembourg)
Krypton RE, S.A. Ferrovial, S.A. (a) 100.0% 5 n
HOLAND (Registered Office: Amsterdam, Holand)
Ferrovial Netherlands B.V. Ferrovial International, Ltd. (a) 100.0% 2
Landmille Netherlands B.V Ferrovial International, Ltd. (a) 100.0% 0
United States (Registered office: Austin, United States)
Landmille US LLC Ferrovial Holding US Corp 100.0% 0
Ferrovial Holding US Corp Cintra Infraestrctures, S.E. (a) 100.0% 909
REAL ESTATE
SPAIN (Registered office: Madrid, Spain)
Ferrovial FISA, S.L. (a) Ferrovial, S.A. (a) 100.0% 59
Vergarapromoinvest, S.L. (a) Ferrovial FISA, S.L. (a) 99.7% 26
CONSTRUCTION
SPAIN (Registered office: Madrid, Spain)
Ferrovial Agroman, S.A. (a) Ferrovial, S.A. (a) 99.9% 711 n
Ferroconservación, S.A. (a) Ferrovial Agroman, S.A. (a) 99.0% 20 n
Arena, S.A. (a) Ferrovial Agroman, S.A. (a) 100.0% 0
Editesa, S.A. (a) Ferrovial Agroman, S.A. (a) 99.1% 2
Compañía de Obras Castillejos, S.A. (a) Ferrovial Agroman, S.A. (a) 100.0% 8 n
Ditecpesa, S.A. (a) Ferrovial Agroman, S.A. (a) 100.0% 1 n
Teraoui, S.A. (a) Ferrovial Agroman, S.A. (a) 100.0% 0
Técnicas de Pretensado y Serv.Aux, S.A. (a) Editesa, S.A. (a) 100.0% 3
Urbaoeste, S.A. (a) Ferrovial Agroman, S.A. (a) 99.0% 0
Ferrrovial Railway, S.A. (a) Ferrovial Agroman, S.A. (a) 98.8% 0
Ferrovial Medio Ambiente (a) Ferrovial Agroman, S.A. (a) 99.0% 1
Norvarem, S.A. (a) Ferrovial Internacional, S.L.U (a) 100.0% 141
SPAIN (Registered office: Barcelona, Spain)
Concesionaria de Prisiones Lledoners (a) Project Ferrovial Agroman, S.A. (a) 100.0% 16 n
Concesionaria de Prisiones Figueras S.A.U. (a) Project Ferrovial Agroman, S.A. (a) 100.0% 11 n
SPAIN (Registered office: Bilbao, Spain)
Cadagua, S.A. (a) Ferrovial Agroman, S.A. (a) 100.0% 48 n
SPAIN (Registered office: Zaragoza, Spain)
Depusa Aragón S.A. (a) Project Cadagua, S.A. (a) 51.7% 2
GERMANY (Registered office: Cologne, Germany)
Budimex Bau GmbH Budimex SA 100.0% 0 ARABIA SAUDÍ (Registered office: Riyadh, Arabia Saudí) Ferrovial Agroman Company Ferrovial Agroman, S.A. (a) 95.0% 0 n
AUSTRALIA (Registered office: Sidney, Australia)
FA Australia PTY LTD Ferrovial Agroman Ltda. 100.0% 2 n
Brazil (Registered Office: Sao Paulo, Brazil)
Constructora Ferrovial Agroman Ltda. Ferrovial Agroman International, Ltd. (a) 99.0% 9
CANADA (Registered Office: Ontario, Canada)
F&A Canada Contsco Holdings B.V. 100.0% 8 n
CHILE (Registered Office: Santiago, Chile)
Constructora Agroman Ferrovial Ltda. Ferrovial Agroman Empresa Cons-tructora Ltda. 97.2% 0 n
Ferrovial Agroman Chile S.A. Ferrovial Agroman Empresa Cons-tructora Ltda. 100.0% 24 n
n Deloitten BDOn KPMGn El Sayed, El Ayouty & con Valdés, García, Marín & Martínez, Llp
n Morison Finansista Audit Sp. Z O.O.n Mohinder Puri & Companyn Ernst & Youngn Vir Audit
COMPANY TYPE OF COMPANY PARENT % OF
OWNERSHIP
NET COSTOF THE
OWNERSHIPINTEREST
AUDIT.
Ferrovial Agroman Empresa Constructora Ltda.
Ferrovial Agroman International, Ltd. (a) 100.0% 24 n
UNITED STATES (Registered Office: Atlanta, United States)
Ferrovial Agromán Southeast, LLC Ferrovial Agroman US Corp 100.0% 0 n
UNITED STATES (Registered Office: Austin, United States)
Ferrovial US Construction Corp Ferrovial Holding US 100.0% 346 n
Ferrovial Agroman Texas LLC Ferrovial Agroman US Corp 100.0% 0
Ferrovial Agroman Indiana Ferrovial Agroman US Corp 100.0% 0
Ferrovial Agroman 56 LLC Ferrovial Agroman Texas LLC 100.0% 0
Cadagua US, LLC Ferrovial US Construction Corp 100.0% 5
Grand Parkway Infrastructure SH99 Ferrovial Agroman Texas LLC 40.0% 0
Ferrovial Agroman US Corp Ferrovial US Construction Corp 100.0% 88 n
UNITED STATES (Registered Office: Charlotte, United States)
Sugar Creek Construction LLC Ferrovial Agroman Southeast, LLC 70.0% 0 n
UNITED STATES (Registered Office: Dallas, United States)
Trinity Infrastructure LLC Ferrovial Agroman Texas LLC 60.0% 0
UNITED STATES (Registered Office: Fort Worth, United States)
North Tarrant Infrastructures Ferrovial Agroman Texas LLC 75.0% 0 n
UNITED STATES (Registered Office: Georgia, United States)
North Perimeter Contractors LLC Ferrovial Agroman Southeast, LLC 100.0% 0 n
UNITED STATES (Registered Office: Katy, United States)
52 Block Builders Pepper Lawson Construction LP 100.0% 0
UNITED STATES (Registered Office: Los Angeles, United States)
California Rail Builders, LLC Ferrovial Agroman West, LLC 80.0% 0 n
Ferrovial Agroman West, LLC Ferrovial Agroman US Corp 100.0% (0)
Great Hall Builders LLC Ferrovial Agroman West, LLC 70.0%
UNITED STATES (Registered Office: North Richland Hills, United States)
Bluebonnet Constractor, LLC Ferrovial Agroman Texas LLC 60.0% 0
UNITED STATES (Registered Office: Sufolk, United States)
US 460 Mobility Partners LLC Ferrovial Agroman Southeast, LLC 70.0% 0
UNITED STATES (Registered Office: The Woodlands, United States)
Webber Management Group, LLC Webber Equipment & Materials LLC - Sucursal en España 100.0% 41
Southerm Crushed Concrete, LLC Webber Equipment & Materials LLC - Sucursal en España 100.0% 88
W.W. Webber LLC Ferrovial US Construction Corp. 100.0% 257 n
DBW Construction LLC W.W. Webber LLC 100.0% 0
Webber Barrier Services W.W. Webber, LLC 100.0% 5
Central Texas Mobility Partners W.W. Webber LLC 50.0% 0
Webber Holdings, LLC Ferrovial US Construction Corp. 100.0% 0
Katy Equipment LP W.W. Webber, LLC 99.0% 0
Pepper Lawson Waterworks, LLC W.W. Webber, LLC 50.0% 5
Pepper Lawson Construction LP W.W. Webber, LLC 99.0% 6
FAM Construction LLC (I-66) Ferrovial Agroman US Corp 70.0% 0 n
Webber Equipment & Materials LLC W.W. Webber, LLC 100.0% 192
SLOVAKIA (Registered Office: Bratislava, Slovakia)
Ferrovial Agroman Slovakia S.R.O. Ferrovial Agroman Ltda. 99.0% 3 n
D4R7 Construction S.R.O. Ferrovial Agroman Slovakia S.R.O. 65.0% 3 n
GERMANY (Registered Office: Cologne, Germany)
Budimex Bau GmbH Budimex, S.A. 100.0% 0
HOLAND (Registered Office: Amsterdam, Holand)
Valivala Holdings, B.V. Ferrovial Agroman International, Ltd. (a) 100.0% 141
Contsco Holdings B.V. Ferrovial Agroman International, Ltd. (a) 100.0% 8
INDIA (Registered Office: Nueva Delhi, India)
Cadagua Ferrovial India Cadagua, S.A. (a) 95.0% 0 n
IRELAND (Registered Office: Dublin, Irlanda)
Ferrovial Agroman Ireland, Ltd. Ferrovial Agroman Ltda. 100.0% 10 n
MEXICO (Registered Office: Mexico DF, Mexico)
Cadagua Ferr. Industrial México Cadagua, S.A. (a) 75.1% 0
Ferrovial Agroman México Ferrovial Agroman International, Ltd. (a) 100.0% 1
NEW ZELAND (Registered Office: Wellington, New Zeland)
FA New Zeland Limited FA Australia PTY LTD 100.0% 1
POLAND (Registered Office: Kraków, Poland)
Mostostal Kraków S.A. Budimex SA 100.0% 3 n
Mostostal Kraków Energetyka sp. z o.o. Mostostal Kraków SA 100.0% 0
POLAND (Registered Office: Poznań, Poland)
Elektromontaż Poznań SA Budimex SA 99.0% 10 n
Instal Polska Sp. z o.o. Elektromontaż Poznań SA 99.0% 0
POLAND (Registered Office: Warsaw, Poland)
Bx Budownictwo Sp. z o.o. Budimex SA 100.0% 0
Bx Kolejnictwo SA Budimex SA 100.0% 1 n
Bx Parking Wrocław Sp. z o.o. Project Budimex SA 100.0% 1 n
SPV-BN 1 Sp. z o.o. Budimex Nieruchomości Sp. z o.o. 100.0% 0
Bx Nieruchomości Sp. z o.o. Budimex SA 100.0% 159 n
(a) Form part of Ferrovial, S.A. tax frameworkand subsidiary companies.
APPENDIX II - SUBSIDIARIES(FULLY CONSOLIDATED COMPANIES ) (MILLIONS OF EUROS)
The participation percentage and the net cost of the ownership interest correspond to the present values of the “Parent Company” over the “Company”.
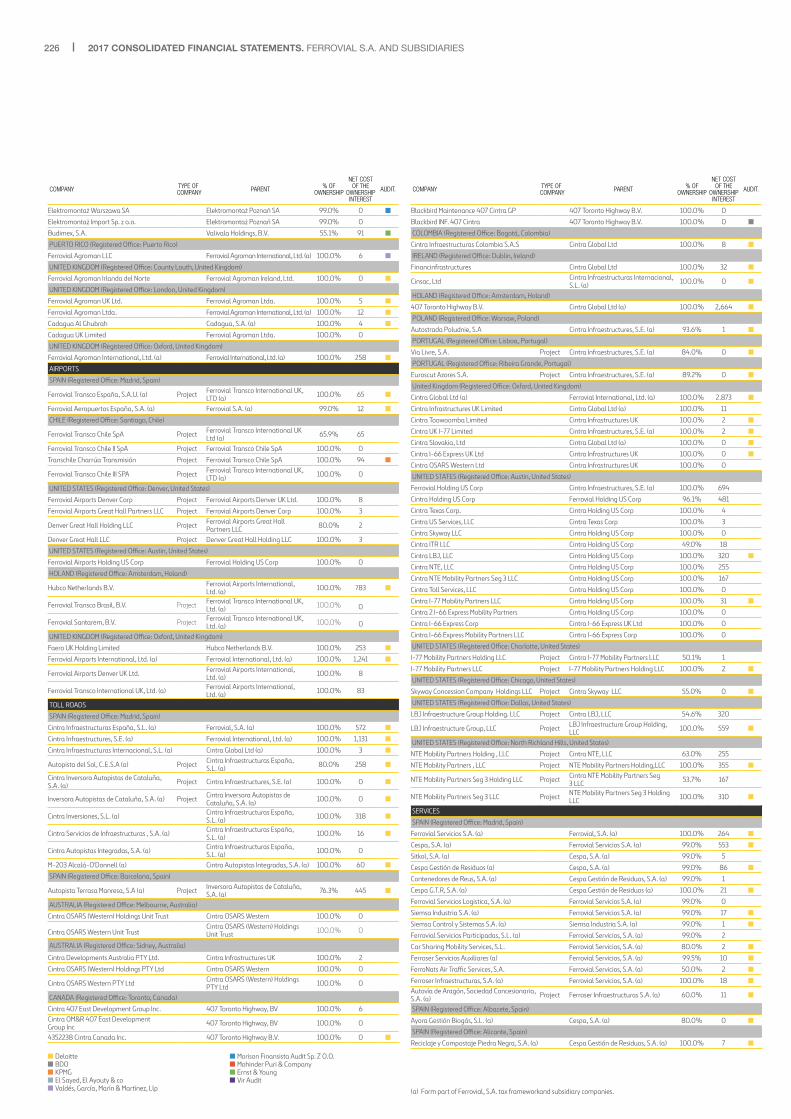
226 2017 CONSOLIDATED FINANCIAL STATEMENTS. FERROVIAL S.A. AND SUBSIDIARIES
COMPANY TYPE OF COMPANY PARENT % OF
OWNERSHIP
NET COSTOF THE
OWNERSHIPINTEREST
AUDIT.
Elektromontaż Warszawa SA Elektromontaż Poznań SA 99.0% 0 n
Elektromontaż Import Sp. z o.o. Elektromontaż Poznań SA 99.0% 0
Budimex, S.A. Valivala Holdings, B.V. 55.1% 91 n
PUERTO RICO (Registered Office: Puerto Rico)
Ferrovial Agroman LLC Ferrovial Agroman International, Ltd. (a) 100.0% 6 n
UNITED KINGDOM (Registered Office: County Louth, United Kingdom)
Ferrovial Agroman Irlanda del Norte Ferrovial Agroman Ireland, Ltd. 100.0% 0 n
UNITED KINGDOM (Registered Office: London, United Kingdom)
Ferrovial Agroman UK Ltd. Ferrovial Agroman Ltda. 100.0% 5 n
Ferrovial Agroman Ltda. Ferrovial Agroman International, Ltd. (a) 100.0% 12 n
Cadagua Al Ghubrah Cadagua, S.A. (a) 100.0% 4 n
Cadagua UK Limited Ferrovial Agroman Ltda. 100.0% 0
UNITED KINGDOM (Registered Office: Oxford, United Kingdom)
Ferrovial Agroman International, Ltd. (a) Ferrovial International, Ltd. (a) 100.0% 258 n
AIRPORTS
SPAIN (Registered Office: Madrid, Spain)
Ferrovial Transco España, S.A.U. (a) Project Ferrovial Transco International UK, LTD (a) 100.0% 65 n
Ferrovial Aeropuertos España, S.A. (a) Ferrovial S.A. (a) 99.0% 12 n
CHILE (Registered Office: Santiago, Chile)
Ferrovial Transco Chile SpA Project Ferrovial Transco International UK Ltd (a) 65.9% 65
Ferrovial Transco Chile II SpA Project Ferrovial Transco Chile SpA 100.0% 0
Transchile Charrúa Transmisión Project Ferrovial Transco Chile SpA 100.0% 94 n
Ferrovial Transco Chile III SPA Project Ferrovial Transco International UK, LTD (a) 100.0% 0
UNITED STATES (Registered Office: Denver, United States)
Ferrovial Airports Denver Corp Project Ferrovial Airports Denver UK Ltd. 100.0% 8
Ferrovial Airports Great Hall Partners LLC Project Ferrovial Airports Denver Corp 100.0% 3
Denver Great Hall Holding LLC Project Ferrovial Airports Great Hall Partners LLC 80.0% 2
Denver Great Hall LLC Project Denver Great Hall Holding LLC 100.0% 3
UNITED STATES (Registered Office: Austin, United States)
Ferrovial Airports Holding US Corp Ferrovial Holding US Corp 100.0% 0
HOLAND (Registered Office: Amsterdam, Holand)
Hubco Netherlands B.V. Ferrovial Airports International, Ltd. (a) 100.0% 783 n
Ferrovial Transco Brasil, B.V. Project Ferrovial Transco International UK, Ltd. (a) 100.0% 0
Ferrovial Santarem, B.V. Project Ferrovial Transco International UK, Ltd. (a) 100.0% 0
UNITED KINGDOM (Registered Office: Oxford, United Kingdom)
Faero UK Holding Limited Hubco Netherlands B.V. 100.0% 253 n
Ferrovial Airports International, Ltd. (a) Ferrovial International, Ltd. (a) 100.0% 1,241 n
Ferrovial Airports Denver UK Ltd. Ferrovial Airports International, Ltd. (a) 100.0% 8
Ferrovial Transco International UK, Ltd. (a) Ferrovial Airports International, Ltd. (a) 100.0% 83
TOLL ROADS
SPAIN (Registered Office: Madrid, Spain)
Cintra Infraestructuras España, S.L. (a) Ferrovial, S.A. (a) 100.0% 572 n
Cintra Infraestructures, S.E. (a) Ferrovial International, Ltd. (a) 100.0% 1,131 n
Cintra Infraestructuras Internacional, S.L. (a) Cintra Global Ltd (a) 100.0% 3 n
Autopista del Sol, C.E.S.A (a) Project Cintra Infraestructuras España, S.L. (a) 80.0% 258 n
Cintra Inversora Autopistas de Cataluña, S.A. (a) Project Cintra Infraestructures, S.E. (a) 100.0% 0 n
Inversora Autopistas de Cataluña, S.A. (a) Project Cintra Inversora Autopistas de Cataluña, S.A. (a) 100.0% 0 n
Cintra Inversiones, S.L. (a) Cintra Infraestructuras España, S.L. (a) 100.0% 318 n
Cintra Servicios de Infraestructuras , S.A. (a) Cintra Infraestructuras España, S.L. (a) 100.0% 16 n
Cintra Autopistas Integradas, S.A. (a) Cintra Infraestructuras España, S.L. (a) 100.0% 0
M-203 Alcalá-O'Donnell (a) Cintra Autopistas Integradas, S.A. (a) 100.0% 60 n
SPAIN (Registered Office: Barcelona, Spain)
Autopista Terrasa Manresa, S.A (a) Project Inversora Autopistas de Cataluña, S.A. (a) 76.3% 445 n
AUSTRALIA (Registered Office: Melbourne, Australia)
Cintra OSARS (Western) Holdings Unit Trust Cintra OSARS Western 100.0% 0
Cintra OSARS Western Unit Trust Cintra OSARS (Western) Holdings Unit Trust 100.0% 0
AUSTRALIA (Registered Office: Sidney, Australia)
Cintra Developments Australia PTY Ltd. Cintra Infrastructures UK 100.0% 2
Cintra OSARS (Western) Holdings PTY Ltd Cintra OSARS Western 100.0% 0
Cintra OSARS Western PTY Ltd Cintra OSARS (Western) Holdings PTY Ltd 100.0% 0
CANADA (Registered Office: Toronto, Canada)
Cintra 407 East Development Group Inc. 407 Toronto Highway, BV 100.0% 6 Cintra OM&R 407 East Development Group Inc 407 Toronto Highway, BV 100.0% 0
4352238 Cintra Canada Inc. 407 Toronto Highway B.V. 100.0% 0 n
COMPANY TYPE OF COMPANY PARENT % OF
OWNERSHIP
NET COSTOF THE
OWNERSHIPINTEREST
AUDIT.
Blackbird Maintenance 407 Cintra GP 407 Toronto Highway B.V. 100.0% 0
Blackbird INF. 407 Cintra 407 Toronto Highway B.V. 100.0% 0 n
COLOMBIA (Registered Office: Bogotá, Colombia)
Cintra Infraestructuras Colombia S.A.S Cintra Global Ltd 100.0% 8 n
IRELAND (Registered Office: Dublin, Ireland)
Financinfrastructures Cintra Global Ltd 100.0% 32 n
Cinsac, Ltd Cintra Infraestructuras Internacional, S.L. (a) 100.0% 0 n
HOLAND (Registered Office: Amsterdam, Holand)
407 Toronto Highway B.V. Cintra Global Ltd (a) 100.0% 2,664 n
POLAND (Registered Office: Warsaw, Poland)
Autostrada Poludnie, S.A Cintra Infraestructures, S.E. (a) 93.6% 1 n
PORTUGAL (Registered Office: Lisboa, Portugal)
Via Livre, S.A. Project Cintra Infraestructures, S.E. (a) 84.0% 0 n
PORTUGAL (Registered Office: Ribeira Grande, Portugal)
Euroscut Azores S.A. Project Cintra Infraestructures, S.E. (a) 89.2% 0 n
United Kingdom (Registered Office: Oxford, United Kingdom)
Cintra Global Ltd (a) Ferrovial International, Ltd. (a) 100.0% 2.873 n
Cintra Infrastructures UK Limited Cintra Global Ltd (a) 100.0% 11
Cintra Toowoomba Limited Cintra Infrastructures UK 100.0% 2 n
Cintra UK I-77 Limited Cintra Infraestructures, S.E. (a) 100.0% 2 n
Cintra Slovakia, Ltd Cintra Global Ltd (a) 100.0% 0 n
Cintra I-66 Express UK Ltd Cintra Infrastructures UK 100.0% 0 n
Cintra OSARS Western Ltd Cintra Infrastructures UK 100.0% 0
UNITED STATES (Registered Office: Austin, United States)
Ferrovial Holding US Corp Cintra Infraestructures, S.E. (a) 100.0% 694
Cintra Holding US Corp Ferrovial Holding US Corp 96.1% 481
Cintra Texas Corp. Cintra Holding US Corp 100.0% 4
Cintra US Services, LLC Cintra Texas Corp 100.0% 3
Cintra Skyway LLC Cintra Holding US Corp 100.0% 0
Cintra ITR LLC Cintra Holding US Corp 49.0% 18
Cintra LBJ, LLC Cintra Holding US Corp 100.0% 320 n
Cintra NTE, LLC Cintra Holding US Corp 100.0% 255
Cintra NTE Mobility Partners Seg 3 LLC Cintra Holding US Corp 100.0% 167
Cintra Toll Services, LLC Cintra Holding US Corp 100.0% 0
Cintra I-77 Mobility Partners LLC Cintra Holding US Corp 100.0% 31 n
Cintra 2 I-66 Express Mobility Partners Cintra Holding US Corp 100.0% 0
Cintra I-66 Express Corp Cintra I-66 Express UK Ltd 100.0% 0
Cintra I-66 Express Mobility Partners LLC Cintra I-66 Express Corp 100.0% 0
UNITED STATES (Registered Office: Charlotte, United States)
I-77 Mobility Partners Holding LLC Project Cintra I-77 Mobility Partners LLC 50.1% 1
I-77 Mobility Partners LLC Project I-77 Mobility Partners Holding LLC 100.0% 2 n
UNITED STATES (Registered Office: Chicago, United States)
Skyway Concession Company Holdings LLC Project Cintra Skyway LLC 55.0% 0 n
UNITED STATES (Registered Office: Dallas, United States)
LBJ Infraestructure Group Holding. LLC Project Cintra LBJ, LLC 54.6% 320
LBJ Infraestructure Group, LLC Project LBJ Infraestructure Group Holding, LLC 100.0% 559 n
UNITED STATES (Registered Office: North Richland Hills, United States)
NTE Mobility Partners Holding , LLC Project Cintra NTE, LLC 63.0% 255
NTE Mobility Partners , LLC Project NTE Mobility Partners Holding,LLC 100.0% 355 n
NTE Mobility Partners Seg 3 Holding LLC Project Cintra NTE Mobility Partners Seg 3 LLC 53.7% 167
NTE Mobility Partners Seg 3 LLC Project NTE Mobility Partners Seg 3 Holding LLC 100.0% 310 n
SERVICES
SPAIN (Registered Office: Madrid, Spain)
Ferrovial Servicios S.A. (a) Ferrovial, S.A. (a) 100.0% 264 n
Cespa, S.A. (a) Ferrovial Servicios S.A. (a) 99.0% 553 n
Sitkol, S.A. (a) Cespa, S.A. (a) 99.0% 5
Cespa Gestión de Residuos (a) Cespa, S.A. (a) 99.0% 86 n
Contenedores de Reus, S.A. (a) Cespa Gestión de Residuos, S.A. (a) 99.0% 1
Cespa G.T.R, S.A. (a) Cespa Gestión de Residuos (a) 100.0% 21 n
Ferrovial Servicios Logistica, S.A. (a) Ferrovial Servicios S.A. (a) 99.0% 0
Siemsa Industria S.A. (a) Ferrovial Servicios S.A. (a) 99.0% 17 n
Siemsa Control y Sistemas S.A. (a) Siemsa Industria S.A. (a) 99.0% 1 n
Ferrovial Servicios Participadas, S.L. (a) Ferrovial Servicios, S.A. (a) 99.0% 2
Car Sharing Mobility Services, S.L. Ferrovial Servicios, S.A. (a) 80.0% 2 n
Ferroser Servicios Auxiliares (a) Ferrovial Servicios, S.A. (a) 99.5% 10 n
FerroNats Air Traffic Services, S.A. Ferrovial Servicios, S.A. (a) 50.0% 2 n
Ferroser Infraestructuras, S.A. (a) Ferrovial Servicios, S.A. (a) 100.0% 18 n
Autovía de Aragón, Sociedad Concesionaria, S.A. (a) Project Ferroser Infraestructuras S.A. (a) 60.0% 11 n
SPAIN (Registered Office: Albacete, Spain)
Ayora Gestión Biogás, S.L. (a) Cespa, S.A. (a) 80.0% 0 n
SPAIN (Registered Office: Alicante, Spain)
Reciclaje y Compostaje Piedra Negra, S.A. (a) Cespa Gestión de Residuos, S.A. (a) 100.0% 7 n
n Deloitten BDOn KPMGn El Sayed, El Ayouty & con Valdés, García, Marín & Martínez, Llp
n Morison Finansista Audit Sp. Z O.O.n Mohinder Puri & Companyn Ernst & Youngn Vir Audit
(a) Form part of Ferrovial, S.A. tax frameworkand subsidiary companies.

227APPENDIX II - SUBSIDIARIES B
COMPANY TYPE OF COMPANY PARENT % OF
OWNERSHIP
NET COSTOF THE
OWNERSHIPINTEREST
AUDIT.
SPAIN (Registered Office: Almería, Spain)
Tecma, S.L. Albaida Residuos, S.L. (a) 55.0% 0
TRM, S.L. Albaida Residuos, S.L. (a) 55.0% 0
Spain (Registered Office: Barcelona, Spain)
Residus del Maresme, S.L. Cespa, S.A. (a) 51.0% 0 n
Ecoparc de Can Mata, S.L. (a) Project Cespa, S.A. (a) 99.0% 11 n
Ecoenergia de Can Mata A.I.E. Cespa, S.A. (a) 70.0% 0
Albaida Residuos, S.L. (a) Cespa Gestión de Residuos, S.A. (a) 99.0% 4
C.E.R.R. S.L. (a) Cespa Gestión de Residuos, S.A. (a) 81.1% 0
Ecoparc del Mediterrani Cespa Gestión de Residuos, S.A. (a) 48.0% 3 n
SPAIN (Registered Office: Bilbao, Spain)
Cespa Jardinería, S.L. (a) Cespa, S.A. (a) 99.0% 7 n
SPAIN (Registered Office: Cáceres, Spain)
Biogas Extremadura Biotran Gestion de Residuos, S.L.U (a) 51.0% 0
SPAIN (Registered Office: Granada, Spain)
Inagra, S.A. (a) Cespa, S.A. (a) 80.0% 3 n
SPAIN (Registered Office: Guipuzcoa, Spain)
Oneder S.A. Cespa Gestion de Residuos, S.A. (a) 51.6% 0
SPAIN (Registered Office: Málaga, Spain)
Andaluza de Señalizaciones, S.A. (a) Ferroser Infraestructuras (a) 99% 1
SPAIN(Registered Office: Murcia, Spain)
Cespa Serv. Urbanos Murcia (a) Project Cespa, S.A. (a) 100.0% 10 n
SPAIN (Registered Office: Pontevedra, Spain)
Maviva, S.A. Ferrovial Servicios Logistica, S.A. (a) 100.0% 12 n
Maviva Servicios Globales, S.L. Ferrovial Servicios Logistica, S.A. (a) 99.4% 1
Almacenes Servicios y Recuperaciones, S.L. Ferrovial Servicios Logistica, S.A. (a) 99.7% 3 n
SPAIN (Registered Office: Satander, Spain)
SMART Hospital Cantabria, SA (a) Project Ferrovial Servicios (a) 85.0% 8 n
SPAIN (Registered Office: Toledo, Spain)
Gestión Medioambiental de Toledo, S.A. Project Cespa, S.A. (a) 60.0% 8 n
SPAIN (Registered Office: Valladolid, Spain)
Biotran Gestión de Residuos (a) Cespa Gestión de Residuos, S.A. (a) 100.0% 11 n
Reciclum, Reciclaje y valorización de Residuos, S.L. (a) Biotran Gestión de Residuos (a) 100.0% 0
Maviva Valladolid, S.L. Ferrovial Servicios Logistica, S.A. (a) 99.7% 3
CHILE (Registered Office: Santiago, Chile)
Siemsa Chile SPA Siemsa Industria S.A. (a) 100.0% 0
Ferrovial Servicios Chile, S.L. Ferrovial Services International, Ltd. (a) 99.0% 12 n
Ferrovial Servicios Salud Ferrovial Servicios, S.A. (a) 99.0% 0 n
Ingenieria Ambiental y Servicios S.A. Broaspectrum Chile Spa 92.7% 0 n
Inversiones Broadspectrum (Chile) Holding Limitada Broadspectrum (international) Pty 100.0% 0
Inversiones Broadspectrum (Chile) Limitada Inversiones Broadspectrum (Chile) Holding Limitada 100.0% 0
CHILE (Registered Office: Los Andes, Chile)
Steel Ingeniería Ferrovial Servicios Chile, S.L. 100.0% 35 n
CHILE (Registered Office: Antofagasta, Chile)
Broadpsectrum Chile S.p.A. Inversiones Broadspectrum (Chile) Limitada 100.0% 0 n
MOROCCO (Registered Office: Tánger, Morocco)
Cespa Nadafa, S.A.R.L. Cespa, S.A. (a) 98.8% 0 PORTUGAL (Registered Office: Lisboa, Portugal)
Ferrovial Serviços, SA Ferrovial Services International, Ltd (a) 100.0% 21 n
Sopovico, SA Ferrovial Serviços, SA 100.0% 1 n
PORTUGAL (Registered Office: Porto, Portugal)
Maviva Portugalia Lda. Ferrovial Servicios Logistica, S.A. (a) 100.0% 1
Citrup, Lda Ferrovial Serviços, SA 70.0% 0 n
Ferrovial Serviços - Ecoambiente, ACE Ferrovial Serviços, SA 60.0% 0
AUSTRALIA (Registered Office: Melbourne, Australia)
Amey Consulting Australia Pty Ltd Amey OW Ltd 100.0% 0
AUSTRALIA (Registered Office: Sidney, Australia)
Ferrovial Services Consolidated PTY, Ltd. Ferrovial Services Australia PTY, Ltd. 100.0% 0
Amey Consulting Australia Pty Ltd Amey OW Ltd 100.0% 0
Ferrovial Services Consolidated PTY, Ltd. Ferrovial Services Australia PTY, Ltd. 100.0% 0
Ferrovial Services Australia PTY, Ltd. Ferrovial Services UK, Ltd. 100.0% 0 n
APP Corporation Pty Ltd Broadspectrum (Holdings) Pty Ltd 100.0% 2 n
Appoint Consulting Pty Ltd APP Corporation Pty Ltd 100.0% 0
Australian Drilling Solutions Pty Ltd Piver Pty Ltd 100.0% 0 Australian Quality Assurance & Superinten-dence Pty Ltd Appoint Consulting Pty Ltd 100.0% 0
BE & MG Pty Ltd Broadspectrum (Holdings) Pty Ltd 100.0% 0
BR & I Pty Ltd Broadspectrum (Holdings) Pty Ltd 100.0% 0 Broadspectrum (Asset Management Optimi-sation) Pty Ltd
Broadspectrum (International) Pty Ltd 100.0% 0
COMPANY TYPE OF COMPANY PARENT % OF
OWNERSHIP
NET COSTOF THE
OWNERSHIPINTEREST
AUDIT.
Broadspectrum (Australia) Pty Ltd Broadspectrum (Holdings) Pty Ltd 100.0% -2
Broadspectrum (Chile) Pty Ltd Broadspectrum (Holdings) Pty Ltd 100.0% 0
Broadspectrum (East Timor) Pty Ltd Broadspectrum (International) Pty Ltd 100.0% 0
Broadspectrum (Finance) Pty Ltd Broadspectrum (Holdings) Pty Ltd 100.0% 0
Broadspectrum (Holdings) Pty Ltd Broadspectrum Pty Ltd 100.0% 84
Broadspectrum (India) Pty Ltd Broadspectrum (International) Pty Ltd 100.0% 0
Broadspectrum (International) Pty Ltd Broadspectrum (Holdings) Pty Ltd 100.0% 81
Broadspectrum (IP) Holdings Pty Limited Broadspectrum (Holdings) Pty Ltd 100,0% 0
Broadspectrum (Oil and Gas) Pty Ltd Broadspectrum (Holdings) Pty Ltd 100,0% 0
Broadspectrum (USM) Holdings Pty Ltd Broadspectrum (International) Pty Ltd 100,0% 146
Broadspectrum Australia (QLD) Pty Ltd Broadspectrum (Holdings) Pty Ltd 100,0% 0
Broadspectrum Australia (WA) Pty Ltd Broadspectrum (Holdings) Pty Ltd 100,0% 0 Broadspectrum Holdings (Delaware) Pty Ltd LLC (Australian incorporation only)
Broadspectrum (International) Pty Ltd 100,0% 0
Broadspectrum Limited Broadspectrum Pty Ltd 100,0% 1,132 n
Broadspectrum Metrolink Pty Ltd Broadspectrum Pty Ltd 100,0% 0
Broadspectrum Property Pty Ltd Broadspectrum (Holdings) Pty Ltd 100,0% 0
Broadspectrum Protection Pty Ltd Broadspectrum (Holdings) Pty Ltd 100,0% 0
Broadspectrum Services Pty Ltd Broadspectrum (Holdings) Pty Ltd 100,0% 0
Broadspectrum Training Services Pty Ltd Easternwell Group Investments Pty Ltd 100,0% 0
BRS Employee Plan Co Pty Limited Broadspectrum (Holdings) Pty Ltd 100,0% 0
CI Australia Pty Limited APP Corporation Pty Ltd 100,0% 0
Collinsville Operations Pty Ltd Broadspectrum Pty Ltd 100,0% 0
Eastern Catering Services Holdings Pty Ltd Easternwell Group Investments Pty Ltd 100,0% 0
Eastern Catering Services Pty Ltd Eastern Catering Services Holdings Pty Ltd 100,0% 0
Eastern Pressure Control Pty Ltd Easternwell Group Investments Pty Ltd 51,0% 0
Eastern Well Rigs Pty Ltd Easternwell Drilling Holdings Pty Ltd 100,0% 0
Eastern Well Service No 2 Pty Ltd Easternwell Group Investments Pty Ltd 100,0% 0
Easternwell Drilling Holdings Pty Ltd Easternwell Group Investments Pty Ltd 100,0% 0
Easternwell Drilling Labour Hire Pty Ltd Easternwell Drilling Holdings Pty Ltd 100,0% 0
Easternwell Drilling Services Assets Pty Ltd Easternwell Drilling Services Holdings Pty Ltd 100,0% 1
Easternwell Drilling Services Holdings Pty Ltd Easternwell Drilling Holdings Pty Ltd 100,0% 1
Easternwell Drilling Services Labour Pty Ltd Easternwell Drilling Services Holdings Pty Ltd 100,0% 1
Easternwell Drilling Services Operations Pty Ltd
Easternwell Drilling Services Holdings Pty Ltd 100,0% 1
Easternwell Energy Rigs Pty Ltd Easternwell Drilling Holdings Pty Ltd 100,0% 0
Easternwell Engineering Pty Ltd Easternwell Group Investments Pty Ltd 100,0% 0
Easternwell Group Assets Pty Ltd Easternwell Group Investments Pty Ltd 100,0% 0
Easternwell Group Investments Pty Limited Piver Pty Ltd 100,0% 0
Easternwell Group Operations Pty Ltd Easternwell Group Investments Pty Ltd 100,0% 0
Easternwell Group Pty Ltd Broadspectrum (Oil and Gas) Pty Ltd 100,0% 256
Easternwell WA Pty Ltd Piver Pty Ltd 100,0% 0
Gorey & Cole Drillers Pty Ltd Gorey & Cole Holdings Pty Ltd 100,0% 0
Gorey & Cole Holdings Pty Ltd Piver Pty Ltd 100,0% 0
ICD (Asia Pacific) Pty Limited Broadspectrum (Australia) Pty Ltd 100,0% 0
O.G.C. Services Pty Ltd Easternwell Group Investments Pty Ltd 100,0% 0
Piver Pty Ltd Easternwell Group Pty Ltd 100,0% 0
Sides Drilling Contractors Pty Ltd Sides Drilling Pty Ltd 100,0% 0
Sides Drilling Pty Ltd Piver Pty Ltd 100,0% 0
Silver City Drilling (QLD) Pty Ltd Easternwell Group Investments Pty Ltd 100,0% 0
Ten Rivers Pty Ltd Broadspectrum (Holdings) Pty Ltd 100,0% 0
Transhare Plan Company Pty Ltd Broadspectrum (Holdings) Pty Ltd 100,0% 0
Translink Investments Pty Ltd Broadspectrum Pty Ltd 100,0% 0
TS (Procurement) Pty Ltd Broadspectrum (Holdings) Pty Ltd 100,0% 0
Silver City Drilling (QLD) Pty Ltd Easternwell Group Investments Pty Ltd 100,0% 0
Easternwell Drilling Services Holdings Pty Ltd Easternwell Drilling Holdings Pty Ltd 100,0% 1 n
Easternwell Drilling Services Assets Pty Ltd Easternwell Drilling Services Holdings Pty Ltd 100,0% 0 n
Easternwell Drilling Services Labour Pty Ltd Easternwell Drilling Services Holdings Pty Ltd 100,0% 0 n
Easternwell Drilling Services Operations Pty Ltd
Easternwell Drilling Services Holdings Pty Ltd 100,0% 0 n
UNITED KINGDOM (Registered Office: Oxford, United Kingdom)
Ferrovial Services International, Ltd. (a) Ferrovial International, Ltd. (a) 100,0% 562 n
Ferrovial Services UK, Ltd. Ferrovial Services International, Ltd. (a) 100,0% 521
Amey UK plc (a) Ferrovial Internacional, S.L.U. (a) 100,0% 794 n
(a) Form part of Ferrovial, S.A. tax frameworkand subsidiary companies.
n Deloitten BDOn KPMGn El Sayed, El Ayouty & con Valdés, García, Marín & Martínez, Llp
n Morison Finansista Audit Sp. Z O.O.n Mohinder Puri & Companyn Ernst & Youngn Vir Audit

228 2017 CONSOLIDATED FINANCIAL STATEMENTS. FERROVIAL S.A. AND SUBSIDIARIES
(a) Form part of Ferrovial, S.A. tax frameworkand subsidiary companies.
COMPANY TYPE OF COMPANY PARENT % OF
OWNERSHIP
NET COSTOF THE
OWNERSHIPINTEREST
AUDIT.
Cespa UK Ltd Cespa, S.A. (a) 100,0% 9 n
Cespa Ventures Ltd Cespa UK Ltd 100,0% 0 n
Amey Holdings Ltd Amey UK plc (a) 100,0% 569 n
Amey plc Amey Holdings Ltd 100,0% 569 n
Amey Environmental Services Ltd (formerly Amey Airports Limited) Amey plc 100,0% 0
Amey Building Ltd Amey plc 100,0% 1
Amey Community Ltd Amey plc 100,0% 62 n
Amey Construction Ltd Amey plc 100,0% 7 n
Amey Datel Ltd Amey OW Ltd 100,0% 0
Amey Facilities Partners Ltd Comax Holdings Ltd 100.0% 2
Amey Fleet Services Ltd Amey plc 100.0% 50 n
Amey Group Information Services Ltd Amey plc 100.0% 15 n
Amey Group Services Ltd Amey plc 100.0% 46 n
Amey Highways Ltd Amey plc 100.0% 0 n
Amey Investments Ltd Amey plc 100.0% 0 n
Amey IT Services Ltd Amey plc 100.0% 0 n
Amey LG Ltd Amey plc 100.0% 256 n
Amey LUL 2 Ltd Amey Tube Ltd 100.0% 7 n
Amey Mechanical & Electrical Services Ltd Amey Community Ltd 100.0% 1 n
Amey OW Group Ltd Amey plc 100.0% 35
Amey OW Ltd Amey OW Group Ltd 100.0% 2 n
Amey OWR Ltd Amey OW Group Ltd 100.0% 0 n
Amey Programme Management Ltd Amey plc 100.0% 0 n
Amey Rail Ltd Amey plc 100.0% 39 n
Amey Railways Holding Ltd Amey plc 100.0% 0
Amey Roads (North Lanarkshire) Ltd Amey LG Ltd 66.7% 0 n
Amey Services Ltd Amey plc 100.0% 180 n
Amey Technology Services Ltd Amey plc 100.0% 0
Amey Tramlink Ltd Amey Technololgy Services Ltd 100.0% 0
Amey Tube Ltd JNP Ventures Ltd 100.0% 8
Amey Ventures Asset Holdings Ltd Amey Investments Ltd 100.0% 0 n
Amey Ventures Ltd Amey plc 100.0% 6 n
Amey Ventures Management Services Ltd Amey Investments Ltd 100.0% 0 n
Amey Wye Valley Ltd Amey LG Ltd 80.0% 0 n
Comax Holdings Ltd Amey plc 100.0% 0
JNP Ventures 2 Ltd Amey Tube Ltd 100.0% 8
JNP Ventures Ltd Amey Ventures Ltd 100.0% 0
Sherard Secretariat Services Ltd Amey plc 100.0% 0 n
TPI Holdings Ltd Amey OW Ltd 100.0% 0
Transportation Planning International Ltd TPI Holdings Ltd 100.0% 0
Wimco Ltd Amey Railways Holding Ltd 100.0% 0
Amey Public Services LLP Amey LG Ltd 66.7% 0 n
Nationwide Distribution Services Ltd Amey LG Ltd 100.0% 5 n
AmeyCespa (MK) ODC Ltd AmeyCespa Ltd 100.0% 0 n
A.R.M. Services Group Ltd Enterprise Holding Company No 1 Ltd 100.0% 97 n
Access Hire Services Ltd Enterprise Managed Services Ltd 100.0% 4
Accord Asset Management Ltd Accord Ltd 100.0% 11
Accord Consulting Services Ltd Accord Ltd 100.0% 0
Accord Environmental Services Ltd Accord Ltd 100.0% 0
Accord Ltd Enterprise plc 100.0% 175 n
Accord Network Management Ltd Accord Asset Management Ltd 100.0% 1
Brophy Grounds Maintenance Ltd Enterprise Public Services Ltd 100.0% 5 n
Byzak Ltd Globemile Ltd 100.0% 9 n
Countrywide Property Inspections Ltd Durley Group Holdings Ltd 100.0% 0
CRW Maintenance Ltd Enterprise Holding Company No 1 Ltd 100.0% 0
Durley Group Holdings Ltd Enterprise Holding Company No 1 Ltd 100.0% 0
Enterprise (AOL) Ltd Accord Ltd 100.0% 92 n
Enterprise (ERS) Ltd Trinity Group Holdings Ltd 100.0% 0
Enterprise (Venture Partner) Ltd Enterprise Holding Company No 1 Ltd 100.0% 0 n
Enterprise Building Services Ltd Enterprise Holding Company No 1 Ltd 100.0% 0
Enterprise Foundation (ETR) Ltd Enterprise Holding Company No 1 Ltd 100.0% 0
Enterprise Holding Company No.1 Ltd Enterprise plc 100.0% 593 n
Enterprise Lighting Services Ltd Enterprise Holding Company No 1 Ltd 100.0% 0
Enterprise Managed Services (BPS) Ltd Enterprise Managed Services Ltd 100.0% 21
Amey Metering Ltd Enterprise Managed Services Ltd 100.0% 10 n
Enterprise Managed Services Ltd Amey Utility Services Ltd 100.0% 3 n
Enterprise plc Amey plc 100.0% 0 n
Amey Power Services Ltd Enterprise Managed Services Ltd 100.0% 11 n
Enterprise Public Services Ltd Enterprise Holding Company No 1 Ltd 100.0% 4 n
Amey Utility Services Ltd ARM Services Group Ltd 100.0% 49 n
Globemile Ltd Enterprise Managed Services Ltd 100.0% 20 n
Haringey Enterprise Ltd Accord Ltd 100.0% 0
COMPANY TYPE OF COMPANY PARENT % OF
OWNERSHIP
NET COSTOF THE
OWNERSHIPINTEREST
AUDIT.
Heating and Building Maintenance Company Ltd Enterprise Holding Company No 1 Ltd 100.0% 1 n
Hillcrest Developments (Yorkshire) Ltd Durley Group Holdings Ltd 100.0% 0
ICE Developments Ltd Enterprise Holding Company No 1 Ltd 100.0% 0
J J McGinley Ltd Enterprise Holding Company No 1 Ltd 100.0% 4
JDM Accord Ltd Accord Ltd 100.0% 2
MRS Environmental Services Ltd Enterprise Holding Company No 1 Ltd 100.0% 16 n
MRS St Albans Ltd MRS Environmental Services Ltd 100.0% 0
Trinity Group Holdings Ltd Enterprise Holding Company No 1 Ltd 100.0% 0
Enterprise Business Solutions 2000 Ltd Enterprise Holding Company No 1 Ltd 90.0% 0
Enterprise Islington Ltd Accord Ltd 99.0% 0
EnterpriseManchester Partnership Ltd Enterprise Managed Services Ltd 80.0% 0 n
Slough Enterprise Ltd Accord Environmental Services Ltd 100.0% 0 n
Enterprise Fleet Ltd Enterprise Managed Services Ltd 54.5% 0
AmeyCespa Ltd Amey LG Ltd 50.0% 0 n
AmeyCespa (East) Holdings Ltd AmeyCespa Ltd 100.0% 55 n
AmeyCespa Services (East) Ltd Project AmeyCespa (East) Ltd 100.0% 8 n
Allerton Waste Recovery Park Interim SPV Ltd AmeyCespa Ltd 100.0% 0
AmeyCespa (AWRP) ODC Ltd AmeyCespa Ltd 100.0% 0 n
AmeyCespa (East) Ltd AmeyCespa (East) Holdings Ltd 100.0% 0 n
AmeyCespa WM (East) Ltd Project AmeyCespa Services (East) Ltd 100.0% 0 n
Novo Community Ltd Amey Community Ltd 100.0% 0 n
Amey (IOW) SPV Ltd Amey Ventures Asset Holdings Ltd 100.0% 0 n
Amey TPT Limited Amey OWR Ltd 100.0% 6 n
Amey Finance Services Ltd Amey plc 100.0% 0 n
AmeyCespa (MK) Holding Co Ltd Project Amey Ventures Asset Holdings Ltd 50.0% 0 n
AmeyCespa (MK) SPV Ltd Project AmeyCespa (MK) Holding Co Ltd 100.0% 0 n
Amey MAP Services Limited Amey Investments Ltd 100.0% 0 Amey Equitix Smart Meters 1 Holdings Limited Amey Ventures Asset Holdings Ltd 100.0% 0
Amey Equitix Smart Meters 1 SPV Limited Amey Equitix Smart Meters 1 Holdings Limited 100.0% 0
UNITED KINGDOM (Registered Office: Glasgow, United Kingdom)
Byzak Contractors (Scotland) Ltd Byzak Ltd 100.0% 0
C.F.M Building Services Ltd Enterprise Managed Services Ltd 100.0% 4 n
UNITED KINGDOM(Registered Office: Liverpool, United Kingdom)
Fleet and Plant Hire Ltd Enterprise Managed Services Ltd 100.0% 0 n
UNITED KINGDOM(Registered Office: Londres, United Kingdom)
Station Solutions Ltd Amey TPT Limited 100.0% 0
UNITED KINGDOM (Registered Office: Manchester, United Kingdom)
Enterprise Utility Services (DCE) Ltd Enterprise Holding Company No 1 Ltd 100.0% 0
Enterprise Utility Services (TBC) Ltd Enterprise Holding Company No 1 Ltd 100.0% 0
UNITED STATES (Registered Office: Austin, United States) Broadspectrum Holdings (Delaware) Pty Ltd LLC
Broadspectrum (International) Pty Ltd 100.0% 0
Broadspectrum (Delaware) General Partnership
Broadspectrum Holdings (Delaware) Pty Ltd LLC 61.73% 0
Broadspectrum Americas, Inc. Broadspectrum (Delaware) General Partnership 100.0% 0
Broadspectrum Infrastructure, Inc. Broadspectrum Americas, Inc. 100.0% 0 n
Broadspectrum Oil and Gas, Inc. Broadspectrum Americas, Inc. 100.0% 0
Broadspectrum Downstream Services, Inc. Broadspectrum Oil and Gas, Inc. 100.0% 0
Broadspectrum Specialty Services, Inc. Broadspectrum Oil and Gas, Inc. 100.0% 0
HRI, Inc. Broadspectrum Oil and Gas, Inc. 100.0% 0
Broadspectrum Upstream Holdings, LLC Broadspectrum Oil and Gas, Inc. 100.0% 0
Broadspectrum Oilfields, LLC Broadspectrum Oil and Gas, Inc. 100.0% 0
T.R.S.C, Inc.. Broadspectrum Oil and Gas, Inc. 100.0% 1
Ferrovial Services Holding US Corp Ferrovial Holding US Corp 100.0% 0
UNITED STATES (Registered Office: Houston, United States)
Amey Consulting USA, Inc. Amey OW Ltd 100.0% 0
QATAR (Registered Office: Doha, Qatar)
Amey Consulting LLC Amey OW Ltd 49.0% 0
Transfield Services Mannai Oil and Gas WLL Broadspectrum (International) Pty Ltd 49.0% 0
UNITED ARAB EMIRATES (Registered Office: Dubai, UAE)
Ferrovial Technical Services Middle East LLC Ferrovial Services International LTD 85.0% 0
MALASIA (Registered Office: Kuala Lumpur, Malasia)
Transfield Services (Asia) Sdn Bhd Broadspectrum (International) Pty Ltd 100.0% 0
ISLAS MAURICIO (Registered Office: Cybercity, Islas Mauricio)
Broadspectrum (Mauritius) Ltd Broadspectrum (International) Pty Ltd 100.0% 0
NEW ZELAND (Registered Office: Auckland, New Zeland)
APP Corporation (New Zealand) Limited Broadspectrum (New Zealand) Limited 100.0% 1 n
Broadspectrum (New Zealand) Limited Broadspectrum (International) Pty Ltd 100.0% 119 n
TSNZ Pulp & Paper Maintenance Limited Broadspectrum (New Zealand) Limited 100.0% 0 n
POLAND (Registered Office: Warsaw, Poland)n Deloitten BDOn KPMGn El Sayed, El Ayouty & con Valdés, García, Marín & Martínez, Llp
n Morison Finansista Audit Sp. Z O.O.n Mohinder Puri & Companyn Ernst & Youngn Vir Audit

229BAPPENDIX II - ASSOCIATES
COMPANY TYPE OF COMPANY PARENT
% OF OWNERSHIP
EQUITY-ACCOUNTED
VALUE ASSETS LIABILITIES REVENUE PROFIT/
LOSS AUDITOR
CONSTRUCTION
SPAIN Sociedad Concesionaria BAIO Project Ferrovial Agroman,
S.A. 50.0% 2 9 0 0 -0
Via Olmedo Pedralba, S.A. Project Ferrovial Agroman,
S.A. 25.2% 1 11 6 10 -0 n
Boremer, S.A. Cadagua, S.A. 50.0% 0 20 21 12 -1 n
Urbs ludex Caudidicus, S.A.
Ferrovial Agroman, S.A. 22.0% 0 768 897 67 10 n
OMAN Muscat City Desalination O&M CO LLC Cadagua, S.A. 7.0% 0 14 4 20 5 n
International Water Treatment LLC Cadagua, S.A. 37.5% 0 6 13 7 3 n
UNITED STATESPepper Lawson Horizon Intl. Group
Pepper Lawson Construction LP 70.0% 0 4 3 1 -2
POLAND
PPHU Promos Sp. z o.o. Budimex, S.A. 26.3% 1 3 1 2 0
AIRPORTS
UNITED KINGDOM
FGP Topco Limited Project Hubco Netherlands B.V. 25.0% 737 22,416 19,458 3,295 346 n
AGS Airports Holdings Limited Project Faero UK Holding
Limited 50.0% 6 1,353 1,343 239 4 n
TOLL ROADS
SPAIN
Serrano Park, S.A. ProjectCintra Infraestructuras España, S.L.
50.0% -4 85 92 6 2 n
A66 Benavente - Zamora Project
Cintra Infraestructures, S.E.
25.0% 15 238 178 24 12 n
Bip & Drive S.A. ProjectCintra Infraestructuras España, S.L.
20.0% 2 20 11 206 -0 n
A-334 Autovía del Almanzora Project
Cintra Infraestructures, S.E.
23.8% 1 7 1 0 0 n
AUSTRALIA Nexus Infraestructures Holdings Unit Trust Project Cintra Toowoomba
LTD 40.0% 3 20 0 0 0 n
Nexus Infraestructures Unit Trust Project
Nexus Infraestructures Holdings Unit Trust
40.0% 10 80 47 2 3 n
Nexus Infraestrcuture Holdings PTY Limited Project Cintra Toowoomba
LTD 40.0% 0 0 0 0 0 n
Nexus Infraestructure PTY Limited Project
Nexus Infraestrcuture Holdings PTY Limited
40.0% 0 0 0 0 0 n
Netflow Osars (Western) PTY Ltd (a) Project Cintra Osars
(Western) Unit Trust 50.0% -1 0 0 0 0
CANADA
407 International Inc. Project 4352238 Cintra Canada Inc. 43.2% 1,652 3,737 6,018 859 319 n
407 East Development Group General Partnership
ProjectCintra 407 East Development Group Inc.
50.0% 12 145 120 6 3 n
OMR and R407 East Develpment Group General Partnership
ProjectCintra OM&R 407 East Development Group Inc
50.0% 1 5 2 4 1
Blackbird Maintenance 407 GP Project
Blackbird Maintenance 407 Cintra GP
50.0% 1 4 0 1 1
Blackbird Inf. 407 GP Project Blackbird Inf. 407 Cintra 50.0% 2 394 390 13 4 n
COLOMBIA
Ruta del Cacao ProjectCintra Infraestructuras Colombia
40.0% 9 139 117 22 -2 n
GREECE
Nea Odos, S.A. Project Ferrovial,S.A. 21.4% 0 1,053 947 91 0 n
Central Greece Motorway Project Ferrovial,S.A. 21.4% 0 1,264 1,316 20 0 n
Hellas Tolls Project Ferrovial,S.A. 33.3% 0 18 8 19 8
HOLAND
Algarve International B.V. Project
Cintra Infraestructures, S.E.
48.0% 1 175 173 0 0 n
IRELAND
Eurolink Motorway Operation (M4-M6), Ltd. Project
Cintra Infraestructuras Internacional, S.L.
20.0% 5 287 293 28 5 n
Eurolink Motorway Operation (M3), Ltd. Project Cinsac, Ltd 20.0% 1 208 203 23 7 n
PORTUGAL
Autoestrada do Algarve, S.A. Project
Cintra Infraestructures, S.E.
48.0% 55 232 176 37 15 n
Auto-Estradas Norte, S.A. Project
Cintra Infraestructures, S.E.
49.0% 93 375 238 44 21 n
n Deloitten BDOn KPMGn PWCn Grant Thornton UK LLP
n Vir Auditn Gabinete Técnico de Auditoría y Consultoría S.An Ernst & Youngn Martins Pereira, João Careca & Associados, SROC.
COMPANY TYPE OF COMPANY PARENT
% OF OWNERSHIP
EQUITY-ACCOUNTED
VALUE ASSETS LIABILITIES REVENUE PROFIT/
LOSS AUDITOR
SLOVAKIAZero Bypass Limited, Organizacna Zloska Project Zero Bypass
Limited 35.0% 2 219 205 9 3 n
UNITED KINGDOMScot Roads Partnership Holdings LTD Project Cintra
Infrastructures UK 20.0% 0 0 0 0 0 n
Scot Roads Partnership Finance LTD Project
Scot Roads Partnership Holdings LTD
20.0% 0 447 447 0 -0 n
Scot Roads Partnership Project LTD Project
Scot Roads Partnership Holdings LTD
20.0% 0 452 452 30 0 n
Zero Bypass Holdings Project Cintra Slovakia 35.0% 0 0 0 0 0 n
Zero Bypass Limited Project Zero Bypass Holdings 35.0% 0 0 0 0 0 n
UNITED STATES
I-66 Express Mobility Partners Holdings LLC Project
Cintra 1 I-66 Express Mobility Partners LLC/ Cintra 2 I-66 Express Mobility Partners LLC
50.0% 0 693 717 0 -25
I-66 Express Mobility Partners LLC Project
I-66 Express Mobility Partners Holdings LLC
50.0% -12 0 0 0 0 n
SERVICES
SPAIN
Nora, S.A. Cespa, S.A. 40.0% 1 10 8 10 -0 n
Vialnet Vic, S.L. Cespa, S.A. 49.0% 0 1 0 2 0 n
Recollida Residus Osona, S.L. Cespa, S.A. 45.0% 1 3 2 7 0 n
Inusa Ing. Urbana, S.A. Cespa, S.A. 35.0% 4 15 3 1 0 n
Valdemingomez 2000, S.A. Cespa, S.A. 20.0% 0 19 28 2 -4 n
Novalis Medio Ambiente, S.A.
Cespa Gestión de Residuos, S.A. 50.0% 0 3 4 0 -0
Valvení Soluciones para el desarrollo sostenible
Biotran Gestión de Residuos 50.0% 0 0 0 0 -0
Valoraciones Farmaceúticas, S.L.
Biotran Gestión de Residuos 50.0% 0 8 3 14 2
Empresa Mant. y Explotación M 30, S.A.
Ferrovial Servicios, S.A. 50.0% 2 203 199 27 11 n
Cocesionaria Madrid Calle 30 Project
Empresa Mant. y Explotación M 30, S.A.
20.0% 13 665 189 108 61 n
Necropolis Valladolid, S.A. Sitkol, S.A. 49.0% 4 18 11 4 0
Aetec, S.A.Ferroser Infraestructuras S.A.
9.2% 0 1 0 1 0 n
PORTUGAL
Valor Rib, Lda Ferrovial Serviços, SA 45.0% 1 4,2 3,0 1,9 -0,0
Ecobeirão, SA Ferrovial Serviços, SA 20.0% 0 19,2 18,9 7,1 0,0 n
Ferrovial Serviços, Egeo, ECAC, Gabvriel Couto, ACE
Ferrovial Serviços, SA 35.0% 0 0,0 0,0 0,0 0,0
UNITED KINGDOMParticipaciones Servicios Reino Unido 37
GEO Amey PECS Ltd Amey Community Ltd 50.0% 0 9 7 43 1 n
Amey Infrastructure Management (1) Ltd
Amey Ventures Asset Holdings Ltd 50.0% 0 15 15 0 0
Amey Ventures Investments Ltd
Amey Investments Ltd 10.0% 0 4 4 0 0 n
AHL Holdings (Manchester) Ltd Project Amey Ventures
Investments Ltd 50.0% 0 1 1 0 0 n
Amey Highways Lighting (Manchester) Ltd Project AHL Holdings
(Manchester) Ltd 50.0% 0 0 0 0 0 n
AHL Holdings (Wakefield) Ltd Project Amey Ventures
Investments Ltd 50.0% 0 1 1 0 0 n
Amey Highways Lighting (Wakefield) Ltd Project AHL Holdings
(Wakefield) Ltd 50.0% 0 0 0 0 0 n
ALC (Superholdco) Ltd Amey Ventures Investments Ltd 50.0% 0 11 10 16 5 n
ALC (FMC) Ltd ALC (Superholdco) Ltd 50.0% 0 0 0 0 0 n
ALC (Holdco) Ltd ALC (Superholdco) Ltd 50.0% 0 0 0 0 0 n
ALC (SPC) Ltd ALC (Holdco) Ltd 50.0% 0 0 0 0 0 n
Amey Belfast Schools Partnership Hold Co Ltd Project Amey Ventures
Investments Ltd 50.0% 0 11 11 1 0 n
Amey Belfast Schools Partnership PFI Co Ltd Project
Amey Belfast Schools Partnership Hold Co Ltd
50.0% 0 0 0 0 0 n
Amey Birmingham Highways Holdings Ltd Project Amey Ventures
Asset Holdings Ltd 33.3% 0 91 94 21 -0 n
Amey Birmingham Highways Ltd Project
Amey Birmingham Highways Holdings ltd
33.3% 0 0 0 0 0 n
Amey FMP Belfast Strategic Partnership Hold Co Ltd
ProjectAmey Ventures Management Services Ltd
70.0% 0 0 0 2 0 n
APPENDIX II - ASSOCIATES(COMPANIES ACCOUNTED FOR USING THE EQUITY METHOD) (MILLIONS OF EUROS)
The participation percentage and the consolidated equity-accounted value correspond to the contribution of each company to the group´s consolidated financial statements.

230 2017 CONSOLIDATED FINANCIAL STATEMENTS. FERROVIAL S.A. AND SUBSIDIARIES
COMPANY TYPE OF COMPANY PARENT
% OF OWNERSHIP
EQUITY-ACCOUNTED
VALUE ASSETS LIABILITIES REVENUE PROFIT/
LOSS AUDITOR Amey FMP Belfast Strategic Partnership SP Co Ltd
ProjectAmey FMP Belfast Schools Partnership Hold Co Ltd
100.0% 0 0 0 0 0 n
Amey Roads NI Holdings Ltd Project Amey Ventures
Investments Ltd 50.0% 0 14 14 1 0 n
Amey Roads NI Financial plc Project Amey Roads NI Ltd 50.0% 0 0 0 0 0 n
Amey Roads NI Ltd Project Amey Roads NI Holdings Ltd 50.0% 0 0 0 0 0 n
Amey Lighting (Norfolk) Holdings Ltd Project Amey Ventures
Investments Ltd 50.0% 0 3 3 1 0 n
Amey Lighting (Norfolk) Ltd Project
Amey Lighting (Norfolk) Holdings Ltd
50.0% 0 0 0 0 0 n
E4D&G Holdco Ltd Project Amey Ventures Investments Ltd 8.5% 0 10 9 1 0 n
E4D&G Project Co Ltd Project E4D&G Holdco Ltd 8.5% 0 0 0 0 0 n
EduAction (Waltham Forest) Ltd (IP) Amey plc 50.0% 0 0 -0 0 0
Integrated Bradford Hold Co One Ltd Project Amey Ventures
Investments Ltd 25.2% 0 4 4 0 0 n
Integrated Bradford Hold Co One Ltd Project Integrated Bradford
LEP Ltd 8.0% 0 0 0 0 0 n
Integrated Bradford PSP Ltd (IP) Project
Amey Infrastructure Management (1) Ltd
25.0% 0 0 0 0 0 n
Integrated Bradford Hold Co Two Ltd Project
Amey Infrastructure Management (1) Ltd
2.0% 0 6 6 1 0 n
Integrated Bradford Hold Co Two Ltd Project Integrated Bradford
LEP Ltd 4.0% 0 0 0 0 0 n
Integrated Bradford LEP Ltd Project Integrated Bradford
PSP Ltd 80.0% 0 1 0 0 0 n
Integrated Bradford LEP Fin Co One Ltd Project Integrated Bradford
LEP Ltd 80.0% 0 0 0 0 0 n
Integrated Bradford SPV One Ltd Project Integrated Bradford
Hold Co One Ltd 80.0% 0 0 0 0 0 n
Integrated Bradford SPV Two Ltd Project Integrated Bradford
Hold Co Two Ltd 80.0% 0 0 0 0 0 n
RSP (Holdings) Ltd Project Amey Ventures Investments Ltd 35.0% 0 4 4 0 0 n
The Renfrewshire Schools Partnership Ltd Project RSP (Holdings) Ltd 35.0% 0 0 0 0 0 n
Services Support (Avon & Somerset) Holdings Ltd Project Amey Ventures
Investments Ltd 20.0% 0 1 1 0 0 n
Services Support (Avon & Somerset) Ltd Project
Services Support (Avon & Somerset) Holdings Ltd
20.0% 0 0 0 0 0 n
Amey Hallam Highways Holdings Ltd Project Amey Ventures
Asset Holdings Ltd 33.3% 0 87 101 35 -2 n
Amey Hallam Highways Ltd Project
Amey Hallam Highways Holdings Ltd
33.3% 0 0 0 0 0 n
Carillion Amey Ltd Enterprise Managed Services Ltd 49.9% 0 32 29 152 1 n
Carillion Amey (Housing Prime) Ltd
Enterprise Managed Services Ltd 33.3% 0 47 42 62 -0 n
Ventia Boral Amey Qld Pty Ltd
Amey Consulting Australia Pty Ltd 20.0% 0 0 0 0 0 n
Ventia Boral Amey NSW Pty Ltd
Amey Consulting Australia Pty Ltd 22.2% 0 0 0 0 0 n
Keolis Amey Docklands Ltd Amey Rail Ltd 30.0% 0 21 17 27 1 n
Keolis Amey Metrolink Ltd Amey Rail Ltd 40.0% 0 1 0 12 1
AmeyVTOL Ltd Amey OWR Ltd 60.0% 0 0 0 0 0 AmeyCespa (AWRP) Holding Co Ltd Project Amey Ventures
Asset Holdings Ltd 17.0% 0 56 54 9 1 n
AmeyCespa (AWRP) Holding Co Ltd Project Cespa Ventures
Limited 17.0% 0 56 54 9 1 n
AmeyCespa (AWRP) SPV Ltd Project
AmeyCespa (AWRP) Holding Co Ltd
17.0% 0 0 0 0 0 n
Scot Roads Partnership Holdings Ltd Project Amey Ventures
Asset Holdings Ltd 20.0% 0 81 81 4 0 n
Scot Roads Partnership Project Ltd Project
Scot Roads Partnership Holdings Ltd
20.0% 0 0 0 0 0 n
Scot Roads Partnership Finance Ltd Project
Scot Roads Partnership Holdings Ltd
20.0% 0 0 0 0 0 n
MTCNovo Ltd Novo Community Ltd 50.0% 0 17 11 49 1 n
The Thames Valley Community Rehabilitiation Company Ltd
MTCNovo Ltd 50.0% 0 0 0 0 0 n
COMPANY TYPE OF COMPANY PARENT
% OF OWNERSHIP
EQUITY-ACCOUNTED
VALUE ASSETS LIABILITIES REVENUE PROFIT/
LOSS AUDITOR The London Community Rehabilitiation Company Ltd
MTCNovo Ltd 50.0% 0 0 0 0 0 n
AUSTRALIA Participaciones Servicios Australia 19
Skout Solutions (NZ) Limited
Broadspectrum (International) Pty Ltd
50.0% 0 0 0 -0 -0 n
BW Energy ServicesBroadspectrum (International) Pty Ltd
50.0% 0 6 2 -2 -0
TW Power Services Pty Ltd
Broadspectrum (Australia) Pty Limited
50.0% 0 62 29 -53 -1 n
Broadspectrum WorleyParsons JV (M) Sdn Bhd
Broadspectrum (Australia) Pty Limited
50.0% 0 1 0 -0 -0 n
Skout SolutionsBroadspectrum (Australia) Pty Limited
50.0% 0 3 2 -10 -1 n
TW New Cal JVBroadspectrum (Australia) Pty Limited
50.0% 0 0 0 0 0
QATAR
FMM Company LLC Ferrovial Servicios, S.A. 49.0% 11 46 24 97 11
Total equity-accounted value 2,687
n Deloitten BDOn KPMGn PWCn Grant Thornton UK LLP
n Vir Auditn Gabinete Técnico de Auditoría y Consultoría S.An Ernst & Youngn Martins Pereira, João Careca & Associados, SROC.

APPENDIX III Ɩ 231B
T The Board of Directors analyses the performance of the Group mainly from a business perspective. From this perspective, the Board assesses the performance of the Construction, Toll roads, Airports and Services segments. Set forth below are the consolidated statements of financial position and consolidated statements of profit or loss for 2017 and
the assets and/or liabilities and income and/or expenses of the companies not assigned to any of the business segments, including most notably the Parent, Ferrovial, S.A., and its smaller subsidiaries, the current Polish Real Estate business, and inter-segment adjustments.
Segment statement of financial position: 2017 (millions of euros)
ASSETS CONSTRUCTION TOLL ROADS AIRPORTS SERVICES OTHER ADJUSTMENTS TOTAL
Non-current assets 852 9,622 1,073 3,571 1,307 -1,498 14,927
Goodwill 198 140 40 1,684 0 0 2,062
Intangible assets 8 4 18 399 1 0 431
Investments in infrastructure projects 216 6,367 36 449 0 -151 6,917
Investment property 6 0 0 0 0 0 6
Property, plant and equipment 140 21 57 448 16 13 694
Investments in associates 4 1,848 742 92 0 0 2,687
Non-current financial assets 39 670 175 152 1,094 -1,361 769
Deferred tax assets 239 265 2 345 182 1 1,035
Non-current derivative financial instruments at fair value 2 307 2 0 14 0 326
Current assets 4,347 1,661 500 2,569 1,370 -2,384 8,063
Assets classified as held for sale 0 0 0 0 0 0 0
Inventories 233 10 0 71 311 5 629
Current income tax assets 44 46 11 29 48 -35 143
Current trade and other receivables 965 97 4 1,587 125 -143 2,635
Cash and cash equivalents 3,101 1,490 484 880 856 -2,210 4,601
Receivable from Group companies 9 109 174 192 0 -20 463
Other 3,091 1,381 311 688 856 -2,190 4,137
Current derivative financial instruments at fair value 4 19 0 2 30 0 55
Total assets 5,199 11,283 1,572 6,140 2,677 -3,882 22,990
Equity and liabilities CONSTRUCTION TOLL ROADS AIRPORTS SERVICES OTHER ADJUSTMENTS TOTAL
Equity 1,474 4,395 1,314 1,658 -2,598 -8 6,234
Equity attributable to the shareholders 1,403 3,822 1,314 1,639 -2,675 -1 5,503
Equity attributable to non-controlling interests 71 572 1 19 76 -7 731
Deferred income 2 1,012 0 22 0 0 1,037
Non-current liabilities 666 5,687 238 2,076 2,566 -1,362 9,871
Pension plan deficit 3 0 0 64 0 0 66
Long-term provisions 113 172 0 376 147 0 808
Borrowings 438 4,671 234 1,222 2,307 -1,361 7,511
Debt securities and bank borrowings of infrastructure projects
154 4,640 234 335 0 0 5,363
Debt securities and borrowings excluding infrastructure projects
284 31 0 887 2,307 -1,361 2,149
Other payables 10 119 0 70 -1 0 198
Deferred tax liabilities 85 423 4 294 95 0 900
Derivative financial instruments at fair value 17 302 0 50 17 0 387
Current liabilities 3,057 189 20 2,384 2,710 -2,512 5,848
Liabilities classified as held for sale 0 0 0 0 0 0 0
Borrowings 38 93 20 611 2,285 -2,209 839
Debt securities and bank borrowings of infrastructure projects
4 28 3 178 0 -5 207
Debt securities and bank borrowings excluding infrastructure projects
34 64 17 434 2,285 -2,203 631
Current derivative financial instruments at fair value 4 57 0 1 3 0 65
Current income tax liabilities 15 -56 -8 26 152 -35 94
Current trade and other payables 2,567 95 7 1,559 270 -277 4,221
Operating provisions and allowances 432 0 0 186 0 9 629
Total equity and liabilities 5,199 11,283 1,572 6,140 2,677 -3,882 22,990
APPENDIX III. SEGMENT REPORTING
APPENDIX III

232 Ɩ 2017 CONSOLIDATED FINANCIAL STATEMENTS. FERROVIAL, S.A. AND SUBSIDIARIES
APPENDIX III B
Segment statement of financial position: 2016 (millions of euros)
ASSETS CONSTRUCTION TOLL ROADS AIRPORTS SERVICES OTHER ADJUSTMENTS TOTAL
Non-current assets 876 9,880 1,199 3,857 1,369 -1,502 15,679
Goodwill 210 170 45 1,731 0 0 2,155
Intangible assets 8 5 21 509 1 0 544
Investments in infrastructure projects 209 6,613 2 489 0 -167 7,145
Investment property 6 0 0 0 0 0 6
Property, plant and equipment 130 16 66 481 21 17 731
Investments in associates 8 1,931 836 99 0 0 2,874
Non-current financial assets 26 547 224 167 1,124 -1,354 735
Deferred tax assets 279 285 3 299 190 1 1,057
Non-current derivative financial instruments at fair value 1 314 3 82 32 0 432
Current assets 4,336 2,186 303 2,536 1,613 -3,228 7,745
Assets classified as held for sale 0 624 0 0 0 0 624
Inventories 184 8 0 56 266 2 516
Current income tax assets 22 63 10 37 121 -67 186
Current trade and other receivables 870 170 4 1,855 119 -196 2,822
Cash and cash equivalents 3,256 1,311 289 588 1,102 -2,967 3,578
Receivable from Group companies 15 86 145 157 0 -126 277
Other 3,241 1,225 144 430 1,102 -2,841 3,301
Current derivative financial instruments at fair value 4 10 0 0 5 0 18
Total assets 5,211 12,066 1,502 6,393 2,981 -4,730 23,423
EQUITY AND LIABILITIES CONSTRUCTION TOLL ROADS AIRPORTS SERVICES OTHER ADJUSTMENTS TOTAL
Equity 1,559 4,405 1,241 1,766 -2,647 -10 6,314
Equity attributable to the shareholders 1,547 3,775 1,241 1,750 -2,712 -3 5,597
Equity attributable to non-controlling interests 12 630 0 17 65 -7 717
Deferred income 0 1,089 0 29 0 0 1,118
Non-current liabilities 674 5,868 72 2,559 2,603 -1,353 10,421
Pension plan deficit 2 0 0 173 0 0 174
Long-term provisions 140 163 0 310 144 0 757
Borrowings 419 4,759 67 1,630 2,359 -1,359 7,874
Debt securities and bank borrowings of infrastructure projects
143 4,738 67 362 0 0 5,310
Debt securities and borrowings excluding infrastructure projects
276 21 0 1,269 2,359 -1,359 2,564
Other payables 11 110 0 74 0 6 200
Deferred tax liabilities 82 489 5 307 96 0 979
Derivative financial instruments at fair value 20 347 0 65 4 0 436
Current liabilities 2,979 705 189 2,039 3,025 -3,366 5,570
Liabilities classified as held for sale 0 440 0 0 0 0 440
Borrowings 2 124 191 327 2,626 -2,968 302
Debt securities and bank borrowings of infrastructure projects
4 22 109 175 0 -111 200
Debt securities and bank borrowings excluding infrastructure projects
-2 102 82 152 2,626 -2,858 102
Current derivative financial instruments at fair value 3 58 0 2 6 0 69
Current income tax liabilities 83 -26 -10 27 143 -67 150
Current trade and other payables 2,351 108 7 1,519 250 -340 3,895
Operating provisions and allowances 540 0 1 164 0 9 715
Total equity and liabilities 5,211 12,066 1,502 6,393 2,981 -4,730 23,423
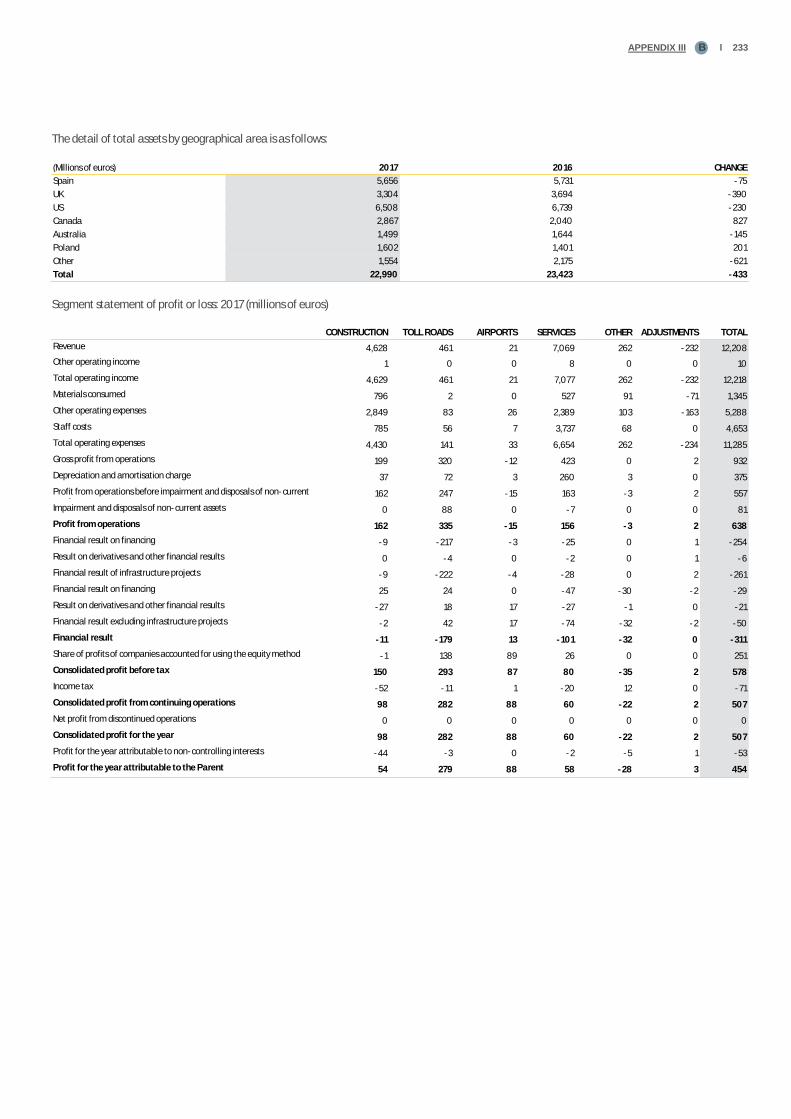
APPENDIX III Ɩ 233B
The detail of total assets by geographical area is as follows:
(Millions of euros) 2017 2016 CHANGE
Spain 5,656 5,731 -75
UK 3,304 3,694 -390
US 6,508 6,739 -230
Canada 2,867 2,040 827
Australia 1,499 1,644 -145
Poland 1,602 1,401 201
Other 1,554 2,175 -621
Total 22,990 23,423 -433
Segment statement of profit or loss: 2017 (millions of euros)
CONSTRUCTION TOLL ROADS AIRPORTS SERVICES OTHER ADJUSTMENTS TOTAL
Revenue 4,628 461 21 7,069 262 -232 12,208
Other operating income 1 0 0 8 0 0 10
Total operating income 4,629 461 21 7,077 262 -232 12,218
Materials consumed 796 2 0 527 91 -71 1,345
Other operating expenses 2,849 83 26 2,389 103 -163 5,288
Staff costs 785 56 7 3,737 68 0 4,653
Total operating expenses 4,430 141 33 6,654 262 -234 11,285
Gross profit from operations 199 320 -12 423 0 2 932
Depreciation and amortisation charge 37 72 3 260 3 0 375
Profit from operations before impairment and disposals of non-current assets
162 247 -15 163 -3 2 557
Impairment and disposals of non-current assets 0 88 0 -7 0 0 81
Profit from operations 162 335 -15 156 -3 2 638
Financial result on financing -9 -217 -3 -25 0 1 -254
Result on derivatives and other financial results 0 -4 0 -2 0 1 -6
Financial result of infrastructure projects -9 -222 -4 -28 0 2 -261
Financial result on financing 25 24 0 -47 -30 -2 -29
Result on derivatives and other financial results -27 18 17 -27 -1 0 -21
Financial result excluding infrastructure projects -2 42 17 -74 -32 -2 -50
Financial result -11 -179 13 -101 -32 0 -311
Share of profits of companies accounted for using the equity method -1 138 89 26 0 0 251
Consolidated profit before tax 150 293 87 80 -35 2 578
Income tax -52 -11 1 -20 12 0 -71
Consolidated profit from continuing operations 98 282 88 60 -22 2 507
Net profit from discontinued operations 0 0 0 0 0 0 0
Consolidated profit for the year 98 282 88 60 -22 2 507
Profit for the year attributable to non-controlling interests -44 -3 0 -2 -5 1 -53
Profit for the year attributable to the Parent 54 279 88 58 -28 3 454
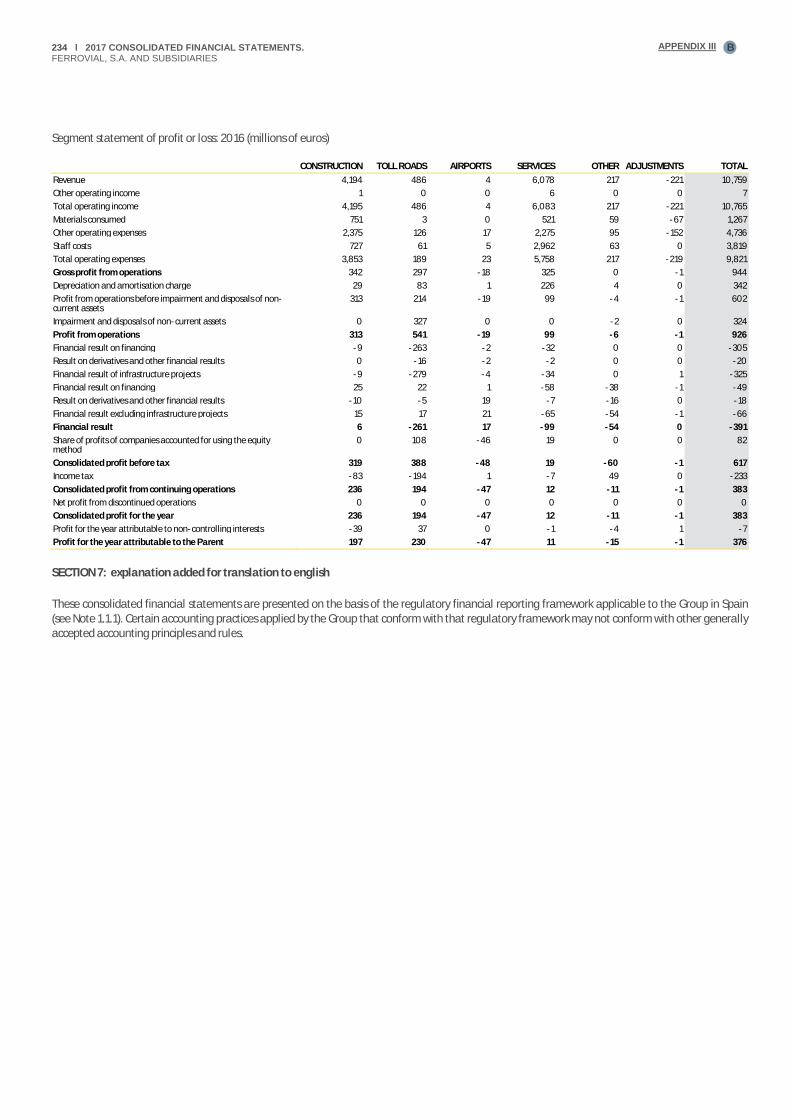
234 Ɩ 2017 CONSOLIDATED FINANCIAL STATEMENTS. FERROVIAL, S.A. AND SUBSIDIARIES
APPENDIX III B
Segment statement of profit or loss: 2016 (millions of euros)
CONSTRUCTION TOLL ROADS AIRPORTS SERVICES OTHER ADJUSTMENTS TOTAL
Revenue 4,194 486 4 6,078 217 -221 10,759
Other operating income 1 0 0 6 0 0 7
Total operating income 4,195 486 4 6,083 217 -221 10,765
Materials consumed 751 3 0 521 59 -67 1,267
Other operating expenses 2,375 126 17 2,275 95 -152 4,736
Staff costs 727 61 5 2,962 63 0 3,819
Total operating expenses 3,853 189 23 5,758 217 -219 9,821
Gross profit from operations 342 297 -18 325 0 -1 944
Depreciation and amortisation charge 29 83 1 226 4 0 342
Profit from operations before impairment and disposals of non-current assets
313 214 -19 99 -4 -1 602
Impairment and disposals of non-current assets 0 327 0 0 -2 0 324
Profit from operations 313 541 -19 99 -6 -1 926
Financial result on financing -9 -263 -2 -32 0 0 -305
Result on derivatives and other financial results 0 -16 -2 -2 0 0 -20
Financial result of infrastructure projects -9 -279 -4 -34 0 1 -325
Financial result on financing 25 22 1 -58 -38 -1 -49
Result on derivatives and other financial results -10 -5 19 -7 -16 0 -18
Financial result excluding infrastructure projects 15 17 21 -65 -54 -1 -66
Financial result 6 -261 17 -99 -54 0 -391
Share of profits of companies accounted for using the equity method
0 108 -46 19 0 0 82
Consolidated profit before tax 319 388 -48 19 -60 -1 617
Income tax -83 -194 1 -7 49 0 -233
Consolidated profit from continuing operations 236 194 -47 12 -11 -1 383
Net profit from discontinued operations 0 0 0 0 0 0 0
Consolidated profit for the year 236 194 -47 12 -11 -1 383
Profit for the year attributable to non-controlling interests -39 37 0 -1 -4 1 -7
Profit for the year attributable to the Parent 197 230 -47 11 -15 -1 376
SECTION 7: explanation added for translation to english
These consolidated financial statements are presented on the basis of the regulatory financial reporting framework applicable to the Group in Spain (see Note 1.1.1). Certain accounting practices applied by the Group that conform with that regulatory framework may not conform with other generally accepted accounting principles and rules.
PHOTO: Montabliz viaduct. Santander (Spain).
236 2017 CONSOLIDATED FINANCIAL STATEMENTS. FERROVIAL S.A. AND SUBSIDIARIES
The foregoing pages contain the consolidated financial statements –the balance sheet, income statement, statement of changes in equity, statement of cash flows and notes to the financial statements- and the consolidated management report of Ferrovial, S.A. for the year ended 31 December 2017, which were approved by the Board of Directors of Ferrovial, S.A. at the meeting held in Madrid on 28 February 2018 and which, pursuant to Article 253 of the Spanish Capital Companies Act, the directors attending sign below.
_________________________________Mr. Rafael del Pino y Calvo-SoteloChairman
_________________________________Mr. Santiago Bergareche BusquetVice-Chairman
_________________________________Mr. Joaquín Ayuso GarcíaVice-Chairman
_________________________________Mr. Íñigo Meirás AmuscoChief Executive Officer
_________________________________Mr. Juan Arena de la Mora Director
_________________________________Ms. María del Pino y Calvo-SoteloDirector
_________________________________Mr. Santiago Fernández ValbuenaDirector
_________________________________Mr. José Fernando Sánchez-Junco MansDirector
_________________________________Mr. Joaquín del Pino y Calvo-SoteloDirector
_________________________________Mr. Óscar Fanjul MartínDirector
_________________________________Mr. Philip BowmanDirector
_________________________________Ms. Hanne Birgitte Breinbjerg Sørensen Director
ISSUE OF THE FINANCIAL STATEMENTS
237CONSOLIDATED FINANCIAL STATEMENTS B
FOTO: EDAR de Benz, A Coruña (España)
AUDITORS REPORT

238 2017 CONSOLIDATED FINANCIAL STATEMENTS. FERROVIAL S.A. AND SUBSIDIARIES
239CONSOLIDATED FINANCIAL STATEMENTS B
FOTO: EDAR de Benz, A Coruña (España)
240 2017 CONSOLIDATED FINANCIAL STATEMENTS. FERROVIAL S.A. AND SUBSIDIARIES
241CONSOLIDATED FINANCIAL STATEMENTS B
FOTO: EDAR de Benz, A Coruña (España)
242 2017 CONSOLIDATED FINANCIAL STATEMENTS. FERROVIAL S.A. AND SUBSIDIARIES

243CONSOLIDATED FINANCIAL STATEMENTS B
FOTO: EDAR de Benz, A Coruña (España)

244 2017 CONSOLIDATED FINANCIAL STATEMENTS. FERROVIAL S.A. AND SUBSIDIARIES

245CONSOLIDATED FINANCIAL STATEMENTS B
FOTO: EDAR de Benz, A Coruña (España)