consolidated state performance … state performance report: parts i and ii for state formula grant...
TRANSCRIPT
CONSOLIDATED STATE PERFORMANCE REPORT: Parts I and II
for STATE FORMULA GRANT PROGRAMS
under the ELEMENTARY AND SECONDARY EDUCATION ACT
As amended in 2001
For reporting on School Year 2014-15
VIRGINIA
PART I DUE THURSDAY, DECEMBER 17, 2015 PART II DUE THURSDAY, FEBRUARY 11, 2016
U.S. DEPARTMENT OF EDUCATION WASHINGTON, DC 20202
INTRODUCTION
Sections 9302 and 9303 of the Elementary and Secondary Education Act (ESEA), as amended in 2001 provide to States the option of applying for and reporting on multiple ESEA programs through a single consolidated application and report. Although a central, practical purpose of the Consolidated State Application and Report is to reduce "red tape" and burden on States, the Consolidated State Application and Report are also intended to have the important purpose of encouraging the integration of State, local, and ESEA programs in comprehensive planning and service delivery and enhancing the likelihood that the State will coordinate planning and service delivery across multiple State and local programs. The combined goal of all educational agencies–State, local, and Federal–is a more coherent, well-integrated educational plan that will result in improved teaching and learning. The Consolidated State Application and Report includes the following ESEA programs:
OMB NO. 1810-0724 Page 2
o Title I, Part A – Improving Basic Programs Operated by Local Educational Agencies
o Title I, Part B, Subpart 3 – William F. Goodling Even Start Family Literacy Programs
o Title I, Part C – Education of Migratory Children (Includes the Migrant Child Count)
o Title I, Part D – Prevention and Intervention Programs for Children and Youth Who Are Neglected, Delinquent, or At-Risk
o Title II, Part A – Improving Teacher Quality State Grants (Teacher and Principal Training and Recruiting Fund)
o Title III, Part A – English Language Acquisition, Language Enhancement, and Academic Achievement Act
o Title IV, Part A, Subpart 1 – Safe and Drug-Free Schools and Communities State Grants
o Title IV, Part A, Subpart 2 – Safe and Drug-Free Schools and Communities National Activities (Community Service Grant Program)
o Title V, Part A – Innovative Programs
o Title VI, Section 6111 – Grants for State Assessments and Related Activities
o Title VI, Part B – Rural Education Achievement Program
o Title X, Part C – Education for Homeless Children and Youths

The ESEA Consolidated State Performance Report (CSPR) for school year (SY) 2014-15 consists of two Parts, Part I and Part II. PART I Part I of the CSPR requests information related to the five ESEA Goals, established in the June 2002 Consolidated State Application, and information required for the Annual State Report to the Secretary, as described in Section 1111(h)(4) of the ESEA. The five ESEA Goals established in the June 2002 Consolidated State Application are:
Beginning with the CSPR SY 2005-06 collection, the Education of Homeless Children and Youths was added. The Migrant Child count was added for the SY 2006-07 collection.
PART II
Part II of the CSPR consists of information related to State activities and outcomes of specific ESEA programs. While the information requested varies from program to program, the specific information requested for this report meets the following criteria:
1. The information is needed for Department program performance plans or for other program needs. 2. The information is not available from another source, including program evaluations pending full implementation
of required EDFacts submission. 3. The information will provide valid evidence of program outcomes or results.
OMB NO. 1810-0724 Page 3
� Performance Goal 1: By SY 2014-15, all students will reach high standards, at a minimum attaining proficiency or better in reading/language arts and mathematics.
� Performance Goal 2: All limited English proficient students will become proficient in English and reach high academic standards, at a minimum attaining proficiency or better in reading/language arts and mathematics.
� Performance Goal 3: By SY 2005-06, all students will be taught by highly qualified teachers.
� Performance Goal 4: All students will be educated in learning environments that are safe, drug free, and conducive to learning.
� Performance Goal 5: All students will graduate from high school.

GENERAL INSTRUCTIONS AND TIMELINES
All States that received funding on the basis of the Consolidated State Application for the SY 2014-15 must respond to this Consolidated State Performance Report (CSPR). Part I of the Report is due to the Department by Thursday, December 17, 2015. Part II of the Report is due to the Department by Thursday, February 11, 2016. Both Part I and Part II should reflect data from the SY 2014-15, unless otherwise noted. The format states will use to submit the Consolidated State Performance Report has changed to an online submission starting with SY 2004-05. This online submission system is being developed through the Education Data Exchange Network (EDEN) and will make the submission process less burdensome. Please see the following section on transmittal instructions for more information on how to submit this year's Consolidated State Performance Report.
TRANSMITTAL INSTRUCTIONS The Consolidated State Performance Report (CSPR) data will be collected online from the SEAs, using the EDEN web site. The EDEN web site will be modified to include a separate area (sub-domain) for CSPR data entry. This area will utilize EDEN formatting to the extent possible and the data will be entered in the order of the current CSPR forms. The data entry screens will include or provide access to all instructions and notes on the current CSPR forms; additionally, an effort will be made to design the screens to balance efficient data collection and reduction of visual clutter. Initially, a state user will log onto EDEN and be provided with an option that takes him or her to the "SY 2014-15 CSPR". The main CSPR screen will allow the user to select the section of the CSPR that he or she needs to either view or enter data. After selecting a section of the CSPR, the user will be presented with a screen or set of screens where the user can input the data for that section of the CSPR. A user can only select one section of the CSPR at a time. After a state has included all available data in the designated sections of a particular CSPR Part, a lead state user will certify that Part and transmit it to the Department. Once a Part has been transmitted, ED will have access to the data. States may still make changes or additions to the transmitted data, by creating an updated version of the CSPR. Detailed instructions for transmitting the SY 2014-15 CSPR will be found on the main CSPR page of the EDEN web site (https://EDEN.ED.GOV/EDENPortal/).
OMB NO. 1810-0724 Page 4
OMB NO. 1810-0724 Page 5
OMB Number: 1810-0724 Expiration Date: 5/31/2018
Consolidated State Performance Report For
State Formula Grant Programs under the
Elementary And Secondary Education Act as amended in 2001
Check the one that indicates the report you are submitting: Part I, 2014-15 X Part II, 2014-15
Name of State Educational Agency (SEA) Submitting This Report: Address:
Person to contact about this report: Name: Telephone: Fax: e-mail: Name of Authorizing State Official: (Print or Type):
Signature Date
CONSOLIDATED STATE PERFORMANCE REPORT PART II
For reporting on School Year 2014-15
PART II DUE FEBRUARY 11, 2016 5PM EST
OMB NO. 1810-0724 Page 6
2.1 IMPROVING BASIC PROGRAMS OPERATED BY LOCAL EDUCATIONAL AGENCIES (TITLE I, PART A) This section collects data on Title I, Part A programs. 2.1.1 Student Achievement in Schools with Title I, Part A Programs The following sections collect data on student academic achievement on the State's assessments in schools that receive Title I, Part A funds and operate either Schoolwide programs or Targeted Assistance programs.
OMB NO. 1810-0724 Page 7
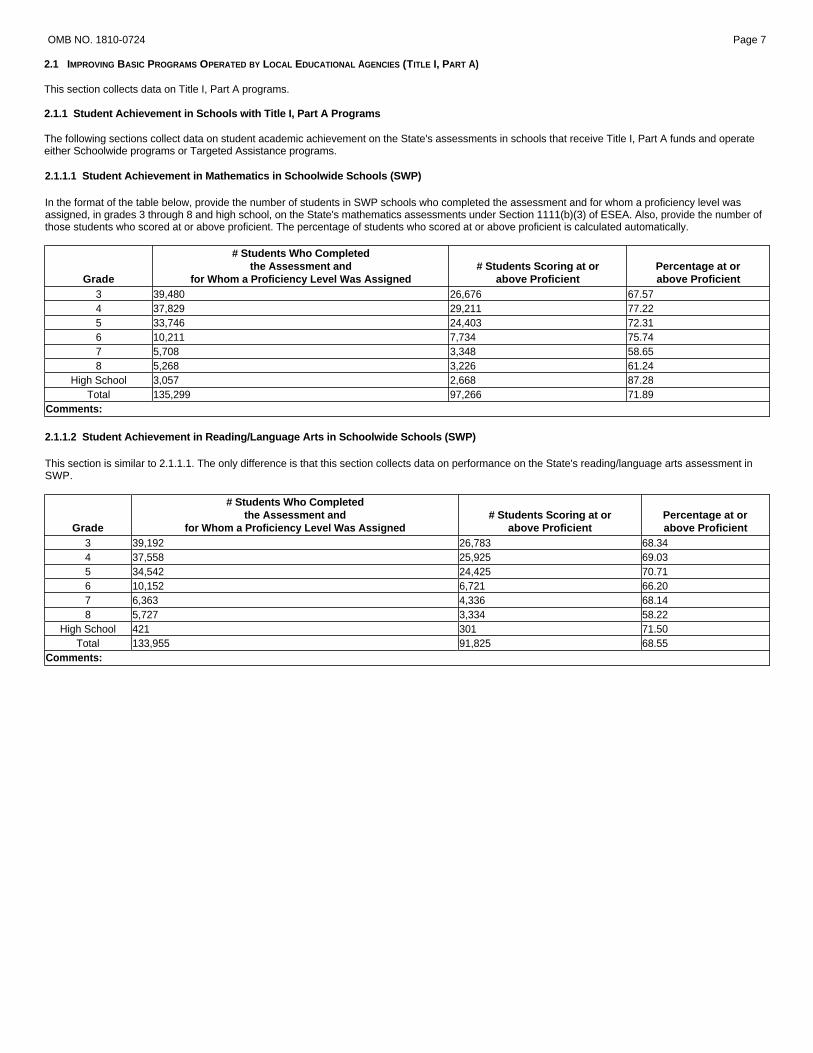
2.1.1.1 Student Achievement in Mathematics in Schoolwide Schools (SWP)
In the format of the table below, provide the number of students in SWP schools who completed the assessment and for whom a proficiency level was assigned, in grades 3 through 8 and high school, on the State's mathematics assessments under Section 1111(b)(3) of ESEA. Also, provide the number of those students who scored at or above proficient. The percentage of students who scored at or above proficient is calculated automatically.
Grade
# Students Who Completed the Assessment and
for Whom a Proficiency Level Was Assigned # Students Scoring at or
above Proficient Percentage at or above Proficient
3 39,480 26,676 67.57 4 37,829 29,211 77.22 5 33,746 24,403 72.31 6 10,211 7,734 75.74 7 5,708 3,348 58.65 8 5,268 3,226 61.24
High School 3,057 2,668 87.28 Total 135,299 97,266 71.89
Comments:
2.1.1.2 Student Achievement in Reading/Language Arts in Schoolwide Schools (SWP)
This section is similar to 2.1.1.1. The only difference is that this section collects data on performance on the State's reading/language arts assessment in SWP.
Grade
# Students Who Completed the Assessment and
for Whom a Proficiency Level Was Assigned # Students Scoring at or
above Proficient Percentage at or above Proficient
3 39,192 26,783 68.34 4 37,558 25,925 69.03 5 34,542 24,425 70.71 6 10,152 6,721 66.20 7 6,363 4,336 68.14 8 5,727 3,334 58.22
High School 421 301 71.50 Total 133,955 91,825 68.55
Comments:
OMB NO. 1810-0724 Page 8
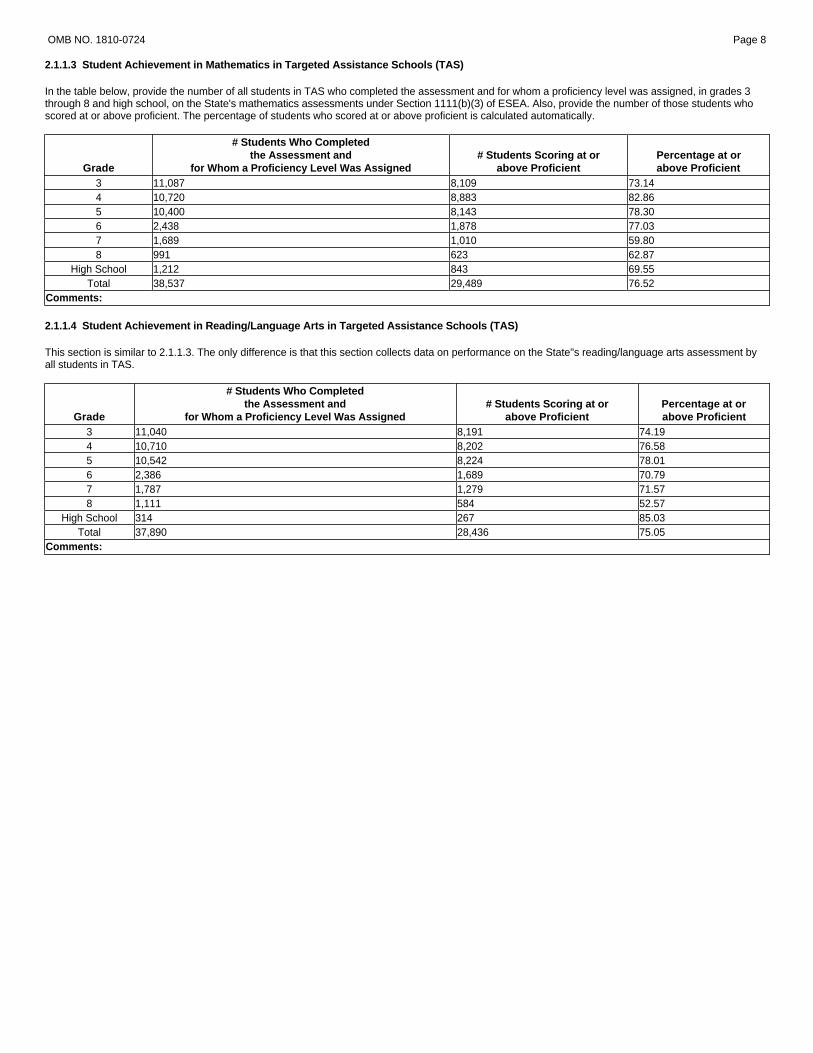
2.1.1.3 Student Achievement in Mathematics in Targeted Assistance Schools (TAS)
In the table below, provide the number of all students in TAS who completed the assessment and for whom a proficiency level was assigned, in grades 3 through 8 and high school, on the State's mathematics assessments under Section 1111(b)(3) of ESEA. Also, provide the number of those students who scored at or above proficient. The percentage of students who scored at or above proficient is calculated automatically.
Grade
# Students Who Completed the Assessment and
for Whom a Proficiency Level Was Assigned # Students Scoring at or
above Proficient Percentage at or above Proficient
3 11,087 8,109 73.14 4 10,720 8,883 82.86 5 10,400 8,143 78.30 6 2,438 1,878 77.03 7 1,689 1,010 59.80 8 991 623 62.87
High School 1,212 843 69.55 Total 38,537 29,489 76.52
Comments:
2.1.1.4 Student Achievement in Reading/Language Arts in Targeted Assistance Schools (TAS)
This section is similar to 2.1.1.3. The only difference is that this section collects data on performance on the State"s reading/language arts assessment by all students in TAS.
Grade
# Students Who Completed the Assessment and
for Whom a Proficiency Level Was Assigned # Students Scoring at or
above Proficient Percentage at or above Proficient
3 11,040 8,191 74.19 4 10,710 8,202 76.58 5 10,542 8,224 78.01 6 2,386 1,689 70.79 7 1,787 1,279 71.57 8 1,111 584 52.57
High School 314 267 85.03 Total 37,890 28,436 75.05
Comments:

2.1.2 Title I, Part A Student Participation The following sections collect data on students participating in Title I, Part A by various student characteristics.
OMB NO. 1810-0724 Page 9
2.1.2.1 Student Participation in Public Title I, Part A by Special Services or Programs
In the table below, provide the number of public school students served by either Public Title I SWP or TAS programs at any time during the regular school year for each category listed. Count each student only once in each category even if the student participated during more than one term or in more than one school or district in the State. Count each student in as many of the categories that are applicable to the student. Include pre-kindergarten through grade 12. Do not include the following individuals: (1) adult participants of adult literacy programs funded by Title I, (2) private school students participating in Title I programs operated by local educational agencies, or (3) students served in Part A local neglected programs. Special Services or Programs # Students Served Children with disabilities (IDEA) 43,908 Limited English proficient students 42,453 Students who are homeless 5,921 Migratory students 308 Comments:
2.1.2.2 Student Participation in Public Title I, Part A by Racial/Ethnic Group
In the table below, provide the unduplicated number of public school students served by either public Title I SWP or TAS at any time during the regular school year. Each student should be reported in only one racial/ethnic category. Include pre-kindergarten through grade 12. The total number of students served will be calculated automatically.
Do not include: (1) adult participants of adult literacy programs funded by Title I, (2) private school students participating in Title I programs operated by local educational agencies, or (3) students served in Part A local neglected programs. Race/Ethnicity # Students Served American Indian or Alaska Native 827 Asian 9,059 Black or African American 109,922 Hispanic or Latino 56,588 Native Hawaiian or other Pacific Islander 498 White 115,827 Two or more races 13,076 Total 305,797 Comments:
OMB NO. 1810-0724 Page 10
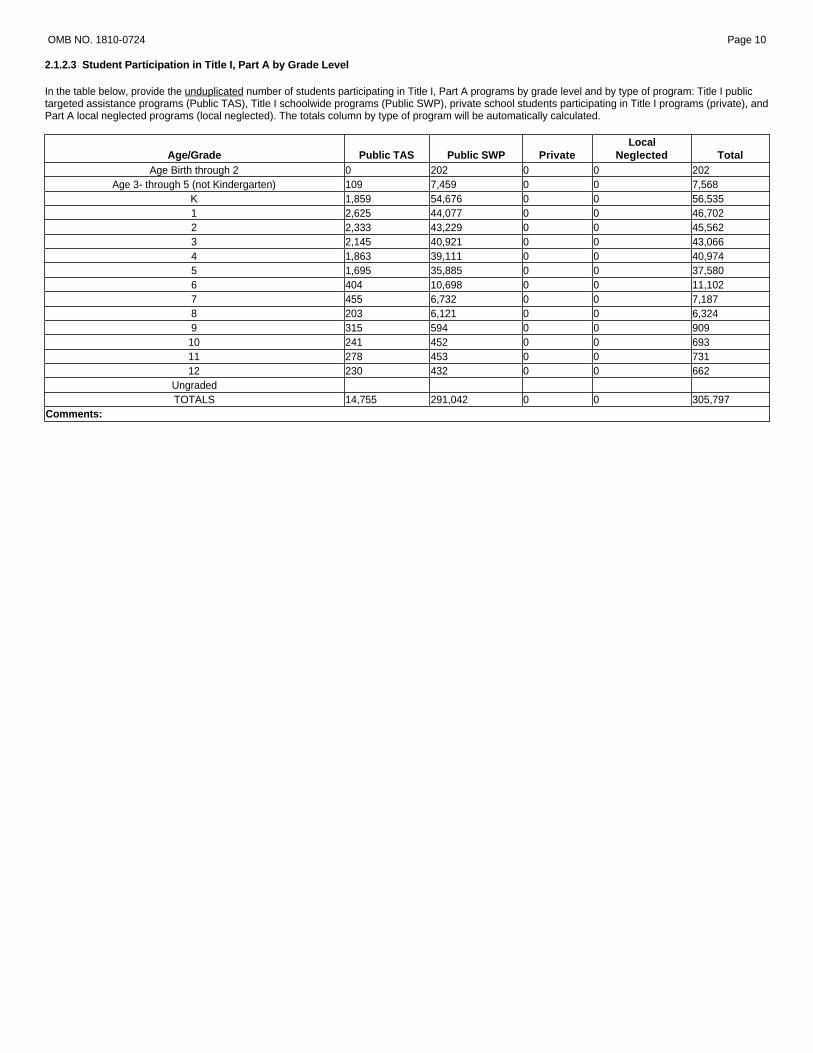
2.1.2.3 Student Participation in Title I, Part A by Grade Level
In the table below, provide the unduplicated number of students participating in Title I, Part A programs by grade level and by type of program: Title I public targeted assistance programs (Public TAS), Title I schoolwide programs (Public SWP), private school students participating in Title I programs (private), and Part A local neglected programs (local neglected). The totals column by type of program will be automatically calculated.
Age/Grade Public TAS Public SWP Private Local
Neglected Total Age Birth through 2 0 202 0 0 202
Age 3- through 5 (not Kindergarten) 109 7,459 0 0 7,568 K 1,859 54,676 0 0 56,535 1 2,625 44,077 0 0 46,702 2 2,333 43,229 0 0 45,562 3 2,145 40,921 0 0 43,066 4 1,863 39,111 0 0 40,974 5 1,695 35,885 0 0 37,580 6 404 10,698 0 0 11,102 7 455 6,732 0 0 7,187 8 203 6,121 0 0 6,324 9 315 594 0 0 909 10 241 452 0 0 693 11 278 453 0 0 731 12 230 432 0 0 662
Ungraded TOTALS 14,755 291,042 0 0 305,797
Comments:

2.1.2.4 Student Participation in Title I, Part A Targeted Assistance Programs by Instructional and Support Services The following sections collect data about the participation of students in TAS.
OMB NO. 1810-0724 Page 11
2.1.2.4.1 Student Participation in Title I, Part A Targeted Assistance Programs by Instructional Services
In the table below, provide the number of students receiving each of the listed instructional services through a TAS program funded by Title I, Part A. Students may be reported as receiving more than one instructional service. However, students should be reported only once for each instructional service regardless of the frequency with which they received the service. TAS instructional service # Students Served Mathematics 1,810 Reading/language arts 8,744 Science 0 Social studies 0 Vocational/career 0 Other instructional services 4,185 Comments:
2.1.2.4.2 Student Participation in Title I, Part A Targeted Assistance Programs by Support Services
In the table below, provide the number of students receiving each of the listed support services through a TAS program funded by Title I, Part A. Students may be reported as receiving more than one support service. However, students should be reported only once for each support service regardless of the frequency with which they received the service. TAS Suport Service # Students Served Health, dental, and eye care 0 Supporting guidance/advocacy 0 Other support services 0 Comments:
OMB NO. 1810-0724 Page 12
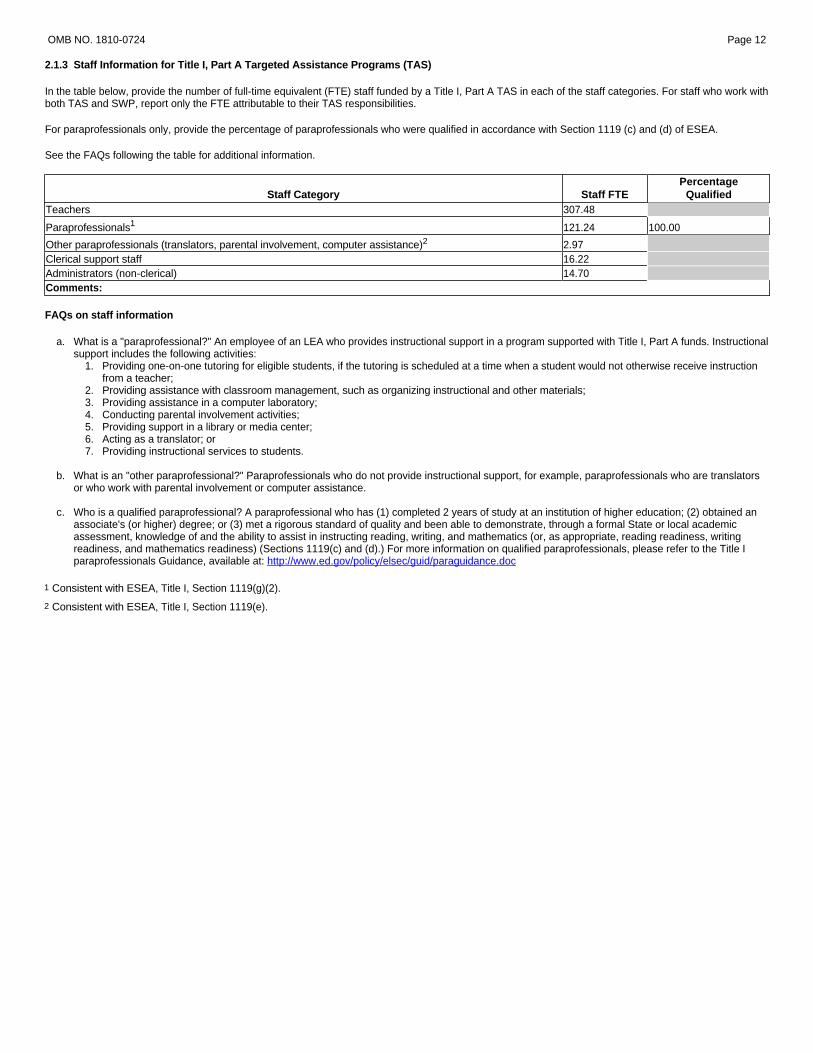
2.1.3 Staff Information for Title I, Part A Targeted Assistance Programs (TAS)
In the table below, provide the number of full-time equivalent (FTE) staff funded by a Title I, Part A TAS in each of the staff categories. For staff who work with both TAS and SWP, report only the FTE attributable to their TAS responsibilities.
For paraprofessionals only, provide the percentage of paraprofessionals who were qualified in accordance with Section 1119 (c) and (d) of ESEA.
See the FAQs following the table for additional information.
Staff Category Staff FTE Percentage
Qualified Teachers 307.48
Paraprofessionals1 121.24 100.00
Other paraprofessionals (translators, parental involvement, computer assistance)2 2.97 Clerical support staff 16.22 Administrators (non-clerical) 14.70 Comments: FAQs on staff information
a. What is a "paraprofessional?" An employee of an LEA who provides instructional support in a program supported with Title I, Part A funds. Instructional support includes the following activities:
1. Providing one-on-one tutoring for eligible students, if the tutoring is scheduled at a time when a student would not otherwise receive instruction from a teacher;
2. Providing assistance with classroom management, such as organizing instructional and other materials; 3. Providing assistance in a computer laboratory; 4. Conducting parental involvement activities; 5. Providing support in a library or media center; 6. Acting as a translator; or 7. Providing instructional services to students.
b. What is an "other paraprofessional?" Paraprofessionals who do not provide instructional support, for example, paraprofessionals who are translators
or who work with parental involvement or computer assistance.
c. Who is a qualified paraprofessional? A paraprofessional who has (1) completed 2 years of study at an institution of higher education; (2) obtained an associate's (or higher) degree; or (3) met a rigorous standard of quality and been able to demonstrate, through a formal State or local academic assessment, knowledge of and the ability to assist in instructing reading, writing, and mathematics (or, as appropriate, reading readiness, writing readiness, and mathematics readiness) (Sections 1119(c) and (d).) For more information on qualified paraprofessionals, please refer to the Title I paraprofessionals Guidance, available at: http://www.ed.gov/policy/elsec/guid/paraguidance.doc
1 Consistent with ESEA, Title I, Section 1119(g)(2).
2 Consistent with ESEA, Title I, Section 1119(e).

OMB NO. 1810-0724 Page 13
2.1.3.1 Paraprofessional Information for Title I, Part A Schoolwide Programs
In the table below, provide the number of FTE paraprofessionals who served in SWP and the percentage of these paraprofessionals who were qualified in accordance with Section 1119 (c) and (d) of ESEA. Use the additional guidance found below the previous table.
Paraprofessional Information Paraprofessionals FTE Percentage Qualified
Paraprofessionals3 5,735.90 99.60 Comments:
3 Consistent with ESEA, Title I, Section 1119(g)(2).
OMB NO. 1810-0724 Page 15
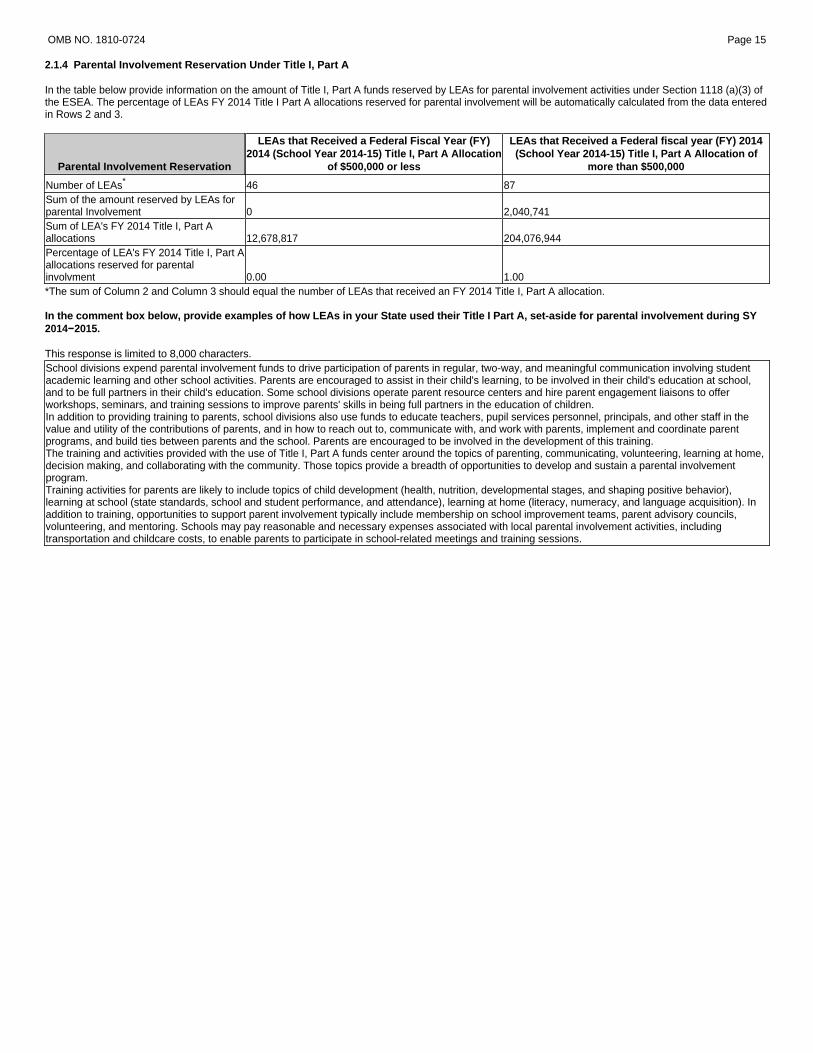
2.1.4 Parental Involvement Reservation Under Title I, Part A In the table below provide information on the amount of Title I, Part A funds reserved by LEAs for parental involvement activities under Section 1118 (a)(3) of the ESEA. The percentage of LEAs FY 2014 Title I Part A allocations reserved for parental involvement will be automatically calculated from the data entered in Rows 2 and 3.
Parental Involvement Reservation
LEAs that Received a Federal Fiscal Year (FY) 2014 (School Year 2014-15) Title I, Part A Allocation
of $500,000 or less
LEAs that Received a Federal fiscal year (FY) 2014 (School Year 2014-15) Title I, Part A Allocation of
more than $500,000
Number of LEAs* 46 87 Sum of the amount reserved by LEAs for parental Involvement 0 2,040,741 Sum of LEA's FY 2014 Title I, Part A allocations 12,678,817 204,076,944 Percentage of LEA's FY 2014 Title I, Part A allocations reserved for parental involvment 0.00 1.00 *The sum of Column 2 and Column 3 should equal the number of LEAs that received an FY 2014 Title I, Part A allocation. In the comment box below, provide examples of how LEAs in your State used their Title I Part A, set-aside for parental involvement during SY 2014−2015. This response is limited to 8,000 characters. School divisions expend parental involvement funds to drive participation of parents in regular, two-way, and meaningful communication involving student academic learning and other school activities. Parents are encouraged to assist in their child's learning, to be involved in their child's education at school, and to be full partners in their child's education. Some school divisions operate parent resource centers and hire parent engagement liaisons to offer workshops, seminars, and training sessions to improve parents' skills in being full partners in the education of children. In addition to providing training to parents, school divisions also use funds to educate teachers, pupil services personnel, principals, and other staff in the value and utility of the contributions of parents, and in how to reach out to, communicate with, and work with parents, implement and coordinate parent programs, and build ties between parents and the school. Parents are encouraged to be involved in the development of this training. The training and activities provided with the use of Title I, Part A funds center around the topics of parenting, communicating, volunteering, learning at home, decision making, and collaborating with the community. Those topics provide a breadth of opportunities to develop and sustain a parental involvement program. Training activities for parents are likely to include topics of child development (health, nutrition, developmental stages, and shaping positive behavior), learning at school (state standards, school and student performance, and attendance), learning at home (literacy, numeracy, and language acquisition). In addition to training, opportunities to support parent involvement typically include membership on school improvement teams, parent advisory councils, volunteering, and mentoring. Schools may pay reasonable and necessary expenses associated with local parental involvement activities, including transportation and childcare costs, to enable parents to participate in school-related meetings and training sessions.

2.3 EDUCATION OF MIGRANT CHILDREN (TITLE I, PART C) This section collects data on the Migrant Education Program (Title I, Part C) for the performance period of September 1, 2014 through August 31, 2015. This section is composed of the following subsections:
� Population data of eligible migrant children � Academic data of eligible migrant students � Data of migrant children served during the performance period � School data � Project data � Personnel data
Where the table collects data by age/grade, report children in the highest age/grade that they attained during the performance period. For example, a child who turns 3 during the performance period would only be performance in the "Age 3 through 5 (not Kindergarten)" row.
OMB NO. 1810-0724 Page 16
2.3.1 Migrant Child Counts
This section collects the Title I, Part C, Migrant Education Program (MEP) child counts which States are required to provide and may be used to determine the annual State allocations under Title I, Part C. The child counts should reflect the performance period of September 1, 2014 through August 31, 2015. This section also collects a report on the procedures used by States to produce true, reliable, and valid child counts.
To provide the child counts, each SEA should have sufficient procedures in place to ensure that it is counting only those children who are eligible for the MEP. Such procedures are important to protecting the integrity of the State's MEP because they permit the early discovery and correction of eligibility problems and thus help to ensure that only eligible migrant children are counted for funding purposes and are served. If an SEA has reservations about the accuracy of its child counts, it must inform the Department of its concerns and explain how and when it will resolve them in the box below, which precedes Section 2.3.1.1 Category 1 Child Count.
Note: In submitting this information, the Authorizing State Official must certify that, to the best of his/her knowledge, the child counts and information contained in the report are true, reliable, and valid and that any false Statement provided is subject to fine or imprisonment pursuant to 18 U.S.C. 1001.
FAQs on Child Count:
1. How is "out-of-school" defined? Out-of-school means children up through age 21 who are entitled to a free public education in the State but are not currently enrolled in a K-12 institution. This could include students who have dropped out of school in the previous performance period (September 1, 2013 - August 31, 2014), youth who are working on a HSED outside of a K-12 institution, and youth who are "here-to-work" only. It does not include preschoolers, who are counted by age grouping. Children who were enrolled in school for at least one day, but dropped out of school during the performance period should be counted in the highest age/grade level attained during the performance period.
2. How is "ungraded" defined? Ungraded means the children are served in an educational unit that has no separate grades. For example, some schools have primary grade groupings that are not traditionally graded, or ungraded groupings for children with learning disabilities. In some cases, ungraded students may also include special education children, transitional bilingual students, students working on a HSED through a K-12 institution, or those in a correctional setting. (Students working on a HSED outside of a K-12 institution are counted as out-of-school youth.)
In the space below, discuss any concerns about the accuracy of the reported child counts or the underlying eligibility determinations on which the counts are based and how and when these concerns will be resolved. The response is limited to 8,000 characters. Comments: Virginia does not have any concerns regarding the accuracy of the reported child counts.
2.3.1.1 Category 1 Child Count (Eligible Migrant Children) In the table below, enter the unduplicated statewide number by age/grade of eligible migrant children age 3 through 21 who, within 3 years of making a qualifying move, resided in your State for one or more days during the performance period of September 1, 2014 through August 31, 2015. This figure includes all eligible migrant children who may or may not have received MEP services. Count a child who moved from one age/grade level to another during the performance period only once in the highest age/grade that he/she attained during the performance period. The unduplicated statewide total count is calculated automatically.
Do not include:
� Children age birth through 2 years � Children served by the MEP (under the continuation of services authority) after their period of eligibility has expired when other services are not
available to meet their needs � Previously eligible secondary-school children who are receiving credit accrual services (under the continuation of services authority).
Age/Grade Eligible Migrant Children
Age 3 through 5 (not Kindergarten) 94 K 83 1 74 2 62 3 63 4 46 5 36 6 37 7 29 8 30
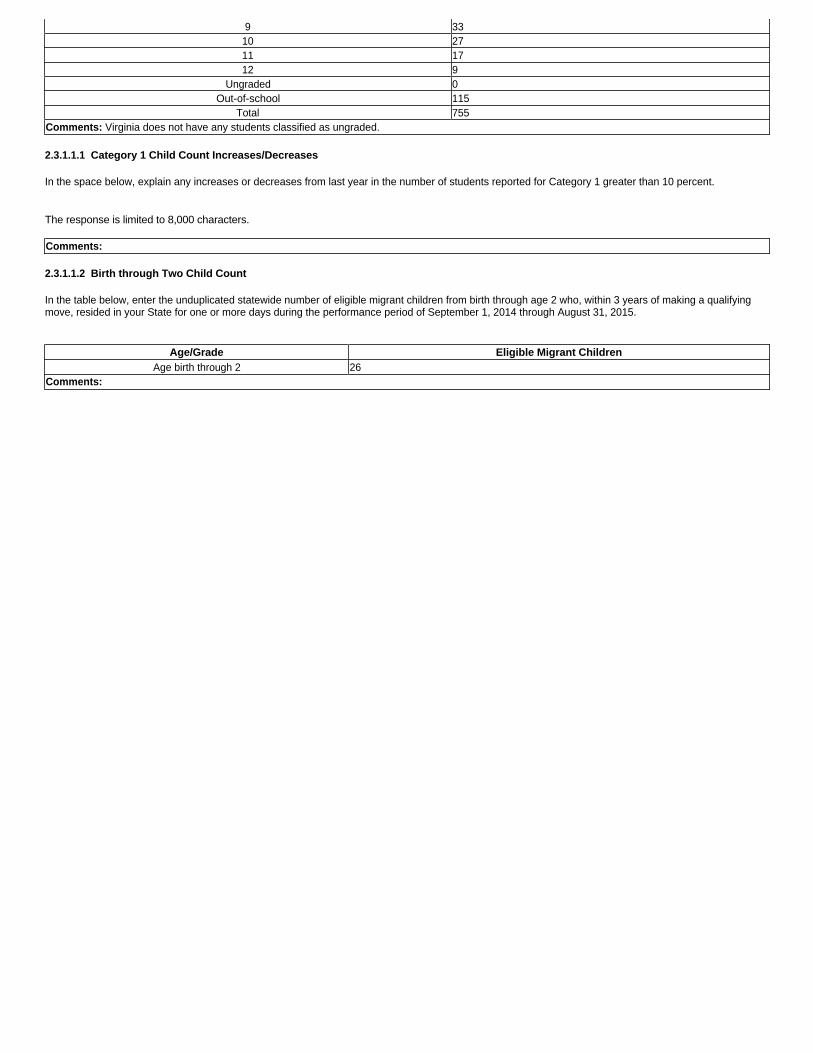
9 33 10 27 11 17 12 9
Ungraded 0 Out-of-school 115
Total 755 Comments: Virginia does not have any students classified as ungraded.
2.3.1.1.1 Category 1 Child Count Increases/Decreases
In the space below, explain any increases or decreases from last year in the number of students reported for Category 1 greater than 10 percent.
The response is limited to 8,000 characters. Comments:
2.3.1.1.2 Birth through Two Child Count
In the table below, enter the unduplicated statewide number of eligible migrant children from birth through age 2 who, within 3 years of making a qualifying move, resided in your State for one or more days during the performance period of September 1, 2014 through August 31, 2015.
Age/Grade Eligible Migrant Children
Age birth through 2 26 Comments:
OMB NO. 1810-0724 Page 17
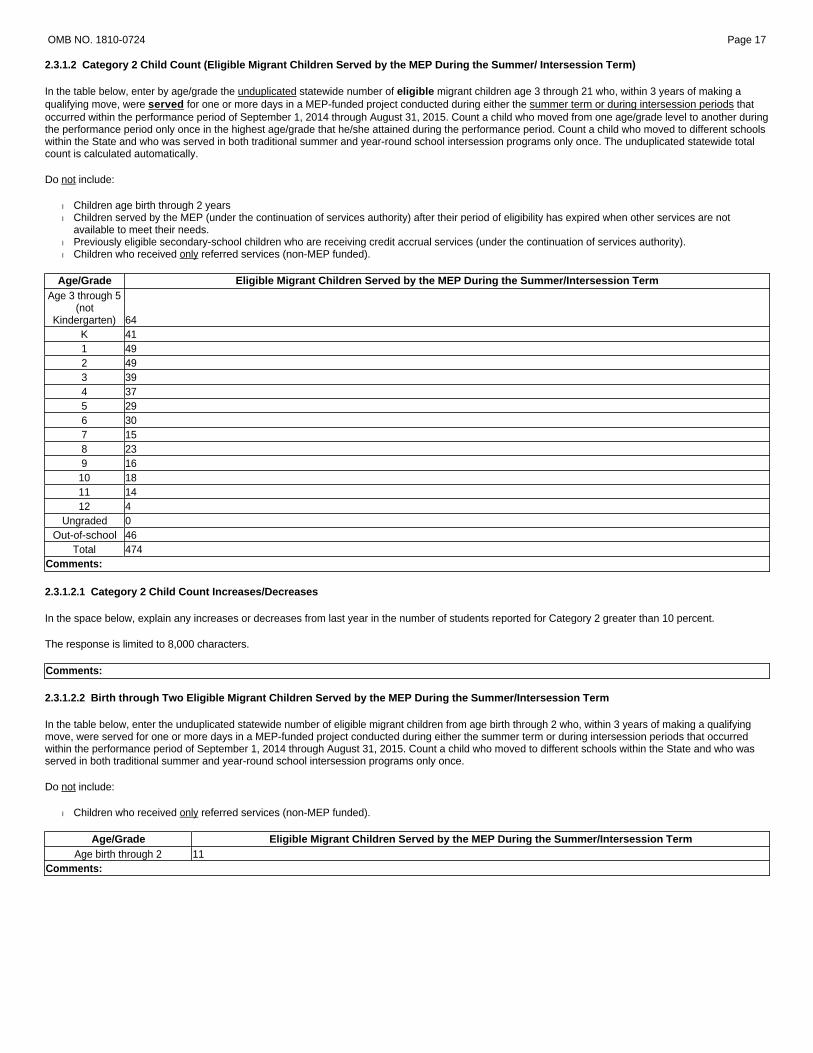
2.3.1.2 Category 2 Child Count (Eligible Migrant Children Served by the MEP During the Summer/ Intersession Term)
In the table below, enter by age/grade the unduplicated statewide number of eligible migrant children age 3 through 21 who, within 3 years of making a qualifying move, were served for one or more days in a MEP-funded project conducted during either the summer term or during intersession periods that occurred within the performance period of September 1, 2014 through August 31, 2015. Count a child who moved from one age/grade level to another during the performance period only once in the highest age/grade that he/she attained during the performance period. Count a child who moved to different schools within the State and who was served in both traditional summer and year-round school intersession programs only once. The unduplicated statewide total count is calculated automatically.
Do not include:
� Children age birth through 2 years � Children served by the MEP (under the continuation of services authority) after their period of eligibility has expired when other services are not
available to meet their needs. � Previously eligible secondary-school children who are receiving credit accrual services (under the continuation of services authority). � Children who received only referred services (non-MEP funded).
Age/Grade Eligible Migrant Children Served by the MEP During the Summer/Intersession Term
Age 3 through 5 (not
Kindergarten) 64 K 41 1 49 2 49 3 39 4 37 5 29 6 30 7 15 8 23 9 16
10 18 11 14 12 4
Ungraded 0 Out-of-school 46
Total 474 Comments:
2.3.1.2.1 Category 2 Child Count Increases/Decreases
In the space below, explain any increases or decreases from last year in the number of students reported for Category 2 greater than 10 percent.
The response is limited to 8,000 characters. Comments:
2.3.1.2.2 Birth through Two Eligible Migrant Children Served by the MEP During the Summer/Intersession Term
In the table below, enter the unduplicated statewide number of eligible migrant children from age birth through 2 who, within 3 years of making a qualifying move, were served for one or more days in a MEP-funded project conducted during either the summer term or during intersession periods that occurred within the performance period of September 1, 2014 through August 31, 2015. Count a child who moved to different schools within the State and who was served in both traditional summer and year-round school intersession programs only once.
Do not include:
� Children who received only referred services (non-MEP funded).
Age/Grade Eligible Migrant Children Served by the MEP During the Summer/Intersession Term Age birth through 2 11
Comments:
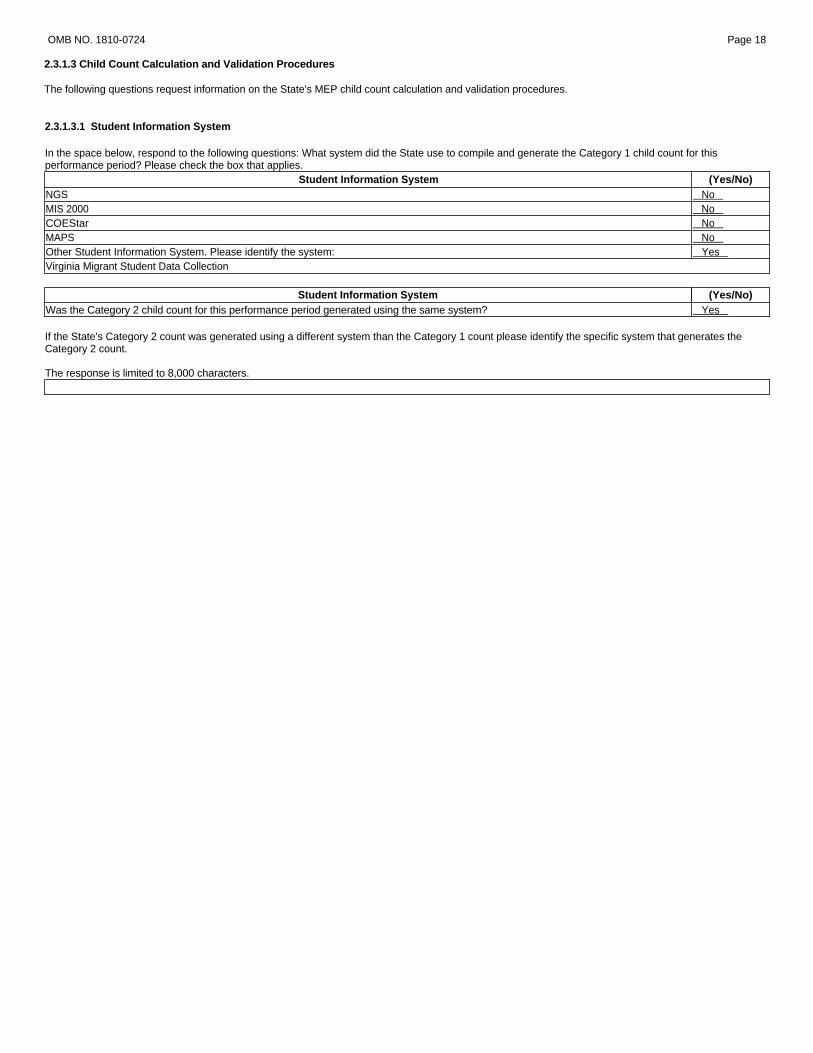
2.3.1.3 Child Count Calculation and Validation Procedures The following questions request information on the State's MEP child count calculation and validation procedures.
OMB NO. 1810-0724 Page 18
2.3.1.3.1 Student Information System
In the space below, respond to the following questions: What system did the State use to compile and generate the Category 1 child count for this performance period? Please check the box that applies.
Student Information System (Yes/No) NGS No MIS 2000 No COEStar No MAPS No Other Student Information System. Please identify the system: Yes Virginia Migrant Student Data Collection
Student Information System (Yes/No) Was the Category 2 child count for this performance period generated using the same system? Yes If the State's Category 2 count was generated using a different system than the Category 1 count please identify the specific system that generates the Category 2 count. The response is limited to 8,000 characters.

OMB NO. 1810-0724 Page 19
2.3.1.3.3 Methods Used To Count Children
In the space below, please describe the procedures and processes at the State level used to ensure all eligible children are accounted for in the performance period . In particular, describe how the State includes and counts only:
� The unduplicated count of eligible migrant children, ages 3-21. Include children two years of age whose residency in the state has been verified after turning three.
� Children who met the program eligibility criteria (e.g., were within 3 years of a qualifying move, had a qualifying activity) � Children who were resident in your State for at least 1 day during the performance period (September 1 through August 31) � Children who – in the case of Category 2 – were served for one or more days in a MEP-funded project conducted during either the summer term or
during intersession periods � Children once per age/grade level for each child count category
The response is limited to 8,000 characters. The child count is calculated through the Virginia Migrant Student Data Collection (MSDC) system. The MSDC system consists of core and additional data that are representative of the elements within the Certificate of Eligibility (COE) used by the local migrant coordinators and recruiters around the state. The key data elements used to ensure accurate category 1 and category 2 child counts consist of the enrollment, withdrawal, residency, qualifying activity, and qualifying arrival date (QAD) dates, as well as school history data that establish a child's presence during the year. The COE was revised in the spring of 2008 to collect accurate data that is required by the Migrant Student Information Exchange System (MSIX), in the spring of 2009 with the national COE, and then again in the spring of 2010 to include birth country and race/ethnicity codes. The database also assigns students unique identification numbers in the MSDC. In addition, the Virginia State Testing Identifier (STI) is collected on the COE. Virginia included the STI to allow linking of migrant student records to the Virginia Student Information System. To maintain accurate counts of eligible students, the database recognizes migrant students who are between the ages of three and twenty-one as well as those who were previously enrolled. The MSDC system automatically calculates student's three-year eligibility based on the birth date and the qualifying arrival date to ensure students whose eligibility has expired is not included in the child count. Children served under the Continuation of Services provision are also excluded for funding purposes. The following additional data fields are used to avoid duplication: parent data, mother's maiden name, child's birthplace, birth date, age, home base, and student identification number. The state director conducts random reviews of the data entered into the MSDC throughout the school year to ensure accurate eligibility determination prior to the end of the year submissions by the local programs. When discrepancies are found, communication is maintained until concerns are resolved. During the summer/intersession terms, local migrant coordinators are required to verify weekly attendance records to ensure accurate counts for students participating in a summer program. Teachers, tutors, and/or migrant student advocates record attendance and/or services provided, and send the attendance/service reports to the local migrant coordinators who review for verification prior to being entered into the MSDC system. The Student Enrollment report is generated from the MSDC system when verifying the number of participants in the regular and summer/intersession terms when determining the Category 1 and Category 2 child count. Once student enrollment numbers have been verified in the MSDC system, the local migrant coordinator selects the 'Submit to the DOE' button within the MSDC system, which closes the data collection window for the reporting period. The performance period for the data collection is August 31, 2014 to August 31, 2015. The state verifies the eligibility of 2 year olds after they turn 3 years of age through the Certificate of Eligibility, which is updated annually. The state excludes children who have obtained their high school diploma through the Certificate of Eligibility, which is updated annually. The state ensures that migrant children are counted in all appropriate EDFacts files, including shared assessment files. How does the State ensure that the system that transmits migrant data to the Department accurately accounts for all the migrant children in every EDFacts data file (see the Office of Migrant Education's CSPR Rating Instrument for the criteria needed to address this question)? In order to ensure that the Virginia Migrant Student Data Collection (MSDC) transmits accurate data and accounts for all migrant students in every EDFacts data file, the MSDC recognizes migrant students who are between the ages of three and twenty-one as well as those who were previously enrolled. The MSDC system automatically calculates student's three-year eligibility based on the birth date and the qualifying arrival date to ensure students whose eligibility has expired is not included in the child count. Children served under the Continuation of Services (COS) provision are also excluded for funding purposes. The following additional data fields are used to avoid duplication: parent data, mother's maiden name, child's birthplace, birth date, age, home base, and student identification number. During the summer/intersession terms, local migrant coordinators are required to verify weekly attendance records to ensure accurate counts for students participating in a summer program. Teachers, tutors, and/or migrant student advocates record attendance and/or services provided, and send the attendance/service reports to the local migrant coordinators who review for verification prior to being entered into the MSDC system. The state director conducts random reviews of the data entered into the MSDC throughout the school year to ensure accurate eligibility determination prior to the end of the year submissions by the local programs. When discrepancies are found, communication is maintained until concerns are resolved. At the end of each semester/term or when a migrant child leaves, the program teacher/recruiter completes a withdrawal form. The withdrawal form collects demographic data on the student as well as program services. The withdrawal form was updated to collect additional data. Additional elements include: 1) ESL services and limited English proficiency (ELP) level; 2) referred services; and 3) achievement of GED. The teacher/recruiter indicates the type of instructional support or referred services the student received. Local assessment data are also collected. The withdrawal form is submitted to the migrant coordinator who reviews it for accuracy before being entered into the MSDC system. If the student remains in the migrant program and is eligible to receive services the next semester or school year, an update is made to the COE at the start of the new semester. An interview with the family is conducted to check accuracy of the data on the original COE. Changes, if any, on the new COE are entered into the MSDC system. If the student is not enrolled or available for revalidation, the student is removed from the current list of eligible students. A new COE is only created when a student has made a qualifying move. Student enrollment numbers are verified in the MSDC system, by the local migrant coordinator through their selection of the 'Submit to the DOE' button, which closes the data collection window for the reporting period. Prior to the submission of data within the EDFacts file, the Department generates reports within the MSDC system. The Student Enrollment Report is generated to verify the number of participants in the regular and summer/intersession terms when determining the Category 1 and Category 2 child count. In addition, the Virginia Department of Education Funding Report is verified to ensure the number of migrant students served by priority status (priority for services and students served under the COS provision) are accurately represented. Use of MSIX to Verify Data Quality (Yes/No) Does the State use data in the Migrant Student Information Exchange (MSIX) to verify the quality of migrant data? No If MSIX is utilized, please explain how.

The response is limited to 8,000 characters.

OMB NO. 1810-0724 Page 20
2.3.1.3.4 Quality Control Processes
In the space below, respond to the following questions : Quality Control Processes Yes/No
Is student eligibility based on a personal interview (face-to-face or phone call) with a parent, guardian, or other responsible adult, or youth-as-worker? Yes Does the SEA and/or regional offices train recruiters at least annually on eligibility requirements, including the basic eligibility definition, economic necessity, temporary vs. seasonal, processing, etc.? Yes Does the SEA have a formal process, beyond the recruiter's determination, for reviewing and ensuring the accuracy of written eligibility information [e.g., COEs are reviewed and initialed by the recruiter's supervisor and/or other reviewer(s)]? Yes Are incomplete or otherwise questionable COEs returned to the recruiter for correction, further explanation, documentation, and/or verification? Yes Does the SEA provide recruiters with written eligibility guidance (e.g., a handbook)? Yes Does the SEA review student attendance records at summer/inter-session projects to verify that the total unduplicated number of eligible migrant students served in the summer/intersession is reconciled with the Category 2 Count ? Yes Does the SEA have both a local and state-level process for resolving eligibility questions? Yes Are written procedures provided to regular school year and summer/intersession personnel on how to collect and report pupil enrollment and withdrawal data? Yes Are records/data entry personnel provided training on how to review regular school year and summer/inter-session site records, input data, and run reports used for child count purposes? Yes In the space below, describe the results of any re-interview processes used by the SEA during the performance period to test the accuracy of the State's MEP eligibility determinations.
Results # The number of eligibility determinations sampled. 50 The number of eligibility determinations sampled for which a re-interview was completed. 37 The number of eligibility determinations sampled for which a re-interview was completed and the child was found eligible. 37 Describe any reasons for non-response in the re-interviewing process. The response is limited to 8,000 characters. The students randomly selected were no longer available for re-interviewing due to family move.
Procedures Yes/No What was the most recent year that the MEP conducted independent prospective re-interviews (i.e., interviewers were neither SEA or LEA staff members responsible for administering or operating the MEP, nor any other persons who worked on the initial eligibility determinations being tested)? None Was the sampling of eligible children random? Yes Was the sampling statewide? Yes FAQ on independent prospective reinterviews:
a. What are independent prospective re-interviews? Independent prospective re-interviews allow confirmation of your State's eligibility determinations and the accuracy of the numbers of migrant children in your State reports. Independent prospective interviews should be conducted at least once every three years by an independent interviewer, performed on the current year's identified migrant children.
If the sampling was stratified by group/area please describe the procedures. The response is limited to 8,000 characters. Within the Migrant Student Data Collection system, the Random MEP Student Identification Report is generated to identify MEP IDs for re-interviewing. Due to Virginia being a small state, a minimum of 25 MEP IDs for each program are required for re-interviewing. However, a minimum of 50 random MEP IDs are generated to ensure a minimum of 25 MEP IDs are re-interviewed. In the event that students randomly selected are no longer available for re-interviewing, a sample of 20 (based on program participation) is randomly generated. Each program is responsible for documenting re-interview attempts for all random sampling received. Please describe the sampling replacement by the State. The response is limited to 8,000 characters.
Obtaining Data From Families Check the applicable box to indicate how the re-interviews were conducted
Face-to-face re-interviews
Face-to-face re-interviews Phone Interviews Both
Obtaining Data From Families Yes/No Was there a protocol for verifying all information used in making the original eligibility determination? Yes Were re-interviewers independent from the original interviewers? Yes If you did conduct independent re-interviews in this reporting period, describe how you ensured that the process was independent. The response is limited to 8,000 characters.
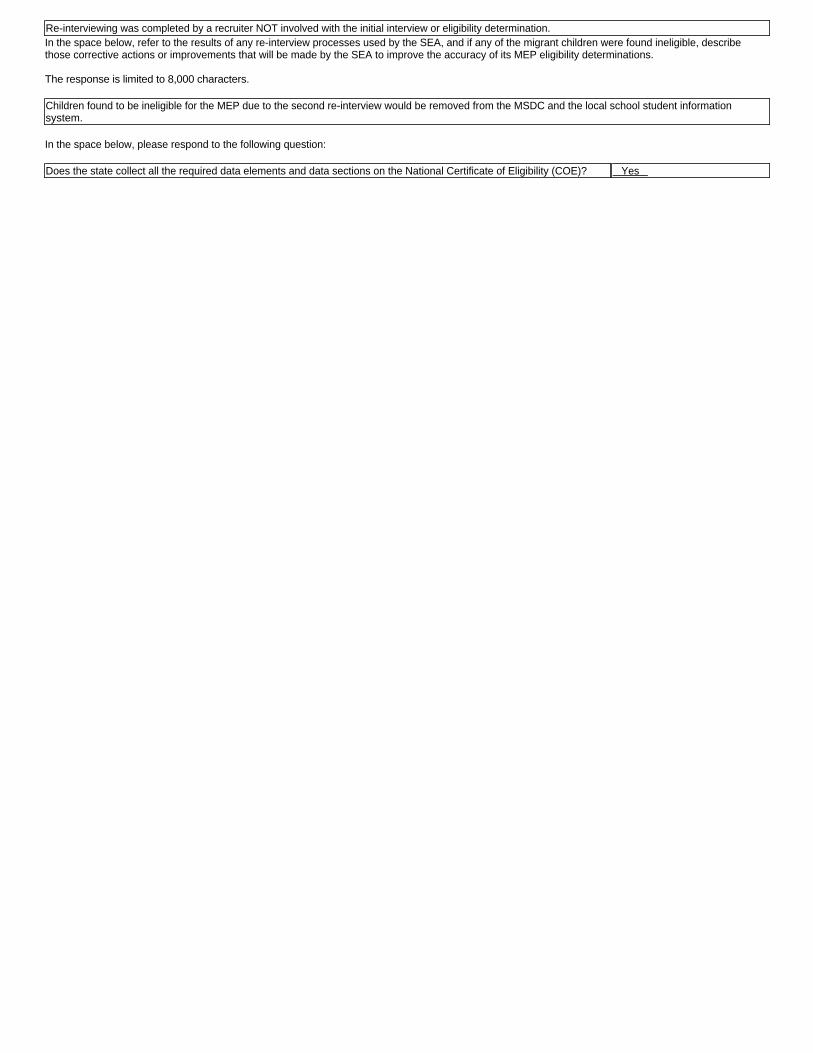
Re-interviewing was completed by a recruiter NOT involved with the initial interview or eligibility determination. In the space below, refer to the results of any re-interview processes used by the SEA, and if any of the migrant children were found ineligible, describe those corrective actions or improvements that will be made by the SEA to improve the accuracy of its MEP eligibility determinations. The response is limited to 8,000 characters. Children found to be ineligible for the MEP due to the second re-interview would be removed from the MSDC and the local school student information system. In the space below, please respond to the following question: Does the state collect all the required data elements and data sections on the National Certificate of Eligibility (COE)? Yes
2.3.2 Eligible Migrant Children
OMB NO. 1810-0724 Page 21
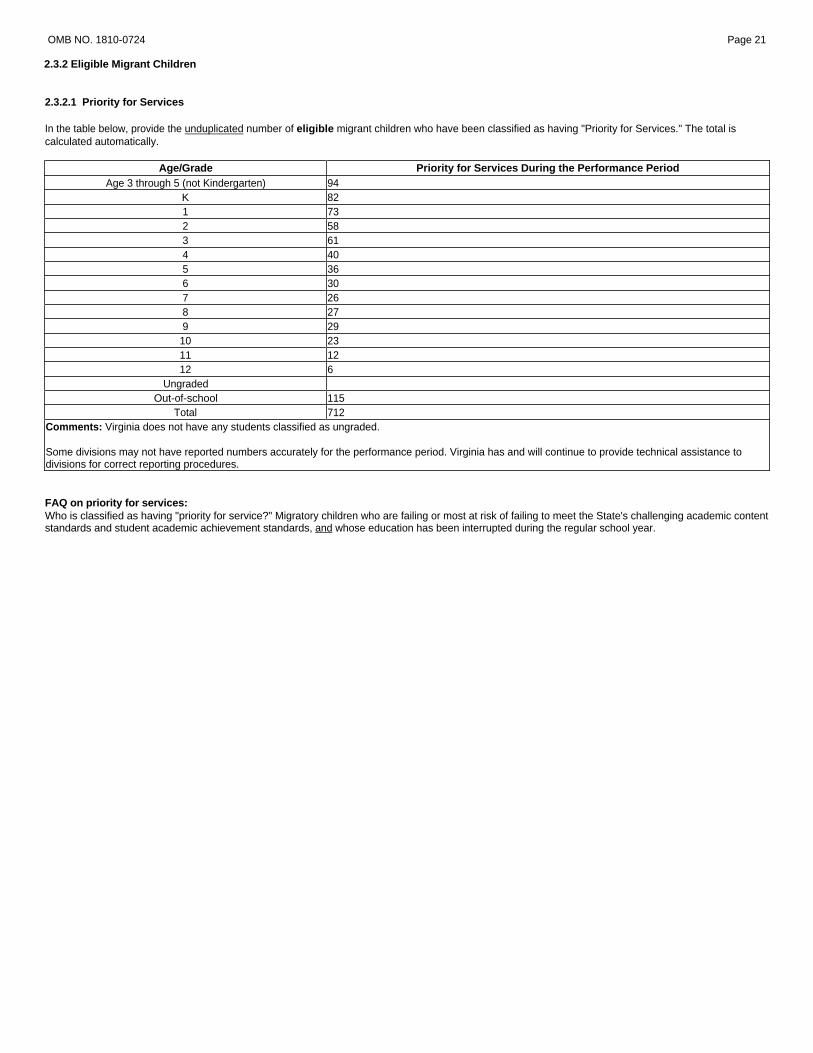
2.3.2.1 Priority for Services
In the table below, provide the unduplicated number of eligible migrant children who have been classified as having "Priority for Services." The total is calculated automatically.
Age/Grade Priority for Services During the Performance Period Age 3 through 5 (not Kindergarten) 94
K 82 1 73 2 58 3 61 4 40 5 36 6 30 7 26 8 27 9 29 10 23 11 12 12 6
Ungraded Out-of-school 115
Total 712 Comments: Virginia does not have any students classified as ungraded. Some divisions may not have reported numbers accurately for the performance period. Virginia has and will continue to provide technical assistance to divisions for correct reporting procedures. FAQ on priority for services: Who is classified as having "priority for service?" Migratory children who are failing or most at risk of failing to meet the State's challenging academic content standards and student academic achievement standards, and whose education has been interrupted during the regular school year.
OMB NO. 1810-0724 Page 22
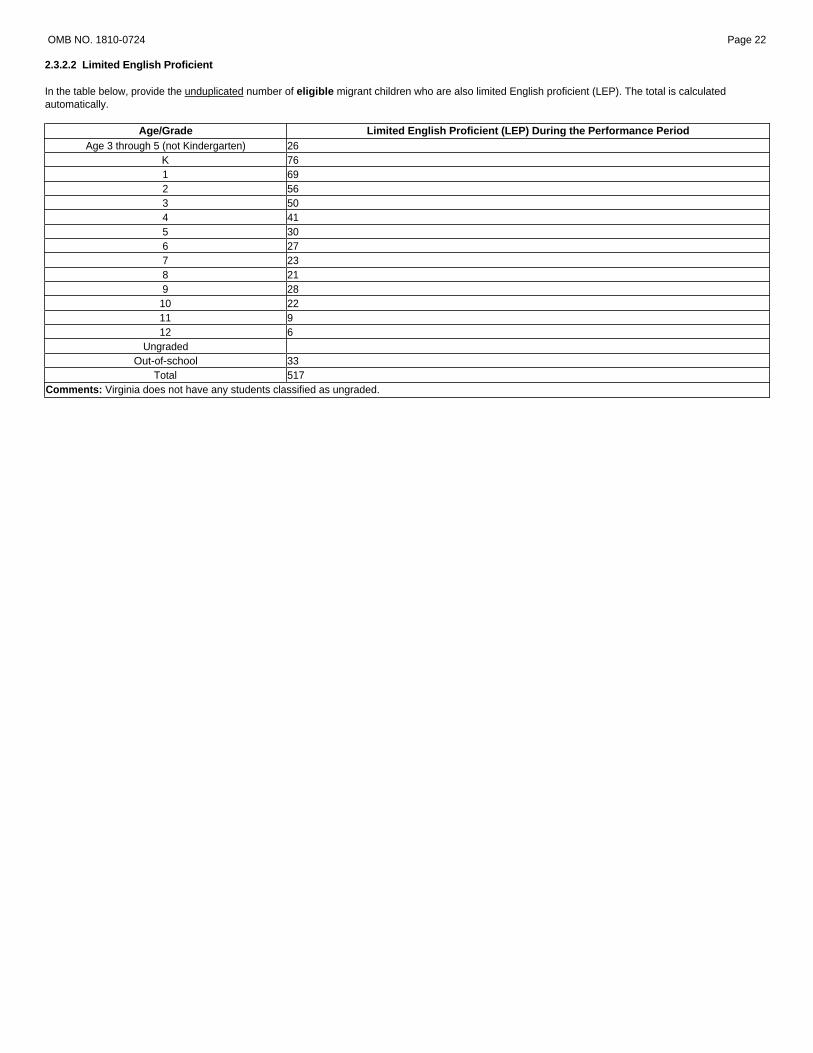
2.3.2.2 Limited English Proficient
In the table below, provide the unduplicated number of eligible migrant children who are also limited English proficient (LEP). The total is calculated automatically.
Age/Grade Limited English Proficient (LEP) During the Performance Period Age 3 through 5 (not Kindergarten) 26
K 76 1 69 2 56 3 50 4 41 5 30 6 27 7 23 8 21 9 28 10 22 11 9 12 6
Ungraded Out-of-school 33
Total 517 Comments: Virginia does not have any students classified as ungraded.

OMB NO. 1810-0724 Page 23
2.3.2.3 Children with Disabilities (IDEA)
In the table below, provide the unduplicated number of eligible migrant children who are also children with disabilities (IDEA) under Part B or Part C of the IDEA. The total is calculated automatically.
Age/Grade Children with Disabilities (IDEA) During the Performance Period Age Birth through 2
Age 3 through 5 (not Kindergarten) 3 K 2 1 5 2 2 3 3 4 4 5 3 6 7 8 1 9 3
10 1 11 1 12 3
Ungraded Out-of-school
Total 31 Comments:
OMB NO. 1810-0724 Page 24
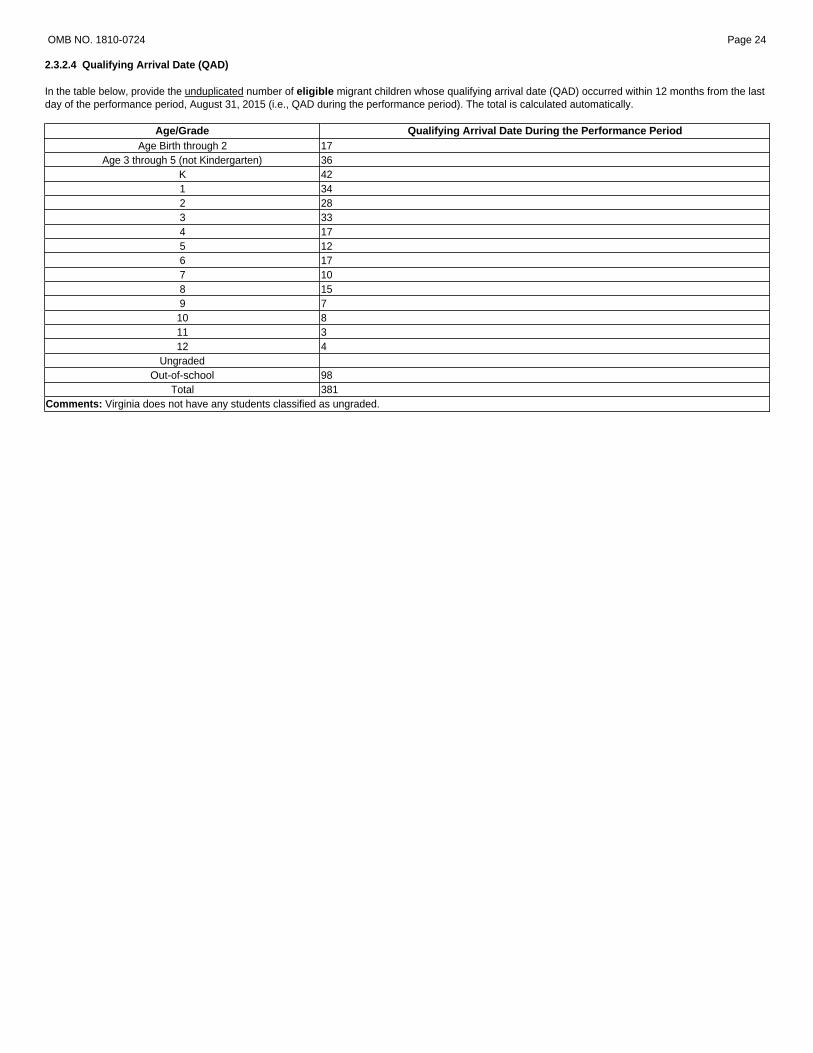
2.3.2.4 Qualifying Arrival Date (QAD)
In the table below, provide the unduplicated number of eligible migrant children whose qualifying arrival date (QAD) occurred within 12 months from the last day of the performance period, August 31, 2015 (i.e., QAD during the performance period). The total is calculated automatically.
Age/Grade Qualifying Arrival Date During the Performance Period Age Birth through 2 17
Age 3 through 5 (not Kindergarten) 36 K 42 1 34 2 28 3 33 4 17 5 12 6 17 7 10 8 15 9 7 10 8 11 3 12 4
Ungraded Out-of-school 98
Total 381 Comments: Virginia does not have any students classified as ungraded.

OMB NO. 1810-0724 Page 25
2.3.2.5 Qualifying Arrival Date During the Regular School Year
In the table below, provide the unduplicated number of eligible migrant children whose qualifying arrival date occurred during the performance period's regular school year (i.e., QAD during the 2014-15 regular school year). The total is calculated automatically.
Age/Grade Qualifying Arrival Date During the Regular School Year Age Birth through 2 5
Age 3 through 5 (not Kindergarten) 13 K 15 1 6 2 8 3 11 4 6 5 4 6 4 7 7 8 10 9 5 10 5 11 3 12 3
Ungraded Out-of-school 45
Total 150 Comments: Virginia does not have any students classified as ungraded.
OMB NO. 1810-0724 Page 26
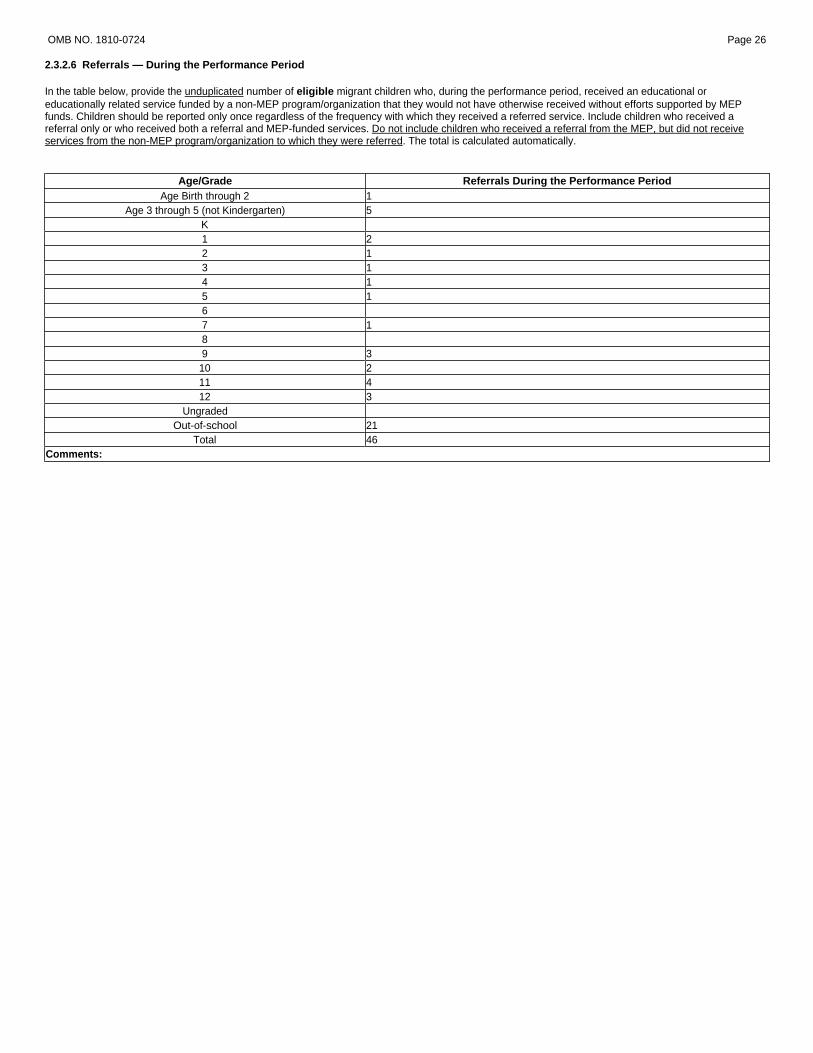
2.3.2.6 Referrals — During the Performance Period
In the table below, provide the unduplicated number of eligible migrant children who, during the performance period, received an educational or educationally related service funded by a non-MEP program/organization that they would not have otherwise received without efforts supported by MEP funds. Children should be reported only once regardless of the frequency with which they received a referred service. Include children who received a referral only or who received both a referral and MEP-funded services. Do not include children who received a referral from the MEP, but did not receive services from the non-MEP program/organization to which they were referred. The total is calculated automatically.
Age/Grade Referrals During the Performance Period
Age Birth through 2 1 Age 3 through 5 (not Kindergarten) 5
K 1 2 2 1 3 1 4 1 5 1 6 7 1 8 9 3
10 2 11 4 12 3
Ungraded Out-of-school 21
Total 46 Comments:
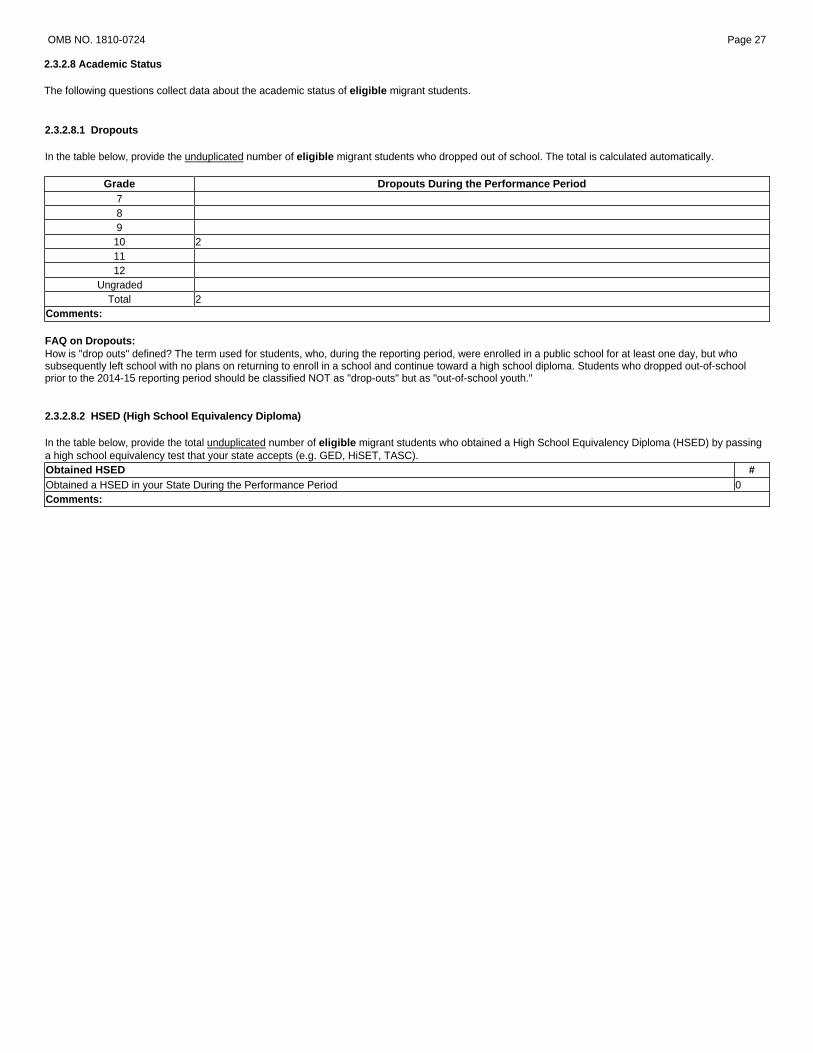
2.3.2.8 Academic Status
The following questions collect data about the academic status of eligible migrant students.
OMB NO. 1810-0724 Page 27
2.3.2.8.1 Dropouts
In the table below, provide the unduplicated number of eligible migrant students who dropped out of school. The total is calculated automatically.
Grade Dropouts During the Performance Period 7 8 9
10 2 11 12
Ungraded Total 2
Comments: FAQ on Dropouts: How is "drop outs" defined? The term used for students, who, during the reporting period, were enrolled in a public school for at least one day, but who subsequently left school with no plans on returning to enroll in a school and continue toward a high school diploma. Students who dropped out-of-school prior to the 2014-15 reporting period should be classified NOT as "drop-outs" but as "out-of-school youth."
2.3.2.8.2 HSED (High School Equivalency Diploma)
In the table below, provide the total unduplicated number of eligible migrant students who obtained a High School Equivalency Diploma (HSED) by passing a high school equivalency test that your state accepts (e.g. GED, HiSET, TASC). Obtained HSED # Obtained a HSED in your State During the Performance Period 0 Comments:
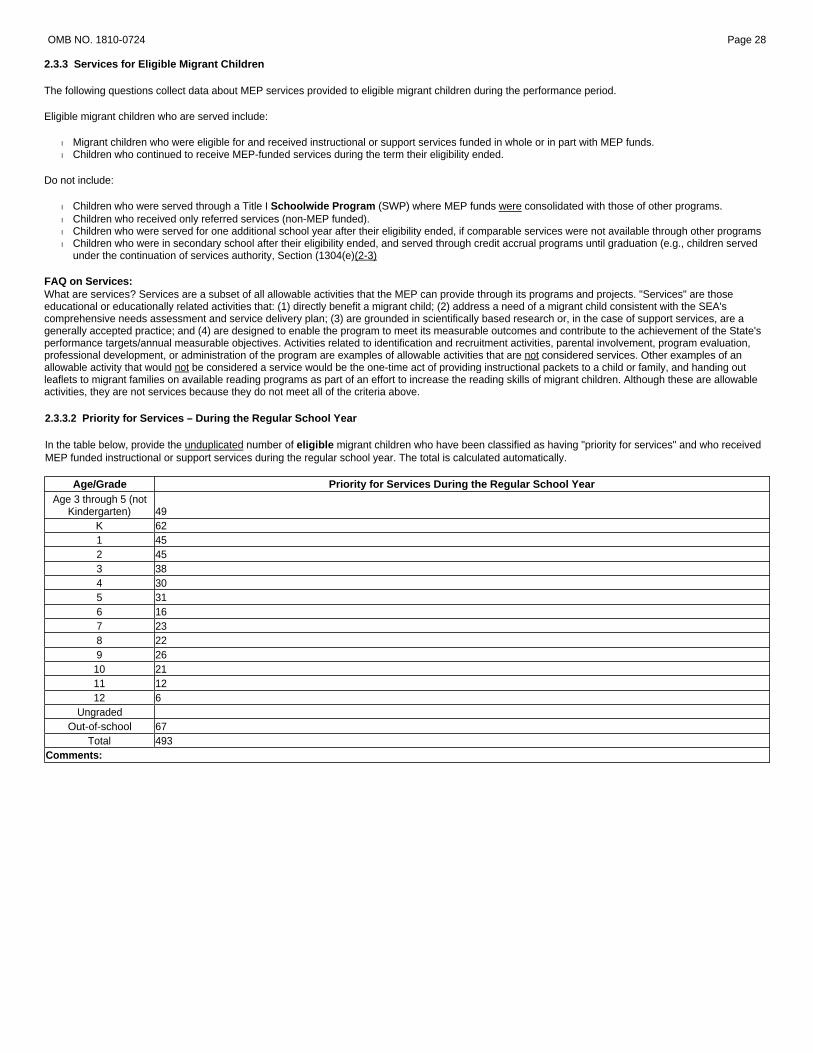
2.3.3 Services for Eligible Migrant Children The following questions collect data about MEP services provided to eligible migrant children during the performance period.
Eligible migrant children who are served include:
� Migrant children who were eligible for and received instructional or support services funded in whole or in part with MEP funds. � Children who continued to receive MEP-funded services during the term their eligibility ended.
Do not include:
� Children who were served through a Title I Schoolwide Program (SWP) where MEP funds were consolidated with those of other programs. � Children who received only referred services (non-MEP funded). � Children who were served for one additional school year after their eligibility ended, if comparable services were not available through other programs � Children who were in secondary school after their eligibility ended, and served through credit accrual programs until graduation (e.g., children served
under the continuation of services authority, Section (1304(e)(2-3)
FAQ on Services: What are services? Services are a subset of all allowable activities that the MEP can provide through its programs and projects. "Services" are those educational or educationally related activities that: (1) directly benefit a migrant child; (2) address a need of a migrant child consistent with the SEA's comprehensive needs assessment and service delivery plan; (3) are grounded in scientifically based research or, in the case of support services, are a generally accepted practice; and (4) are designed to enable the program to meet its measurable outcomes and contribute to the achievement of the State's performance targets/annual measurable objectives. Activities related to identification and recruitment activities, parental involvement, program evaluation, professional development, or administration of the program are examples of allowable activities that are not considered services. Other examples of an allowable activity that would not be considered a service would be the one-time act of providing instructional packets to a child or family, and handing out leaflets to migrant families on available reading programs as part of an effort to increase the reading skills of migrant children. Although these are allowable activities, they are not services because they do not meet all of the criteria above.
OMB NO. 1810-0724 Page 28
2.3.3.2 Priority for Services – During the Regular School Year
In the table below, provide the unduplicated number of eligible migrant children who have been classified as having "priority for services" and who received MEP funded instructional or support services during the regular school year. The total is calculated automatically.
Age/Grade Priority for Services During the Regular School Year Age 3 through 5 (not
Kindergarten) 49 K 62 1 45 2 45 3 38 4 30 5 31 6 16 7 23 8 22 9 26
10 21 11 12 12 6
Ungraded Out-of-school 67
Total 493 Comments:
OMB NO. 1810-0724 Page 29
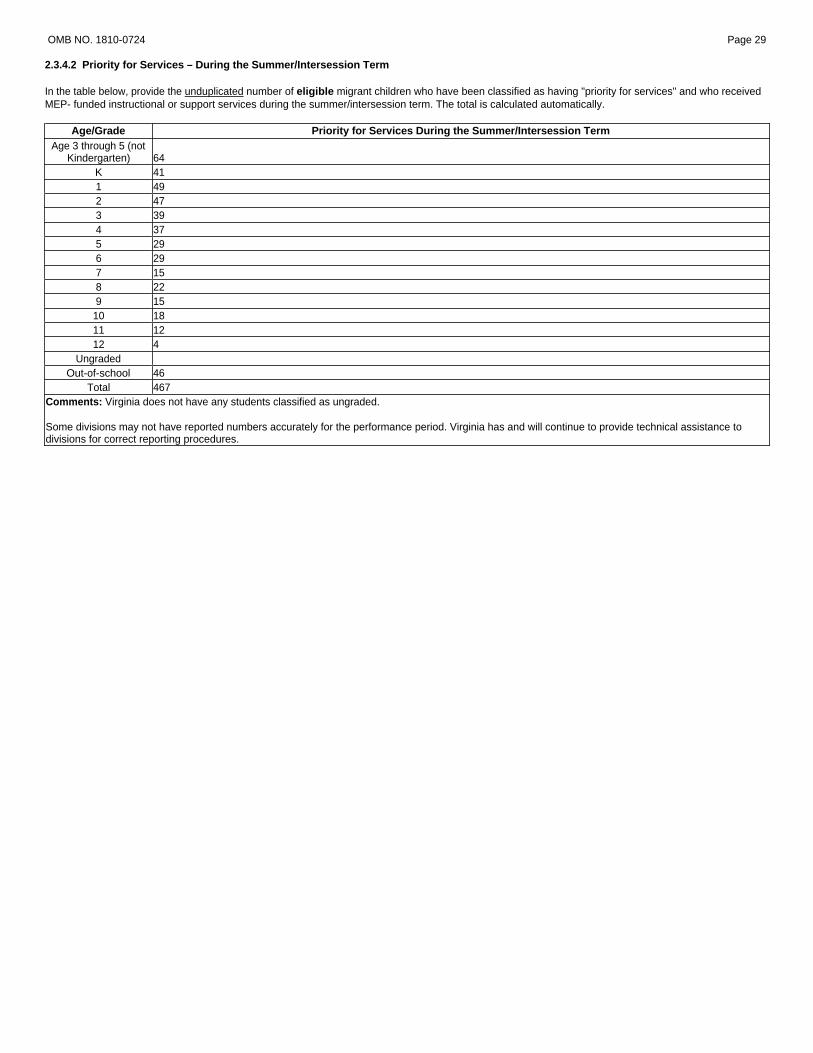
2.3.4.2 Priority for Services – During the Summer/Intersession Term
In the table below, provide the unduplicated number of eligible migrant children who have been classified as having "priority for services" and who received MEP- funded instructional or support services during the summer/intersession term. The total is calculated automatically.
Age/Grade Priority for Services During the Summer/Intersession Term Age 3 through 5 (not
Kindergarten) 64 K 41 1 49 2 47 3 39 4 37 5 29 6 29 7 15 8 22 9 15
10 18 11 12 12 4
Ungraded Out-of-school 46
Total 467 Comments: Virginia does not have any students classified as ungraded. Some divisions may not have reported numbers accurately for the performance period. Virginia has and will continue to provide technical assistance to divisions for correct reporting procedures.
OMB NO. 1810-0724 Page 30
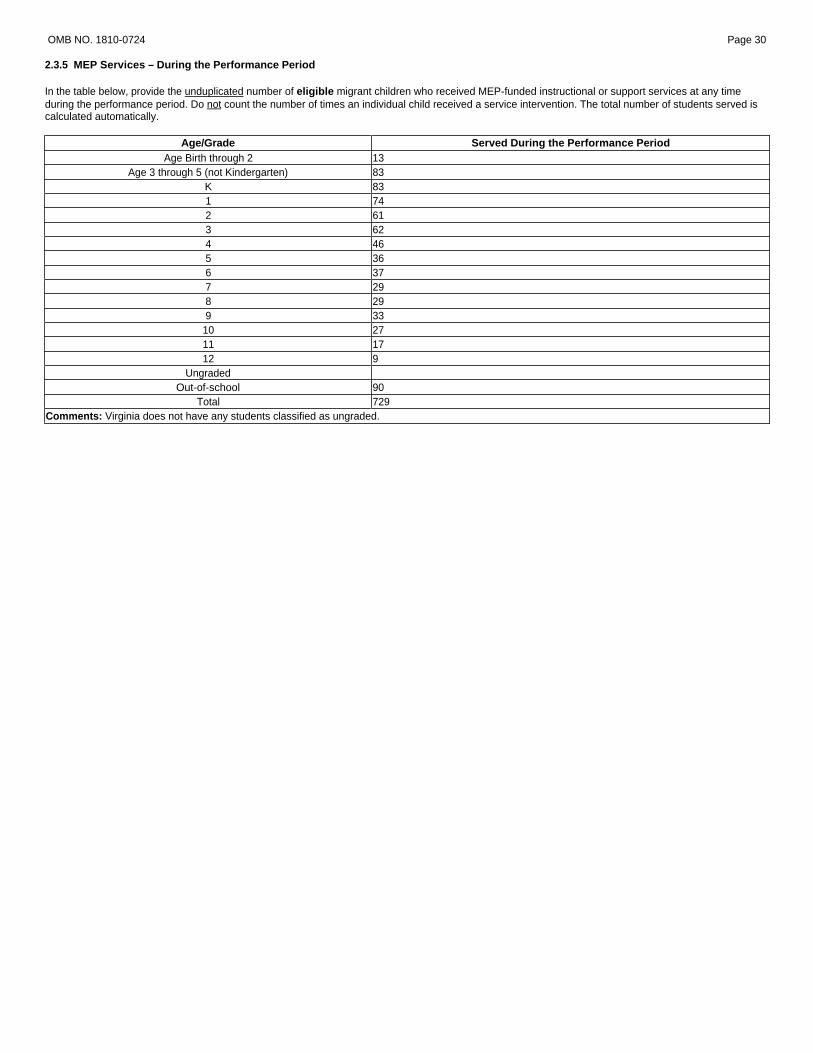
2.3.5 MEP Services – During the Performance Period
In the table below, provide the unduplicated number of eligible migrant children who received MEP-funded instructional or support services at any time during the performance period. Do not count the number of times an individual child received a service intervention. The total number of students served is calculated automatically.
Age/Grade Served During the Performance Period Age Birth through 2 13
Age 3 through 5 (not Kindergarten) 83 K 83 1 74 2 61 3 62 4 46 5 36 6 37 7 29 8 29 9 33 10 27 11 17 12 9
Ungraded Out-of-school 90
Total 729 Comments: Virginia does not have any students classified as ungraded.
OMB NO. 1810-0724 Page 31
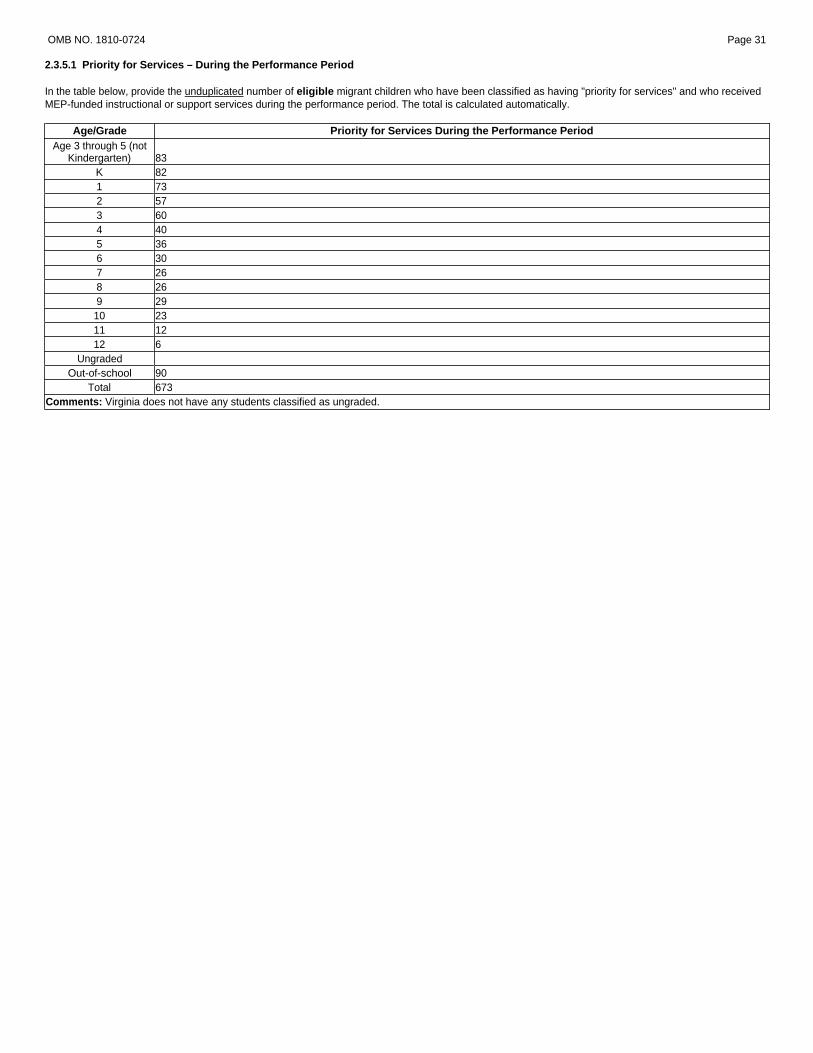
2.3.5.1 Priority for Services – During the Performance Period
In the table below, provide the unduplicated number of eligible migrant children who have been classified as having "priority for services" and who received MEP-funded instructional or support services during the performance period. The total is calculated automatically.
Age/Grade Priority for Services During the Performance Period Age 3 through 5 (not
Kindergarten) 83 K 82 1 73 2 57 3 60 4 40 5 36 6 30 7 26 8 26 9 29
10 23 11 12 12 6
Ungraded Out-of-school 90
Total 673 Comments: Virginia does not have any students classified as ungraded.
OMB NO. 1810-0724 Page 32
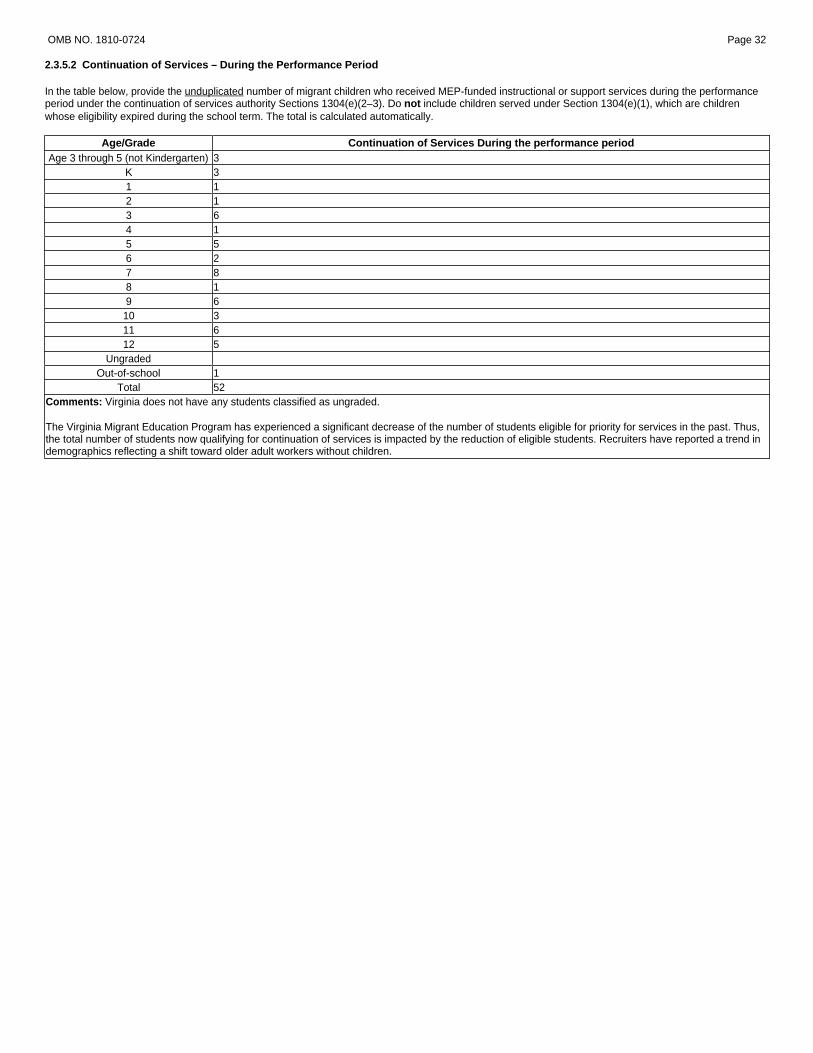
2.3.5.2 Continuation of Services – During the Performance Period
In the table below, provide the unduplicated number of migrant children who received MEP-funded instructional or support services during the performance period under the continuation of services authority Sections 1304(e)(2–3). Do not include children served under Section 1304(e)(1), which are children whose eligibility expired during the school term. The total is calculated automatically.
Age/Grade Continuation of Services During the performance period Age 3 through 5 (not Kindergarten) 3
K 3 1 1 2 1 3 6 4 1 5 5 6 2 7 8 8 1 9 6
10 3 11 6 12 5
Ungraded Out-of-school 1
Total 52 Comments: Virginia does not have any students classified as ungraded. The Virginia Migrant Education Program has experienced a significant decrease of the number of students eligible for priority for services in the past. Thus, the total number of students now qualifying for continuation of services is impacted by the reduction of eligible students. Recruiters have reported a trend in demographics reflecting a shift toward older adult workers without children.
OMB NO. 1810-0724 Page 32
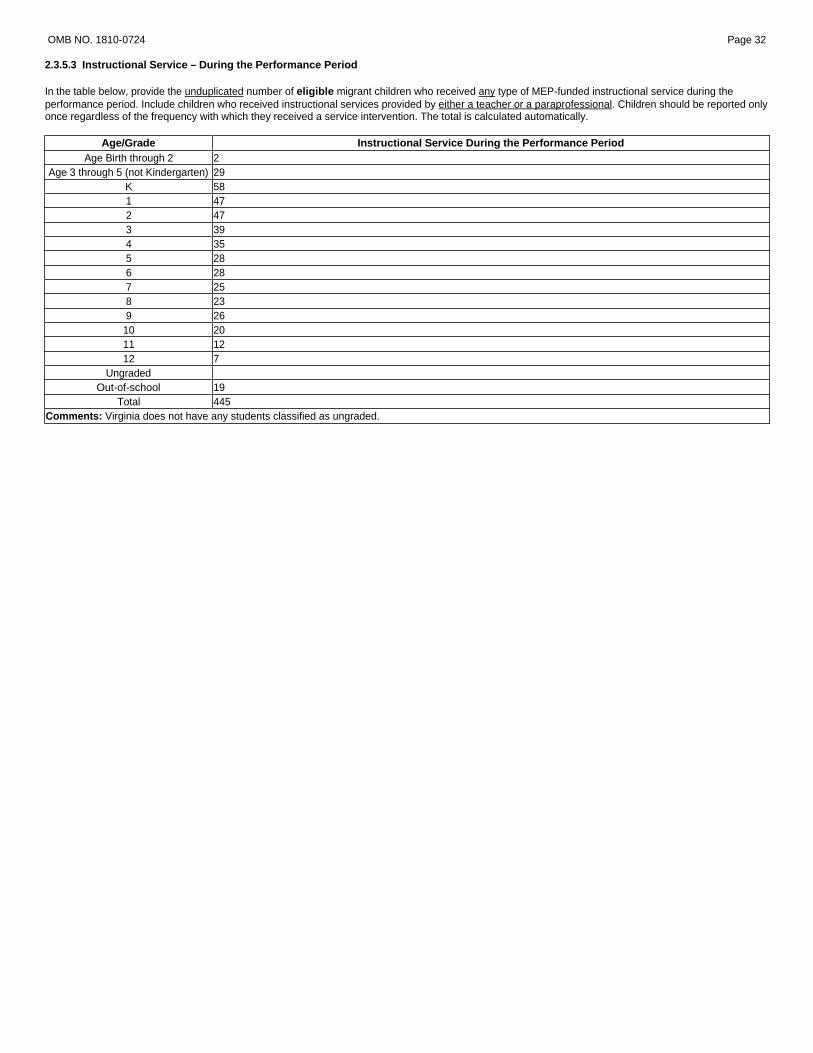
2.3.5.3 Instructional Service – During the Performance Period
In the table below, provide the unduplicated number of eligible migrant children who received any type of MEP-funded instructional service during the performance period. Include children who received instructional services provided by either a teacher or a paraprofessional. Children should be reported only once regardless of the frequency with which they received a service intervention. The total is calculated automatically.
Age/Grade Instructional Service During the Performance Period Age Birth through 2 2
Age 3 through 5 (not Kindergarten) 29 K 58 1 47 2 47 3 39 4 35 5 28 6 28 7 25 8 23 9 26
10 20 11 12 12 7
Ungraded Out-of-school 19
Total 445 Comments: Virginia does not have any students classified as ungraded.
OMB NO. 1810-0724 Page 33
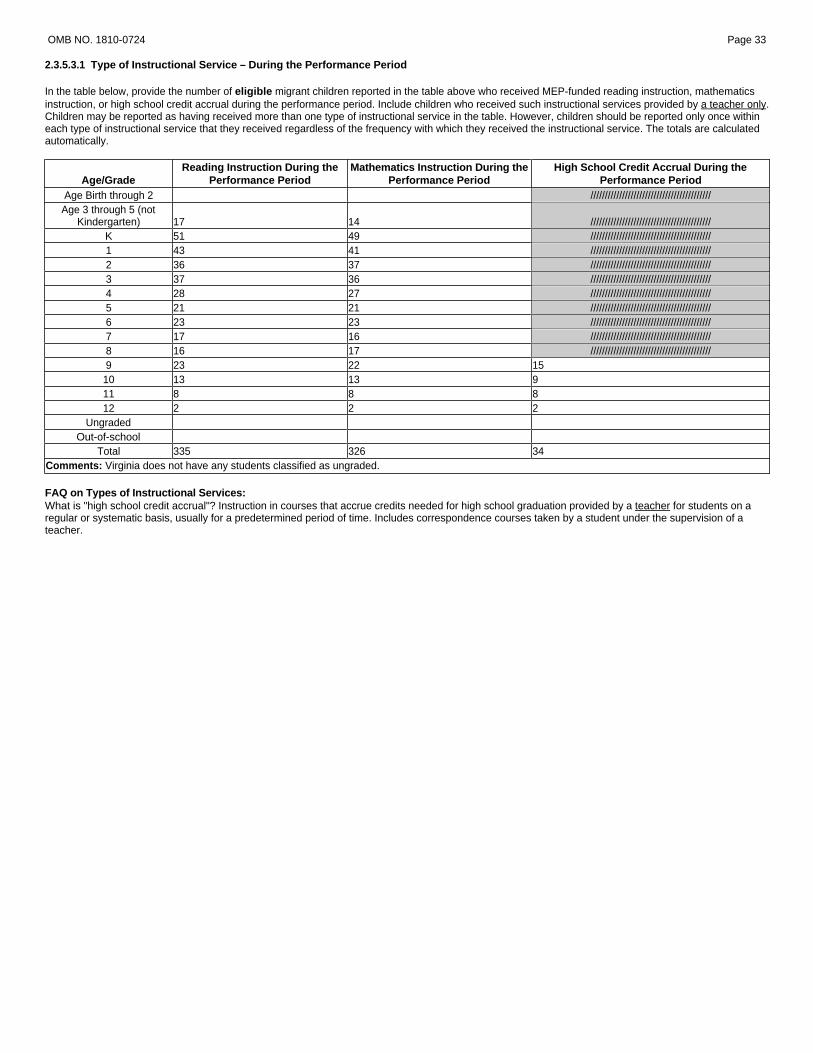
2.3.5.3.1 Type of Instructional Service – During the Performance Period
In the table below, provide the number of eligible migrant children reported in the table above who received MEP-funded reading instruction, mathematics instruction, or high school credit accrual during the performance period. Include children who received such instructional services provided by a teacher only. Children may be reported as having received more than one type of instructional service in the table. However, children should be reported only once within each type of instructional service that they received regardless of the frequency with which they received the instructional service. The totals are calculated automatically.
Age/Grade Reading Instruction During the
Performance Period Mathematics Instruction During the
Performance Period High School Credit Accrual During the
Performance Period Age Birth through 2 //////////////////////////////////////////
Age 3 through 5 (not Kindergarten) 17 14 //////////////////////////////////////////
K 51 49 ////////////////////////////////////////// 1 43 41 ////////////////////////////////////////// 2 36 37 ////////////////////////////////////////// 3 37 36 ////////////////////////////////////////// 4 28 27 ////////////////////////////////////////// 5 21 21 ////////////////////////////////////////// 6 23 23 ////////////////////////////////////////// 7 17 16 ////////////////////////////////////////// 8 16 17 ////////////////////////////////////////// 9 23 22 15
10 13 13 9 11 8 8 8 12 2 2 2
Ungraded Out-of-school
Total 335 326 34 Comments: Virginia does not have any students classified as ungraded. FAQ on Types of Instructional Services: What is "high school credit accrual"? Instruction in courses that accrue credits needed for high school graduation provided by a teacher for students on a regular or systematic basis, usually for a predetermined period of time. Includes correspondence courses taken by a student under the supervision of a teacher.

OMB NO. 1810-0724 Page 33
2.3.5.3.2 Support Services with Breakout for Counseling Services – During the Performance Period
In the table below, in the column titled Support Services, provide the unduplicated number of eligible migrant children who received any MEP-funded support service during the performace period. In the column titled Breakout of Counseling Services During the Performance Period, provide the unduplicated number of eligible migrant children who received a counseling service during the performance period. Children should be reported only once in each column regardless of the frequency with which they received a support service intervention. The totals are calculated automatically.
Age/Grade Support Services During the Performance
Period Breakout of Counseling Service During the Performance
Period Age Birth through 2 8
Age 3 through 5 (not Kindergarten) 49 6 K 61 17 1 50 11 2 48 5 3 45 12 4 37 8 5 30 7 6 29 9 7 27 6 8 25 9 9 31 8
10 25 7 11 17 6 12 9 3
Ungraded Out-of-school 67 29
Total 558 143 Comments: Virginia does not have any students classified as ungraded. FAQs on Support Services:
a. What are support services? These MEP-funded services include, but are not limited to, health, nutrition, counseling, and social services for migrant families; necessary educational supplies, and transportation. The one-time act of providing instructional or informational packets to a child or family does not constitute a support service.
b. What are counseling services? Services to help a student to better identify and enhance his or her educational, personal, or occupational potential; relate his or her abilities, emotions, and aptitudes to educational and career opportunities; utilize his or her abilities in formulating realistic plans; and achieve satisfying personal and social development. These activities take place between one or more counselors and one or more students as counselees, between students and students, and between counselors and other staff members. The services can also help the child address life problems or personal crisis that result from the culture of migrancy.
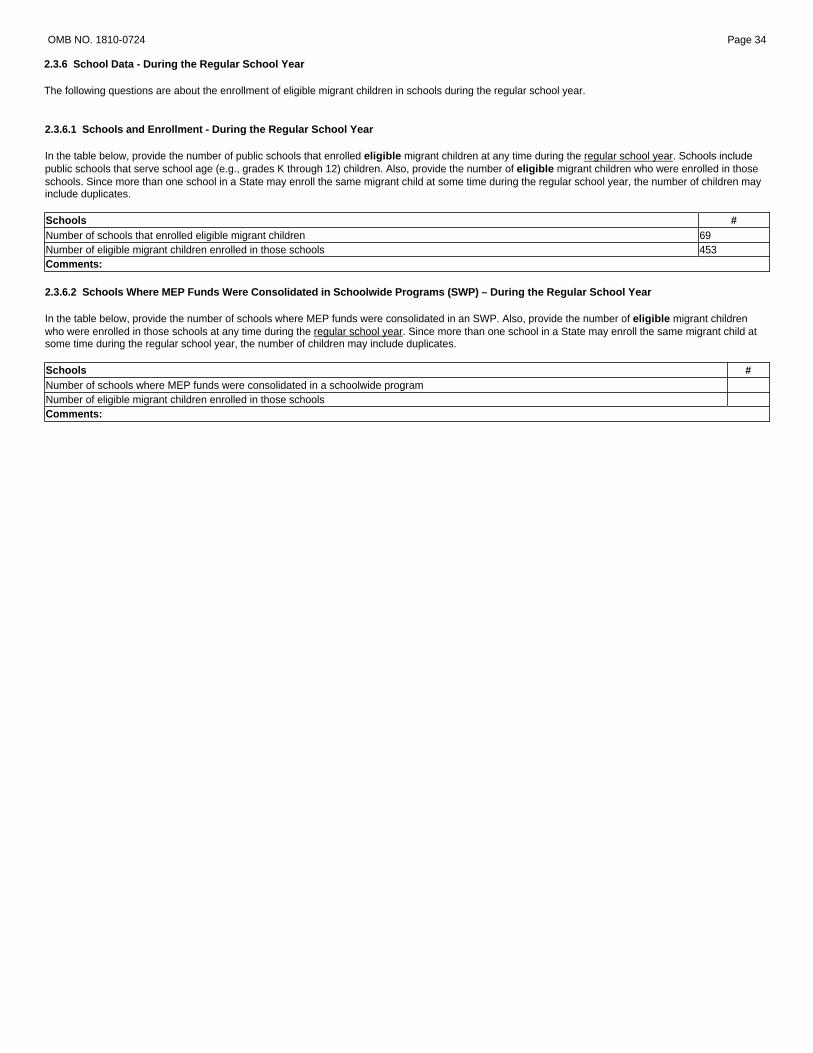
2.3.6 School Data - During the Regular School Year
The following questions are about the enrollment of eligible migrant children in schools during the regular school year.
OMB NO. 1810-0724 Page 34
2.3.6.1 Schools and Enrollment - During the Regular School Year
In the table below, provide the number of public schools that enrolled eligible migrant children at any time during the regular school year. Schools include public schools that serve school age (e.g., grades K through 12) children. Also, provide the number of eligible migrant children who were enrolled in those schools. Since more than one school in a State may enroll the same migrant child at some time during the regular school year, the number of children may include duplicates. Schools # Number of schools that enrolled eligible migrant children 69 Number of eligible migrant children enrolled in those schools 453 Comments:
2.3.6.2 Schools Where MEP Funds Were Consolidated in Schoolwide Programs (SWP) – During the Regular School Year
In the table below, provide the number of schools where MEP funds were consolidated in an SWP. Also, provide the number of eligible migrant children who were enrolled in those schools at any time during the regular school year. Since more than one school in a State may enroll the same migrant child at some time during the regular school year, the number of children may include duplicates. Schools # Number of schools where MEP funds were consolidated in a schoolwide program Number of eligible migrant children enrolled in those schools Comments:

2.3.7 MEP Project Data
The following questions collect data on MEP projects.
OMB NO. 1810-0724 Page 35
2.3.7.1 Type of MEP Project
In the table below, provide the number of projects that are funded in whole or in part with MEP funds. A MEP project is the entity that receives MEP funds from the State or through an intermediate entity that receives the MEP funds from the State and provides services directly to the migrant child. Do not include projects where MEP funds were consolidated in SWP.
Also, provide the number of migrant children served in the projects. Since children may receive services in more than one project, the number of children may include duplicates.
Type of MEP Project Number of MEP Projects Number of Migrant Children Served in the Projects Regular school year - school day only Regular school year - school day/extended day 5 47 Summer/intersession only 3 10 Year round 9 763 Comments: FAQs on type of MEP project:
a. What is a project? A project is any entity that receives MEP funds and provides services directly to migrant children in accordance with the State Service Delivery Plan and State approved subgrant applications or contracts. A project's services may be provided in one or more sites. Each project should be counted once, regardless of the number of sites in which it provides services.
b. What are Regular School Year – School Day Only projects? Projects where all MEP services are provided during the school day during the regular school year.
c. What are Regular School Year – School Day/Extended Day projects? Projects where some or all MEP services are provided during an extended day or week during the regular school year (e.g., some services are provided during the school day and some outside of the school day; e.g., all services are provided outside of the school day).
d. What are Summer/Intersession Only projects? Projects where all MEP services are provided during the summer/intersession term.
e. What are Year Round projects? Projects where all MEP services are provided during the regular school year and summer/intersession term.

2.3.8 MEP Personnel Data
The following questions collect data on MEP personnel data.
OMB NO. 1810-0724 Page 36
2.3.8.1 MEP State Director
In the table below, provide the FTE amount of time the State director performs MEP duties (regardless of whether the director is funded by State, MEP, or other funds) during the performance period (e.g., September 1 through August 31). State Director FTE 0.50 Comments: FAQs on the MEP State director
a. How is the FTE calculated for the State director? Calculate the FTE using the number of days worked for the MEP. To do so, first define how many full-time days constitute one FTE for the State director in your State for the performance period. To calculate the FTE number, sum the total days the State director worked for the MEP during the performance period and divide this sum by the number of full-time days that constitute one FTE in the reporting period.
b. Who is the State director? The manager within the SEA who administers the MEP on a statewide basis.
OMB NO. 1810-0724 Page 37
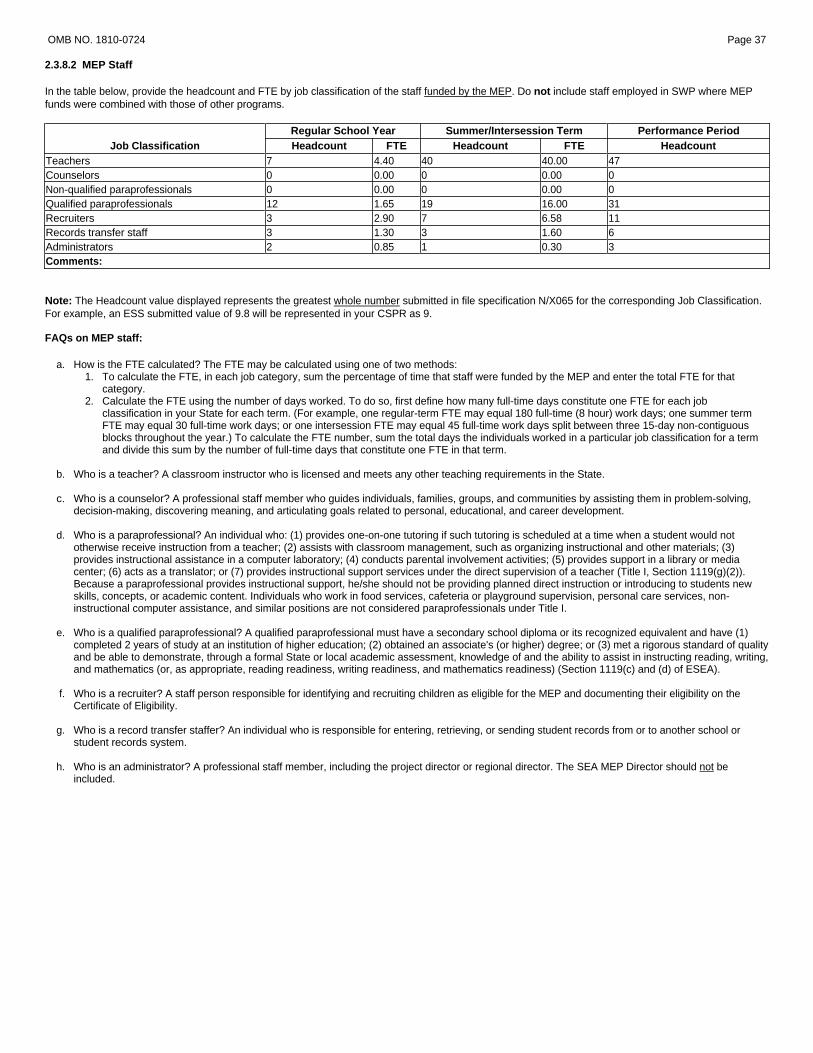
2.3.8.2 MEP Staff
In the table below, provide the headcount and FTE by job classification of the staff funded by the MEP. Do not include staff employed in SWP where MEP funds were combined with those of other programs.
Job Classification Regular School Year Summer/Intersession Term Performance Period Headcount FTE Headcount FTE Headcount
Teachers 7 4.40 40 40.00 47 Counselors 0 0.00 0 0.00 0 Non-qualified paraprofessionals 0 0.00 0 0.00 0 Qualified paraprofessionals 12 1.65 19 16.00 31 Recruiters 3 2.90 7 6.58 11 Records transfer staff 3 1.30 3 1.60 6 Administrators 2 0.85 1 0.30 3 Comments: Note: The Headcount value displayed represents the greatest whole number submitted in file specification N/X065 for the corresponding Job Classification. For example, an ESS submitted value of 9.8 will be represented in your CSPR as 9. FAQs on MEP staff:
a. How is the FTE calculated? The FTE may be calculated using one of two methods:1. To calculate the FTE, in each job category, sum the percentage of time that staff were funded by the MEP and enter the total FTE for that
category. 2. Calculate the FTE using the number of days worked. To do so, first define how many full-time days constitute one FTE for each job
classification in your State for each term. (For example, one regular-term FTE may equal 180 full-time (8 hour) work days; one summer term FTE may equal 30 full-time work days; or one intersession FTE may equal 45 full-time work days split between three 15-day non-contiguous blocks throughout the year.) To calculate the FTE number, sum the total days the individuals worked in a particular job classification for a term and divide this sum by the number of full-time days that constitute one FTE in that term.
b. Who is a teacher? A classroom instructor who is licensed and meets any other teaching requirements in the State.
c. Who is a counselor? A professional staff member who guides individuals, families, groups, and communities by assisting them in problem-solving,
decision-making, discovering meaning, and articulating goals related to personal, educational, and career development.
d. Who is a paraprofessional? An individual who: (1) provides one-on-one tutoring if such tutoring is scheduled at a time when a student would not otherwise receive instruction from a teacher; (2) assists with classroom management, such as organizing instructional and other materials; (3) provides instructional assistance in a computer laboratory; (4) conducts parental involvement activities; (5) provides support in a library or media center; (6) acts as a translator; or (7) provides instructional support services under the direct supervision of a teacher (Title I, Section 1119(g)(2)). Because a paraprofessional provides instructional support, he/she should not be providing planned direct instruction or introducing to students new skills, concepts, or academic content. Individuals who work in food services, cafeteria or playground supervision, personal care services, non-instructional computer assistance, and similar positions are not considered paraprofessionals under Title I.
e. Who is a qualified paraprofessional? A qualified paraprofessional must have a secondary school diploma or its recognized equivalent and have (1) completed 2 years of study at an institution of higher education; (2) obtained an associate's (or higher) degree; or (3) met a rigorous standard of quality and be able to demonstrate, through a formal State or local academic assessment, knowledge of and the ability to assist in instructing reading, writing, and mathematics (or, as appropriate, reading readiness, writing readiness, and mathematics readiness) (Section 1119(c) and (d) of ESEA).
f. Who is a recruiter? A staff person responsible for identifying and recruiting children as eligible for the MEP and documenting their eligibility on the Certificate of Eligibility.
g. Who is a record transfer staffer? An individual who is responsible for entering, retrieving, or sending student records from or to another school or student records system.
h. Who is an administrator? A professional staff member, including the project director or regional director. The SEA MEP Director should not be included.

2.4 PREVENTION AND INTERVENTION PROGRAMS FOR CHILDREN AND YOUTH WHO ARE NEGLECTED, DELINQUENT, OR AT RISK (TITLE I, PART D, SUBPARTS 1 AND 2) This section collects data on programs and facilities that serve students who are neglected, delinquent, or at risk under Title I, Part D, and characteristics about and services provided to these students.
Throughout this section:
� Report data for the program year of July 1, 2014 through June 30, 2015. � Count programs/facilities based on how the program was classified to ED for funding purposes. � Do not include programs funded solely through Title I, Part A. � Use the definitions listed below:
» Adult Corrections: An adult correctional institution is a facility in which persons, including persons 21 or under, are confined as a result of conviction for a criminal offense.
» At-Risk Programs: Programs operated (through LEAs) that target students who are at risk of academic failure, have a drug or alcohol problem, are pregnant or parenting, have been in contact with the juvenile justice system in the past, are at least 1 year behind the expected age/grade level, have limited English proficiency, are gang members, have dropped out of school in the past, or have a high absenteeism rate at school.
» Juvenile Corrections: An institution for delinquent children and youth is a public or private residential facility other than a foster home that is operated for the care of children and youth who have been adjudicated delinquent or in need of supervision. Include any programs serving adjudicated youth (including non-secure facilities and group homes) in this category.
» Juvenile Detention Facilities: Detention facilities are shorter-term institutions that provide care to children who require secure custody pending court adjudication, court disposition, or execution of a court order, or care to children after commitment.
» Neglected Programs: An institution for neglected children and youth is a public or private residential facility, other than a foster home, that is operated primarily for the care of children who have been committed to the institution or voluntarily placed under applicable State law due to abandonment, neglect, or death of their parents or guardians.
» Other: Any other programs, not defined above, which receive Title I, Part D funds and serve non-adjudicated children and youth.
OMB NO. 1810-0724 Page 37
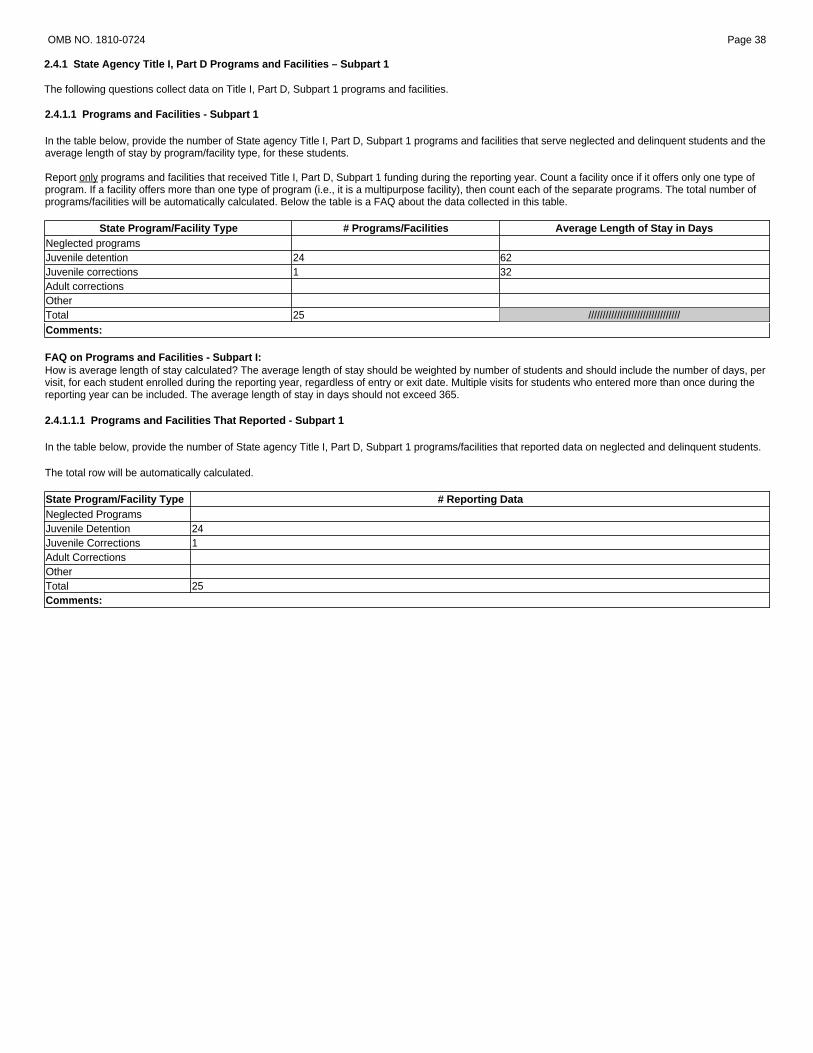
2.4.1 State Agency Title I, Part D Programs and Facilities – Subpart 1 The following questions collect data on Title I, Part D, Subpart 1 programs and facilities.
OMB NO. 1810-0724 Page 38
2.4.1.1 Programs and Facilities - Subpart 1
In the table below, provide the number of State agency Title I, Part D, Subpart 1 programs and facilities that serve neglected and delinquent students and the average length of stay by program/facility type, for these students. Report only programs and facilities that received Title I, Part D, Subpart 1 funding during the reporting year. Count a facility once if it offers only one type of program. If a facility offers more than one type of program (i.e., it is a multipurpose facility), then count each of the separate programs. The total number of programs/facilities will be automatically calculated. Below the table is a FAQ about the data collected in this table.
State Program/Facility Type # Programs/Facilities Average Length of Stay in Days Neglected programs Juvenile detention 24 62 Juvenile corrections 1 32 Adult corrections Other Total 25 //////////////////////////////// Comments: FAQ on Programs and Facilities - Subpart I: How is average length of stay calculated? The average length of stay should be weighted by number of students and should include the number of days, per visit, for each student enrolled during the reporting year, regardless of entry or exit date. Multiple visits for students who entered more than once during the reporting year can be included. The average length of stay in days should not exceed 365.
2.4.1.1.1 Programs and Facilities That Reported - Subpart 1
In the table below, provide the number of State agency Title I, Part D, Subpart 1 programs/facilities that reported data on neglected and delinquent students.
The total row will be automatically calculated. State Program/Facility Type # Reporting Data Neglected Programs Juvenile Detention 24 Juvenile Corrections 1 Adult Corrections Other Total 25 Comments:
OMB NO. 1810-0724 Page 39
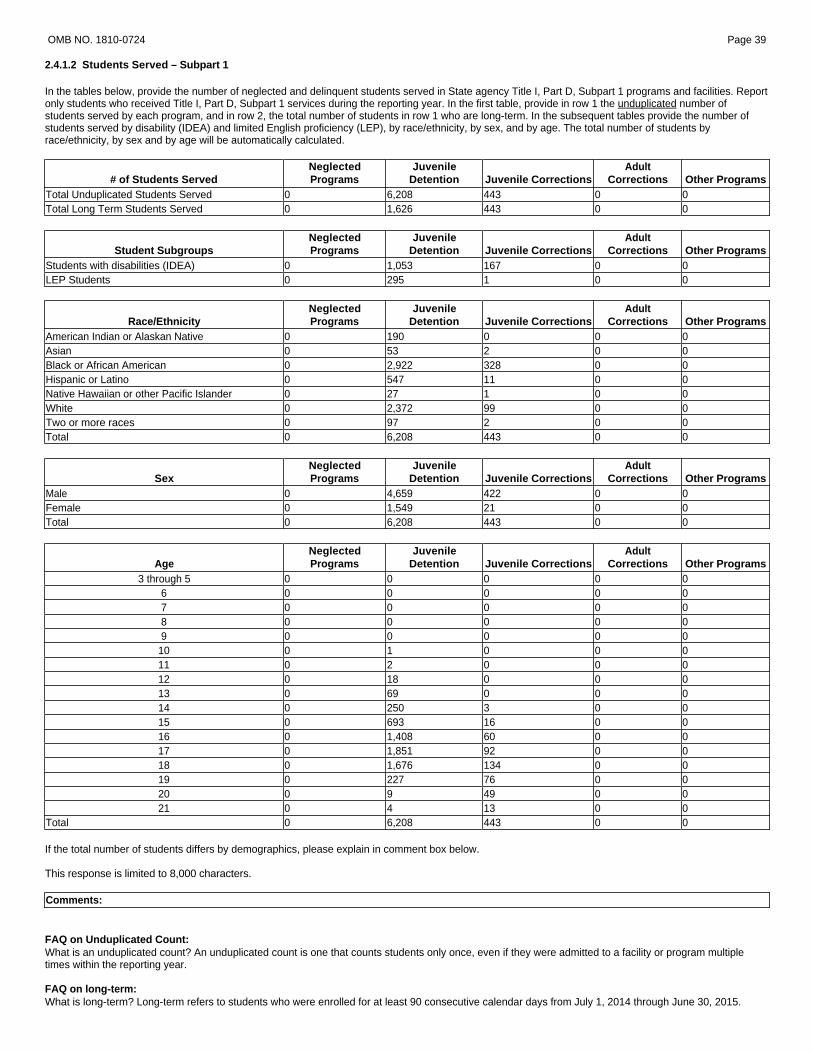
2.4.1.2 Students Served – Subpart 1
In the tables below, provide the number of neglected and delinquent students served in State agency Title I, Part D, Subpart 1 programs and facilities. Report only students who received Title I, Part D, Subpart 1 services during the reporting year. In the first table, provide in row 1 the unduplicated number of students served by each program, and in row 2, the total number of students in row 1 who are long-term. In the subsequent tables provide the number of students served by disability (IDEA) and limited English proficiency (LEP), by race/ethnicity, by sex, and by age. The total number of students by race/ethnicity, by sex and by age will be automatically calculated.
# of Students Served Neglected Programs
Juvenile Detention Juvenile Corrections
Adult Corrections Other Programs
Total Unduplicated Students Served 0 6,208 443 0 0 Total Long Term Students Served 0 1,626 443 0 0
Student Subgroups Neglected Programs
Juvenile Detention Juvenile Corrections
Adult Corrections Other Programs
Students with disabilities (IDEA) 0 1,053 167 0 0 LEP Students 0 295 1 0 0
Race/Ethnicity Neglected Programs
Juvenile Detention Juvenile Corrections
Adult Corrections Other Programs
American Indian or Alaskan Native 0 190 0 0 0 Asian 0 53 2 0 0 Black or African American 0 2,922 328 0 0 Hispanic or Latino 0 547 11 0 0 Native Hawaiian or other Pacific Islander 0 27 1 0 0 White 0 2,372 99 0 0 Two or more races 0 97 2 0 0 Total 0 6,208 443 0 0
Sex Neglected Programs
Juvenile Detention Juvenile Corrections
Adult Corrections Other Programs
Male 0 4,659 422 0 0 Female 0 1,549 21 0 0 Total 0 6,208 443 0 0
Age Neglected Programs
Juvenile Detention Juvenile Corrections
Adult Corrections Other Programs
3 through 5 0 0 0 0 0 6 0 0 0 0 0 7 0 0 0 0 0 8 0 0 0 0 0 9 0 0 0 0 0
10 0 1 0 0 0 11 0 2 0 0 0 12 0 18 0 0 0 13 0 69 0 0 0 14 0 250 3 0 0 15 0 693 16 0 0 16 0 1,408 60 0 0 17 0 1,851 92 0 0 18 0 1,676 134 0 0 19 0 227 76 0 0 20 0 9 49 0 0 21 0 4 13 0 0
Total 0 6,208 443 0 0 If the total number of students differs by demographics, please explain in comment box below. This response is limited to 8,000 characters. Comments: FAQ on Unduplicated Count: What is an unduplicated count? An unduplicated count is one that counts students only once, even if they were admitted to a facility or program multiple times within the reporting year. FAQ on long-term: What is long-term? Long-term refers to students who were enrolled for at least 90 consecutive calendar days from July 1, 2014 through June 30, 2015.
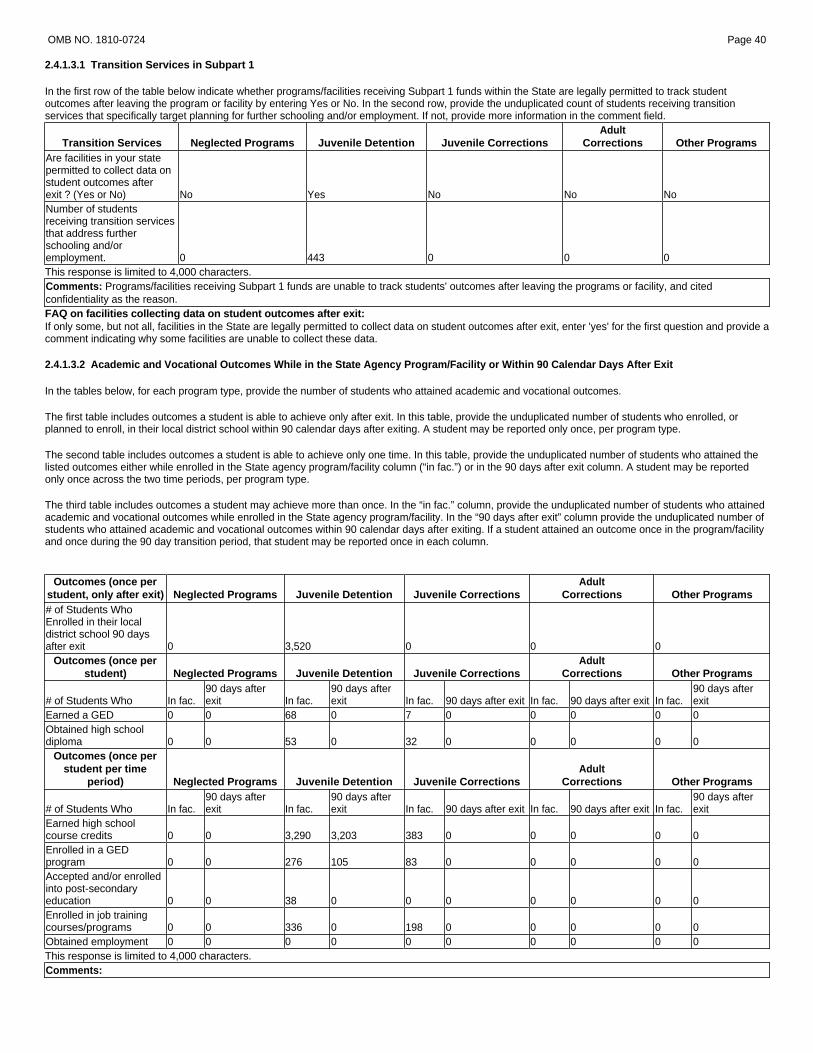
OMB NO. 1810-0724 Page 40
2.4.1.3.1 Transition Services in Subpart 1
In the first row of the table below indicate whether programs/facilities receiving Subpart 1 funds within the State are legally permitted to track student outcomes after leaving the program or facility by entering Yes or No. In the second row, provide the unduplicated count of students receiving transition services that specifically target planning for further schooling and/or employment. If not, provide more information in the comment field.
Transition Services Neglected Programs Juvenile Detention Juvenile Corrections Adult
Corrections Other Programs Are facilities in your state permitted to collect data on student outcomes after exit ? (Yes or No) No Yes No No No Number of students receiving transition services that address further schooling and/or employment. 0 443 0 0 0 This response is limited to 4,000 characters. Comments: Programs/facilities receiving Subpart 1 funds are unable to track students' outcomes after leaving the programs or facility, and cited confidentiality as the reason. FAQ on facilities collecting data on student outcomes after exit: If only some, but not all, facilities in the State are legally permitted to collect data on student outcomes after exit, enter 'yes' for the first question and provide a comment indicating why some facilities are unable to collect these data.
2.4.1.3.2 Academic and Vocational Outcomes While in the State Agency Program/Facility or Within 90 Calendar Days After Exit
In the tables below, for each program type, provide the number of students who attained academic and vocational outcomes.
The first table includes outcomes a student is able to achieve only after exit. In this table, provide the unduplicated number of students who enrolled, or planned to enroll, in their local district school within 90 calendar days after exiting. A student may be reported only once, per program type.
The second table includes outcomes a student is able to achieve only one time. In this table, provide the unduplicated number of students who attained the listed outcomes either while enrolled in the State agency program/facility column (“in fac.”) or in the 90 days after exit column. A student may be reported only once across the two time periods, per program type.
The third table includes outcomes a student may achieve more than once. In the “in fac.” column, provide the unduplicated number of students who attained academic and vocational outcomes while enrolled in the State agency program/facility. In the “90 days after exit” column provide the unduplicated number of students who attained academic and vocational outcomes within 90 calendar days after exiting. If a student attained an outcome once in the program/facility and once during the 90 day transition period, that student may be reported once in each column.
Outcomes (once per
student, only after exit) Neglected Programs Juvenile Detention Juvenile Corrections Adult
Corrections Other Programs # of Students Who Enrolled in their local district school 90 days after exit 0 3,520 0 0 0
Outcomes (once per student) Neglected Programs Juvenile Detention Juvenile Corrections
Adult Corrections Other Programs
# of Students Who In fac. 90 days after exit In fac.
90 days after exit In fac. 90 days after exit In fac. 90 days after exit In fac.
90 days after exit
Earned a GED 0 0 68 0 7 0 0 0 0 0 Obtained high school diploma 0 0 53 0 32 0 0 0 0 0
Outcomes (once per student per time
period) Neglected Programs Juvenile Detention Juvenile Corrections Adult
Corrections Other Programs
# of Students Who In fac. 90 days after exit In fac.
90 days after exit In fac. 90 days after exit In fac. 90 days after exit In fac.
90 days after exit
Earned high school course credits 0 0 3,290 3,203 383 0 0 0 0 0 Enrolled in a GED program 0 0 276 105 83 0 0 0 0 0 Accepted and/or enrolled into post-secondary education 0 0 38 0 0 0 0 0 0 0 Enrolled in job training courses/programs 0 0 336 0 198 0 0 0 0 0 Obtained employment 0 0 0 0 0 0 0 0 0 0 This response is limited to 4,000 characters. Comments:

2.4.1.6 Academic Performance – Subpart 1 The following questions collect data on the academic performance of neglected and delinquent long-term students served by Title I, Part D, Subpart 1 in reading and mathematics.
OMB NO. 1810-0724 Page 41
2.4.1.6.1 Academic Performance in Reading – Subpart 1
In the table below, provide the unduplicated number of long-term students served by Title I, Part D, Subpart 1, who participated in reading pre-and post-testing. Students should be reported in only one of the four change categories. Report only information on a student's most recent testing data. Students who were pre-tested prior to July 1, 2014, may be included if their post-test was administered during the reporting year. Students who were post-tested after the reporting year ended should be counted in the following year. Below the table is an FAQ about the data collected in this table.
Performance Data (Based on most recent
pre/post-test data) Neglected Programs
Juvenile Detention
Juvenile Corrections
Adult Corrections
Other Programs
Long-term students with negative grade level change from the pre- to post-test exams 0 405 165 0 0 Long-term students with no change in grade level from the pre- to post-test exams 0 701 0 0 0 Long-term students with improvement up to one full grade level from the pre- to post-test exams 0 264 154 0 0 Long-term students with improvement of more than one full grade level from the pre- to post-test exams 0 256 11 0 0 Comments: FAQ on long-term students: What is long-term? Long-term refers to students who were enrolled for at least 90 consecutive calendar days from July 1, 2014 through June 30, 2015.
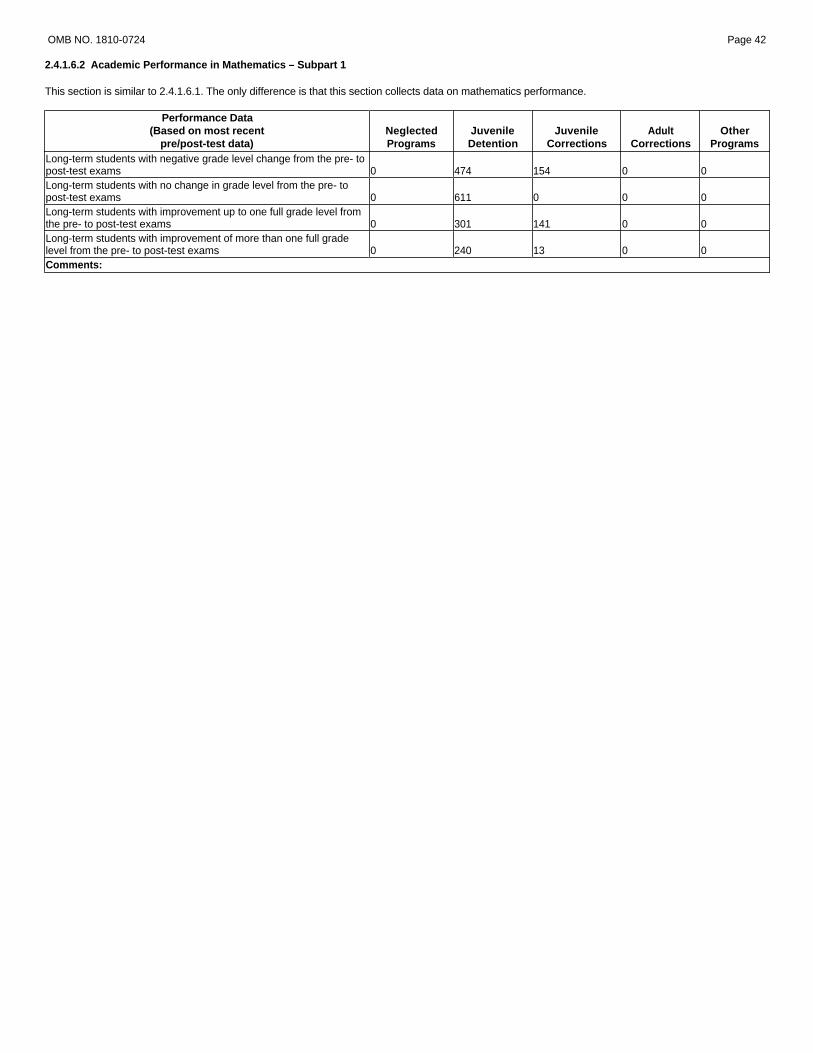
OMB NO. 1810-0724 Page 42
2.4.1.6.2 Academic Performance in Mathematics – Subpart 1
This section is similar to 2.4.1.6.1. The only difference is that this section collects data on mathematics performance.
Performance Data (Based on most recent
pre/post-test data) Neglected Programs
Juvenile Detention
Juvenile Corrections
Adult Corrections
Other Programs
Long-term students with negative grade level change from the pre- to post-test exams 0 474 154 0 0 Long-term students with no change in grade level from the pre- to post-test exams 0 611 0 0 0 Long-term students with improvement up to one full grade level from the pre- to post-test exams 0 301 141 0 0 Long-term students with improvement of more than one full grade level from the pre- to post-test exams 0 240 13 0 0 Comments:
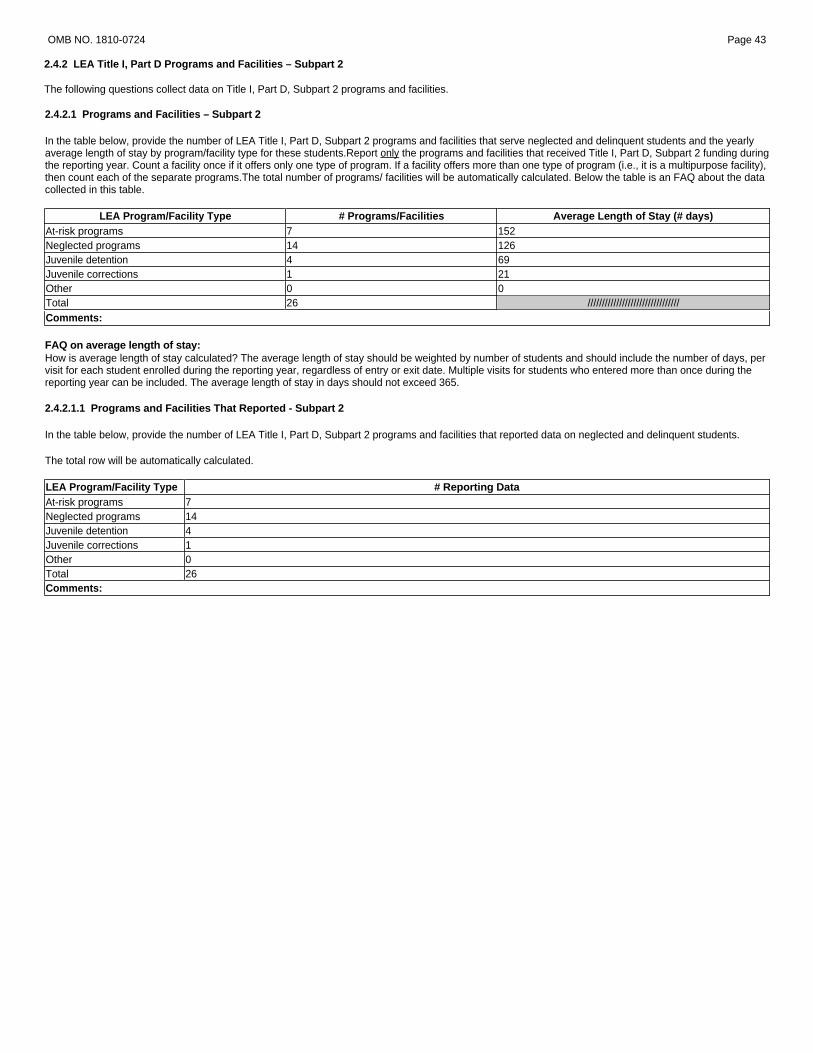
2.4.2 LEA Title I, Part D Programs and Facilities – Subpart 2 The following questions collect data on Title I, Part D, Subpart 2 programs and facilities.
OMB NO. 1810-0724 Page 43
2.4.2.1 Programs and Facilities – Subpart 2
In the table below, provide the number of LEA Title I, Part D, Subpart 2 programs and facilities that serve neglected and delinquent students and the yearly average length of stay by program/facility type for these students.Report only the programs and facilities that received Title I, Part D, Subpart 2 funding during the reporting year. Count a facility once if it offers only one type of program. If a facility offers more than one type of program (i.e., it is a multipurpose facility), then count each of the separate programs.The total number of programs/ facilities will be automatically calculated. Below the table is an FAQ about the data collected in this table.
LEA Program/Facility Type # Programs/Facilities Average Length of Stay (# days) At-risk programs 7 152 Neglected programs 14 126 Juvenile detention 4 69 Juvenile corrections 1 21 Other 0 0 Total 26 //////////////////////////////// Comments: FAQ on average length of stay: How is average length of stay calculated? The average length of stay should be weighted by number of students and should include the number of days, per visit for each student enrolled during the reporting year, regardless of entry or exit date. Multiple visits for students who entered more than once during the reporting year can be included. The average length of stay in days should not exceed 365.
2.4.2.1.1 Programs and Facilities That Reported - Subpart 2
In the table below, provide the number of LEA Title I, Part D, Subpart 2 programs and facilities that reported data on neglected and delinquent students.
The total row will be automatically calculated. LEA Program/Facility Type # Reporting Data At-risk programs 7 Neglected programs 14 Juvenile detention 4 Juvenile corrections 1 Other 0 Total 26 Comments:

OMB NO. 1810-0724 Page 44
2.4.2.2 Students Served – Subpart 2
In the tables below, provide the number of neglected and delinquent students served in LEA Title I, Part D, Subpart 2 programs and facilities. Report only students who received Title I, Part D, Subpart 2 services during the reporting year. In the first table, provide in row 1 the unduplicated number of students served by each program, and in row 2, the total number of students in row 1 who are long-term. In the subsequent tables, provide the number of students served by disability (IDEA), and limited English proficiency (LEP), by race/ethnicity, by sex, and by age. The total number of students by race/ethnicity, by sex, and by age will be automatically calculated.
# of Students Served At-Risk Programs Neglected Programs
Juvenile Detention Juvenile Corrections Other Programs
Total Unduplicated Students Served 415 1,813 445 116 0 Total Long Term Students Served 160 311 117 2 0
Student Subgroups At-Risk Programs Neglected Programs
Juvenile Detention Juvenile Corrections Other Programs
Students with disabilities (IDEA) 79 283 211 40 0 LEP Students 9 24 4 16 0
Race/Ethnicity At-Risk Programs Neglected Programs
Juvenile Detention Juvenile Corrections Other Programs
American Indian or Alaska Native 2 28 3 0 0 Asian 8 12 6 0 0 Black or African American 200 1,087 225 47 0 Hispanic or Latino 32 22 27 35 0 Native Hawaiian or other Pacific Islander 0 4 0 0 0 White 161 527 151 22 0 Two or more races 12 133 33 12 0 Total 415 1,813 445 116 0
Sex At-Risk Programs Neglected Programs
Juvenile Detention Juvenile Corrections Other Programs
Male 249 1,083 394 61 0 Female 166 730 51 55 0 Total 415 1,813 445 116 0
Age At-Risk Programs Neglected Programs
Juvenile Detention Juvenile Corrections Other Programs
3- through 5 0 13 0 0 0 6 0 73 0 0 0 7 1 80 0 0 0 8 2 98 0 0 0 9 0 101 0 0 0
10 2 103 1 1 0 11 5 94 0 2 0 12 27 161 2 2 0 13 64 209 12 15 0 14 77 237 45 18 0 15 35 179 70 22 0 16 46 152 95 31 0 17 112 148 136 25 0 18 42 136 59 0 0 19 2 20 20 0 0 20 0 9 5 0 0 21 0 0 0 0 0
Total 415 1,813 445 116 0 If the total number of students differs by demographics, please explain. The response is limited to 8,000 characters. FAQ on Unduplicated Count: What is an unduplicated count? An unduplicated count is one that counts students only once, even if they were admitted to a facility or program multiple times within the reporting year. FAQ on long-term: What is long-term? Long-term refers to students who were enrolled for at least 90 consecutive calendar days from July 1, 2014 through June 30, 2015.

OMB NO. 1810-0724 Page 45
2.4.2.3.1 Transition Services in Subpart 2
In the first row of the table below indicate whether programs/facilities receiving Subpart 2 funds within the State are legally permitted to track student outcomes after leaving the program or facility by entering Yes or No. In the second row, provide the unduplicated count of students receiving transition services that specifically target planning for further schooling and/or employment. If not, provide more information in the comment field.
Transition Services At-Risk Programs Neglected Programs Juvenile Detention Juvenile Corrections Other Programs
Are facilities in your state permitted to collect data on student outcomes after exit ? (Yes or No) Yes Yes Yes Yes N/A Number of students receiving transition services that address further schooling and/or employment. 388 112 445 40 0 This response is limited to 4,000 characters. Comments: FAQ on facilities collecting data on student outcomes after exit: If only some, but not all, facilities in the State are legally permitted to collect data on student outcomes after exit, enter 'yes' for the first question and provide a comment indicating why some facilities are unable to collect these data.
2.4.2.3.2 Academic and Vocational Outcomes While in the LEA Program/Facility or Within 90 Calendar Days After Exit
In the tables below, for each program type, provide the number of students who attained academic and vocational outcomes.
The first table includes outcomes a student is able to achieve only after exit. In this table, provide the unduplicated number of students who enrolled, or planned to enroll, in their local district school within 90 calendar days after exiting. A student may be reported only once, per program type.
The second table includes outcomes a student is able to achieve only one time. In this table, provide the unduplicated number of students who attained the listed outcomes either while enrolled in the LEA program/facility column (“in fac.”) or in the 90 days after exit column. A student may be reported only once across the two time periods, per program type.
The third table includes outcomes a student may achieve more than once. In the “in fac.” column, provide the unduplicated number of students who attained academic and vocational outcomes while enrolled in the LEA program/facility. In the “90 days after exit” column provide the unduplicated number of students who attained academic and vocational outcomes within 90 calendar days after exiting. If a student attained an outcome once in the program/facility and once during the 90 day transition period, that student may be reported once in each column.
Outcomes (once per
student), only after exit At-Risk Programs Neglected Programs Juvenile Detention Juvenile Corrections Other Programs # of Students Who Enrolled in their local district school 90 days after exit 89 1,547 287 99 0
Outcomes (once per student) At-Risk Programs Neglected Programs Juvenile Detention Juvenile Corrections Other Programs
# of Students Who In fac. 90 days after exit In fac.
90 days after exit In fac.
90 days after exit In fac. 90 days after exit In fac.
90 days after exit
Earned a GED 54 0 5 5 13 0 0 0 0 0 Obtained high school diploma 56 0 67 67 13 0 0 0 0 0
Outcomes (once per student per time
period) At-Risk Programs Neglected Programs Juvenile Detention Juvenile Corrections Other Programs
# of Students Who In fac. 90 days after exit In fac.
90 days after exit In fac.
90 days after exit In fac. 90 days after exit In fac.
90 days after exit
Earned high school course credits 109 26 568 500 52 220 0 0 0 0 Enrolled in a GED program 100 0 18 18 28 2 0 2 0 0 Accepted and/or enrolled into post-secondary education 8 3 42 43 6 0 0 0 0 0 Enrolled in job training courses/programs 106 0 244 82 139 0 0 1 0 0 Obtained employment 40 0 9 9 6 2 0 0 0 0 This response is limited to 4,000 characters. Comments:
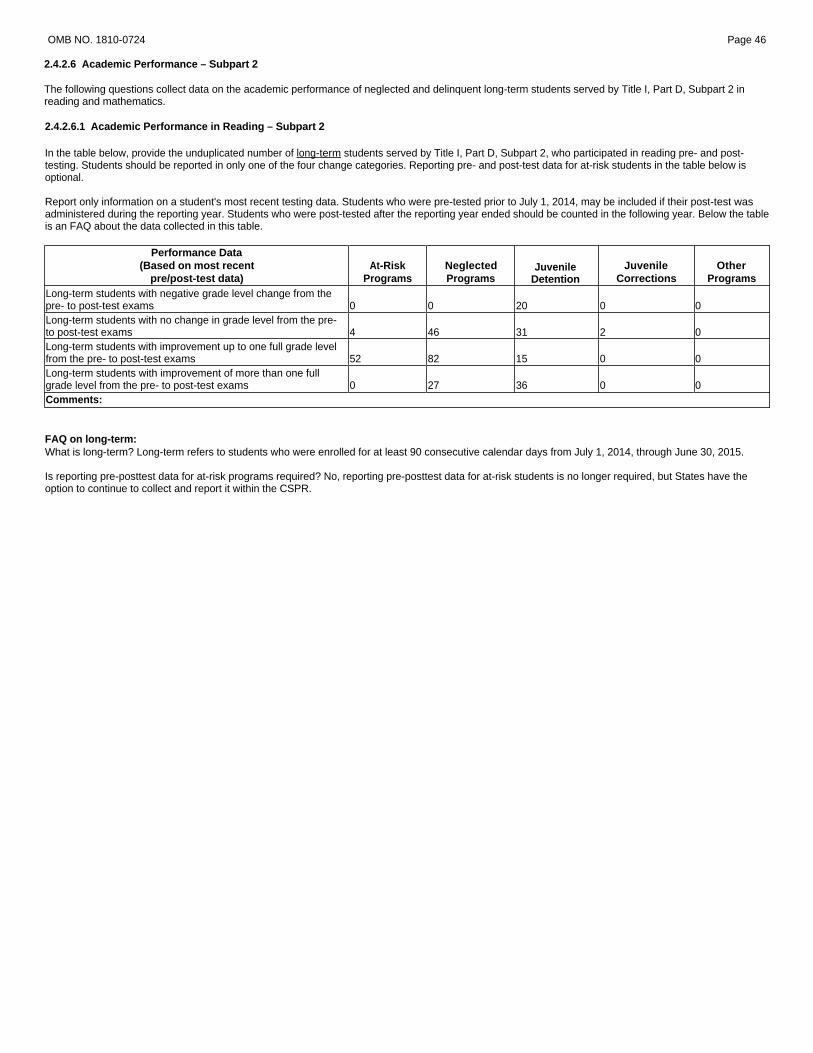
2.4.2.6 Academic Performance – Subpart 2 The following questions collect data on the academic performance of neglected and delinquent long-term students served by Title I, Part D, Subpart 2 in reading and mathematics.
OMB NO. 1810-0724 Page 46
2.4.2.6.1 Academic Performance in Reading – Subpart 2
In the table below, provide the unduplicated number of long-term students served by Title I, Part D, Subpart 2, who participated in reading pre- and post-testing. Students should be reported in only one of the four change categories. Reporting pre- and post-test data for at-risk students in the table below is optional. Report only information on a student's most recent testing data. Students who were pre-tested prior to July 1, 2014, may be included if their post-test was administered during the reporting year. Students who were post-tested after the reporting year ended should be counted in the following year. Below the table is an FAQ about the data collected in this table.
Performance Data (Based on most recent
pre/post-test data) At-Risk
Programs Neglected Programs
Juvenile Detention
Juvenile Corrections
Other Programs
Long-term students with negative grade level change from the pre- to post-test exams 0 0 20 0 0 Long-term students with no change in grade level from the pre- to post-test exams 4 46 31 2 0 Long-term students with improvement up to one full grade level from the pre- to post-test exams 52 82 15 0 0 Long-term students with improvement of more than one full grade level from the pre- to post-test exams 0 27 36 0 0 Comments: FAQ on long-term: What is long-term? Long-term refers to students who were enrolled for at least 90 consecutive calendar days from July 1, 2014, through June 30, 2015. Is reporting pre-posttest data for at-risk programs required? No, reporting pre-posttest data for at-risk students is no longer required, but States have the option to continue to collect and report it within the CSPR.
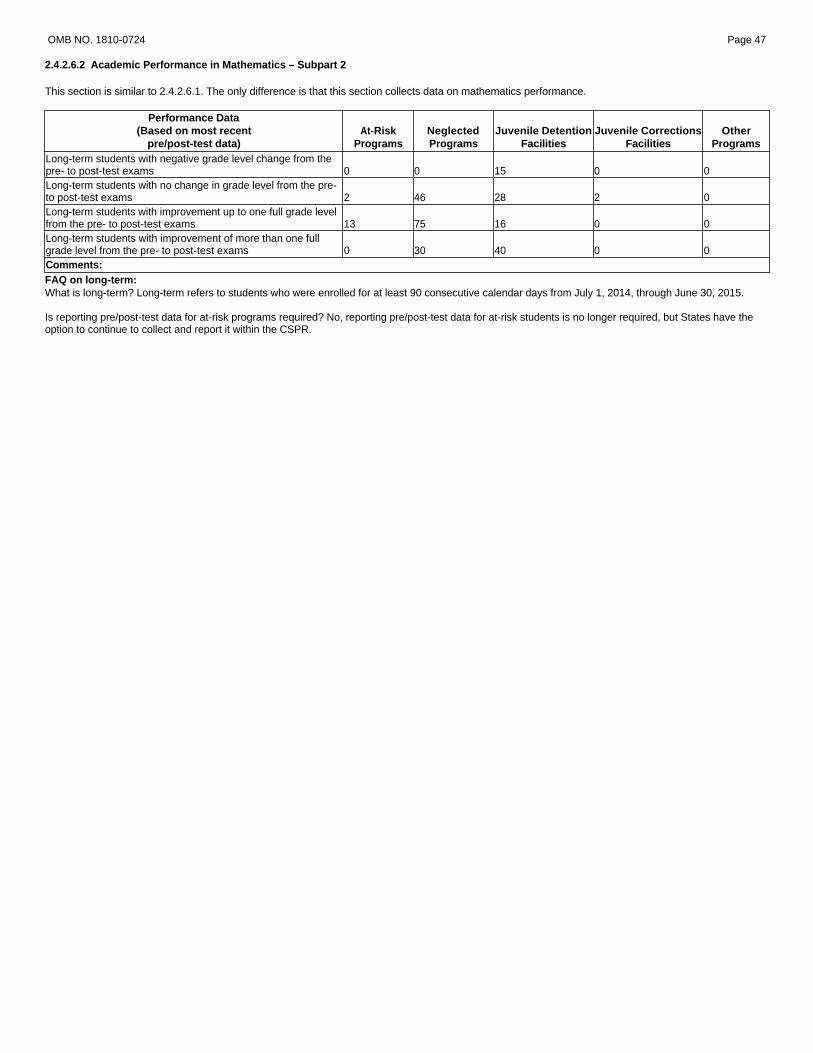
OMB NO. 1810-0724 Page 47
2.4.2.6.2 Academic Performance in Mathematics – Subpart 2
This section is similar to 2.4.2.6.1. The only difference is that this section collects data on mathematics performance.
Performance Data (Based on most recent
pre/post-test data) At-Risk
Programs Neglected Programs
Juvenile Detention Facilities
Juvenile Corrections Facilities
Other Programs
Long-term students with negative grade level change from the pre- to post-test exams 0 0 15 0 0 Long-term students with no change in grade level from the pre- to post-test exams 2 46 28 2 0 Long-term students with improvement up to one full grade level from the pre- to post-test exams 13 75 16 0 0 Long-term students with improvement of more than one full grade level from the pre- to post-test exams 0 30 40 0 0 Comments: FAQ on long-term: What is long-term? Long-term refers to students who were enrolled for at least 90 consecutive calendar days from July 1, 2014, through June 30, 2015. Is reporting pre/post-test data for at-risk programs required? No, reporting pre/post-test data for at-risk students is no longer required, but States have the option to continue to collect and report it within the CSPR.

2.9 RURAL EDUCATION ACHIEVEMENT PROGRAM (REAP) (TITLE VI, PART B, SUBPARTS 1 AND 2) This section collects data on the Rural Education Achievement Program (REAP) Title VI, Part B, Subparts 1 and 2.
OMB NO. 1810-0724 Page 48
2.9.2 LEA Use of Rural Low-Income Schools Program (RLIS) (Title VI, Part B, Subpart 2) Grant Funds
In the table below, provide the number of eligible LEAs that used RLIS funds for each of the listed purposes.
Purpose # LEAs Teacher recruitment and retention, including the use of signing bonuses and other financial incentives 6 Teacher professional development, including programs that train teachers to utilize technology to improve teaching and to train special needs teachers 36 Educational technology, including software and hardware as described in Title II, Part D 19 Parental involvement activities 3 Activities authorized under the Safe and Drug-Free Schools Program (Title IV, Part A) 12 Activities authorized under Title I, Part A 26 Activities authorized under Title III (Language instruction for LEP and immigrant students) 7 Comments:
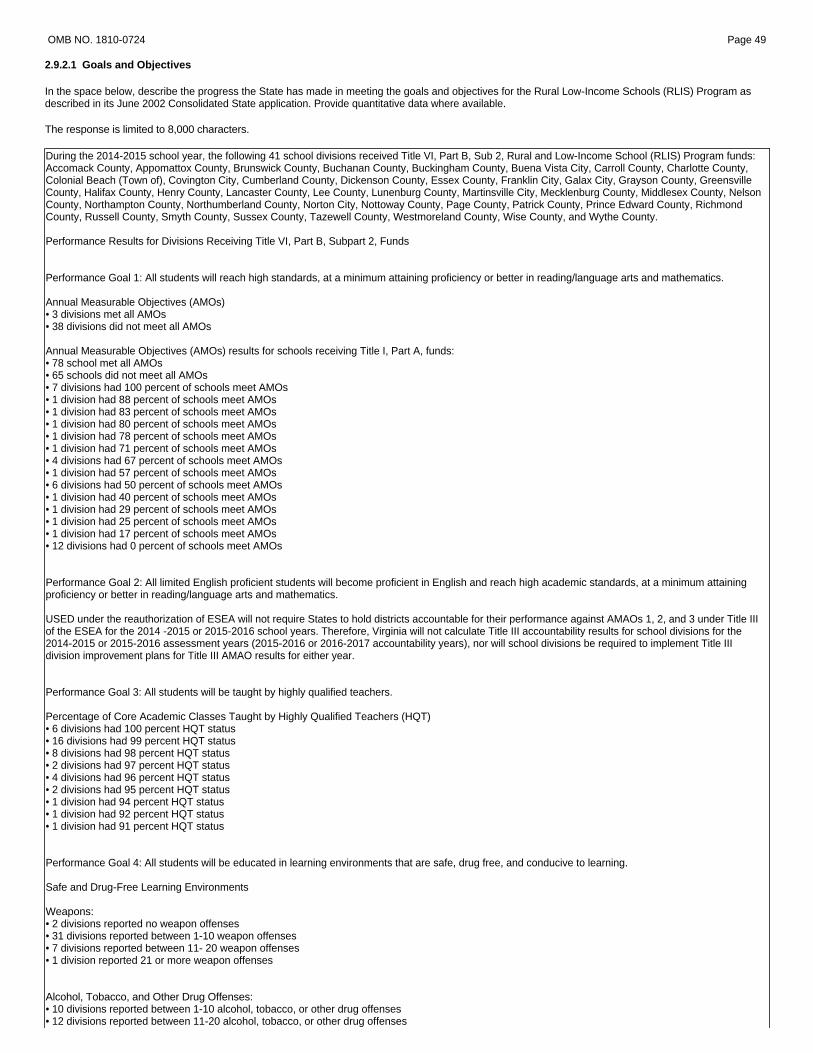
OMB NO. 1810-0724 Page 49
2.9.2.1 Goals and Objectives
In the space below, describe the progress the State has made in meeting the goals and objectives for the Rural Low-Income Schools (RLIS) Program as described in its June 2002 Consolidated State application. Provide quantitative data where available.
The response is limited to 8,000 characters. During the 2014-2015 school year, the following 41 school divisions received Title VI, Part B, Sub 2, Rural and Low-Income School (RLIS) Program funds: Accomack County, Appomattox County, Brunswick County, Buchanan County, Buckingham County, Buena Vista City, Carroll County, Charlotte County, Colonial Beach (Town of), Covington City, Cumberland County, Dickenson County, Essex County, Franklin City, Galax City, Grayson County, Greensville County, Halifax County, Henry County, Lancaster County, Lee County, Lunenburg County, Martinsville City, Mecklenburg County, Middlesex County, Nelson County, Northampton County, Northumberland County, Norton City, Nottoway County, Page County, Patrick County, Prince Edward County, Richmond County, Russell County, Smyth County, Sussex County, Tazewell County, Westmoreland County, Wise County, and Wythe County. Performance Results for Divisions Receiving Title VI, Part B, Subpart 2, Funds Performance Goal 1: All students will reach high standards, at a minimum attaining proficiency or better in reading/language arts and mathematics. Annual Measurable Objectives (AMOs) • 3 divisions met all AMOs • 38 divisions did not meet all AMOs Annual Measurable Objectives (AMOs) results for schools receiving Title I, Part A, funds: • 78 school met all AMOs • 65 schools did not meet all AMOs • 7 divisions had 100 percent of schools meet AMOs • 1 division had 88 percent of schools meet AMOs • 1 division had 83 percent of schools meet AMOs • 1 division had 80 percent of schools meet AMOs • 1 division had 78 percent of schools meet AMOs • 1 division had 71 percent of schools meet AMOs • 4 divisions had 67 percent of schools meet AMOs • 1 division had 57 percent of schools meet AMOs • 6 divisions had 50 percent of schools meet AMOs • 1 division had 40 percent of schools meet AMOs • 1 division had 29 percent of schools meet AMOs • 1 division had 25 percent of schools meet AMOs • 1 division had 17 percent of schools meet AMOs • 12 divisions had 0 percent of schools meet AMOs Performance Goal 2: All limited English proficient students will become proficient in English and reach high academic standards, at a minimum attaining proficiency or better in reading/language arts and mathematics. USED under the reauthorization of ESEA will not require States to hold districts accountable for their performance against AMAOs 1, 2, and 3 under Title III of the ESEA for the 2014 -2015 or 2015-2016 school years. Therefore, Virginia will not calculate Title III accountability results for school divisions for the 2014-2015 or 2015-2016 assessment years (2015-2016 or 2016-2017 accountability years), nor will school divisions be required to implement Title III division improvement plans for Title III AMAO results for either year. Performance Goal 3: All students will be taught by highly qualified teachers. Percentage of Core Academic Classes Taught by Highly Qualified Teachers (HQT) • 6 divisions had 100 percent HQT status • 16 divisions had 99 percent HQT status • 8 divisions had 98 percent HQT status • 2 divisions had 97 percent HQT status • 4 divisions had 96 percent HQT status • 2 divisions had 95 percent HQT status • 1 division had 94 percent HQT status • 1 division had 92 percent HQT status • 1 division had 91 percent HQT status Performance Goal 4: All students will be educated in learning environments that are safe, drug free, and conducive to learning. Safe and Drug-Free Learning Environments Weapons: • 2 divisions reported no weapon offenses • 31 divisions reported between 1-10 weapon offenses • 7 divisions reported between 11- 20 weapon offenses • 1 division reported 21 or more weapon offenses Alcohol, Tobacco, and Other Drug Offenses: • 10 divisions reported between 1-10 alcohol, tobacco, or other drug offenses • 12 divisions reported between 11-20 alcohol, tobacco, or other drug offenses

• 5 divisions reported between 21-30 alcohol, tobacco, or other drug offenses • 3 divisions reported between 31-40 alcohol, tobacco, or other drug offenses • 4 divisions reported between 41-50 alcohol, tobacco, or other drug offenses • 2 divisions reported between 61-70 alcohol, tobacco, or other drug offenses • 3 divisions reported between 71-80 alcohol, tobacco, or other drug offenses • 2 divisions reported between 130-150 alcohol, tobacco, or other drug offenses Performance Goal 5: All students will graduate from high school High School Graduation Rate - Federal Graduation Indicator (FGI) • 23 divisions met the FGI of 80 percent or more • 18 divisions did not meet the FGI of 80 percent or more

2.10 FUNDING TRANSFERABILITY FOR STATE AND LOCAL EDUCATIONAL AGENCIES (TITLE VI, PART A, SUBPART 2)
OMB NO. 1810-0724 Page 50
2.10.1 State Transferability of Funds In the table below, indicate whether the state transferred funds under the state transferability authority. State Transferability of Funds Yes/No Did the State transfer funds under the State Transferability authority of Section 6123(a) during SY 2014-15? Yes Comments:
2.10.2 Local Educational Agency (LEA) Transferability of Funds In the table below, indicate the number of LEAs that notified that state that they transferred funds under the LEA transferability authority. LEA Transferability of Funds # LEAs that notified the State that they were transferring funds under the LEA Transferability authority of Section 6123(b). 2 Comments:
2.10.2.1 LEA Funds Transfers
In the table below, provide the total number of LEAs that transferred funds from an eligible program to another eligible program.
Program
# LEAs Transferring Funds FROM Eligible
Program
# LEAs Transferring Funds TO Eligible
Program Improving Teacher Quality State Grants (Section 2121) 2 Educational Technology State Grants (Section 2412(a)(2)(A)) Safe and Drug-Free Schools and Communities (Section 4112(b)(1)) State Grants for Innovative Programs (Section 5112(a)) Title I, Part A, Improving Basic Programs Operated by LEAs 2 In the table below provide the total amount of FY 2014 appropriated funds transferred from and to each eligible program.
Program
Total Amount of Funds Transferred FROM Eligible
Program
Total Amount of Funds Transferred TO Eligible
Program Improving Teacher Quality State Grants (Section 2121) 111,855.80 Educational Technology State Grants (Section 2412(a)(2)(A)) Safe and Drug-Free Schools and Communities (Section 4112(b)(1)) State Grants for Innovative Programs (Section 5112(a)) Title I, Part A, Improving Basic Programs Operated by LEAs 111,855.80 Total 111,855.80 111,855.80 Comments: The Department plans to obtain information on the use of funds under both the State and LEA Transferability Authority through evaluation studies.
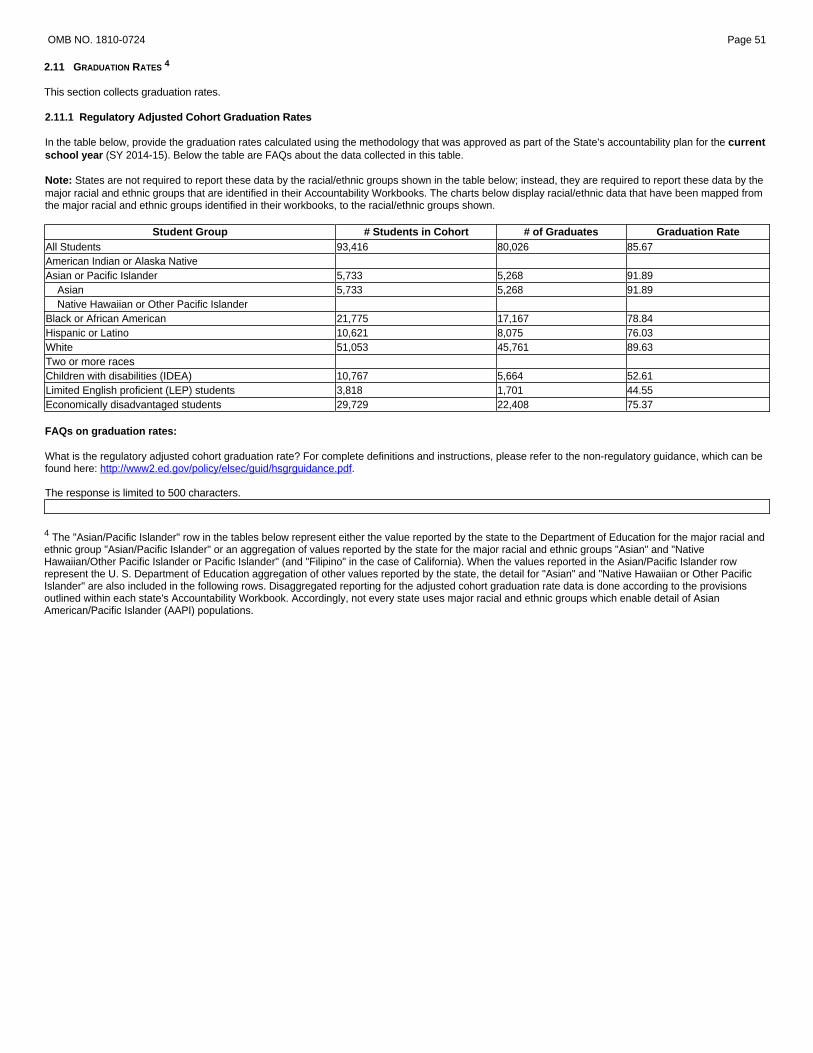
2.11 GRADUATION RATES 4 This section collects graduation rates.
4 The "Asian/Pacific Islander" row in the tables below represent either the value reported by the state to the Department of Education for the major racial and ethnic group "Asian/Pacific Islander" or an aggregation of values reported by the state for the major racial and ethnic groups "Asian" and "Native Hawaiian/Other Pacific Islander or Pacific Islander" (and "Filipino" in the case of California). When the values reported in the Asian/Pacific Islander row represent the U. S. Department of Education aggregation of other values reported by the state, the detail for "Asian" and "Native Hawaiian or Other Pacific Islander" are also included in the following rows. Disaggregated reporting for the adjusted cohort graduation rate data is done according to the provisions outlined within each state's Accountability Workbook. Accordingly, not every state uses major racial and ethnic groups which enable detail of Asian American/Pacific Islander (AAPI) populations.
OMB NO. 1810-0724 Page 51
2.11.1 Regulatory Adjusted Cohort Graduation Rates In the table below, provide the graduation rates calculated using the methodology that was approved as part of the State's accountability plan for the current school year (SY 2014-15). Below the table are FAQs about the data collected in this table. Note: States are not required to report these data by the racial/ethnic groups shown in the table below; instead, they are required to report these data by the major racial and ethnic groups that are identified in their Accountability Workbooks. The charts below display racial/ethnic data that have been mapped from the major racial and ethnic groups identified in their workbooks, to the racial/ethnic groups shown.
Student Group # Students in Cohort # of Graduates Graduation Rate All Students 93,416 80,026 85.67 American Indian or Alaska Native Asian or Pacific Islander 5,733 5,268 91.89 Asian 5,733 5,268 91.89 Native Hawaiian or Other Pacific Islander Black or African American 21,775 17,167 78.84 Hispanic or Latino 10,621 8,075 76.03 White 51,053 45,761 89.63 Two or more races Children with disabilities (IDEA) 10,767 5,664 52.61 Limited English proficient (LEP) students 3,818 1,701 44.55 Economically disadvantaged students 29,729 22,408 75.37 FAQs on graduation rates: What is the regulatory adjusted cohort graduation rate? For complete definitions and instructions, please refer to the non-regulatory guidance, which can be found here: http://www2.ed.gov/policy/elsec/guid/hsgrguidance.pdf. The response is limited to 500 characters.
2.12 LISTS OF SCHOOLS AND DISTRICTS This section contains data on school statuses. States with approved ESEA Flexibility requests should follow the instructions in sections 2.12.1 and 2.12.3. All other states should follow the instructions in sections 2.12.2 and 2.12.4. These tables will be generated based on data submitted to EDFacts and included as part of each state's certified report; states will no longer upload their lists separately. Data will be generated into separate reports for each question listed below.
2.12.1 List of Schools for ESEA Flexibility States
OMB NO. 1810-0724 Page 52
2.12.1.1 List of Reward Schools
Instructions for States that identified reward schools5 under ESEA flexibility for SY 2015-16 : Provide the information listed in the bullets below for those schools.
� District Name � District NCES ID Code � School Name � School NCES ID Code � Whether the school met the proficiency target in reading/language arts in accordance with the State's approved ESEA flexibility request � Whether the school met the 95 percent participation rate target for the reading/language arts assessment � Whether the school met the proficiency target in mathematics in accordance with the State's approved ESEA flexibility request � Whether the school met the 95 percent participation rate target for the mathematics assessment � Whether the school met the other academic indicator for elementary/middle schools (if applicable) in accordance with the State's approved ESEA
flexibility request � Whether the school met the graduation rate goal or target for high schools (if applicable) in accordance with the State's approved ESEA flexibility
request � If applicable, State-specific status in addition to reward (e.g., grade, star, or level) � Whether the school was identified as a high progress or high performing reward school � Whether (yes or no) the school is a Title I school (This information must be provided by all States.) � Whether (yes or no) the school was provided assistance through 1003(a). � Whether (yes or no) the school was provided assistance through 1003(g).
The data for this question are reported through EDFacts files and compiled in the EDEN030 "List of Reward Schools˜ report in the EDFacts Reporting System (ERS). The EDFacts files and data groups used in this report are listed in the CSPR Crosswalk. The CSPR Data Key contains more detailed information on how the data are populated into the report.
Before certifying Part II of the CSPR, a state user must run the EDEN030 report in ERS and verify that the state's data are correct . The final, certified data from this report will be made publicly available alongside the state's certified CSPR PDF. Comments:
5 The definition of reward schools is provided in the document titled, ESEA Flexibility. This document may be accessed on the Department's Web page at http://www.ed.gov/esea/flexibility/documents/esea-flexibility.doc

OMB NO. 1810-0724 Page 53
2.12.1.2 List of Priority and Focus Schools
Instructions for States that identified priority and focus schools 6 under ESEA flexibility for SY 2015-16 : Provide the information listed in the bullets below for those schools.
� District Name � District NCES ID Code � School Name � School NCES ID Code � Whether the school met the proficiency target in reading/language arts in accordance with the State's approved ESEA flexibility request � Whether the school met the 95 percent participation rate target for the reading/language arts assessment � Whether the school met the proficiency target in mathematics in accordance with the State's approved ESEA flexibility request � Whether the school met the 95 percent participation rate target for the mathematics assessment � Whether the school met the other academic indicator for elementary/middle schools (if applicable) in accordance with the State's approved ESEA
flexibility request � Whether the school met the graduation rate goal or target for high schools (if applicable) in accordance with the State's approved ESEA flexibility
request � Status for SY 2015-16 (Use one of the following status designations: priority or focus) � If applicable, State-specific status in addition to priority or focus (e.g., grade, star, or level) � Whether (yes or no) the school is a Title I school (This information must be provided by all States.) � Whether (yes or no) the school was provided assistance through Section 1003(a). � Whether (yes or no) the school was provided assistance through Section 1003(g).
The data for this question are reported through EDFacts files and compiled in the EDEN031 "List of Priority and Focus Schools" report in the EDFacts Reporting System (ERS). The EDFacts files and data groups used in this report are listed in the CSPR Crosswalk. The CSPR Data Key contains more detailed information on how the data are populated into the report.
Before certifying Part II of the CSPR, a state user must run the EDEN031 report in ERS and verify that the state's data are correct . The final, certified data from this report will be made publicly available alongside the state's certified CSPR PDF. Comments:
6 The definitions of priority and focus schools are provided in the document titled, ESEA Flexibility. This document may be accessed on the Department's Web page at http://www.ed.gov/esea/flexibility/documents/esea-flexibility.doc

OMB NO. 1810-0724 Page 54
2.12.1.3 List of Other Identified Schools
Instructions for States that identified non- priority, focus, or reward schools 7 with State-specific statuses under ESEA flexibility for SY 2015-16 : Provide the information listed in the bullets below for those schools.
� District Name � District NCES ID Code � School Name � School NCES ID Code � Whether the school met the proficiency target in reading/language arts in accordance with the State's approved ESEA flexibility request � Whether the school met the 95 percent participation rate target for the reading/language arts assessment � Whether the school met the proficiency target in mathematics in accordance with the State's approved ESEA flexibility request � Whether the school met the 95 percent participation rate target for the mathematics assessment � Whether the school met the other academic indicator for elementary/middle schools (if applicable) in accordance with the State's approved ESEA
flexibility request � Whether the school met the graduation rate goal or target for high schools (if applicable) in accordance with the State's approved ESEA flexibility
request � State-specific designation (e.g., grade, star, or level) � Whether (yes or no) the school is a Title I school (This information must be provided by all States.) � Whether (yes or no) the school was provided assistance through Section 1003(a). � Whether (yes or no) the school was provided assistance through Section 1003(g).
The data for this question are reported through EDFacts files and compiled in the EDEN032 "List of Other Identified Schools" report in the EDFacts Reporting System (ERS). The EDFacts files and data groups used in this report are listed in the CSPR Crosswalk. The CSPR Data Key contains more detailed information on how the data are populated into the report.
Before certifying Part II of the CSPR, a state user must run the EDEN032 report in ERS and verify that the state's data are correct . The final, certified data from this report will be made publicly available alongside the state's certified CSPR PDF. Comments:
7 The definitions of reward, priority, and focus schools are provided in the document titled, ESEA Flexibility.This document may be accessed on the Department's Web page at http://www.ed.gov/esea/flexibility/documents/esea-flexibility.doc.
2.12.2 List of Schools for All Other States
OMB NO. 1810-0724 Page 55
2.12.2.1 List of Schools Identified for Improvement Instructions for States that identified schools for improvement, corrective action, or restructuring under ESEA section 1116 for SY 2015-16: Provide the information listed in the bullets below for those schools.
� District Name � District NCES ID Code � School Name � School NCES ID Code � Whether the school met the proficiency target in reading/language arts in accordance with the State's Accountability Plan � Whether the school met the 95 percent participation rate target for the reading/language arts assessmentWhether the school met the proficiency
target in mathematics in accordance with the State's Accountability Plan � Whether the school met the 95 percent participation rate target for the mathematics assessment � Whether the school met the other academic indicator for elementary/middle schools (if applicable) in accordance with the State's Accountability Plan � Whether the school met the graduation rate target for high schools (if applicable) in accordance with the State's Accountability Plan � Status for SY 2015-16 (Use one of the following status designations: School Improvement – Year 1, School Improvement – Year 2, Corrective Action,
Restructuring Year 1 (planning), or Restructuring Year 2 (implementing)8 � Whether (yes or no) the school is a Title I school (This information must be provided by all States.) � Whether (yes or no) the school was provided assistance through Section 1003(a). � Whether (yes or no) the school was provided assistance through Section 1003(g).
The data for this question are reported through EDFacts files and compiled in the EDEN033 "List of Schools Identified for Improvement" report in the EDFacts Reporting System (ERS). The EDFacts files and data groups used in this report are listed in the CSPR Crosswalk. The CSPR Data Key contains more detailed information on how the data are populated into the report.
Before certifying Part II of the CSPR, a state user must run the EDEN033 report in ERS and verify that the state's data are correct . The final, certified data from this report will be made publicly available alongside the state's certified CSPR PDF. Comments:
8 The school improvement statuses are defined in LEA and School Improvement Non-Regulatory Guidance. This document may be accessed on the Department's Web page at http://www.ed.gov/policy/elsec/guid/schoolimprovementguid.doc.
2.12.3 List of Districts for ESEA Flexibility States
OMB NO. 1810-0724 Page 56
2.12.3.1 List of Identified Districts with State Specific Statuses
Instructions for States that identified school districts with State-specific statuses under ESEA flexibility for SY 2015-16: Provide the information listed in the bullets below for those districts.
� District name � District NCES ID code � Whether the district met the proficiency target in reading/language arts in accordance with the State's approved ESEA flexibility request � Whether the district met the 95 percent participation rate target for the reading/language arts assessment � Whether the district met the proficiency target in mathematics in accordance with the State's approved ESEA flexibility request � Whether the district met the 95 percent participation rate target for the mathematics assessment � Whether the district met the other academic indicator for elementary/middle schools (if applicable) in accordance with the State's approved ESEA
flexibility request � Whether the district met the graduation rate for high schools (if applicable) in accordance with the State's approved ESEA flexibility request � State-specific status for SY 2015-16 (e.g., grade, star, or level) � Whether the district received Title I funds.
The data for this question are reported through EDFacts files and compiled in the EDEN030 "List of Reward Schools˜ report in the EDFacts Reporting System (ERS). The EDFacts files and data groups used in this report are listed in the CSPR Crosswalk. The CSPR Data Key contains more detailed information on how the data are populated into the report.
Before certifying Part II of the CSPR, a state user must run the EDEN030 report in ERS and verify that the state's data are correct . The final, certified data from this report will be made publicly available alongside the state's certified CSPR PDF. Comments:
2.12.4 List of Districts for All Other States
OMB NO. 1810-0724 Page 57
2.12.4.1 List of Districts Identified for Improvement
Instructions for States that identified school districts for improvement or corrective action9 under ESEA section 1116 for SY 2015-16: Provide the information listed in the bullets below for those districts.
� District Name � District NCES ID Code � Whether the district met the proficiency target in reading/language arts as outlined in the State's Accountability Plan � Whether the district met the participation rate target for the reading/language arts assessment � Whether the district met the proficiency target in mathematics as outlined in the State's Accountability Plan � Whether the district met the participation rate target for the mathematics assessment � Whether the district met the other academic indicator for elementary/middle schools (if applicable) as outlined in the State's Accountability Plan � Whether the district met the graduation rate for high schools (if applicable) as outlined in the State's Accountability Plan � Improvement status for SY 2015-16 (Use one of the following improvement status designations: Improvement or Corrective Action) � Whether the district received Title I funds.
The data for this question are reported through EDFacts files and compiled in the EDEN035 "List of Districts Identified for Improvement" report in the EDFacts Reporting System (ERS). The EDFacts files and data groups used in this report are listed in the CSPR Crosswalk. The CSPR Data Key contains more detailed information on how the data are populated into the report.
Before certifying Part II of the CSPR, a state user must run the EDEN035 report in ERS and verify that the state's data are correct . The final, certified data from this report will be made publicly available alongside the state's certified CSPR PDF. Comments:
9 The district improvement statuses are defined in LEA and School Improvement Non-Regulatory Guidance. This document may be accessed on the Department's Web page at http://www.ed.gov/policy/elsec/guid/schoolimprovementguid.doc.