consolidated financial summary for the … financial summary for the year ended march 31, 2017 ......
TRANSCRIPT
CONSOLIDATED FINANCIAL SUMMARYFOR THE YEAR ENDED MARCH 31, 2017
(IFRS) April 27, 2017
Company Name: ANRITSU CORPORATION Stock exchange listings: Tokyo Securities code: 6754 URL: http://www.anritsu.com/ Representative: Hirokazu Hashimoto ; President and Director Inquiries: Akifumi Kubota ; Director, Senior Vice President, CFO Tel : +81 46 296 6507 Date of general shareholders' meeting (as planned): June 28, 2017 Dividend payable date (as planned): June 29, 2017 Annual securities report filing date (as planned): June 28, 2017 Supplemental material of quarterly results: Yes Convening briefing of quarterly results: Yes (for financial analysts and institutional investors)
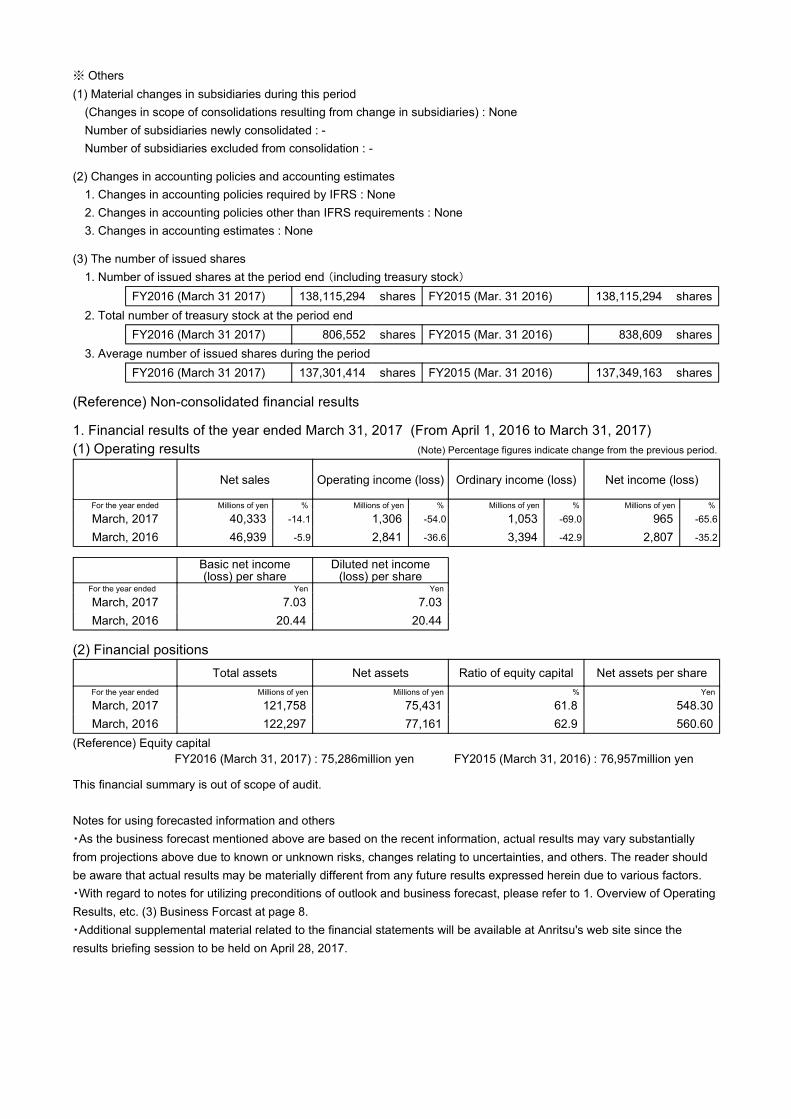
(Millions of yen, round down) 1. Consolidated financial results of the year ended March 31, 2017
(From April 1, 2016 to March 31, 2017) (1) Consolidated Operating Results (Note) Percentage figures indicate change from the previous period.
Revenue Operating profit (loss)
Profit (loss) before tax Profit (loss)
Profit (loss) attributable to
owners of parent
Total comprehensive income (loss)
For the year ended Millions of yen % Millions of yen % Millions of yen % Millions of yen % Millions of yen % Millions of yen % March, 2017 87,638 -8.3 4,234 -28.2 3,628 -33.2 2,734 -27.4 2,698 -28.3 3,274 416.8
March, 2016 95,532 -3.3 5,897 -45.8 5,434 -53.1 3,767 -52.2 3,760 -52.1 633 -94.7
Basic earnings
per share Diluted earnings
per share Profit to equity
attributable to owners of parent ratio
Profit before tax to total assets
ratio Operating profit to
revenue ratio For the year ended Yen Yen % % % March, 2017 19.65 19.65 3.5 2.9 4.8 March, 2016 27.38 27.38 4.9 4.3 6.2
(Reference) Investments accounted for using equity method FY2016 (March 31, 2017) : -million yen FY2015 (March 31, 2016) : (87)million yen
(2) Consolidated Financial Positions
Total assets Total equity Equity attributable
to owners of parent
Equity attributable to owners of parent to
total assets ratio
Equity attributable to owners of
parent per share For the year ended Millions of yen Millions of yen Millions of yen % Yen March, 2017 125,054 76,485 76,398 61.1 556.40 March, 2016 124,624 75,862 75,811 60.8 552.26
(3) Cash flows
Cash flows from
operating activities Cash flows from
investing activities Cash flows from
financing activities Cash and cash equivalents,
end of period For the year ended Millions of yen Millions of yen Millions of yen Millions of yen March, 2017 9,246 -3,665 -2,758 39,682 March, 2016 10,195 -9,042 2,450 37,391
2. Dividends
Annual dividend Total
Dividends Payout ratio
(Consolidated)
Ratio of total
amount of dividends
to equity attributable
to owners of parent
(Consolidated) First
quarter Second quarter
Third quarter
Fiscal year end Total
For the year ended Yen Yen Yen Yen Yen Millions of Yen % %
March, 2016 - 12.00 - 12.00 24.00 3,299 87.7 4.3 For the year ended
March, 2017 - 7.50 - 7.50 15.00 2,062 76.3 2.7 For the year ending March, 2018 (Forecast) - 7.50 - 7.50 15.00 68.7
3. Consolidated Forecast for the year ending March 31, 2018 (From April 1, 2017 to March 31, 2018)
(Note) Percentage figures indicate change from the previous period.
Revenue Operating profit (loss)
Profit (loss) before tax Profit (loss)
Profit (loss) attributable to
owners of parent
Basic earnings per share
Millions of yen % Millions of yen % Millions of yen % Millions of yen % Millions of yen % Yen
Annual 91,000 3.8 4,400 3.9 4,200 15.7 3,000 9.7 3,000 11.2 21.85
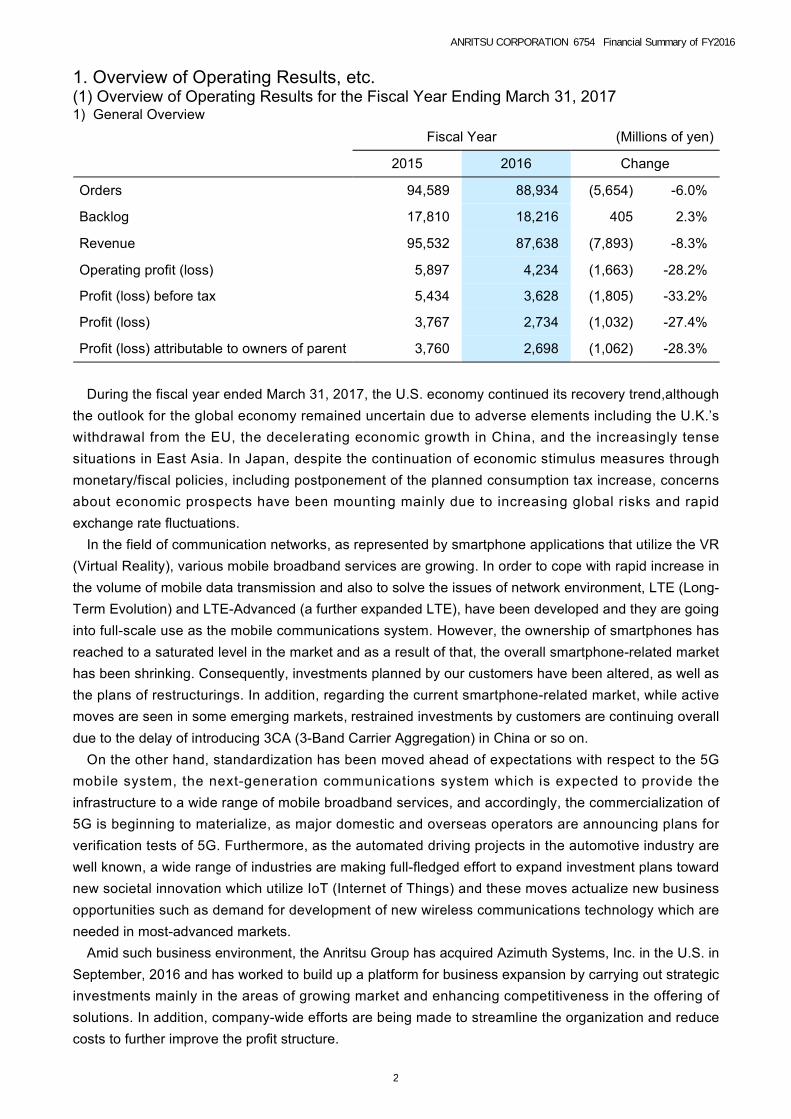
※ Others (1) Material changes in subsidiaries during this period
(Changes in scope of consolidations resulting from change in subsidiaries) : None Number of subsidiaries newly consolidated : - Number of subsidiaries excluded from consolidation : -
(2) Changes in accounting policies and accounting estimates
1. Changes in accounting policies required by IFRS : None 2. Changes in accounting policies other than IFRS requirements : None 3. Changes in accounting estimates : None
(3) The number of issued shares
1. Number of issued shares at the period end (including treasury stock) FY2016 (March 31 2017) 138,115,294 shares FY2015 (Mar. 31 2016) 138,115,294 shares
2. Total number of treasury stock at the period end FY2016 (March 31 2017) 806,552 shares FY2015 (Mar. 31 2016) 838,609 shares
3. Average number of issued shares during the period FY2016 (March 31 2017) 137,301,414 shares FY2015 (Mar. 31 2016) 137,349,163 shares
(Reference) Non-consolidated financial results 1. Financial results of the year ended March 31, 2017 (From April 1, 2016 to March 31, 2017) (1) Operating results (Note) Percentage figures indicate change from the previous period.
Net sales Operating income (loss) Ordinary income (loss) Net income (loss)
For the year ended Millions of yen % Millions of yen % Millions of yen % Millions of yen % March, 2017 40,333 -14.1 1,306 -54.0 1,053 -69.0 965 -65.6
March, 2016 46,939 -5.9 2,841 -36.6 3,394 -42.9 2,807 -35.2
Basic net income (loss) per share
Diluted net income (loss) per share
For the year ended Yen Yen March, 2017 7.03 7.03 March, 2016 20.44 20.44
(2) Financial positions
Total assets Net assets Ratio of equity capital Net assets per share For the year ended Millions of yen Millions of yen % Yen March, 2017 121,758 75,431 61.8 548.30 March, 2016 122,297 77,161 62.9 560.60
(Reference) Equity capital FY2016 (March 31, 2017) : 75,286million yen FY2015 (March 31, 2016) : 76,957million yen
This financial summary is out of scope of audit.
Notes for using forecasted information and others ・As the business forecast mentioned above are based on the recent information, actual results may vary substantially from projections above due to known or unknown risks, changes relating to uncertainties, and others. The reader should be aware that actual results may be materially different from any future results expressed herein due to various factors. ・With regard to notes for utilizing preconditions of outlook and business forecast, please refer to 1. Overview of Operating Results, etc. (3) Business Forcast at page 8. ・Additional supplemental material related to the financial statements will be available at Anritsu's web site since the results briefing session to be held on April 28, 2017.

INDEX
1. Overview of Operating Results, etc. 2
(1) Overview of Operating Results for the Fiscal Year Ended March 31, 2017 2
(2) Overview of Financial Position for the Year Ended March 31, 2017 6
(3) Business Forcast 8
(4) Profit Distribution Policy and Dividends for the Years Ended/Ending March 31, 2017 and March 31, 2018 11
(5) Risk Information 11
2.Management Policies 13
(1) Basic Policy 13
(2) Management Targets 14
(3) Medium- and Long-Term Management Strategy and Issues to be Dealt with 14
3. Basic Policy regarding Adoption of Accounting Standards 15
4. Consolidated Financial Statements 14
(1) Consolidated Statement of Financial Position 16
(2) Consolidated Statement of Profit or Loss and Other Comprehensive Income 18
(3) Consolidated Statements of Changes in Equity 19
(4) Consolidated Statements of Cash Flows 20
(5) Notes to the Consolidated Financial Statements 21
5. Non-Consolidated Financial Statements 24
(1) Non-Consolidated Balance Sheets 24
(2) Non-Consolidated Statements of Income 26
(3) Non-Consolidated Statements of Changes in Net Assets 27
6. Others 29
(1) Executive Personnel Changes Expected on June 28, 2017 29
(2) Reference Information 31
Consolidated Quarterly Financial Highlights 31
Consolidated Quarterly Financial Position 32
Consolidated Quarterly Segment Information 33
Anritsu Corporation Supplement 34
ANRITSU CORPORATION(6754) Financial Summary of FY2016
1
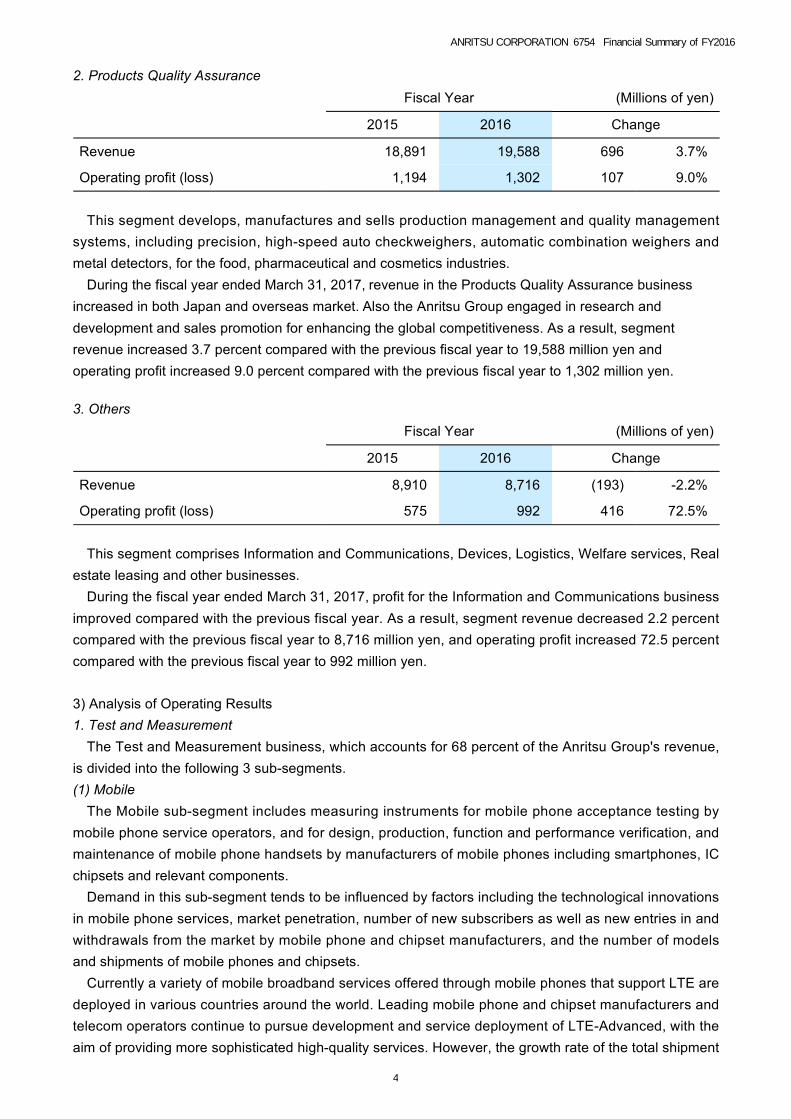
1. Overview of Operating Results, etc.(1) Overview of Operating Results for the Fiscal Year Ending March 31, 20171) General Overview
Fiscal Year (Millions of yen)
2015 2016 Change
Orders 94,589 88,934 (5,654) -6.0%
Backlog 17,810 18,216 405 2.3%
Revenue 95,532 87,638 (7,893) -8.3%
Operating profit (loss) 5,897 4,234 (1,663) -28.2%
Profit (loss) before tax 5,434 3,628 (1,805) -33.2%
Profit (loss) 3,767 2,734 (1,032) -27.4%
Profit (loss) attributable to owners of parent 3,760 2,698 (1,062) -28.3%
During the fiscal year ended March 31, 2017, the U.S. economy continued its recovery trend,although the outlook for the global economy remained uncertain due to adverse elements including the U.K.’s withdrawal from the EU, the decelerating economic growth in China, and the increasingly tense situations in East Asia. In Japan, despite the continuation of economic stimulus measures through monetary/fiscal policies, including postponement of the planned consumption tax increase, concerns about economic prospects have been mounting mainly due to increasing global risks and rapid exchange rate fluctuations.
In the field of communication networks, as represented by smartphone applications that utilize the VR (Virtual Reality), various mobile broadband services are growing. In order to cope with rapid increase in the volume of mobile data transmission and also to solve the issues of network environment, LTE (Long-Term Evolution) and LTE-Advanced (a further expanded LTE), have been developed and they are going into full-scale use as the mobile communications system. However, the ownership of smartphones has reached to a saturated level in the market and as a result of that, the overall smartphone-related market has been shrinking. Consequently, investments planned by our customers have been altered, as well as the plans of restructurings. In addition, regarding the current smartphone-related market, while active moves are seen in some emerging markets, restrained investments by customers are continuing overall due to the delay of introducing 3CA (3-Band Carrier Aggregation) in China or so on.
On the other hand, standardization has been moved ahead of expectations with respect to the 5G mobile system, the next-generation communications system which is expected to provide the infrastructure to a wide range of mobile broadband services, and accordingly, the commercialization of 5G is beginning to materialize, as major domestic and overseas operators are announcing plans for verification tests of 5G. Furthermore, as the automated driving projects in the automotive industry are well known, a wide range of industries are making full-fledged effort to expand investment plans toward new societal innovation which utilize IoT (Internet of Things) and these moves actualize new business opportunities such as demand for development of new wireless communications technology which are needed in most-advanced markets.
Amid such business environment, the Anritsu Group has acquired Azimuth Systems, Inc. in the U.S. in September, 2016 and has worked to build up a platform for business expansion by carrying out strategic investments mainly in the areas of growing market and enhancing competitiveness in the offering of solutions. In addition, company-wide efforts are being made to streamline the organization and reduce costs to further improve the profit structure.
ANRITSU CORPORATION(6754) Financial Summary of FY2016
2

During the fiscal year ended March 31, 2017, in the Test and Measurement business, while demand for measuring instruments for optical/digital device was strong, restrained investments by major players in the smartphone development and manufacturing market in North America and Asia continued. Consequently, revenue and profit in the Test and Measurement business decreased compared with the previous fiscal year. In the Products Quality Assurance business, revenue and profit increased compared with the previous fiscal year mainly due to growth in sales in Japan and overseas market. Foreign exchange losses (including fair value of foreign exchange contracts) of 529 million yen for trade receivables in foreign currency were recorded in finance income and expenses.
As a result, orders decreased 6.0 percent compared with the previous fiscal year to 88,934 million yen, and revenue decreased 8.3 percent to 87,638 million yen. Operating profit decreased 28.2 percent compared with the previous fiscal year to 4,234 million yen, profit before tax decreased 33.2 percent compared with the previous fiscal year to 3,628 million yen. Profit decreased 27.4 percent compared with the previous fiscal year to 2,734 million yen, profit attributable to owners of parent decreased 28.3 percent compared with the previous fiscal year to 2,698 million yen.
2) Overview by Segment 1. Test and Measurement Fiscal Year (Millions of yen)
2015 2016 Change
Revenue 67,729 59,333 (8,395) -12.4%
Operating profit (loss) 4,706 2,130 (2,575) -54.7%
This segment develops, manufactures and sells measuring instruments and systems for a variety of communications applications, and service assurance, to telecom operators, manufacturers of related equipment, and maintenance and installation companies around the world.
During the fiscal year ended March 31, 2017, while demand for measuring instruments for optical/digital device was strong, in the mobile market, restrained investment by customers continued, thereby revenue in the Test and Measurement business decreased compared with the previous fiscal year. Consequently, segment revenue decreased 12.4 percent compared with the previous fiscal year to 59,333 million yen, operating profit decreased 54.7 percent to 2,130 million yen and adjusted operating profit decreased 53.6 percent to 2,504 million yen. (Note) Adjusted operating profit is Anritsu’s original profit indicator to measure results of its recurring
business by excluding profit and loss items with a transient nature from operating profit.
(Unaudited information) Table of adjustment from operating profit (loss) to adjusted operating profit (loss) Fiscal Year (Millions of yen)
2015 2016 Change
Operating profit (loss) 4,706 2,130 (2,575) -54.7%
Adjustment items
Business structure improvement expenses
697 235 (462)
M&A related costs - 139 139
Adjusted operating profit (loss) 5,403 2,504 (2,899) -53.6%
ANRITSU CORPORATION(6754) Financial Summary of FY2016
3
2. Products Quality Assurance Fiscal Year (Millions of yen)
2015 2016 Change
Revenue 18,891 19,588 696 3.7%
Operating profit (loss) 1,194 1,302 107 9.0%
This segment develops, manufactures and sells production management and quality management systems, including precision, high-speed auto checkweighers, automatic combination weighers and metal detectors, for the food, pharmaceutical and cosmetics industries.
During the fiscal year ended March 31, 2017, revenue in the Products Quality Assurance business increased in both Japan and overseas market. Also the Anritsu Group engaged in research and development and sales promotion for enhancing the global competitiveness. As a result, segment revenue increased 3.7 percent compared with the previous fiscal year to 19,588 million yen and operating profit increased 9.0 percent compared with the previous fiscal year to 1,302 million yen.
3. Others Fiscal Year (Millions of yen)
2015 2016 Change
Revenue 8,910 8,716 (193) -2.2%
Operating profit (loss) 575 992 416 72.5%
This segment comprises Information and Communications, Devices, Logistics, Welfare services, Real estate leasing and other businesses.
During the fiscal year ended March 31, 2017, profit for the Information and Communications business improved compared with the previous fiscal year. As a result, segment revenue decreased 2.2 percent compared with the previous fiscal year to 8,716 million yen, and operating profit increased 72.5 percent compared with the previous fiscal year to 992 million yen.
3) Analysis of Operating Results 1. Test and Measurement
The Test and Measurement business, which accounts for 68 percent of the Anritsu Group's revenue, is divided into the following 3 sub-segments. (1) Mobile
The Mobile sub-segment includes measuring instruments for mobile phone acceptance testing by mobile phone service operators, and for design, production, function and performance verification, and maintenance of mobile phone handsets by manufacturers of mobile phones including smartphones, IC chipsets and relevant components.
Demand in this sub-segment tends to be influenced by factors including the technological innovations in mobile phone services, market penetration, number of new subscribers as well as new entries in and withdrawals from the market by mobile phone and chipset manufacturers, and the number of models and shipments of mobile phones and chipsets.
Currently a variety of mobile broadband services offered through mobile phones that support LTE are deployed in various countries around the world. Leading mobile phone and chipset manufacturers and telecom operators continue to pursue development and service deployment of LTE-Advanced, with the aim of providing more sophisticated high-quality services. However, the growth rate of the total shipment
ANRITSU CORPORATION(6754) Financial Summary of FY2016
4
of smartphones has reached a saturated level in the market, and as a result, investment continued to be restrained in the mobile phone-related market. Against the backdrop of such market changes, while a cautious stance was seen in LTE-Advanced related investments in the mobile phone development-related market, in the mobile phone manufacturing market, there was an increase in demand for more efficient measuring instruments for device manufacturing due to intensified competitions between mobile phone manufacturers.
Meanwhile, the standardization and commercialization of the 5G mobile system, the next-generation communications system which is expected to provide the infrastructure to a wide range of mobile broadband services, is beginning to materialize and demand for test and measurement is emerging in basic research and development of 5G. In addition, in the IoT field, which is driven by telecom operators, and the automated driving and in-vehicle telecom field in the automobile industry, the development of mobile communications technology to realize new services is also actualizing as a business opportunity.
Anritsu will continue to develop and launch competitive leading-edge measuring solutions, as well as accurately conduct development portfolio management, to strengthen the revenue base. (2) Network Infrastructure
The Network Infrastructure sub-segment includes network construction maintenance, monitoring and service quality assurance solutions for wireline and wireless service providers, and solutions for communication equipment manufacturer in areas including design, production and testing.
In this sub-segment, data traffic is expanding rapidly due to sophisticated cloud computing services and the spread of mobile broadband services. Therefore, telecom operators and equipment manufacturers that are pursuing higher-speed networks are concentrating on the commercialization of 100Gbps services and research and development in 400Gbps network equipment. Moreover, in order to improve mobile phone connectivity, progress is being made towards the efficient densification of base station networks by integrating wired and wireless network technologies. Along with the change of market trend, demand is growing for measuring solutions that optimize wireline and wireless technology depending on the intended use. Furthermore, mainly owing to the increase in data centers supporting cloud services, the market for high-speed data communication equipment is expanding. Along with this, research and development and manufacturing market of high-speed optical communications modules are active, creating additional demand for related measuring solutions.
Anritsu is working to expand business by providing comprehensive solutions from constructing and monitoring communications infrastructure to ensuring service quality in addition to research and development solutions for telecommunications equipment. (3) Electronics
The Electronics sub-segment includes measuring instruments widely used in the electronics industry, particularly for design, production and evaluation of electronic devices used in telecommunications network-related communications equipment and other electronic equipment.
Demand in this sub-segment tends to be impacted by the scale of production of electronic components and products used in telecommunications equipment, intelligent home appliances and automobiles.
Expansion of mobile broadband services and the use of the IoT (Internet of Things), such as smart meters, are driving growth in demand for measuring solutions for development and manufacturing of wireless modules for a broad array of applications. Furthermore, various wireless systems have been digitalized for effective use of frequency resources. Demand for measuring solutions for manufacturing and maintenance of new systems is also steadily growing.
Anritsu will work to further expand the business in this sub-segment by offering a wider range of solutions for the electronics market.
ANRITSU CORPORATION(6754) Financial Summary of FY2016
5
2. Products Quality Assurance The Products Quality Assurance business accounts for 22 percent of Anritsu Group’s revenue. Since
more than 80 percent of segment revenue is made of food manufacturers, this segment is substantially influenced by the impact of economic growth rate and changes in consumer spending which would affect results on food manufacturers’ business.
Core products include highly precise checkweighers for high-speed food processing lines, as well as X-ray and other inspection systems that detect and remove metal fragments, stones and other alien materials in the food processing process with high precision. In the Japanese market, capital investment for automation and manpower reduction in food production lines has steadily increased, against a backdrop of the customer concerns regarding contamination and rising needs for automation due to the labor shortage. In the overseas markets, progress was made in the cultivation of major customers who are operating their businesses globally in regions such as the Americas, Europe, and China and the overseas sales ratio of this business is roughly 40 percent.
Demand for quality control inspection solutions is expected to remain firm in every region of the world, as interest among food manufacturers remains high. To meet this demand, Anritsu will develop and deliver new products and quality assurance solutions, and will optimize its supply chain including overseas production in order to expand the business and increase profitability.
(2) Overview of Financial Position for the Year Ended March 31, 20171) Assets, Liabilities and Equity Ended March 31, (Millions of yen)
2016 2017 Change
Assets 124,624 125,054 429
Liabilities 48,761 48,568 (192)
Equity 75,862 76,485 622
Interest-bearing debt 22,024 22,026 2
Assets, liabilities and equity as of March 31, 2017 were as follows. 1. Assets
Total assets increased 429 million yen compared with the end of the previous fiscal year to 125,054 million yen. While cash and cash equivalents and trade and other receivables increased, inventories and property, plant and equipment decreased. 2. Liabilities
Total liabilities decreased 192 million yen compared with the end of the previous fiscal year to 48,568 million yen. This was mainly due to decrease of employee benefits in non-current liabilities, while increase of other payables in current liabilities. 3. Equity
Equity increased 622 million yen compared with the end of the previous fiscal year to 76,485 million yen. This was mainly due to increase of retained earnings while decrease of other components of equity.
As a result, the equity attributable to owners of parent to total assets ratio was 61.1 percent, compared with 60.8 percent at the end of the previous fiscal year.
Interest-bearing debt, excluding lease obligations, was 22,026 million yen, compared with 22,024 million yen at the end of the previous fiscal year.
The debt-to-equity ratio was 0.29, compared with 0.29 at the end of the previous fiscal year.
ANRITSU CORPORATION(6754) Financial Summary of FY2016
6
2) Summarized Cash Flows
Fiscal Year (Millions of yen)
2015 2016 Change
Cash flows from operating activities 10,195 9,246 (948)
Cash flows from investing activities (9,042) (3,665) 5,377
Cash flows from financing activities 2,450 (2,758) (5,209)
Cash and cash equivalents at end of period
37,391 39,682 2,290
Free cash flow 1,153 5,581 4,428
In the fiscal year ended March 31, 2017, cash and cash equivalents (hereafter,“net cash”) increased 2,290 million yen compared with the end of the previous fiscal year to 39,682 million yen.
Free cash flow, the sum of cash flows from operating activities and cash flows from investing activities, was positive 5,581 million yen (compared with positive 1,153 million yen in the previous fiscal year).
Conditions and factors for each category of cash flow for the fiscal year were as follows.
1. Cash Flows from Operating Activities Net cash provided by operating activities was 9,246 million yen (in the previous fiscal year, operating
activities provided net cash of 10,195 million yen). The cash increase was mainly due to reporting of profit before tax, recording depreciation and amortization, and decrease of inventories.
Depreciation and amortization was 4,197 million yen, an increase of 227 million yen compared with the previous fiscal year.
2. Cash Flows from Investing Activities Net cash used in investing activities was 3,665 million yen (in the previous fiscal year, investing
activities used net cash of 9,042 million yen). This was primarily due to acquisition of property, plant and equipment.
3. Cash Flows from Financing Activities Net cash used in financing activities was 2,758 million yen (in the previous fiscal year, financing
activities provided net cash of 2,450 million yen). The primary reason was payment of cash dividends totaling 2,677 million yen (in the previous fiscal year, cash dividends was 3,296 million yen).
3) Analysis of Financial Position The Anritsu Group’s funding requirements are mainly for working capital to purchase materials and
cover expenses incurred in the manufacturing, sales and marketing of products; for capital investments; and for research and development expenses. The Group secures sufficient funding to cover these requirements from retained earnings, bank borrowings, and capital market funding. To ensure stability in funding, the Anritsu Group arranged for a commitment line of 7.5 billion yen in March 2017, which is effective through March 2020. Looking forward, while preparing for unforeseen financial risks, both domestic and overseas, in a dramatically changing market environment, the Anritsu Group will swiftly and flexibly meet its capital requirements for working capital, regular repayment of long-term borrowings and business growth.
ANRITSU CORPORATION(6754) Financial Summary of FY2016
7
As of March 31, 2017, the balance of interest-bearing debt (excluding lease payable) was 22.0 billion yen (compared with 22.0 billion yen at the end of the previous fiscal year) and the debt-to-equity ratio was 0.29 (compared with 0.29 at the end of the previous fiscal year). And the net debt-to-equity ratio was negative 0.23 (compared with negative 0.20 at the end of the previous fiscal year). In addition, the average turnover ratio on the end-of-period balance of inventories to revenue was 5.0 times.
The Company will utilize increased cash flow generated by improvements in ACE (achievement of net operating profit after tax less an adjustment for the cost of capital) and CCC as well as enhanced capital efficiency resulting from measures including an internal group cash management system to make further reductions in interest-bearing debt, improve the debt-to-equity ratio, enhancing shareholders’ equity and fortify its financial structure.
At the end of March 2017, Rating and Investment Information, Inc. (R&I) has rated Anritsu’s short-term debt a-1, and its long-term debt A-. Anritsu will continue working to enhance its financial stability in order to improve its debt rating.
(Note) ACE (Anritsu Capital-cost Evaluation): Net operating profit after tax – Cost of capital Debt-to-equity ratio: Interest-bearing debt / Equity attributable to owners of parent Net debt-to-equity ratio: (Interest-bearing debt- Cash and cash equivalent) / Equity attributable to owners of parent CCC: Cash Conversion Cycle
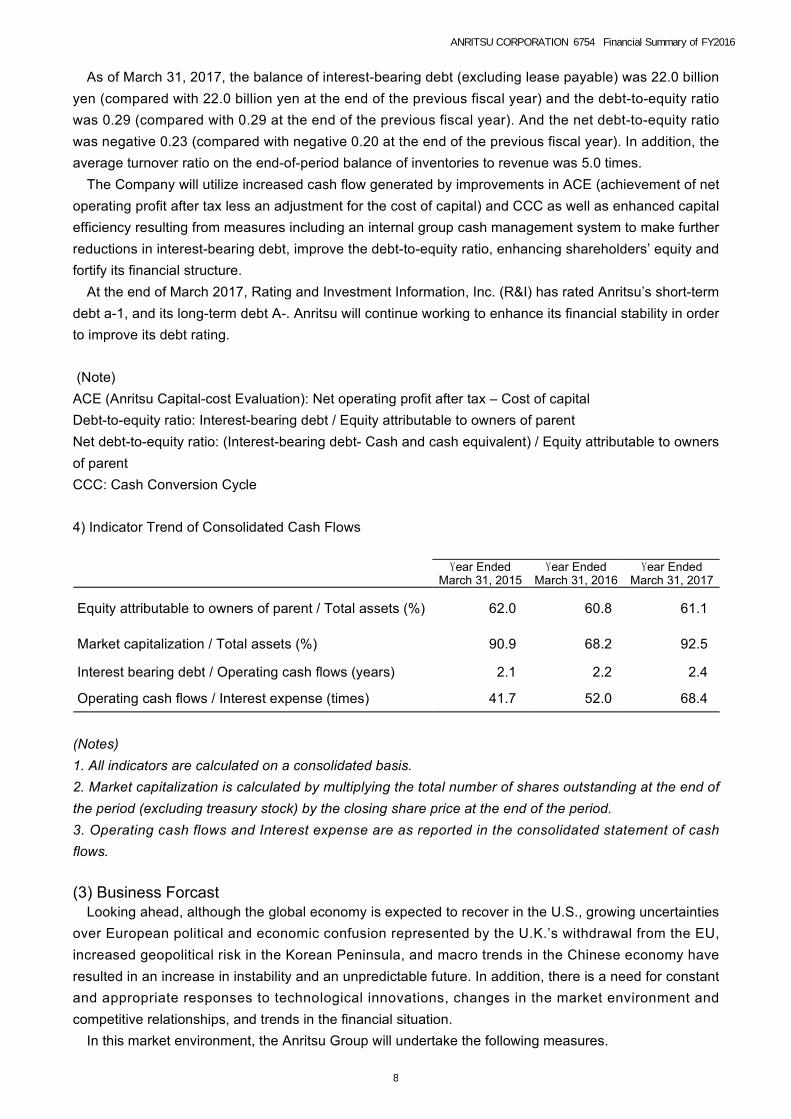
4) Indicator Trend of Consolidated Cash Flows
Year Ended
March 31, 2015 Year Ended
March 31, 2016 Year Ended
March 31, 2017
Equity attributable to owners of parent / Total assets (%) 62.0 60.8 61.1
Market capitalization / Total assets (%) 90.9 68.2 92.5
Interest bearing debt / Operating cash flows (years) 2.1 2.2 2.4
Operating cash flows / Interest expense (times) 41.7 52.0 68.4
(Notes) 1. All indicators are calculated on a consolidated basis. 2. Market capitalization is calculated by multiplying the total number of shares outstanding at the end of the period (excluding treasury stock) by the closing share price at the end of the period. 3. Operating cash flows and Interest expense are as reported in the consolidated statement of cash flows.
(3) Business ForcastLooking ahead, although the global economy is expected to recover in the U.S., growing uncertainties
over European political and economic confusion represented by the U.K.’s withdrawal from the EU, increased geopolitical risk in the Korean Peninsula, and macro trends in the Chinese economy have resulted in an increase in instability and an unpredictable future. In addition, there is a need for constant and appropriate responses to technological innovations, changes in the market environment and competitive relationships, and trends in the financial situation.
In this market environment, the Anritsu Group will undertake the following measures.
ANRITSU CORPORATION(6754) Financial Summary of FY2016
8
In the core Test and Measurement business, the Anritsu Group will strive to achieve the full-year forecast by actively investing in the next-generation 5G/IoT business and strengthening its foundation for a new revenue base in the mobile market, while expanding sales in the network infrastructure market.
1) Outlook for the Fiscal Year Ending March 31, 2018 In the mobile market, the Anritsu Group will continue to provide solutions for an acceleration of LTE-
Advanced (CA: Carrier Aggregation, MIMO: Multiple-Input and Multiple-Output, etc.) and strengthen the development of emerging markets in an effort to secure revenue, while delivering new products compatible with next-generation 5G/IoT in a timely manner. In the network infrastructure market, in order to acquire the network reshaping market which is expanding due to the explosive increase in demand for data traffic and data centers as a result of expansion of service, we will reinforce competitiveness.
The Products Quality Assurance business will maintain a stable revenue base in the Japanese market as a market leader and strive to expand market share in the growing overseas markets. In order to reinforce competitiveness in the overseas markets, we will enhance and expand the global supply chain system.
The Anritsu Group is planning on growth in revenue in the Test and Measurement business mainly in overseas market. In the Products Quality Assurance business, revenue are expected to increase in both Japan and overseas markets. The outlook for operating profit and profit shows increases from the fiscal year ended March 31, 2017.
2) Cash Flow Outlook for the Year Ending March 31, 2018 1. Cash Flows from Operating Activities The Anritsu Group expects cash flows from operating activities to be positive, mainly due to reporting of profit before tax. The Anritsu Group will aim to improve its cash conversion cycle to make more effective use of operating assets such as trade receivables and inventories. 2. Cash Flows from Investing Activities The Anritsu Group expects cash flows from investing activities to be negative due to capital expenditure. Capital expenditures will include regular investments to strengthen the foundation of its product development environment, as well as strategic investments in global information system. 3. Cash Flows from Financing Activities The Anritsu Group expects cash flows from financing activities to be negative, mainly due to payment of dividends.
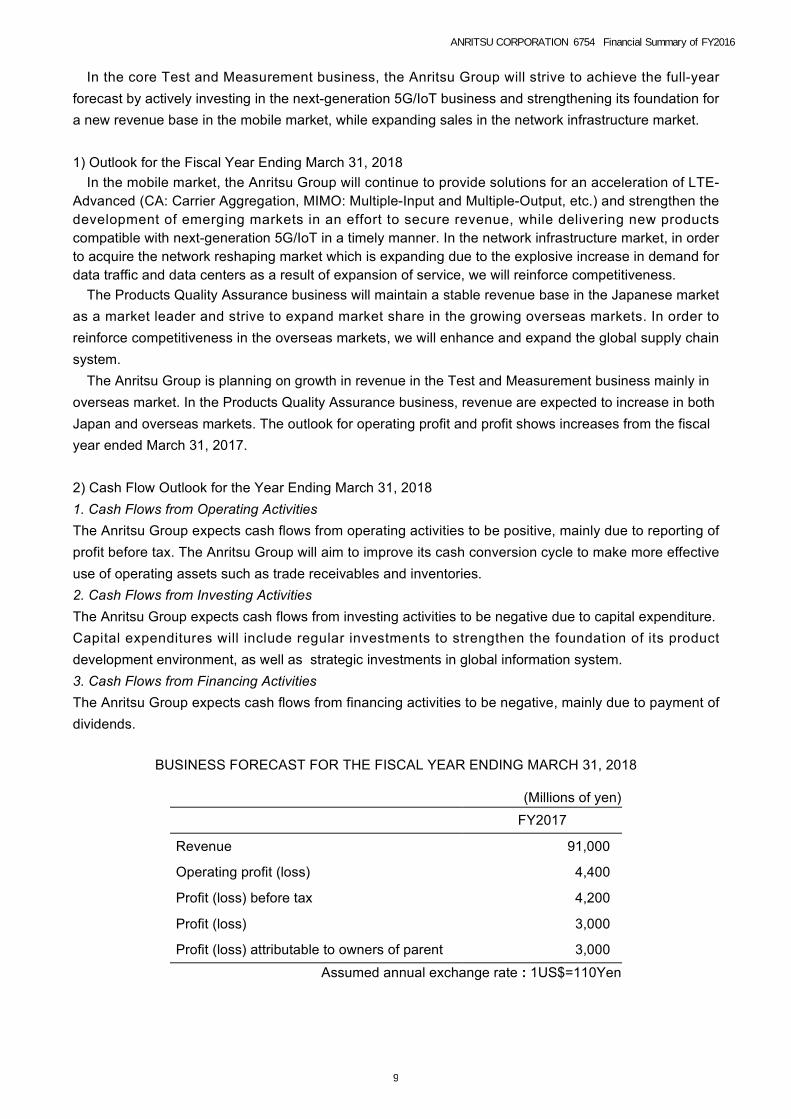
BUSINESS FORECAST FOR THE FISCAL YEAR ENDING MARCH 31, 2018
(Millions of yen) FY2017
Revenue 91,000
Operating profit (loss) 4,400
Profit (loss) before tax 4,200
Profit (loss) 3,000
Profit (loss) attributable to owners of parent 3,000
Assumed annual exchange rate : 1US$=110Yen
ANRITSU CORPORATION(6754) Financial Summary of FY2016
9

(Reference) FORECAST OF SEGMENT INFORMATION
(Millions of yen)
FY2015 From Apr. 1, 2015
To Mar. 31, 2016
FY2016 From Apr. 1, 2016
To Mar. 31, 2017
FY2017(Forecast) From Apr. 1, 2017
To Mar. 31, 2018
Change Change
Revenue by Segment
Revenue 95,532 87,638 -8.3% 91,000 3.8%
Test and Measurement 67,729 59,333 -12.4% 61,000 2.8%
PQA 18,891 19,588 3.7% 21,500 9.8%
Others 8,910 8,716 -2.2% 8,500 -2.5%
Operating Profit by Segment
Operating Profit 5,897 4,234 -28.2% 4,400 3.9%
Test and Measurement 4,706 2,130 -54.7% 2,200 3.3%
PQA 1,194 1,302 9.0% 1,500 15.2%
Others -3 801 - 700 -12.6%
Revenue by Markets
Revenue 95,532 87,638 -8.3% 91,000 3.8%
Japan 95,532 87,638 -8.3% 30,000 2.3%
Overseas 28,565 29,338 2.7% 61,000 4.6%
Americas 66,966 58,299 -12.9% 21,500 9.5%
EMEA 23,246 19,633 -15.5% 11,500 -8.1%
Asia and Others 13,537 12,520 -7.5% 28,000 7.1%
(Notes) PQA: Products Quality Assurance EMEA: Europe, Middle East and Africa
(Note) Statements made in these materials with respect to Anritsu’s current plans, strategies and beliefs that are not historical
fact are forward-looking statements of future business results or other forward-looking projections pertinent to the business of Anritsu. These descriptions are based on assumptions and judgments made by Anritsu’s management from information currently available, and include certain risks and uncertain factors. Actual business results are the outcome of a number of unknown variables, and may substantially differ from the figures projected herein. Furthermore, Anritsu disclaims any obligation, unless required by law, to update or revise any forward-looking statements as a result of new information, future events or otherwise.
Factors which may affect the actual business results include but are not limited to the economic situation in the geographic areas where Anritsu conducts business, including but not limited to Japan, Americas, Europe, and Asia, pressure on prices due to trends in demand for Anritsu’s products and services or to increased competition, Anritsu’s ability to continue supplying products and services that are accepted by customers in a highly competitive market environment, and currency exchange rates.
ANRITSU CORPORATION(6754) Financial Summary of FY2016
10
(4) Profit Distribution Policy and Dividends for the Years Ended/Ending March 31, 2017 and March 31, 2018
The Company’s basic policy for returning profits to its shareholders is to distribute profits in accordance with its consolidated performance and by taking into account the total return ratio.
With regard to dividends, while taking the basic approach of raising dividends on equity (DOE) in accordance with the increase in consolidated profits for the fiscal year, the Company aims at a consolidated dividend payout ratio of 30 percent or more. The Company’s basic policy is to make distributions of dividends, twice a year, consisting of a fiscal year-end dividend and an interim dividend by resolution of the General Meeting of Shareholders and by approval of the Board of Directors.
The Company intends to carry out the purchase of treasury stock appropriately as necessary, by taking into account its financial situation, the trends in stock prices and other factors, in an effort to execute capital policies that respond flexibly to changes in the corporate environment.
The Company’s basic policy is to apply retained earnings to research and development and capital investment in order to respond to rapid technological advances and changes in the market structure.
Anritsu plans to pay a year-end dividend of 7.5 yen per share as initially scheduled, and total dividends for the fiscal year will be 15.0 yen per share for the fiscal year ended March 31, 2017.
For the fiscal year ending March 31, 2018, Anritsu plans to pay cash dividends of 15.0 yen per share (including an interim dividend of 7.5 yen per share), assuming achievement of the business forecast on page 9.
(5) Risk Information1) Inherent Risks in the Anritsu Group's Technology and Marketing Strategies
The Anritsu Group works to deploy its well-developed technological capabilities to promptly provide cutting-edge products and services that offer value to customers. However, the rapid pace of technological innovation in the Anritsu Group’s core information and communication markets and the Anritsu Group’s ability to deliver products and services in a timely manner to meet the needs and wants of customers are factors that have the potential to exert a material impact on the Anritsu Group’s financial condition and operating results.
2) Market Fluctuation Risk External factors including changes in the economy or market conditions and technological innovation
affect the profitability of product lines the Group develops and have the potential to exert a significant material impact on the Anritsu Group’s financial condition and operating results.
Because a high percentage of Test and Measurement segment revenue is in the telecommunications market, capital investment trends among telecom operators, telecommunications equipment manufacturers and electronic component manufacturers have the potential to exert a material effect on business results. Telecom operators are progressively adopting technologies to handle rapid increases in data traffic even as they curtail capital investment. However, they are also increasingly adopting shared open network use in order to increase service development efficiency. Moreover, business results for the mobile communications measuring instrument field, the cornerstone of earnings for the Anritsu Group, are affected by changes in technological innovation in mobile phone services, the number of subscribers and the replacement ratio for mobile phones. Business results are also affected by factors such as changes in development methods as seen in the shift to mobile phone software platforms and response to intensifying price competition in measuring instruments used in handset production.
ANRITSU CORPORATION(6754) Financial Summary of FY2016
11

In the Products Quality Assurance business, sales to food manufacturers constitute more than 80 percent of revenue. Economic growth rates, consumer spending and raw material price trends have the potential to impact performance, capital investment and other issues among food manufacturers and materially influence its performance.
3) Global Business Development Risk The Anritsu Group markets its products globally, and conducts business in the Americas, Europe, Asia
and elsewhere. In particular, the overseas sales ratio including both the Test and Measurement business and the Products Quality Assurance business is 67 percent, and many customers likewise operate on a global scale. As a result, economic trends in countries worldwide, changes in international conditions, compliance with required laws and regulations and progress in the Anritsu Group’s global strategy have a potential to exert a material impact on the Group’s financial position and results of operations. In addition, global-scale mergers, acquisitions and realignment in the telecommunications industry are changing the competitive landscape. Significant changes in capital investment trends that result have the potential to exert a material impact on the Anritsu Group’s financial condition and operating results.
4) Foreign Exchange Risk The Anritsu Group’s sales outside Japan account for 67 percent of consolidated revenue. The Anritsu
Group hedges foreign exchange risk using instruments including forward foreign exchange contracts for foreign exchange transactions that occur upon collection of accounts receivable and other events. However, rapid changes in foreign exchange rates have the potential to exert a material impact on the Anritsu Group’s financial condition and operating results.
5) Long-term Inventory Obsolescence Risk The Anritsu Group works to provide products and services that precisely meet customer needs and
wants. However, particularly in the test and measuring instruments market, product lines are subject to rapid change in technology, which can easily result in obsolescence of products and parts, and cause inventory held for long periods to lose its value. These factors have the potential to exert a material impact on the Anritsu Group's financial condition and operating results.
6) Risk Related to Deferred Tax Assets The Anritsu Group applies deferred tax accounting and recognizes deferred tax assets. Calculation of
deferred tax assets is based on projections that include estimates of future taxable profit, and the actual benefit may differ from the projection. If the tax benefits based on the estimate of future taxable profit are judged to be unavailable, these deferred tax assets are written down, which has the potential to exert a material impact on the Anritsu Group’s financial condition and operating results.
7) Risk related to Defined-Benefit Pension Plan The amounts of retirement benefit payments and obligations incurred in connection with employee
defined-benefit pension plans of the parent company and certain of its subsidiaries are calculated based on assumptions, including discount rates, made for actuarial calculations. If the discount rates and other assumptions, which were made for the actuarial calculations of the expected amount of obligations under these defined-benefit pension plans undergo change, this has the potential to exert a material impact on the Anritsu Group’s financial condition and operating results.
ANRITSU CORPORATION(6754) Financial Summary of FY2016
12
8) Impact of Revisions, Etc., in Accounting Standards The Anritsu Group voluntarily adopted its financial statements in conformity with IFRS. However, if, in
the future, new accounting principles, tax laws, etc., are applied and/or changes are made in such regulations, this has the potential to exert a material impact on the Anritsu Group’s financial condition and operating results.
9) Risk of Natural Disasters and Other Unexpected Events The Anritsu Group operates production and sales activities globally. Consequently, the occurrence of
major earthquakes or other natural disaster, fire, war, acts of terrorism or violence could exert a material impact on the Anritsu group’s financial condition and operating results by disrupting the business activities of the Anritsu Group or its suppliers and customers due to damage to key facilities, or by causing political or economic instability.
2. Management Policies(1) Basic Policy
The Company Philosophy of Anritsu Corporation is to contribute to creating an affluent safe and secure global society by providing “Original & High Level” products and services with sincerity, harmony and enthusiasm. Based on the Company Vision “Achieve continuous growth with sustainable superior profits through innovation using all knowledge of all parties”, the Anritsu’s Company Policy is 1) to make energetic organization synthesizing the knowledge of all employees, 2) to capture growth drivers through innovation, 3) to be a leader in the global market and 4) to contribute to the creation of a society that is friendly to people and the Earth as a good corporate citizen.
The Anritsu Group has built a solid base of customer trust with its portfolio of communications, test and measurement and inspection technologies that it has built up for 120 years since its founding. These core technologies support the Group’s current businesses, including Test and Measurement, Products Quality Assurance, and other businesses, and are a source of its corporate value. Strong relationships with suppliers and good labor-management relationships based on trust are also key management resources and further sources of corporate value.
The Anritsu Group conveys its brand statement, “envision: ensure,” for an “advanced and trustworthy corporate brand,” which can be said to be testimony of the company’s 120 years, as we work on a strategy to make our brand more global. Embedded in the statement “envision:ensure.” is the intention, “We will share dreams with customers, create a vision together, and develop this vision into tangible solutions that exceed our customers’ expectations through innovation.” The Anritsu Group will continue working to raise corporate value by making the most of these management resources while contributing to the realization of an affluent, safe and secure global society.
ANRITSU CORPORATION(6754) Financial Summary of FY2016
13

(2) Management TargetsAnritsu aims to maximize corporate value by managing its operations with a focus on cash flow. In
addition, to evaluate the added value generated by capital invested, Anritsu uses an original metric, ACE (Anritsu Capital-cost Evaluation), for evaluating the results of each business. A target for ROE is also set as an indicator of the efficiency of capital invested.
To attain its management vision of “continuous growth with sustainable superior profits,” the Anritsu Group had prepared its ANRITSU 2020 VISION, which has a time horizon of 10 years, and established a medium-term milestone plan entitled the Mid-term Business Plan GLP2017 (a three-year plan that ends in FY2017), which is based on the ANRITSU 2020 VISION. However, with structural changes in the smartphone market as a backdrop, the operating environment has changed substantially over the last few years, and GLP2017 is not expected to be achieved.
As countermeasures for the FY2016 and FY2017 market transition periods, the Group as a whole will work on measures to reform the management structure (business selection and concentration, strengthening of the profit structure, and business process reform).
In the current fiscal year, towards the formulation of GLP2020, which is a three-year plan starting in FY2018, the Group will capture growth drivers to restore growth potential and strive to consolidate our foundation for building a robust profit structure.
ACE : Net operating profit after tax – Cost of capital
(3) Medium- and Long-Term Management Strategy and Issues to be Dealt withThe core Test and Measurement business of the Anritsu Group involve information and
communication technology (ICT) services. In the ICT field, global mobile broadband services and the creation of new social value by IoT are driving growth and innovation of communication system which aims to enhance user experience in the medium- to long-term will be platform for the growth driver. In order to enable this innovation, continuous development of mobile telecommunication technology from LTE and LTE-Advanced which support broadband, and beyond to 5G will be promoted, as well as the network reshaping through measures, as represented by increased density of the base station network, which is indispensable for enhancing connectivity. In addition, the standardization and commercialization of the 5G mobile system, the next-generation communications system which is expected to provide the infrastructure to a wide range of mobile broadband services, is beginning to materialize ahead of expectation. From basic social infrastructure to the creation of new value through IoT, safe and secure networks that are easy to connect to anytime and anywhere are vital to a sustainable society. As an advanced measurement company covering both wireline and wireless telecommunication areas, Anritsu provides network solutions for its customers and for society.
The growth driver for the Products Quality Assurance business is “increasing safety, security, and health.” As a long-term goal, with the food product and pharmaceutical-related markets as our focus, the Anritsu Group will aim to expand its business by raising the overseas revenue ratio to 50 percent. The Anritsu Group will work to enhance overseas resources to accelerate business development mainly in North American and Asian markets.
Steady implementation of these strategies requires appropriately managing and reducing risks and transforming them from impediments into a source of competitive advantage. For this reason, Anritsu will improve the risk management system through further strengthening of established ties among the Group companies in Japan and overseas via upgrades to the internal control system. Anritsu also aims to realize better corporate governance within the Group by establishing the “Anritsu Corporation Basic Policy on Corporate Governance.” Anritsu has transmitted to a “Company with an Audit Committee,”
ANRITSU CORPORATION(6754) Financial Summary of FY2016
14
established a nomination committee, a compensation committee, and an independent committee chaired by independent outside directors, and carries out performance assessments for the Board of Directors, starting from this fiscal year, in order to reinforce the audit and supervisory functions of the Board. The Anritsu Group will continue working to conduct business management with greater transparency from a global perspective.
The Anritsu Group believes that contribution to solving social issues through honest business practices enhance corporate value, and will continue to actively conduct corporate social responsibility (CSR) activities. Anritsu considers contributing to the realization of a safe, secure, and comfortable society through its products and services to be its primary CSR activity, and will fulfill its role required as an entity in all areas including compliance, customer satisfaction, supply chain management, environmental protection, respect of diversity (great success of female and foreign-registered employees), human rights and occupational health and safety.
Through the activities mentioned above, Anritsu will seek to achieve the goals “to be a global market leader” and “to create new businesses by emerging business” set out in “2020 VISION,” which expresses what Anritsu hopes to achieve by 2020, as well as continue to enhance corporate value.
3. Basic Policy regarding Adoption of Accounting StandardsThe Anritsu Group is involved in global business development, as approximately 70 percent of its
consolidated revenues are generated outside of Japan and it has research and development bases in Japan, the U.S. and Europe. In light of these circumstances, the Anritsu Group has voluntarily applied the International Financial Reporting Standards (IFRS) from the fiscal year ended March 31, 2013. in an effort to reinforce its management base through improvement of its internal decision-making process, while at the same time diversifying its means of financing by enhancing the comparability of its financial information on a global basis.
ANRITSU CORPORATION(6754) Financial Summary of FY2016
15

4. Consolidated Financial Statements(1) Consolidated Statement of Financial Position
(Millions of yen)
End of FY2015 as of 3.31.16
(A)
End of FY2016 as of 3.31.17
(B)
Change (B) - (A)
Assets
Current assets
Cash and cash equivalents 37,391 39,682 2,290
Trade and other receivables 19,738 21,561 1,822
Other financial assets 1,163 1,152 (11)
Inventories 18,376 16,606 (1,770)
Income tax receivables 171 459 288
Other assets 3,699 2,960 (738)
Total current assets 80,541 82,421 1,879
Non-current assets
Property, plant and equipment 27,738 26,441 (1,296)
Goodwill and intangible assets 3,209 3,721 512
Investment property 1,830 1,664 (166)
Trade and other receivables 339 330 (9)
Other financial assets 2,395 2,481 86
Deferred tax assets 8,545 7,979 (566)
Other assets 24 14 (9)
Total non-current assets 44,082 42,632 (1,450)
Total assets 124,624 125,054 429
ANRITSU CORPORATION(6754) Financial Summary of FY2016
16
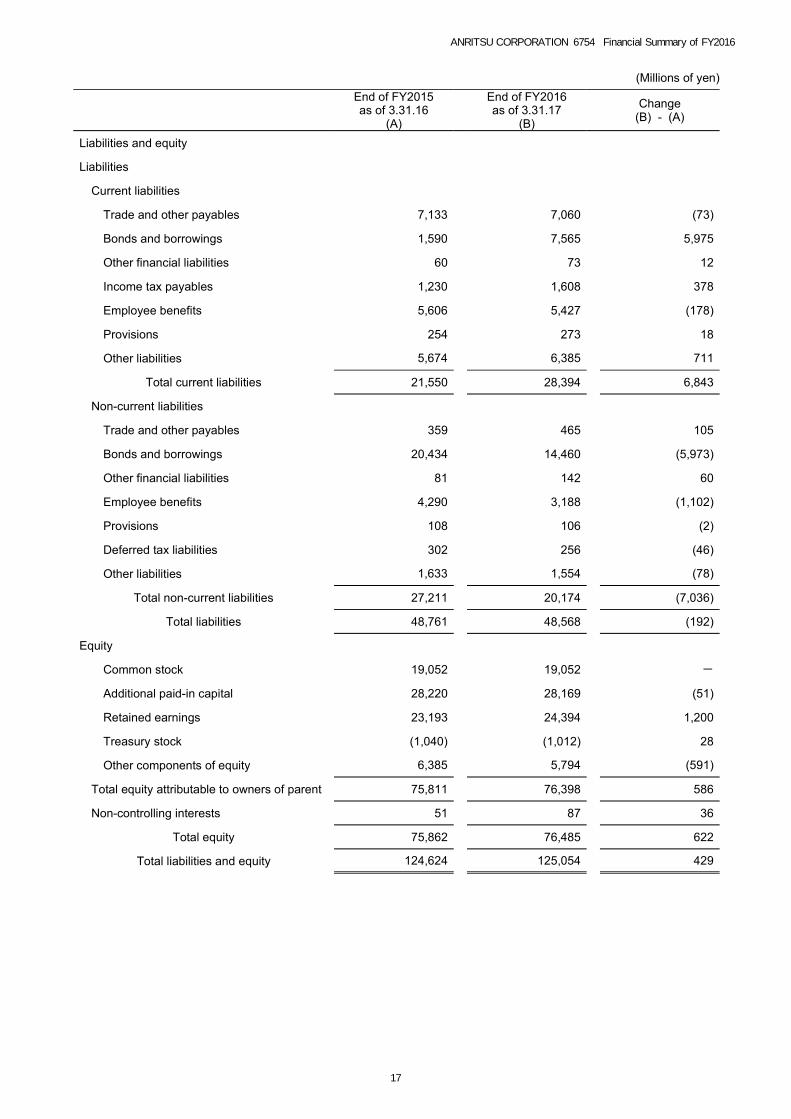
(Millions of yen)
End of FY2015 as of 3.31.16
(A)
End of FY2016 as of 3.31.17
(B)
Change (B) - (A)
Liabilities and equity
Liabilities
Current liabilities
Trade and other payables 7,133 7,060 (73)
Bonds and borrowings 1,590 7,565 5,975
Other financial liabilities 60 73 12
Income tax payables 1,230 1,608 378
Employee benefits 5,606 5,427 (178)
Provisions 254 273 18
Other liabilities 5,674 6,385 711
Total current liabilities 21,550 28,394 6,843
Non-current liabilities
Trade and other payables 359 465 105
Bonds and borrowings 20,434 14,460 (5,973)
Other financial liabilities 81 142 60
Employee benefits 4,290 3,188 (1,102)
Provisions 108 106 (2)
Deferred tax liabilities 302 256 (46)
Other liabilities 1,633 1,554 (78)
Total non-current liabilities 27,211 20,174 (7,036)
Total liabilities 48,761 48,568 (192)
Equity
Common stock 19,052 19,052 -
Additional paid-in capital 28,220 28,169 (51)
Retained earnings 23,193 24,394 1,200
Treasury stock (1,040) (1,012) 28
Other components of equity 6,385 5,794 (591)
Total equity attributable to owners of parent 75,811 76,398 586
Non-controlling interests 51 87 36
Total equity 75,862 76,485 622
Total liabilities and equity 124,624 125,054 429
ANRITSU CORPORATION(6754) Financial Summary of FY2016
17
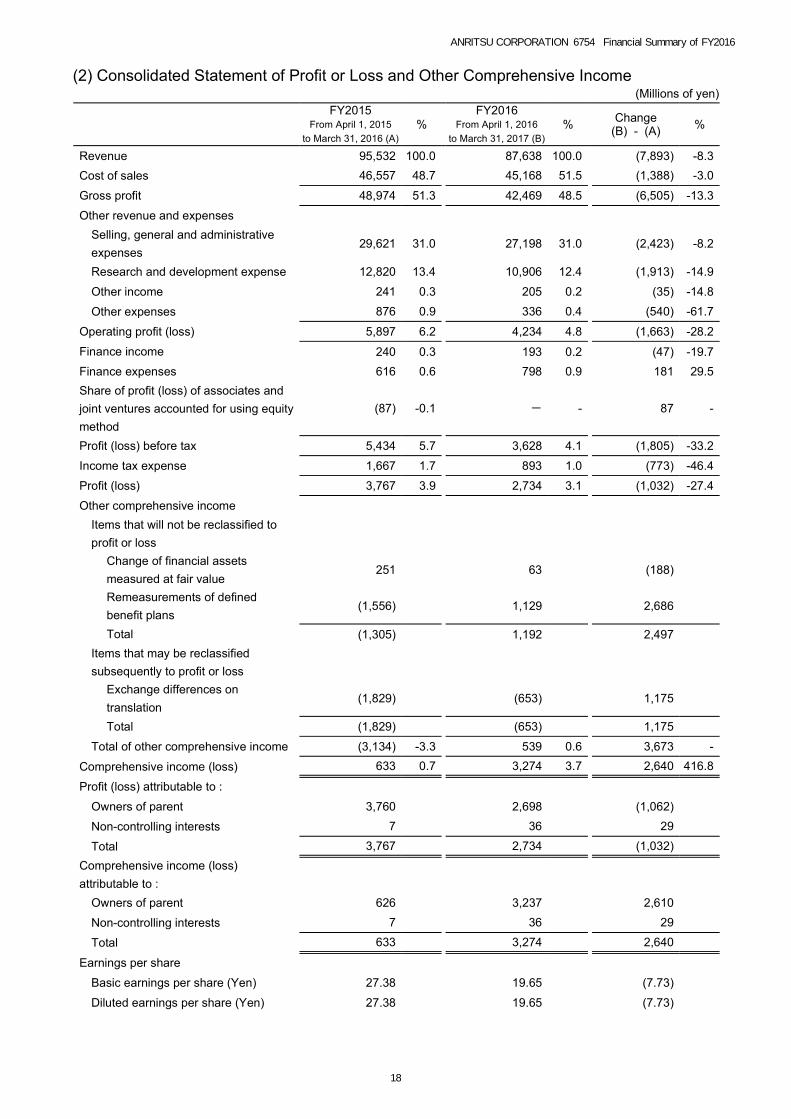
(2) Consolidated Statement of Profit or Loss and Other Comprehensive Income(Millions of yen)
FY2015
From April 1, 2015 to March 31, 2016 (A)
% FY2016
From April 1, 2016 to March 31, 2017 (B)
% Change
(B) - (A) %
Revenue 95,532 100.0 87,638 100.0 (7,893) -8.3 Cost of sales 46,557 48.7 45,168 51.5 (1,388) -3.0
Gross profit 48,974 51.3 42,469 48.5 (6,505) -13.3
Other revenue and expenses
Selling, general and administrative expenses
29,621 31.0 27,198 31.0 (2,423) -8.2
Research and development expense 12,820 13.4 10,906 12.4 (1,913) -14.9
Other income 241 0.3 205 0.2 (35) -14.8
Other expenses 876 0.9 336 0.4 (540) -61.7
Operating profit (loss) 5,897 6.2 4,234 4.8 (1,663) -28.2
Finance income 240 0.3 193 0.2 (47) -19.7 Finance expenses 616 0.6 798 0.9 181 29.5 Share of profit (loss) of associates and joint ventures accounted for using equity method
(87) -0.1 - - 87 -
Profit (loss) before tax 5,434 5.7 3,628 4.1 (1,805) -33.2
Income tax expense 1,667 1.7 893 1.0 (773) -46.4
Profit (loss) 3,767 3.9 2,734 3.1 (1,032) -27.4
Other comprehensive income
Items that will not be reclassified to profit or loss
Change of financial assets measured at fair value
251 63 (188)
Remeasurements of defined benefit plans
(1,556) 1,129 2,686
Total (1,305) 1,192 2,497
Items that may be reclassified subsequently to profit or loss
Exchange differences on translation
(1,829) (653) 1,175
Total (1,829) (653) 1,175
Total of other comprehensive income (3,134) -3.3 539 0.6 3,673 -
Comprehensive income (loss) 633 0.7 3,274 3.7 2,640 416.8
Profit (loss) attributable to :
Owners of parent 3,760 2,698 (1,062)
Non-controlling interests 7 36 29
Total 3,767 2,734 (1,032)
Comprehensive income (loss) attributable to :
Owners of parent 626 3,237 2,610
Non-controlling interests 7 36 29
Total 633 3,274 2,640
Earnings per share
Basic earnings per share (Yen) 27.38 19.65 (7.73)
Diluted earnings per share (Yen) 27.38 19.65 (7.73)
ANRITSU CORPORATION(6754) Financial Summary of FY2016
18
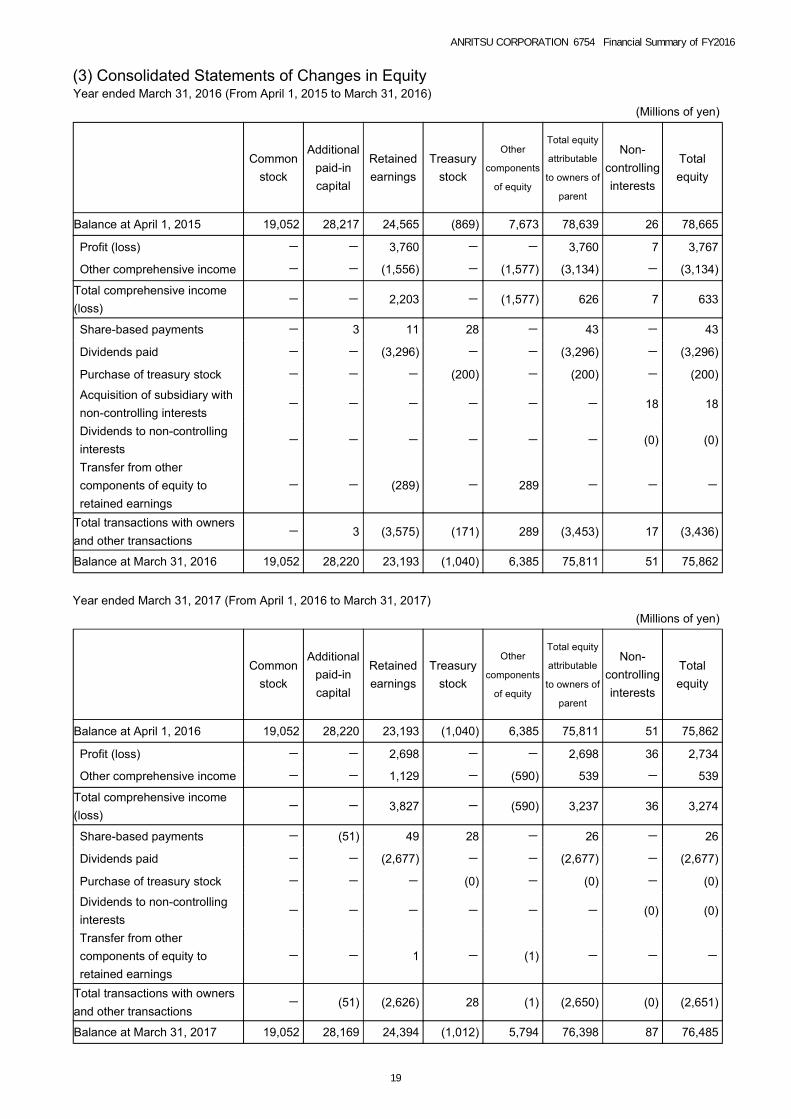
(3) Consolidated Statements of Changes in EquityYear ended March 31, 2016 (From April 1, 2015 to March 31, 2016)
(Millions of yen)
Common
stock
Additional paid-in capital
Retained earnings
Treasury stock
Other
components
of equity
Total equity
attributable
to owners of
parent
Non- controlling interests
Total equity
Balance at April 1, 2015 19,052 28,217 24,565 (869) 7,673 78,639 26 78,665
Profit (loss) - - 3,760 - - 3,760 7 3,767
Other comprehensive income - - (1,556) - (1,577) (3,134) - (3,134)
Total comprehensive income (loss)
- - 2,203 - (1,577) 626 7 633
Share-based payments - 3 11 28 - 43 - 43
Dividends paid - - (3,296) - - (3,296) - (3,296)
Purchase of treasury stock - - - (200) - (200) - (200)
Acquisition of subsidiary with non-controlling interests
- - - - - - 18 18
Dividends to non-controlling interests
- - - - - - (0) (0)
Transfer from other components of equity to retained earnings
- - (289) - 289 - - -
Total transactions with owners and other transactions
- 3 (3,575) (171) 289 (3,453) 17 (3,436)
Balance at March 31, 2016 19,052 28,220 23,193 (1,040) 6,385 75,811 51 75,862
Year ended March 31, 2017 (From April 1, 2016 to March 31, 2017) (Millions of yen)
Common
stock
Additional paid-in capital
Retained earnings
Treasury stock
Other
components
of equity
Total equity
attributable
to owners of
parent
Non- controlling interests
Total equity
Balance at April 1, 2016 19,052 28,220 23,193 (1,040) 6,385 75,811 51 75,862
Profit (loss) - - 2,698 - - 2,698 36 2,734
Other comprehensive income - - 1,129 - (590) 539 - 539
Total comprehensive income (loss)
- - 3,827 - (590) 3,237 36 3,274
Share-based payments - (51) 49 28 - 26 - 26
Dividends paid - - (2,677) - - (2,677) - (2,677)
Purchase of treasury stock - - - (0) - (0) - (0)
Dividends to non-controlling interests
- - - - - - (0) (0)
Transfer from other components of equity to retained earnings
- - 1 - (1) - - -
Total transactions with owners and other transactions
- (51) (2,626) 28 (1) (2,650) (0) (2,651)
Balance at March 31, 2017 19,052 28,169 24,394 (1,012) 5,794 76,398 87 76,485
ANRITSU CORPORATION(6754) Financial Summary of FY2016
19
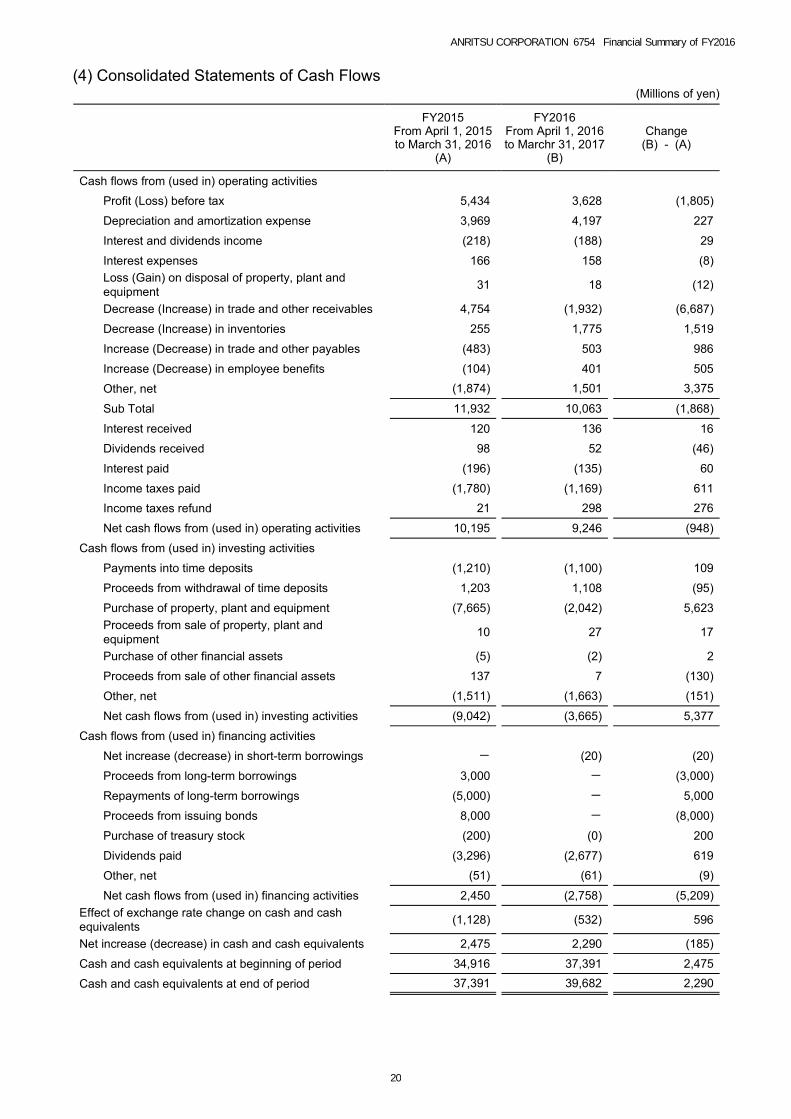
(4) Consolidated Statements of Cash Flows(Millions of yen)
FY2015 From April 1, 2015 to March 31, 2016
(A)
FY2016 From April 1, 2016 to Marchr 31, 2017
(B)
Change
(B) - (A)
Cash flows from (used in) operating activities
Profit (Loss) before tax 5,434 3,628 (1,805)
Depreciation and amortization expense 3,969 4,197 227
Interest and dividends income (218) (188) 29
Interest expenses 166 158 (8) Loss (Gain) on disposal of property, plant and equipment 31 18 (12)
Decrease (Increase) in trade and other receivables 4,754 (1,932) (6,687)
Decrease (Increase) in inventories 255 1,775 1,519
Increase (Decrease) in trade and other payables (483) 503 986
Increase (Decrease) in employee benefits (104) 401 505
Other, net (1,874) 1,501 3,375
Sub Total 11,932 10,063 (1,868)
Interest received 120 136 16 Dividends received 98 52 (46)
Interest paid (196) (135) 60
Income taxes paid (1,780) (1,169) 611 Income taxes refund 21 298 276
Net cash flows from (used in) operating activities 10,195 9,246 (948)
Cash flows from (used in) investing activities
Payments into time deposits (1,210) (1,100) 109
Proceeds from withdrawal of time deposits 1,203 1,108 (95)
Purchase of property, plant and equipment (7,665) (2,042) 5,623 Proceeds from sale of property, plant and equipment 10 27 17
Purchase of other financial assets (5) (2) 2
Proceeds from sale of other financial assets 137 7 (130)
Other, net (1,511) (1,663) (151)
Net cash flows from (used in) investing activities (9,042) (3,665) 5,377
Cash flows from (used in) financing activities
Net increase (decrease) in short-term borrowings - (20) (20)
Proceeds from long-term borrowings 3,000 - (3,000)
Repayments of long-term borrowings (5,000) - 5,000
Proceeds from issuing bonds 8,000 - (8,000)
Purchase of treasury stock (200) (0) 200
Dividends paid (3,296) (2,677) 619
Other, net (51) (61) (9)
Net cash flows from (used in) financing activities 2,450 (2,758) (5,209) Effect of exchange rate change on cash and cash equivalents (1,128) (532) 596
Net increase (decrease) in cash and cash equivalents 2,475 2,290 (185)
Cash and cash equivalents at beginning of period 34,916 37,391 2,475
Cash and cash equivalents at end of period 37,391 39,682 2,290
ANRITSU CORPORATION(6754) Financial Summary of FY2016
20
(5) Notes to the Consolidated Financial Statements(Notes regarding Going Concern) None
(Segment Information) 1. Outline of reportable segment The reportable segments of the Anritsu group are business segments which are classified based on products and
services. Each business segment operates its business activities with a comprehensive strategic business plans for domestic and
overseas. The board of directors meeting periodically makes decision of allocation of operating resources and evaluates business
performance based on segment financial information. The Anritsu group's reportable segments are composed of "Test and Measurement" and "PQA (Products Quality
Assurance)". Main Products and services by segment are as follows;
Test and Measurement Measuring instruments for Digital communications and IP network, Optical communications equipment, Mobile communications equipment, RF / microwave and millimeter wave communications equipment / systems, Service assurance
PQA Checkweighers, Automatic combination weighers, Inspection equipment, Comprehensive production management system
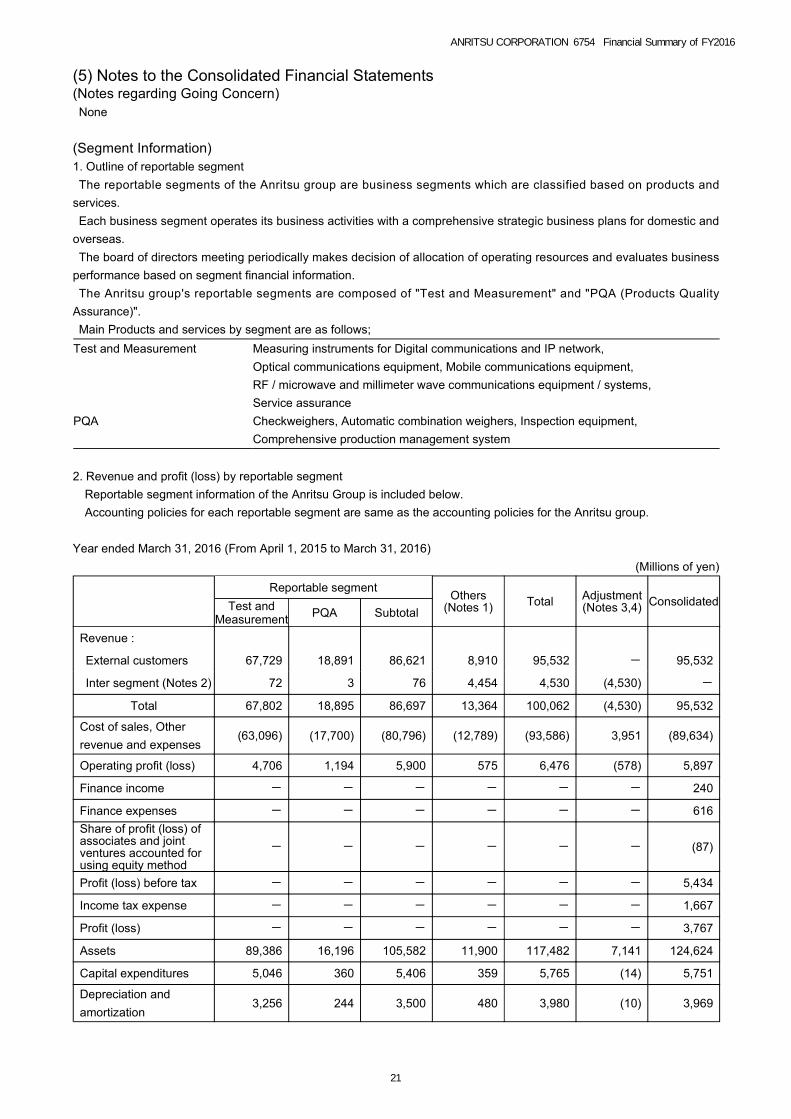
2. Revenue and profit (loss) by reportable segment Reportable segment information of the Anritsu Group is included below. Accounting policies for each reportable segment are same as the accounting policies for the Anritsu group.
Year ended March 31, 2016 (From April 1, 2015 to March 31, 2016) (Millions of yen)
Reportable segment Others
(Notes 1) Total Adjustment (Notes 3,4) Consolidated Test and
Measurement PQA Subtotal
Revenue :
External customers 67,729 18,891 86,621 8,910 95,532 - 95,532
Inter segment (Notes 2) 72 3 76 4,454 4,530 (4,530) -
Total 67,802 18,895 86,697 13,364 100,062 (4,530) 95,532
Cost of sales, Other revenue and expenses
(63,096) (17,700) (80,796) (12,789) (93,586) 3,951 (89,634)
Operating profit (loss) 4,706 1,194 5,900 575 6,476 (578) 5,897
Finance income - - - - - - 240
Finance expenses - - - - - - 616 Share of profit (loss) of associates and joint ventures accounted for using equity method
- - - - - - (87)
Profit (loss) before tax - - - - - - 5,434
Income tax expense - - - - - - 1,667
Profit (loss) - - - - - - 3,767
Assets 89,386 16,196 105,582 11,900 117,482 7,141 124,624
Capital expenditures 5,046 360 5,406 359 5,765 (14) 5,751
Depreciation and amortization
3,256 244 3,500 480 3,980 (10) 3,969
ANRITSU CORPORATION(6754) Financial Summary of FY2016
21
(Notes 1) : Others ……Information and Communications, Devices, Logistics, Welfare related service, Lease on real estate, Corporate administration, Parts manufacturing and others
(Notes 2) : Inter segment revenue is measured based on market price. (Notes 3) : Adjustment of operating profit (-578 million yen) includes elimination of inter-segment transactions (-8 million
yen) and company-wide expenses not allocated to business segments (-570 million yen). Company-wide expenses are mainly composed of basic research expense as well as selling, general and administrative expenses not attributable to business segments.
(Notes 4) : Adjustment of segment assets (7,141 million yen) includes excess investment capital not attributable to business segments (cash and cash equivalents), long-term investment capital (other financial assets (non-current assets)), and assets related to basic research.
Year ended March 31, 2017 (From April 1, 2016 to March 31, 2017) (Millions of yen)
Reportable segment
Others (Notes 1) Total Adjustment
(Notes 3,4) Consolidated Test and Measurement PQA Subtotal
Revenue :
External customers 59,333 19,588 78,921 8,716 87,638 - 87,638
Inter segment (Notes 2) 58 3 61 4,295 4,356 (4,356) -
Total 59,391 19,591 78,982 13,012 91,995 (4,356) 87,638
Cost of sales, Other revenue and expenses
(57,261) (18,288) (75,550) (12,020) (87,570) 4,165 (83,404)
Operating profit (loss) 2,130 1,302 3,432 992 4,425 (190) 4,234
Finance income - - - - - - 193
Finance expenses - - - - - - 798
Profit (loss) before tax - - - - - - 3,628
Income tax expense - - - - - - 893
Profit (loss) - - - - - - 2,734
Assets 89,651 16,822 106,473 11,674 118,147 6,906 125,054
Capital expenditures 2,207 273 2,481 416 2,897 (3) 2,894
Depreciation and amortization
3,445 235 3,681 527 4,209 (11) 4,197
(Notes 1) : Others ……Information and Communications, Devices, Logistics, Welfare related service, Lease on real estate, Corporate administration, Parts manufacturing and others
(Notes 2) : Inter segment revenue is measured based on market price. (Notes 3) : Adjustment of operating profit (-190 million yen) includes elimination of inter-segment transactions (11 million
yen) and company-wide expenses not allocated to business segments (-202 million yen). Company-wide expenses are mainly composed of basic research expense as well as selling, general and administrative expenses not attributable to business segments.
(Notes 4) : Adjustment of segment assets (6,906 million yen) includes excess investment capital not attributable to business segments (cash and cash equivalents), long-term investment capital (other financial assets (non-current assets)), and assets related to basic research.
ANRITSU CORPORATION(6754) Financial Summary of FY2016
22
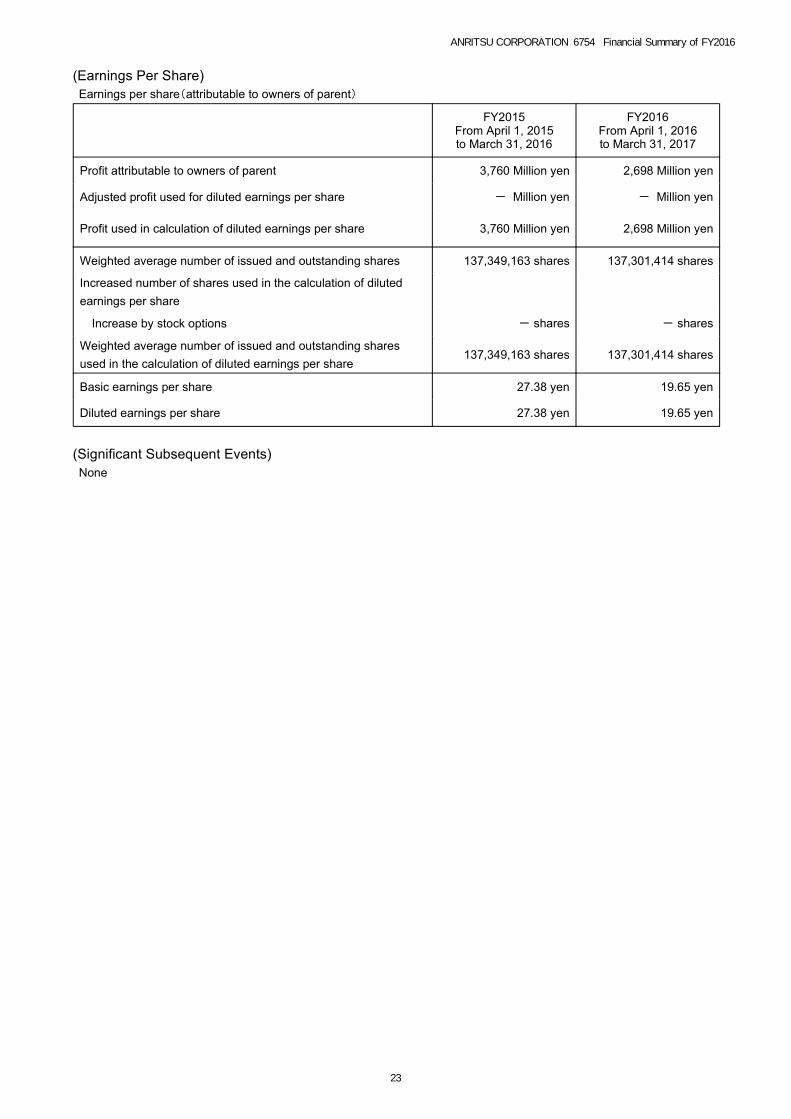
(Earnings Per Share) Earnings per share(attributable to owners of parent)
FY2015
From April 1, 2015 to March 31, 2016
FY2016 From April 1, 2016 to March 31, 2017
Profit attributable to owners of parent 3,760 Million yen 2,698 Million yen
Adjusted profit used for diluted earnings per share - Million yen - Million yen
Profit used in calculation of diluted earnings per share 3,760 Million yen 2,698 Million yen
Weighted average number of issued and outstanding shares 137,349,163 shares 137,301,414 shares
Increased number of shares used in the calculation of diluted earnings per share
Increase by stock options - shares - shares
Weighted average number of issued and outstanding shares used in the calculation of diluted earnings per share
137,349,163 shares 137,301,414 shares
Basic earnings per share 27.38 yen 19.65 yen
Diluted earnings per share 27.38 yen 19.65 yen
(Significant Subsequent Events) None
ANRITSU CORPORATION(6754) Financial Summary of FY2016
23
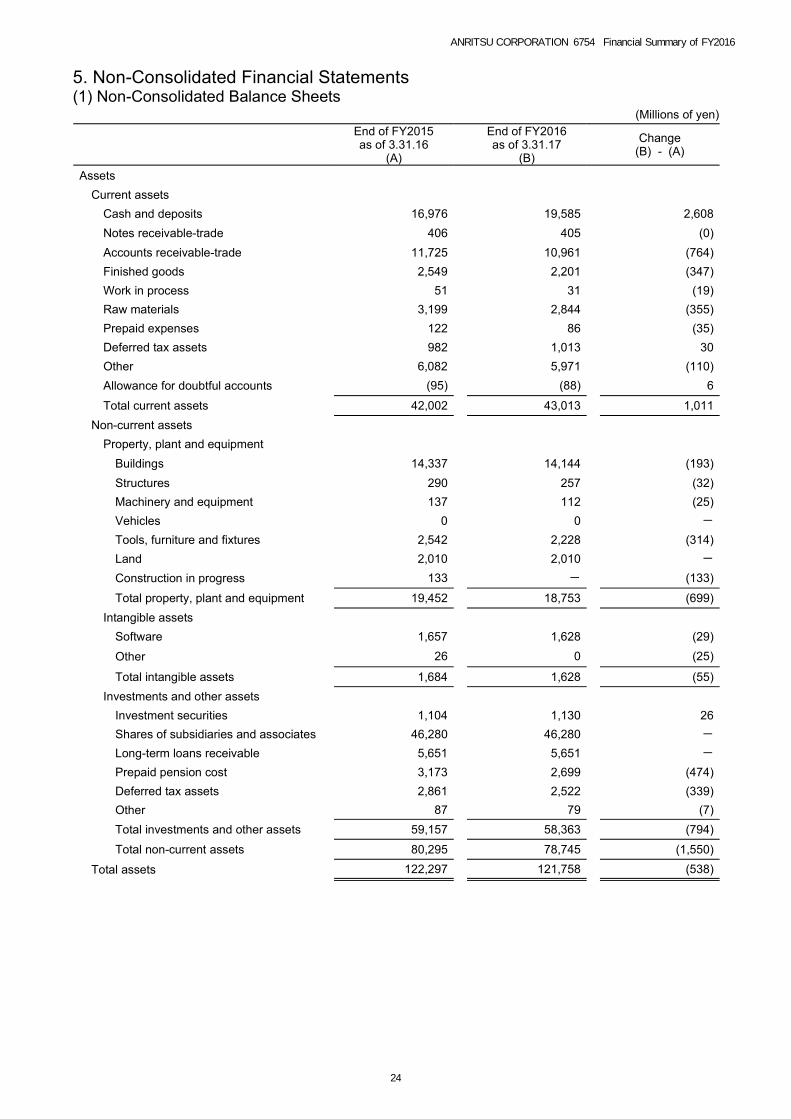
5. Non-Consolidated Financial Statements(1) Non-Consolidated Balance Sheets
(Millions of yen)
End of FY2015 as of 3.31.16
(A)
End of FY2016 as of 3.31.17
(B)
Change (B) - (A)
Assets
Current assets
Cash and deposits 16,976 19,585 2,608 Notes receivable-trade 406 405 (0) Accounts receivable-trade 11,725 10,961 (764) Finished goods 2,549 2,201 (347) Work in process 51 31 (19) Raw materials 3,199 2,844 (355) Prepaid expenses 122 86 (35) Deferred tax assets 982 1,013 30 Other 6,082 5,971 (110) Allowance for doubtful accounts (95) (88) 6
Total current assets 42,002 43,013 1,011 Non-current assets
Property, plant and equipment
Buildings 14,337 14,144 (193) Structures 290 257 (32) Machinery and equipment 137 112 (25) Vehicles 0 0 -
Tools, furniture and fixtures 2,542 2,228 (314) Land 2,010 2,010 -
Construction in progress 133 - (133)
Total property, plant and equipment 19,452 18,753 (699) Intangible assets
Software 1,657 1,628 (29)
Other 26 0 (25)
Total intangible assets 1,684 1,628 (55) Investments and other assets
Investment securities 1,104 1,130 26 Shares of subsidiaries and associates 46,280 46,280 -
Long-term loans receivable 5,651 5,651 -
Prepaid pension cost 3,173 2,699 (474) Deferred tax assets 2,861 2,522 (339) Other 87 79 (7) Total investments and other assets 59,157 58,363 (794)
Total non-current assets 80,295 78,745 (1,550)
Total assets 122,297 121,758 (538)
ANRITSU CORPORATION(6754) Financial Summary of FY2016
24
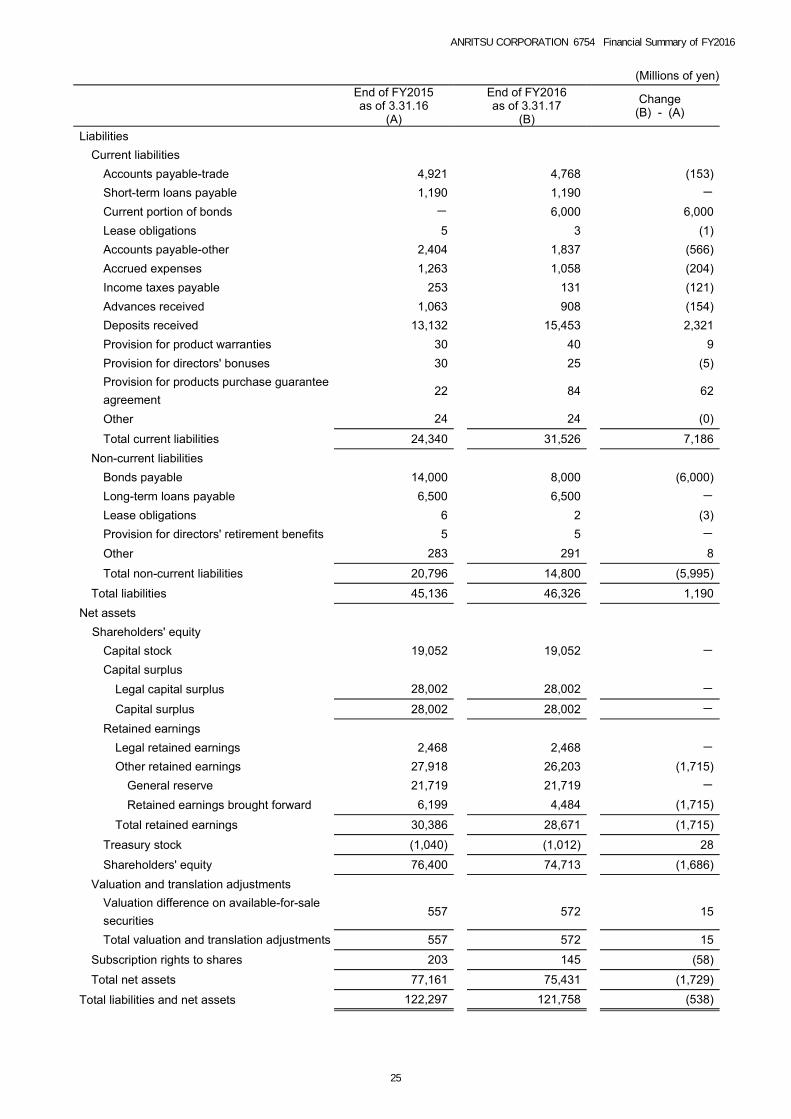
(Millions of yen)
End of FY2015 as of 3.31.16
(A)
End of FY2016 as of 3.31.17
(B)
Change (B) - (A)
Liabilities
Current liabilities
Accounts payable-trade 4,921 4,768 (153) Short-term loans payable 1,190 1,190 -
Current portion of bonds - 6,000 6,000 Lease obligations 5 3 (1) Accounts payable-other 2,404 1,837 (566) Accrued expenses 1,263 1,058 (204) Income taxes payable 253 131 (121) Advances received 1,063 908 (154) Deposits received 13,132 15,453 2,321 Provision for product warranties 30 40 9 Provision for directors' bonuses 30 25 (5) Provision for products purchase guarantee agreement
22 84 62
Other 24 24 (0)
Total current liabilities 24,340 31,526 7,186 Non-current liabilities
Bonds payable 14,000 8,000 (6,000) Long-term loans payable 6,500 6,500 -
Lease obligations 6 2 (3) Provision for directors' retirement benefits 5 5 -
Other 283 291 8
Total non-current liabilities 20,796 14,800 (5,995)
Total liabilities 45,136 46,326 1,190 Net assets
Shareholders' equity
Capital stock 19,052 19,052 -
Capital surplus
Legal capital surplus 28,002 28,002 -
Capital surplus 28,002 28,002 -
Retained earnings
Legal retained earnings 2,468 2,468 -
Other retained earnings 27,918 26,203 (1,715) General reserve 21,719 21,719 -
Retained earnings brought forward 6,199 4,484 (1,715)
Total retained earnings 30,386 28,671 (1,715)
Treasury stock (1,040) (1,012) 28
Shareholders' equity 76,400 74,713 (1,686) Valuation and translation adjustments
Valuation difference on available-for-sale securities
557 572 15
Total valuation and translation adjustments 557 572 15
Subscription rights to shares 203 145 (58)
Total net assets 77,161 75,431 (1,729)
Total liabilities and net assets 122,297 121,758 (538)
ANRITSU CORPORATION(6754) Financial Summary of FY2016
25
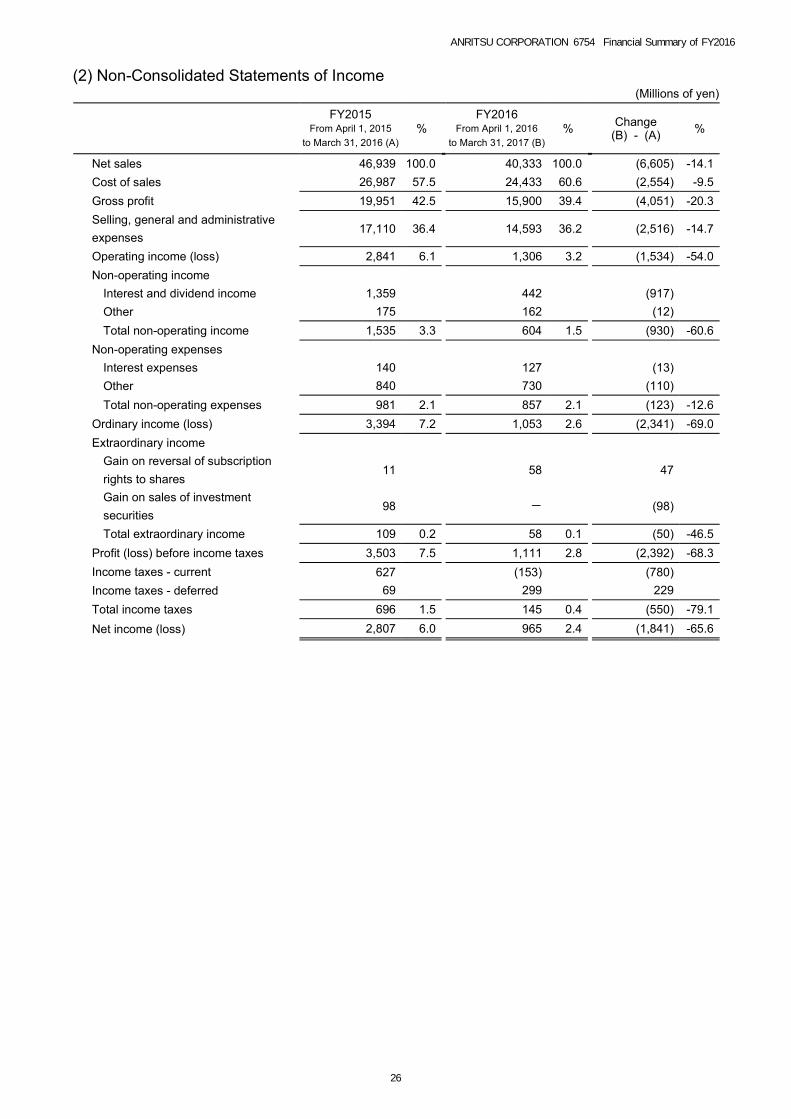
(2) Non-Consolidated Statements of Income(Millions of yen)
FY2015
From April 1, 2015 to March 31, 2016 (A)
%
FY2016 From April 1, 2016
to March 31, 2017 (B) %
Change (B) - (A) %
Net sales 46,939 100.0 40,333 100.0 (6,605) -14.1 Cost of sales 26,987 57.5 24,433 60.6 (2,554) -9.5 Gross profit 19,951 42.5 15,900 39.4 (4,051) -20.3 Selling, general and administrative expenses
17,110 36.4 14,593 36.2 (2,516) -14.7
Operating income (loss) 2,841 6.1 1,306 3.2 (1,534) -54.0 Non-operating income
Interest and dividend income 1,359 442 (917)
Other 175 162 (12)
Total non-operating income 1,535 3.3 604 1.5 (930) -60.6 Non-operating expenses
Interest expenses 140 127 (13)
Other 840 730 (110)
Total non-operating expenses 981 2.1 857 2.1 (123) -12.6 Ordinary income (loss) 3,394 7.2 1,053 2.6 (2,341) -69.0 Extraordinary income
Gain on reversal of subscription rights to shares
11 58 47
Gain on sales of investment securities
98 - (98)
Total extraordinary income 109 0.2 58 0.1 (50) -46.5 Profit (loss) before income taxes 3,503 7.5 1,111 2.8 (2,392) -68.3 Income taxes - current 627 (153) (780)
Income taxes - deferred 69 299 229
Total income taxes 696 1.5 145 0.4 (550) -79.1 Net income (loss) 2,807 6.0 965 2.4 (1,841) -65.6
ANRITSU CORPORATION(6754) Financial Summary of FY2016
26
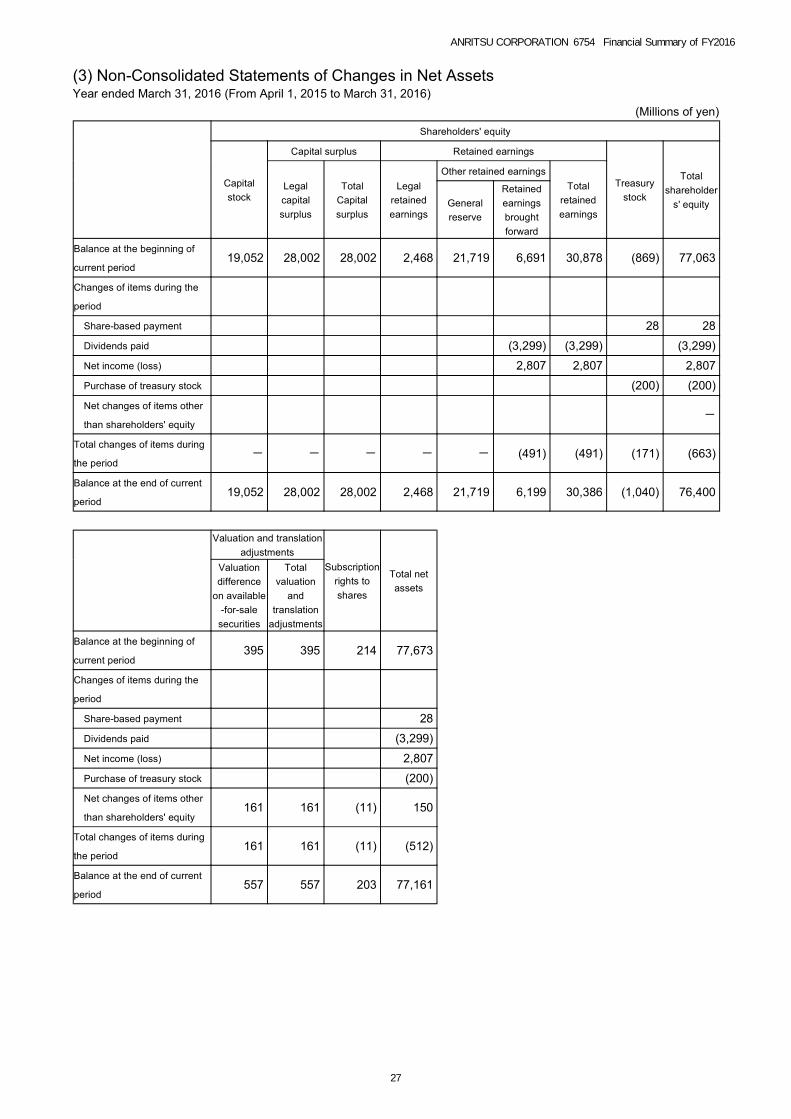
(3) Non-Consolidated Statements of Changes in Net AssetsYear ended March 31, 2016 (From April 1, 2015 to March 31, 2016)
(Millions of yen) Shareholders' equity
Capital stock
Capital surplus Retained earnings
Treasury stock
Total shareholder
s' equity
Legal capital surplus
Total Capital surplus
Legal retained earnings
Other retained earnings Total
retained earnings
General reserve
Retained earnings brought forward
Balance at the beginning of
current period 19,052 28,002 28,002 2,468 21,719 6,691 30,878 (869) 77,063
Changes of items during the
period
Share-based payment 28 28 Dividends paid (3,299) (3,299) (3,299) Net income (loss) 2,807 2,807 2,807 Purchase of treasury stock (200) (200) Net changes of items other
than shareholders' equity -
Total changes of items during
the period - - - - - (491) (491) (171) (663)
Balance at the end of current
period 19,052 28,002 28,002 2,468 21,719 6,199 30,386 (1,040) 76,400
Valuation and translation
adjustments Subscription
rights to shares
Total net assets
Valuation difference
on available-for-sale securities
Total valuation
and translation
adjustments
Balance at the beginning of
current period 395 395 214 77,673
Changes of items during the
period
Share-based payment 28 Dividends paid (3,299) Net income (loss) 2,807 Purchase of treasury stock (200) Net changes of items other
than shareholders' equity 161 161 (11) 150
Total changes of items during
the period 161 161 (11) (512)
Balance at the end of current
period 557 557 203 77,161
ANRITSU CORPORATION(6754) Financial Summary of FY2016
27
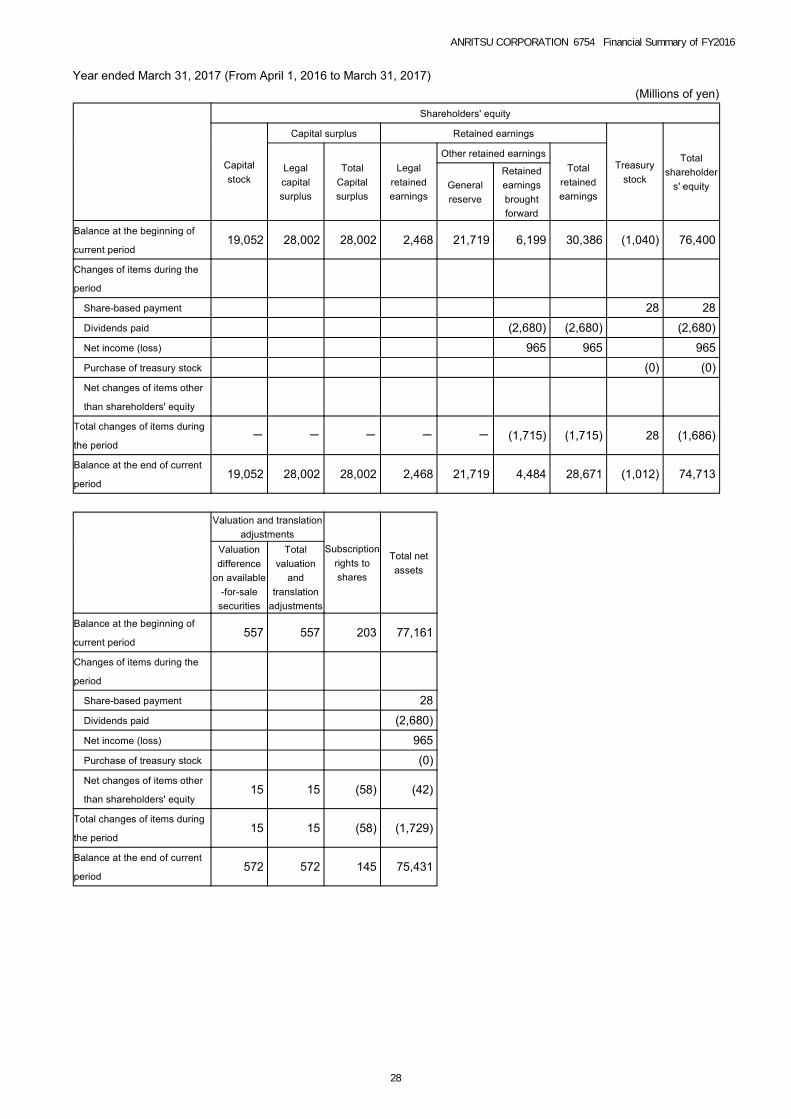
Year ended March 31, 2017 (From April 1, 2016 to March 31, 2017) (Millions of yen)
Shareholders' equity
Capital stock
Capital surplus Retained earnings
Treasury stock
Total shareholder
s' equity
Legal capital surplus
Total Capital surplus
Legal retained earnings
Other retained earnings Total
retained earnings
General reserve
Retained earnings brought forward
Balance at the beginning of
current period 19,052 28,002 28,002 2,468 21,719 6,199 30,386 (1,040) 76,400
Changes of items during the
period
Share-based payment 28 28 Dividends paid (2,680) (2,680) (2,680) Net income (loss) 965 965 965 Purchase of treasury stock (0) (0) Net changes of items other
than shareholders' equity
Total changes of items during
the period - - - - - (1,715) (1,715) 28 (1,686)
Balance at the end of current
period 19,052 28,002 28,002 2,468 21,719 4,484 28,671 (1,012) 74,713
Valuation and translation
adjustments Subscription
rights to shares
Total net assets
Valuation difference
on available-for-sale securities
Total valuation
and translation
adjustments
Balance at the beginning of
current period 557 557 203 77,161
Changes of items during the
period
Share-based payment 28 Dividends paid (2,680) Net income (loss) 965 Purchase of treasury stock (0) Net changes of items other
than shareholders' equity 15 15 (58) (42)
Total changes of items during
the period 15 15 (58) (1,729)
Balance at the end of current
period 572 572 145 75,431
ANRITSU CORPORATION(6754) Financial Summary of FY2016
28

6. Others(1) Executive Personnel Changes Expected on June 28, 2017
1) Change of Representative Director None
2) Other Changes 1. New Appointing Directors
Name (Current Title) New Title
Hirokazu Hamada
(Executive Vice President, Measurement Business Group President, General Manager of Measurement Business Div. of the Company)
Director
Yuji Inoue
(Director(Audit Committee Member) (Outside Director) of the Company / Outside Corporate Auditor of Ryohin Keikaku Co.,Ltd.)
Director (Outside Director)
2. New Appointing Directors elected as Audit Committee Member Name (Current Title) New Title
Norio Igarashi (Certified Public Accountant / Visiting Professor of Yokohama National University, Center for Economic Growth Strategy / Director(Audit Committee Member) (Outside Director) of Mitsubishi UFJ Securities Holdings )
Director (Audit Committee Member) (Outside Director)
Osamu Nagata
(Senior Executive Officer, General Manager of Management Audit Dept. of the Company)
Director (Full-time Audit Committee Member)
3. Retiring Director Name Current Title
Teruaki Aoki Director (Outside Director)
Sachiko Ichikawa Director (Outside Director)
Yuji Inoue Director (Audit Committee Member) (Outside Director) Tomoyuki Kikugawa Director (Full-time Audit Committee Member)
3) Expected New Order of Executive Personnel after Shareholder’s Meeting: 1. Directors and Audit Committee Members
Representative Director, President Hirokazu Hashimoto
Director Toshisumi Taniai Director Akifumi Kubota
Director Hirokazu Hamada
Director(Outside Director) Takashi Sano
Director(Outside Director) Yuji Inoue
Director(Audit Committee Member) (Outside Director) Takaya Seki
Director(Audit Committee Member) (Outside Director) Norio Igarashi
Director(Full-time Audit Committee Member) Osamu Nagata
ANRITSU CORPORATION(6754) Financial Summary of FY2016
29
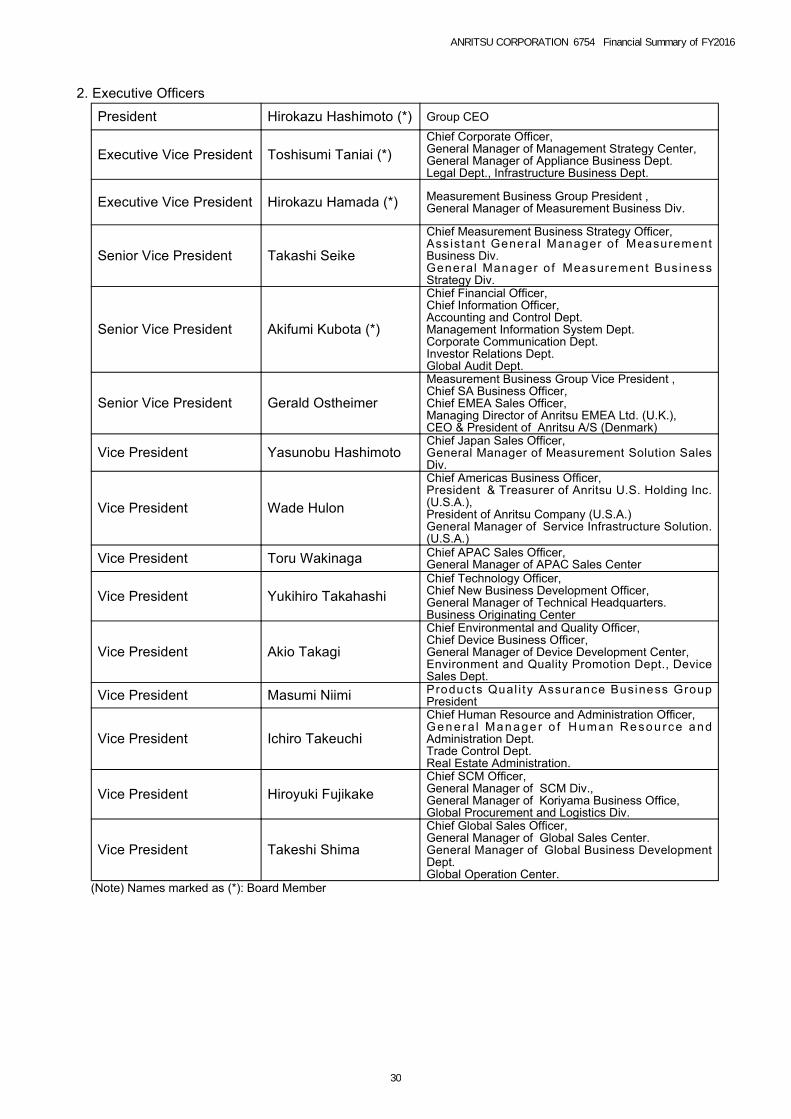
2. Executive Officers
President Hirokazu Hashimoto (*) Group CEO
Executive Vice President Toshisumi Taniai (*) Chief Corporate Officer, General Manager of Management Strategy Center, General Manager of Appliance Business Dept. Legal Dept., Infrastructure Business Dept.
Executive Vice President Hirokazu Hamada (*) Measurement Business Group President , General Manager of Measurement Business Div.
Senior Vice President Takashi Seike
Chief Measurement Business Strategy Officer, Assistant General Manager of Measurement Business Div. General Manager o f Measurement Bus iness Strategy Div.
Senior Vice President Akifumi Kubota (*)
Chief Financial Officer, Chief Information Officer, Accounting and Control Dept. Management Information System Dept. Corporate Communication Dept. Investor Relations Dept. Global Audit Dept.
Senior Vice President Gerald Ostheimer
Measurement Business Group Vice President , Chief SA Business Officer, Chief EMEA Sales Officer, Managing Director of Anritsu EMEA Ltd. (U.K.), CEO & President of Anritsu A/S (Denmark)
Vice President Yasunobu Hashimoto Chief Japan Sales Officer, General Manager of Measurement Solution Sales Div.
Vice President Wade Hulon
Chief Americas Business Officer, President & Treasurer of Anritsu U.S. Holding Inc.(U.S.A.), President of Anritsu Company (U.S.A.) General Manager of Service Infrastructure Solution. (U.S.A.)
Vice President Toru Wakinaga Chief APAC Sales Officer, General Manager of APAC Sales Center
Vice President Yukihiro Takahashi Chief Technology Officer, Chief New Business Development Officer, General Manager of Technical Headquarters. Business Originating Center
Vice President Akio Takagi
Chief Environmental and Quality Officer, Chief Device Business Officer, General Manager of Device Development Center, Environment and Quality Promotion Dept., Device Sales Dept.
Vice President Masumi Niimi Products Qual i ty Assurance Business Group President
Vice President Ichiro Takeuchi
Chief Human Resource and Administration Officer, Genera l Manage r o f H um an Resou rce and Administration Dept. Trade Control Dept. Real Estate Administration.
Vice President Hiroyuki Fujikake Chief SCM Officer, General Manager of SCM Div., General Manager of Koriyama Business Office, Global Procurement and Logistics Div.
Vice President Takeshi Shima
Chief Global Sales Officer, General Manager of Global Sales Center. General Manager of Global Business Development Dept. Global Operation Center.
(Note) Names marked as (*): Board Member
ANRITSU CORPORATION(6754) Financial Summary of FY2016
30

(2) Reference InformationConsolidated Quarterly Financial HighlightsYear ended March 31, 2016
1st Quarter 2nd Quarter 3rd Quarter 4th Quarter (Millions of yen) Revenue 23,647 25,372 23,177 23,334 Gross profit 12,676 13,093 12,170 11,034 Operating profit (loss) 1,530 1,706 1,939 721 Quarterly profit (loss) before tax 1,673 1,538 1,900 322 Quarterly profit (loss) 1,147 1,214 1,559 (153) Quarterly profit (loss) attributable to owners of parent
1,143 1,214 1,554 (151)
Quarterly comprehensive income (loss) 2,533 (49) 1,727 (3,578) (Yen) Quarterly basic earnings per share 8.32 8.84 11.32 (1.10) Quarterly diluted earnings per share 8.32 8.84 11.32 (1.10) (Millions of yen) Total assets 132,064 129,375 127,584 124,624 Total equity 79,549 79,329 79,421 75,862 (Yen) Equity attributable to owners of parent per share 578.44 577.65 578.29 552.26 (Millions of yen) Cash flows from operating activities 6,647 (190) 118 3,620 Cash flows from investing activities (5,254) (781) (1,203) (1,802) Cash flows from financing activities 6,330 (2,218) (1,664) 2 Net increase (decrease) in cash and cash equivalents
8,384 (3,859) (2,744) 694
Cash and cash equivalents at end of period 43,300 39,441 36,697 37,391
Year ended March 31, 2017 1st Quarter 2nd Quarter 3rd Quarter 4th Quarter
(Millions of yen) Revenue 20,283 20,911 21,068 25,374 Gross profit 10,214 9,444 10,324 12,486 Operating profit (loss) 727 141 799 2,564 Quarterly profit (loss) before tax 7 48 1,158 2,414 Quarterly profit (loss) 25 (104) 792 2,021 Quarterly profit (loss) attributable to owners of parent
6 (103) 795 1,999
Quarterly comprehensive income (loss) (2,785) (421) 4,056 2,423 (Yen) Quarterly basic earnings per share 0.04 (0.75) 5.80 14.56 Quarterly diluted earnings per share 0.04 (0.75) 5.80 14.56 (Millions of yen) Total assets 120,819 120,097 124,098 125,054 Total equity 71,438 71,020 74,052 76,485 (Yen) Equity attributable to owners of parent per share 519.77 516.73 538.83 556.40 (Millions of yen) Cash flows from operating activities 4,787 1,877 (313) 2,894 Cash flows from investing activities (963) (1,375) (548) (778) Cash flows from financing activities (1,663) (14) (1,044) (35) Net increase (decrease) in cash and cash equivalents
389 226 (43) 1,717
Cash and cash equivalents at end of period 37,781 38,008 37,964 39,682
ANRITSU CORPORATION(6754) Financial Summary of FY2016
31
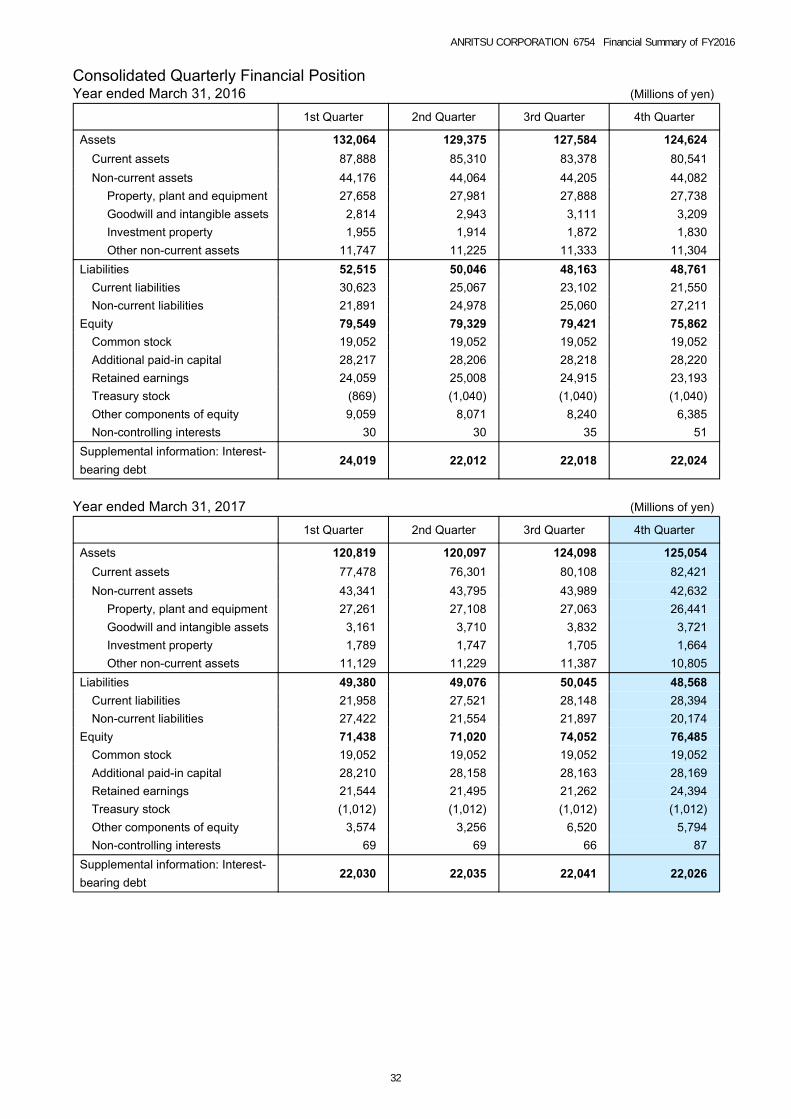
Consolidated Quarterly Financial PositionYear ended March 31, 2016 (Millions of yen)
1st Quarter 2nd Quarter 3rd Quarter 4th Quarter
Assets 132,064 129,375 127,584 124,624 Current assets 87,888 85,310 83,378 80,541 Non-current assets 44,176 44,064 44,205 44,082
Property, plant and equipment 27,658 27,981 27,888 27,738 Goodwill and intangible assets 2,814 2,943 3,111 3,209 Investment property 1,955 1,914 1,872 1,830 Other non-current assets 11,747 11,225 11,333 11,304
Liabilities 52,515 50,046 48,163 48,761 Current liabilities 30,623 25,067 23,102 21,550 Non-current liabilities 21,891 24,978 25,060 27,211
Equity 79,549 79,329 79,421 75,862 Common stock 19,052 19,052 19,052 19,052 Additional paid-in capital 28,217 28,206 28,218 28,220 Retained earnings 24,059 25,008 24,915 23,193 Treasury stock (869) (1,040) (1,040) (1,040) Other components of equity 9,059 8,071 8,240 6,385 Non-controlling interests 30 30 35 51
Supplemental information: Interest-bearing debt
24,019 22,012 22,018 22,024
Year ended March 31, 2017 (Millions of yen)
1st Quarter 2nd Quarter 3rd Quarter 4th Quarter
Assets 120,819 120,097 124,098 125,054 Current assets 77,478 76,301 80,108 82,421 Non-current assets 43,341 43,795 43,989 42,632
Property, plant and equipment 27,261 27,108 27,063 26,441 Goodwill and intangible assets 3,161 3,710 3,832 3,721 Investment property 1,789 1,747 1,705 1,664 Other non-current assets 11,129 11,229 11,387 10,805
Liabilities 49,380 49,076 50,045 48,568 Current liabilities 21,958 27,521 28,148 28,394 Non-current liabilities 27,422 21,554 21,897 20,174
Equity 71,438 71,020 74,052 76,485 Common stock 19,052 19,052 19,052 19,052 Additional paid-in capital 28,210 28,158 28,163 28,169 Retained earnings 21,544 21,495 21,262 24,394 Treasury stock (1,012) (1,012) (1,012) (1,012) Other components of equity 3,574 3,256 6,520 5,794 Non-controlling interests 69 69 66 87
Supplemental information: Interest-bearing debt
22,030 22,035 22,041 22,026
ANRITSU CORPORATION(6754) Financial Summary of FY2016
32
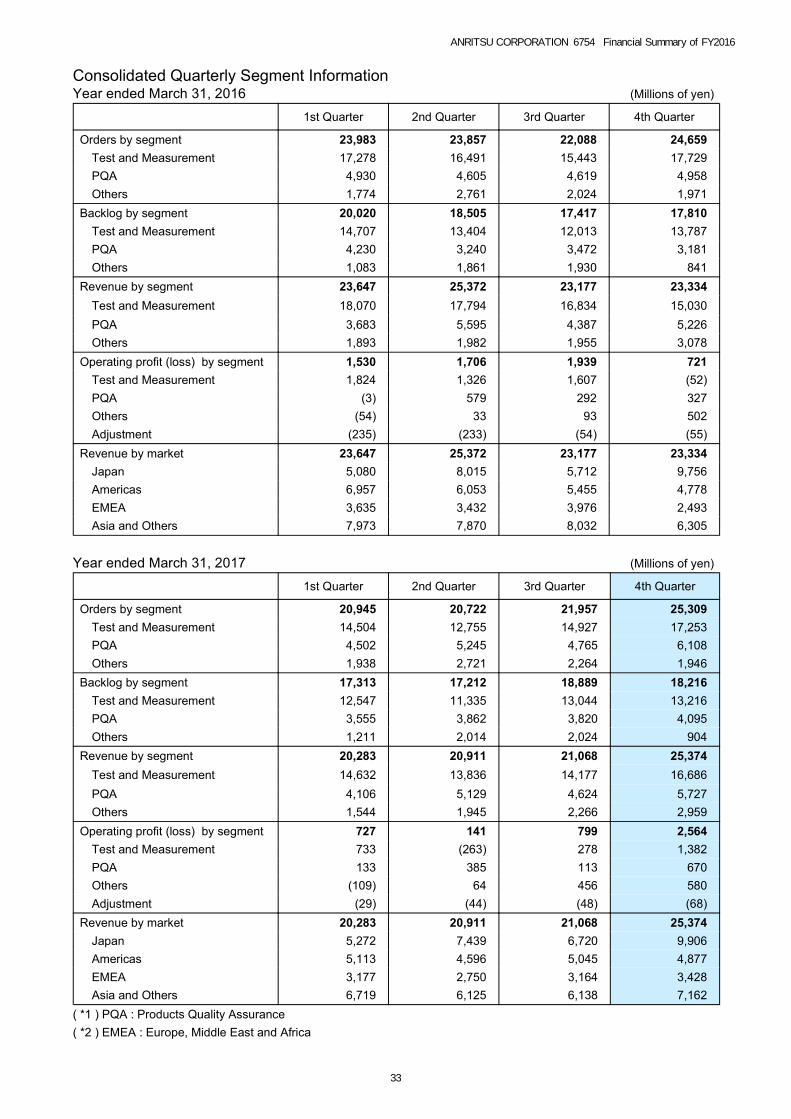
Consolidated Quarterly Segment InformationYear ended March 31, 2016 (Millions of yen)
1st Quarter 2nd Quarter 3rd Quarter 4th Quarter
Orders by segment 23,983 23,857 22,088 24,659 Test and Measurement 17,278 16,491 15,443 17,729 PQA 4,930 4,605 4,619 4,958 Others 1,774 2,761 2,024 1,971
Backlog by segment 20,020 18,505 17,417 17,810 Test and Measurement 14,707 13,404 12,013 13,787 PQA 4,230 3,240 3,472 3,181 Others 1,083 1,861 1,930 841
Revenue by segment 23,647 25,372 23,177 23,334 Test and Measurement 18,070 17,794 16,834 15,030 PQA 3,683 5,595 4,387 5,226 Others 1,893 1,982 1,955 3,078
Operating profit (loss) by segment 1,530 1,706 1,939 721 Test and Measurement 1,824 1,326 1,607 (52) PQA (3) 579 292 327 Others (54) 33 93 502 Adjustment (235) (233) (54) (55)
Revenue by market 23,647 25,372 23,177 23,334 Japan 5,080 8,015 5,712 9,756 Americas 6,957 6,053 5,455 4,778 EMEA 3,635 3,432 3,976 2,493 Asia and Others 7,973 7,870 8,032 6,305
Year ended March 31, 2017 (Millions of yen)
1st Quarter 2nd Quarter 3rd Quarter 4th Quarter
Orders by segment 20,945 20,722 21,957 25,309 Test and Measurement 14,504 12,755 14,927 17,253 PQA 4,502 5,245 4,765 6,108 Others 1,938 2,721 2,264 1,946
Backlog by segment 17,313 17,212 18,889 18,216 Test and Measurement 12,547 11,335 13,044 13,216 PQA 3,555 3,862 3,820 4,095 Others 1,211 2,014 2,024 904
Revenue by segment 20,283 20,911 21,068 25,374 Test and Measurement 14,632 13,836 14,177 16,686 PQA 4,106 5,129 4,624 5,727 Others 1,544 1,945 2,266 2,959
Operating profit (loss) by segment 727 141 799 2,564 Test and Measurement 733 (263) 278 1,382 PQA 133 385 113 670 Others (109) 64 456 580 Adjustment (29) (44) (48) (68)
Revenue by market 20,283 20,911 21,068 25,374 Japan 5,272 7,439 6,720 9,906 Americas 5,113 4,596 5,045 4,877 EMEA 3,177 2,750 3,164 3,428 Asia and Others 6,719 6,125 6,138 7,162
( *1 ) PQA : Products Quality Assurance ( *2 ) EMEA : Europe, Middle East and Africa
ANRITSU CORPORATION(6754) Financial Summary of FY2016
33

Anritsu Corporation Supplement1. Supplement of Trend of Results (Millions of yen)
Actual Estimate
2013/3 2014/3 2015/3 2016/3 2017/3 2018/3 Revenue 94,685 101,853 98,839 95,532 87,638 91,000
Change % 1.1% 7.6% -3.0% -3.3% -8.3% 3.8%
Operating Profitt (loss) 15,714 14,123 10,882 5,897 4,234 4,400 Change % 12.2% -10.1% -22.9% -45.8% -28.2% 3.9%
as % of Revenue 16.6% 13.9% 11.0% 6.2% 4.8% 4.8%
Profitt (loss) before Taxes 16,139 14,239 11,591 5,434 3,628 4,200 Change % 23.3% -11.8% -18.6% -53.1% -33.2% 15.7%
as % of Revenue 17.0% 14.0% 11.7% 5.7% 4.1% 4.6%
Profit (loss) 13,888 9,318 7,874 3,767 2,734 3,000 Change % 74.2% -32.9% -15.5% -52.2% -27.4% 9.7%
as % of Revenue 14.7% 9.1% 8.0% 3.9% 3.1% 3.3%
Basic earnings per share ¥98.41 ¥64.93 ¥55.72 ¥27.38 ¥19.65 ¥21.85 Orders 96,037 103,864 101,084 94,589 88,934 91,000
Change % 6.3% 8.2% -2.7% -6.4% -6.0% 2.3%
Cash Flows from Operating Activities 11,771 13,792 7,582 10,195 9,246 9,500 Change % -27.1% 17.2% -45.0% 34.5% -9.3% 2.7%
Free Cash Flows 6,740 8,480 1,533 1,153 5,581 6,000 Change % -51.7% 25.8% -81.9% -24.8% 384.0% 7.5%
Capital Expenditures ( * 1) 4,562 5,355 9,612 5,399 2,588 3,200 Change % 42.5% 17.4% 79.5% -43.8% -52.1% 23.6%
Depreciation ( * 2) 2,562 2,863 3,186 3,736 3,935 4,200 Change % 3.8% 11.8% 11.3% 17.3% 5.3% 6.7%
R&D Expenses ( * 3) 10,323 12,488 13,366 13,089 11,212 12,000 Change % 4.9% 21.0% 7.0% -2.1% -14.3% 7.0%
as % of Revenue 10.9% 12.3% 13.5% 13.7% 12.8% 13.2%
Number of Employees 3,771 3,880 3,926 3,846 3,788 - ( * 1) Capitalized development cost booked as intangible asset for the fiscal year is not included. ( * 2) Amortization of capitalized development cost is not included. ( * 3) R&D expenses are amounts of R&D investment including capitalized development cost.
Thus, these amounts do not agree the R&D expense booked on the consolidated statement of profit or loss and other comprehensive income.
( * 4) With an amendment of IAS19, FY2012 actual has been restated based on the revised accounting policies retrospectively.
2. Supplement of Quarterly Results (Millions of yen) 2015/Q1 2015/Q2 2015/Q3 2015/Q4 2016/Q1 2016/Q2 2016/Q3 2016/Q4 Revenue 23,647 25,372 23,177 23,334 20,283 20,911 21,068 25,374
Y o Y 6.7% -1.8% -2.8% -13.6% -14.2% -17.6% -9.1% 8.7%
Operating Profit 1,530 1,706 1,939 721 727 141 799 2,564 Y o Y 7.6% -46.7% -27.0% -80.0% -52.4% -91.7% -58.8% 255.5%
as % of Revenue 6.5% 6.7% 8.4% 3.1% 3.6% 0.7% 3.8% 10.1%
Profit before Tax 1,673 1,538 1,900 322 7 48 1,158 2,414 Y o Y 23.9% -58.0% -36.5% -91.0% -99.6% -96.8% -39.1% 649.2%
as % of Revenue 7.1% 6.1% 8.2% 1.4% 0.0% 0.2% 5.5% 9.5%
Profit 1,147 1,214 1,559 (153) 25 (104) 792 2,021 Y o Y 40.7% -54.6% -24.9% - -97.8% - -49.1% - as % of Revenue 4.9% 4.8% 6.7% -0.7% 0.1% -0.5% 3.8% 8.0%
(Millions of yen) Upper : Revenue Lower : Operating Profit
2015/Q1 2015/Q2 2015/Q3 2015/Q4 2016/Q1 2016/Q2 2016/Q3 2016/Q4
Test and Measurement 18,070 17,794 16,834 15,030 14,632 13,836 14,177 16,686 1,824 1,326 1,607 (52) 733 (263) 278 1,382
PQA 3,683 5,595 4,387 5,226 4,106 5,129 4,624 5,727 (3) 579 292 327 133 385 113 670
Others 1,893 1,982 1,955 3,078 1,544 1,945 2,266 2,959 (290) (199) 39 447 (138) 20 408 511
Total Revenue 23,647 25,372 23,177 23,334 20,283 20,911 21,068 25,374 Total Operating Profit 1,530 1,706 1,939 721 727 141 799 2,564
( * 1) PQA : Products Quality Assurance ( * 2) "Others" contains "Others" and "Adjustment" of segment information.
ANRITSU CORPORATION(6754) Financial Summary of FY2016
34
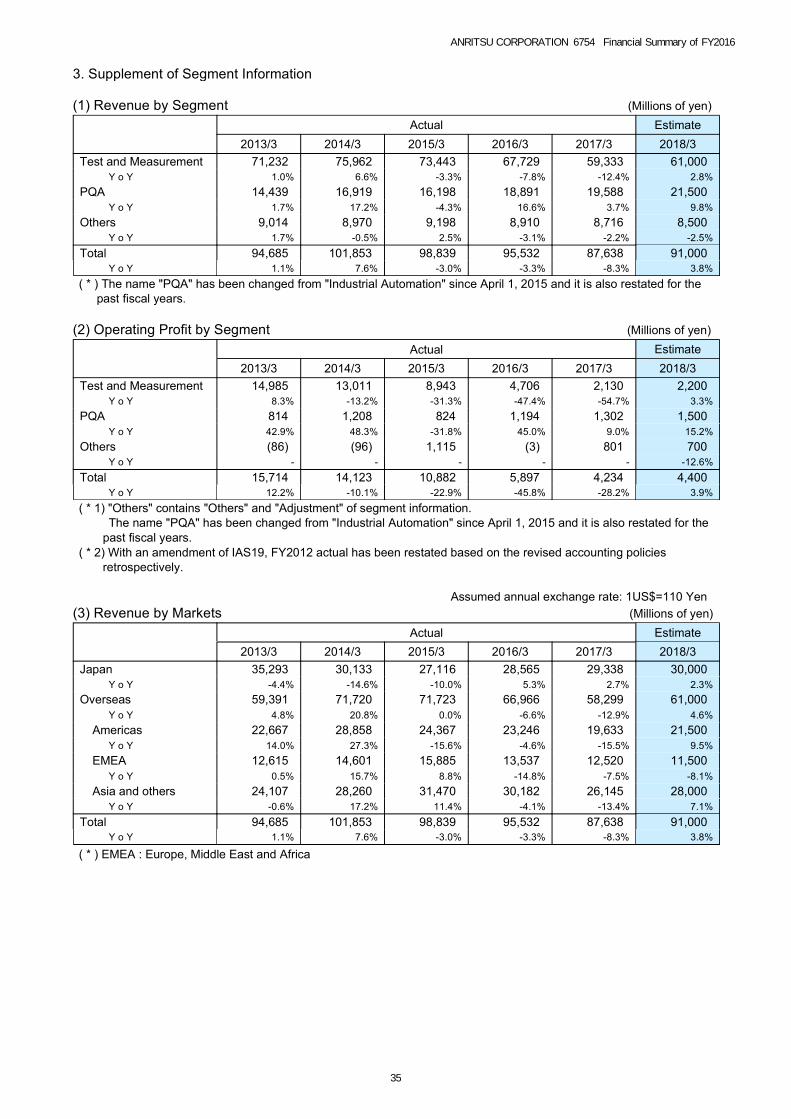
3. Supplement of Segment Information
(1) Revenue by Segment (Millions of yen)
Actual Estimate
2013/3 2014/3 2015/3 2016/3 2017/3 2018/3 Test and Measurement 71,232 75,962 73,443 67,729 59,333 61,000
Y o Y 1.0% 6.6% -3.3% -7.8% -12.4% 2.8%
PQA 14,439 16,919 16,198 18,891 19,588 21,500 Y o Y 1.7% 17.2% -4.3% 16.6% 3.7% 9.8%
Others 9,014 8,970 9,198 8,910 8,716 8,500 Y o Y 1.7% -0.5% 2.5% -3.1% -2.2% -2.5%
Total 94,685 101,853 98,839 95,532 87,638 91,000 Y o Y 1.1% 7.6% -3.0% -3.3% -8.3% 3.8%
( * ) The name "PQA" has been changed from "Industrial Automation" since April 1, 2015 and it is also restated for the past fiscal years.
(2) Operating Profit by Segment (Millions of yen)
Actual Estimate
2013/3 2014/3 2015/3 2016/3 2017/3 2018/3 Test and Measurement 14,985 13,011 8,943 4,706 2,130 2,200
Y o Y 8.3% -13.2% -31.3% -47.4% -54.7% 3.3%
PQA 814 1,208 824 1,194 1,302 1,500 Y o Y 42.9% 48.3% -31.8% 45.0% 9.0% 15.2%
Others (86) (96) 1,115 (3) 801 700 Y o Y - - - - - -12.6%
Total 15,714 14,123 10,882 5,897 4,234 4,400 Y o Y 12.2% -10.1% -22.9% -45.8% -28.2% 3.9%
( * 1) "Others" contains "Others" and "Adjustment" of segment information. The name "PQA" has been changed from "Industrial Automation" since April 1, 2015 and it is also restated for the
past fiscal years. ( * 2) With an amendment of IAS19, FY2012 actual has been restated based on the revised accounting policies
retrospectively.
Assumed annual exchange rate: 1US$=110 Yen(3) Revenue by Markets (Millions of yen)
Actual Estimate
2013/3 2014/3 2015/3 2016/3 2017/3 2018/3 Japan 35,293 30,133 27,116 28,565 29,338 30,000
Y o Y -4.4% -14.6% -10.0% 5.3% 2.7% 2.3%
Overseas 59,391 71,720 71,723 66,966 58,299 61,000 Y o Y 4.8% 20.8% 0.0% -6.6% -12.9% 4.6%
Americas 22,667 28,858 24,367 23,246 19,633 21,500 Y o Y 14.0% 27.3% -15.6% -4.6% -15.5% 9.5%
EMEA 12,615 14,601 15,885 13,537 12,520 11,500 Y o Y 0.5% 15.7% 8.8% -14.8% -7.5% -8.1%
Asia and others 24,107 28,260 31,470 30,182 26,145 28,000 Y o Y -0.6% 17.2% 11.4% -4.1% -13.4% 7.1%
Total 94,685 101,853 98,839 95,532 87,638 91,000 Y o Y 1.1% 7.6% -3.0% -3.3% -8.3% 3.8%
( * ) EMEA : Europe, Middle East and Africa
ANRITSU CORPORATION(6754) Financial Summary of FY2016
35