consolidated financial statements, - ocp …€¦ · the consolidated financial statements include...
TRANSCRIPT
CONSOLIDATED FINANCIAL STATEMENTS,AT 31 DECEMBER 2013
Groupe OCP is one of the world leaders in the phosphate and phosphate derivative products market. The Group’s activity consists in extracting phosphate and processing it into phosphate derivative products. Groupe OCP has the largest phosphate reserves in the world and is the world’s leading exporter of phosphate and phosphoric acid, and one of the main exporters of phosphate fertilizers. The Group directly employs more than 23,600 people.The consolidated financial statements include the parent company OCP SA and its subsidiaries (the entirety is referred to as the “Group” and each company individually as the “entities of the Group”) and the share of the Group in the affiliated companies or companies under joint control.OCP SA, the parent company of the Group, is a “société anonyme” (corporation) with a board of directors whose registered office is located at 2, Rue Al Abtal – Hay Erraha, 21500 Casablanca, Morocco.The consolidated financial statements at 31 December 2013 are presented in dirhams rounded to the nearest million.

COnTEnTS
2013 HiGHliGHTS 4
KEy fiGuRES 6
finAnCiAl STATEMEnTS
COnSOliDATED PROfiT AnD lOSS ACCOunT 7COnSOliDATED STATEMEnT Of COMPREHEnSivE inCOME 8COnSOliDATED STATEMEnT Of finAnCiAl POSiTiOn 9COnSOliDATED STATEMEnT Of CHAnGES in EquiTy 10COnSOliDATED STATEMEnT Of CASH flOwS 12
nOTES TO THE COnSOliDATED finAnCiAl STATEMEnTS 13
3

2013 highlights
Financing
On 27 february 2013, Groupe OCP and the islamic Development Bank (iDB) signed a financing agreement for 150 million uS dollars. This amount is designed to partially finance the project for the extension and rehabilitation of the port infrastructures operated by OCP at Jorf lasfar.
in September 2013, Groupe OCP took out a loan of 271 million dollars with Kfw, within the context of the implementation of its water strategy.
in December 2013, OCP SA took out a loan of 1.2 billion dirhams with Société générale des banques marocaines, to finance its investment projects.
Joint arrangements
On 8 May 2013, a joint venture was signed between OCP and the DuPont group. Entitled “DuPont OCP Operations Consulting”, this joint venture will offer industrial advisory and training services relating to performance, safety and sustainable development. it is intended to accompany Morocco’s economic and industrial growth, with, as a result, increased influence in Africa and the Middle East.
Groupe OCP and Bunge limited «Bunge» concluded the purchase by OCP of the participating shares of Bunge, i.e. 50%, in the Moroccan joint venture «Bunge Maroc Phosphore». Created by OCP and Bunge in 2008, this joint venture, as from its start-up, made it possible to produce phosphate-based fertilizers and elementary products for Bunge’s subsidiaries in South America. it should be noted that «Bunge Maroc Phosphore» produces 375 kt of phosphoric acid and 700 kt of fertilizer per year. This will make it possible to increase the fertilizer production capacity specific to OCP at the Jorf lasfar platform to approximately 7 million tons per year, notably after the start-up this year of two new DAP fertilizer granulation units, each with a capacity of one million tons. in accordance with OCP’s industrial development strategy, the expansion of the Group’s fertilizer production capacity will enable it to respond to the long-term trends in the increasing global demand for phosphate and its derivatives.
4

Industrial developments
OCP and its partner Prayon have signed an exclusive agreement for the transfer of the technology of Prayon’s soluble MAP, monoammonium phosphate. Prayon is recognized internationally for the quality of its soluble fertilizer production processes. This new agreement with Prayon marks Groupe OCP’s entry into the precision fertilizer market. OCP will use this technology in a soluble MAP production unit with a capacity of 100 kt per year. The unit, scheduled to start production in June 2015, will be built on the Jorf lasfar industrial platform. This partnership is at the heart of the commercial strategy of Groupe OCP, which notably aims to position itself in new growth markets and to develop products adapted to the end consumers’ needs. Groupe OCP will supply the phosphoric acid necessary for the future unit and will initiate numerous synergies from the Jorf lasfar site.
A new Diammonium Phosphate (DAP) fertilizer granulation unit has been put into service at Jorf lasfar, with a total production capacity of one million tons per year. This plant is the second unit to be completed as part of the project to build two identical new fertilizer production units at Jorf lasfar, the first having been successfully put into service in March 2013. Representing a total investment of 2.5 billion dirhams and the creation of approximately 200 direct jobs, these two new units will make it possible to increase the DAP production capacity from the current figure of 4.3 million tons per year to almost 7 million tons.
The first delivery of monocalcium phosphate (MCP) for the food industry left the Safi site on 31 July 2013 for export. Almost 550 T of MCP were thus delivered to Malaysia and Pakistan. This new OCP product was approved by the national health services in April 2013. it should be noted that this phosphate represents the reference source of phosphorous and calcium for cattle, improving bone growth and skeletal strength. This first delivery followed the marketing, in 2012, of DCP, another food supplement for cattle and poultry. with a total capacity to produce 300kt of food phosphates, OCP intends to develop its international presence in this new sector.
5
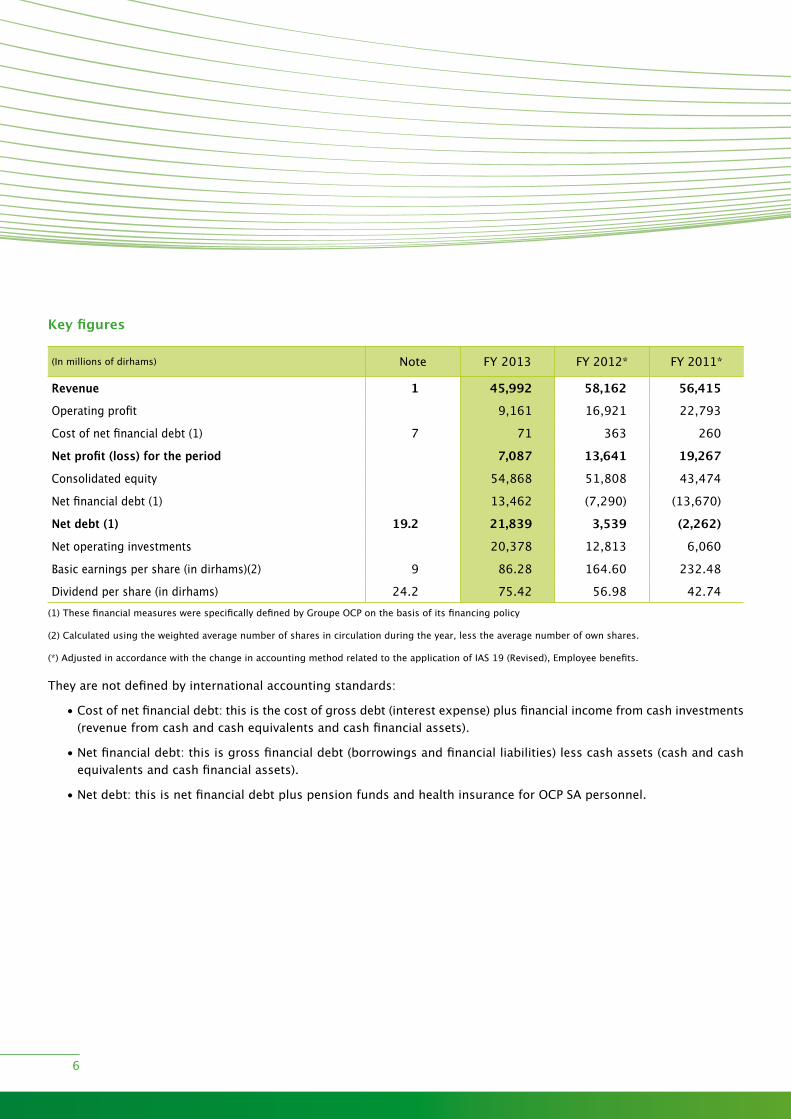
Key figures
(in millions of dirhams) Note fy 2013 fy 2012* fy 2011*
Revenue 1 45,992 58,162 56,415
Operating profit 9,161 16,921 22,793
Cost of net financial debt (1) 7 71 363 260
Net profit (loss) for the period 7,087 13,641 19,267
Consolidated equity 54,868 51,808 43,474
net financial debt (1) 13,462 (7,290) (13,670)
Net debt (1) 19.2 21,839 3,539 (2,262)
Net operating investments 20,378 12,813 6,060
Basic earnings per share (in dirhams)(2) 9 86.28 164.60 232.48
Dividend per share (in dirhams) 24.2 75.42 56.98 42.74(1) These financial measures were specifically defined by Groupe OCP on the basis of its financing policy
(2) Calculated using the weighted average number of shares in circulation during the year, less the average number of own shares.
(*) Adjusted in accordance with the change in accounting method related to the application of iAS 19 (Revised), Employee benefits.
They are not defined by international accounting standards:
• Cost of net financial debt: this is the cost of gross debt (interest expense) plus financial income from cash investments (revenue from cash and cash equivalents and cash financial assets).
• net financial debt: this is gross financial debt (borrowings and financial liabilities) less cash assets (cash and cash equivalents and cash financial assets).
• net debt: this is net financial debt plus pension funds and health insurance for OCP SA personnel.
6

Consolidated Statement of Profit and Loss
(in millions of dirhams) Note fy 2013 fy 2012* fy 2011*
Revenue 1 45,992 58,162 56,415
Production held as inventory (225) 324 1,881
Purchases consumed 2 (18,983) (22,899) (20,799)
External expenses 3 (7,546) (8,284) (5,689)
Personnel expenses 4 (9,076) (8,976) (7,798)
Taxes (236) (233) (226)
Amortization, depreciation and operating provisions 5 (1,854) (1,412) (1,595)
Other operating income and expenses 6.1 673 987 679
Current operating profit (loss) 8,746 17,670 22,867
Other non-current operating income and expenses 6.2 415 (748) (74)
Operating profit (loss) 9,161 16,921 22,793
Cost of gross financial debt (689) (692) (622)
financial income from cash investments 760 1,055 882
Cost of net financial debt 71 363 260
Other financial income and expenses (39) 117 55
Financial profit (loss) 7 32 479 315
Profit (loss) before tax 9,192 17,400 23,107
Corporate income tax 8.1 (2,105) (3,759) (3,842)
Net profit (loss) 7,087 13,641 19,267
Earnings per share in dirhams 9 86.28 164.60 232.48
Diluted earnings per share in dirhams 9 86.28 164.60 232.48(*) Adjusted in accordance with the change in accounting method related to the application of iAS 19 (Revised), Employee benefits, and non-significant
corrections made to the consolidated financial statements for financial years 2011 and 2012.
7

Consolidated Statement of Comprehensive Income
(in millions of dirhams) fy 2013 fy 2012 * fy 2011 *
Net profit (loss) 7,087 13,641 19,267
Changes in actuarial gains and losses under iAS19 R 2,482 749 (3,337)
Deferred tax (99) 2 664
Items that will not be reclassified to profit or loss 2,383 752 (2,674)
Translation differences (146) (40) (100)
Revaluation of assets available for sale (27) (17) (13)
Revaluation of hedging derivatives 10 (4) 3
Deferred tax (10) 3 2
Items that may be reclassified to profit or loss (173) (58) (108)
Income and expenses, recognized directly in equity 2,211 694 (2,782)
Consolidated comprehensive income 9,298 14,335 16,485(*)Adjusted in accordance with the change in accounting method related to the application of iAS 19 (Revised), Employee benefits, and non-significant corrections made to the consolidated financial statements for financial years 2011 and 2012.
8

Consolidated Statement of Financial Position
(in millions of dirhams) Note 31 Dec 2013 31 Dec 2012 * 31 Dec 2011 *
ASSETSCurrent assetsCash and cash equivalents 10 6,039 9,813 11,074Cash financial assets 10 4,631 18,147 16,075inventories 11 9,407 9,189 8,731Trade receivables 12 5,689 8,106 7,682Current tax receivables 1,191 1,089 299Other current assets 13 18,397 11,777 7,325Total current assets 45,355 58,122 51,186Non-current assetsnon-current financial assets 14 2,887 2,805 2,233Deferred tax assets 240 308 1,050Property, plant and equipment 17 58,251 38,773 27,476intangible assets 18 222 205 138Total non-current assets 61,601 42,091 30,897Total assets 106,955 100,212 82,083
(in millions of dirhams) Note 31 Dec 2013 31 Dec 2012 * 31 Dec 2011 *
LIABILITIESCurrent liabilitiesCurrent loans and financial debts 19 5,891 6,888 3,275Current provisions 20 43 138 105Trade payables 22 9,353 7,691 5,455Current tax payables 60 37 1,889Other current liabilities 23 8,769 6,982 4,319Total current liabilities 24,116 21,735 15,043Non-current liabilitiesnon-current loans and financial debts 19 18,242 13,783 10,203non-current provisions for employee benefits 21 9,433 11,728 12,017Other non-current provisions 20 146 1,028 996Deferred tax liabilities 133 109 330Other non-current liabilities 17 20 20Total non-current liabilities 27,972 26,669 23,566issued capital 24 8,288 8,288 8,288Paid-in capital 18,698 18,698 4,513Consolidated reserves 20,795 11,182 11,407net profit (loss) 7,087 13,641 19,267Total equity 54,868 51,808 43,474Total Liabilities and Equity 106,955 100,212 82,083
(*)Adjusted in accordance with the change in accounting method related to the application of iAS 19 (Revised), Employee benefits, and non-significant corrections made to the consolidated financial statements for financial years 2011 and 2012.
9
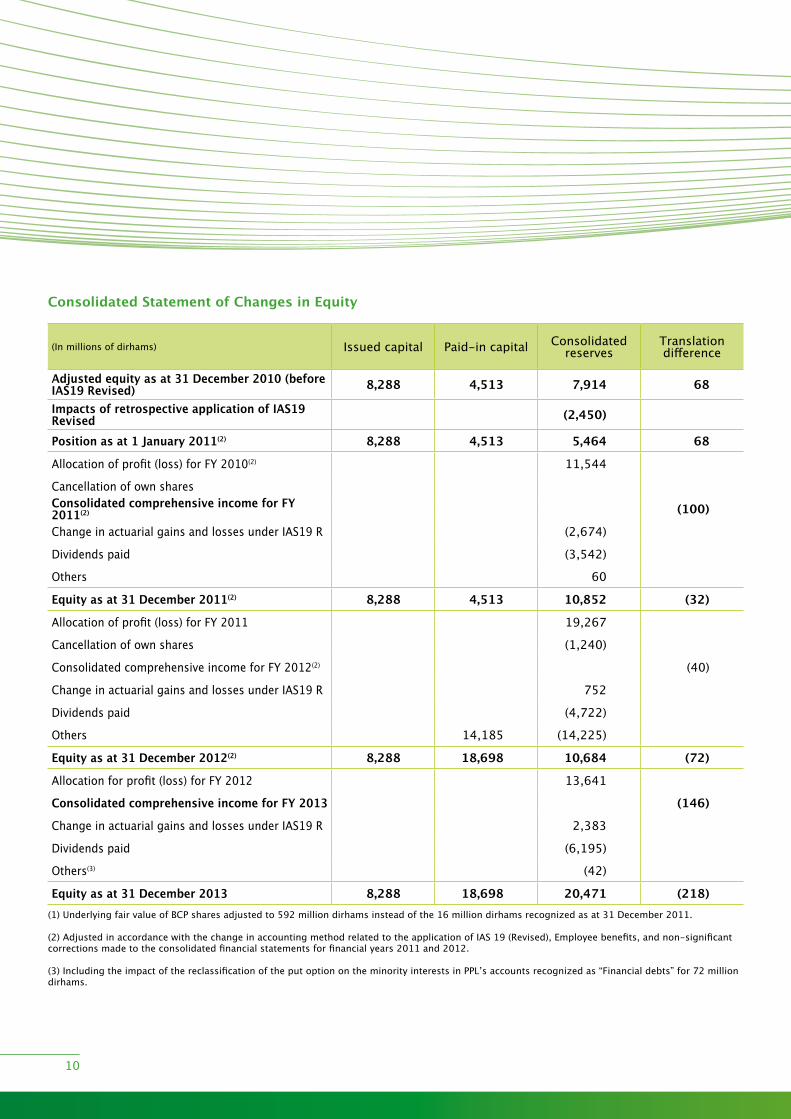
Consolidated Statement of Changes in Equity
(in millions of dirhams) issued capital Paid-in capital Consolidated reserves
Translation difference
Adjusted equity as at 31 December 2010 (before IAS19 Revised) 8,288 4,513 7,914 68
Impacts of retrospective application of IAS19 Revised (2,450)
Position as at 1 January 2011(2) 8,288 4,513 5,464 68
Allocation of profit (loss) for fy 2010(2) 11,544
Cancellation of own sharesConsolidated comprehensive income for FY 2011(2) (100)
Change in actuarial gains and losses under iAS19 R (2,674)
Dividends paid (3,542)
Others 60
Equity as at 31 December 2011(2) 8,288 4,513 10,852 (32)
Allocation of profit (loss) for fy 2011 19,267
Cancellation of own shares (1,240)
Consolidated comprehensive income for fy 2012(2) (40)
Change in actuarial gains and losses under iAS19 R 752
Dividends paid (4,722)
Others 14,185 (14,225)
Equity as at 31 December 2012(2) 8,288 18,698 10,684 (72)
Allocation for profit (loss) for fy 2012 13,641
Consolidated comprehensive income for FY 2013 (146)
Change in actuarial gains and losses under iAS19 R 2,383
Dividends paid (6,195)
Others(3) (42)
Equity as at 31 December 2013 8,288 18,698 20,471 (218)(1) underlying fair value of BCP shares adjusted to 592 million dirhams instead of the 16 million dirhams recognized as at 31 December 2011.
(2) Adjusted in accordance with the change in accounting method related to the application of iAS 19 (Revised), Employee benefits, and non-significant corrections made to the consolidated financial statements for financial years 2011 and 2012.
(3) including the impact of the reclassification of the put option on the minority interests in PPl’s accounts recognized as “financial debts” for 72 million dirhams.
10
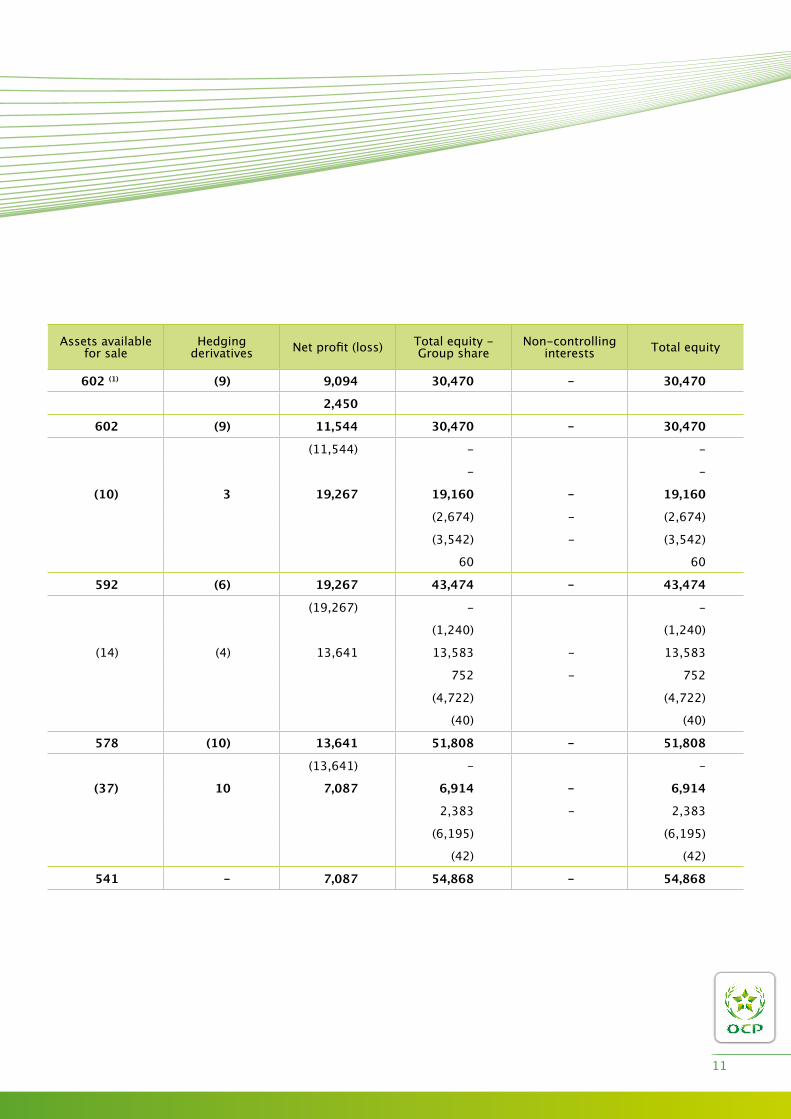
Assets available for sale
Hedging derivatives net profit (loss) Total equity -
Group shareNon-controlling
interests Total equity
602 (1) (9) 9,094 30,470 - 30,470
2,450
602 (9) 11,544 30,470 - 30,470
(11,544) - -
- -
(10) 3 19,267 19,160 - 19,160
(2,674) - (2,674)
(3,542) - (3,542)
60 60
592 (6) 19,267 43,474 - 43,474
(19,267) - -
(1,240) (1,240)
(14) (4) 13,641 13,583 - 13,583
752 - 752
(4,722) (4,722)
(40) (40)
578 (10) 13,641 51,808 - 51,808
(13,641) - -
(37) 10 7,087 6,914 - 6,914
2,383 - 2,383
(6,195) (6,195)
(42) (42)
541 - 7,087 54,868 - 54,868
11
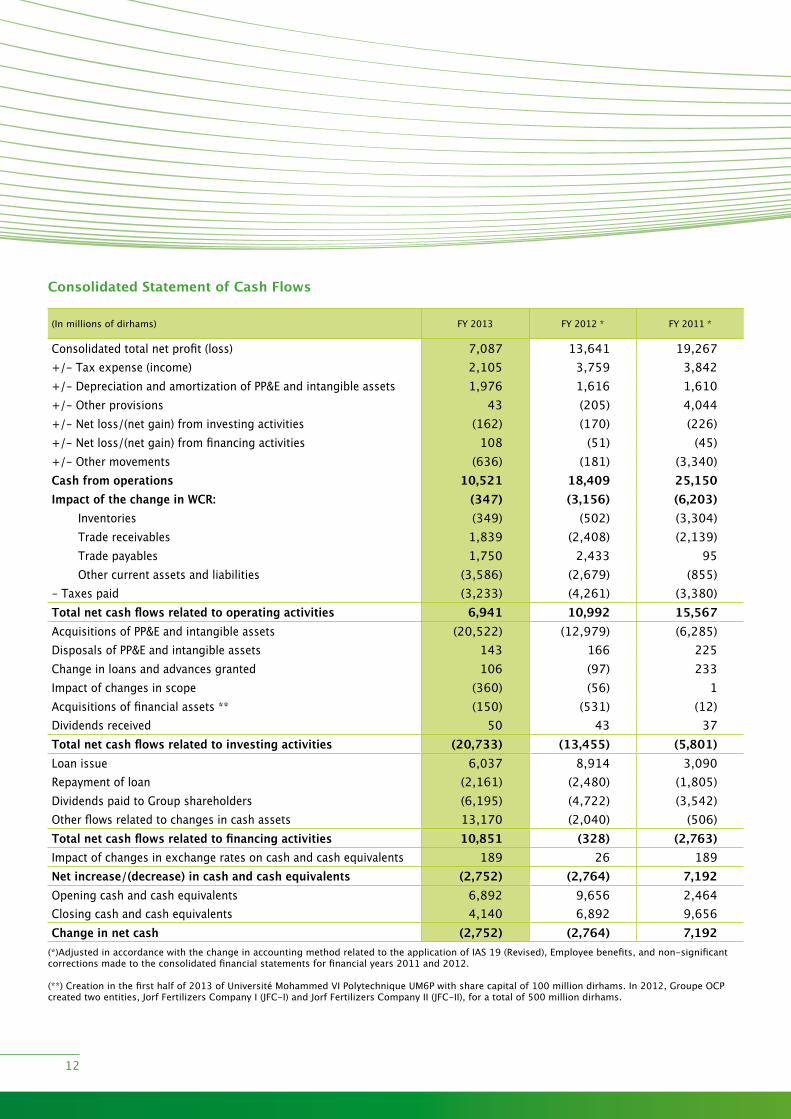
Consolidated Statement of Cash Flows
(in millions of dirhams) fy 2013 fy 2012 * fy 2011 *
Consolidated total net profit (loss) 7,087 13,641 19,267+/- Tax expense (income) 2,105 3,759 3,842+/- Depreciation and amortization of PP&E and intangible assets 1,976 1,616 1,610+/- Other provisions 43 (205) 4,044+/- net loss/(net gain) from investing activities (162) (170) (226)+/- net loss/(net gain) from financing activities 108 (51) (45)+/- Other movements (636) (181) (3,340)Cash from operations 10,521 18,409 25,150Impact of the change in WCR: (347) (3,156) (6,203)
inventories (349) (502) (3,304)Trade receivables 1,839 (2,408) (2,139)Trade payables 1,750 2,433 95Other current assets and liabilities (3,586) (2,679) (855)
- Taxes paid (3,233) (4,261) (3,380)Total net cash flows related to operating activities 6,941 10,992 15,567Acquisitions of PP&E and intangible assets (20,522) (12,979) (6,285)Disposals of PP&E and intangible assets 143 166 225Change in loans and advances granted 106 (97) 233impact of changes in scope (360) (56) 1Acquisitions of financial assets ** (150) (531) (12)Dividends received 50 43 37Total net cash flows related to investing activities (20,733) (13,455) (5,801)loan issue 6,037 8,914 3,090Repayment of loan (2,161) (2,480) (1,805)Dividends paid to Group shareholders (6,195) (4,722) (3,542)Other flows related to changes in cash assets 13,170 (2,040) (506)Total net cash flows related to financing activities 10,851 (328) (2,763)impact of changes in exchange rates on cash and cash equivalents 189 26 189Net increase/(decrease) in cash and cash equivalents (2,752) (2,764) 7,192Opening cash and cash equivalents 6,892 9,656 2,464Closing cash and cash equivalents 4,140 6,892 9,656Change in net cash (2,752) (2,764) 7,192
(*)Adjusted in accordance with the change in accounting method related to the application of iAS 19 (Revised), Employee benefits, and non-significant corrections made to the consolidated financial statements for financial years 2011 and 2012.
(**) Creation in the first half of 2013 of université Mohammed vi Polytechnique uM6P with share capital of 100 million dirhams. in 2012, Groupe OCP created two entities, Jorf fertilizers Company i (JfC-i) and Jorf fertilizers Company ii (JfC-ii), for a total of 500 million dirhams.
12

nOTES TO THE COnSOliDATED finAnCiAl STATEMEnTSA – ACCOunTinG RulES AnD METHODS
B – SEGMEnT REPORTinGiDEnTifiCATiOn Of OPERATinG SECTORSREPORTinG By BuSinESS ACTiviTySECTORiAl infORMATiOn By GEOGRAPHiC AREA
C – BuSinESS COMBinATiOnS
D – nOTES RElATinG TO THE STATEMEnT Of PROfiT AnD lOSSnOTE 1: REvEnuEnOTE 2: PuRCHASES COnSuMEDnOTE 3: ExTERnAl ExPEnSESnOTE 4: PERSOnnEl ExPEnSESnOTE 5: DEPRECiATiOn, AMORTizATiOn AnD PROviSiOnSnOTE 6: OTHER OPERATinG inCOME AnD ExPEnSESnOTE 7: nET finAnCiAl inCOMEnOTE 8: inCOME TAxESnOTE 9: EARninGS PER SHARE
E – nOTES RElATinG TO THE STATEMEnT Of finAnCiAl POSiTiOnnOTE 10 : MAnAGEMEnT Of CASH ASSETSnOTE 11 : invEnTORiES
13

nOTES TO THE COnSOliDATED finAnCiAl STATEMEnTS
nOTE 12: TRADE RECEivABlESnOTE 13: OTHER CuRREnT ASSETSnOTE 14: nOn-CuRREnT finAnCiAl ASSETSnOTE 15: AvAilABlE-fOR-SAlE ASSETSnOTE 16: DEfERRED TAx ASSETS AnD liABiliTiESnOTE 17: PROPERTy, PlAnT AnD EquiPMEnTnOTE 18: inTAnGiBlE ASSETSnOTE 19: nET DEBTnOTE 20: PROviSiOnS fOR liABiliTiES AnD CHARGESnOTE 21: EMPlOyEE BEnEfiTSnOTE 22: TRADE PAyABlESnOTE 23: OTHER CuRREnT liABiliTiESnOTE 24: CAPiTAl AnD RESERvES
f – OTHER nOTESnOTE 25: OTHER COMMiTMEnTS AnD COnTinGEnT liABiliTiESnOTE 26: RElATED PARTiESnOTE 27: RiSK MAnAGEMEnTnOTE 28: COnSOliDATiOn SCOPE
G – EvEnTS AfTER THE REPORTinG PERiOD
H – STATuTORy AuDiTORS’ REPORT
14

A – Accounting rules and methods
1. Bases for the preparation of the financial statementsin accordance with Opinion no. 5 of the Conseil national de la Comptabilité (CnC - national Accounting Council) of 26 May 2005, and in compliance with the provisions of Article iii, paragraph 2 of the circular of the Conseil Déontologique des valeurs Mobilières (CDvM – Securities Commission), entered into force on 1 April 2012, the consolidated financial statements of the OCP Group are prepared in accordance with the standards drawn up by the international Accounting Standards Board (iASB) and the ifRS interpretation Committee respectively, and adopted by the European union.
1.1. New standards and interpretations applicable as from 1st January 2013
- iAS 1 “Presentation of items of other comprehensive income – Amendments to iAS 1”. This amendment aims to enrich the financial information in the statement of comprehensive income. Gains and losses recognized directly in equity will have to be presented in such a way as to show items that may be reclassified to profit or loss separately from those that will never be reclassified;
- iAS 19 (Revised) “Employee benefits”. This amendment includes changes to the recognition and presentation of pension and similar commitments, notably concerning actuarial gains and losses which will be recognized immediately in full in non-recyclable “other comprehensive income”, and past service costs which will be recognized immediately in profit or loss. The impact of this amendment is detailed in note 21 – Employee benefits;
- ifRiC 20 – “Stripping costs in the production phase of a surface mine”. This interpretation allows these costs to be recognized in a non-current asset account entitled “stripping activity” when certain criteria are met. The application of this interpretation has not had any impact on Groupe OCP’s accounts as at 31 December 2013;
- ifRS 13 – “fair value measurement”. This standard provides a single framework for the measurement of fair value. The adoption of ifRS 13 did not necessitate any adjustment of the techniques that OCP uses to measure fair value and did not result in any adjustment of the values as at 1 January 2013;
- Amendments to ifRS 7 “financial instruments: Disclosures – Offsetting financial assets and financial liabilities”. This amendment requires the communication of new information concerning financial instruments offset in the balance sheet and those that are subject to an enforceable master netting arrangement or similar agreement. Groupe OCP is not concerned by this amendment;
- Amendment to iAS 12 “Deferred tax: recovery of underlying assets” introducing a rebuttable presumption that the carrying value of an investment property will be recovered by its sale and the tax rate applicable to the sale of the underlying asset will be applied to the entity. The application of this amendment has not had a significant impact on Groupe OCP’s accounts as at 31 December 2013;
- Amendments to iAS 1, iAS 16, iAS 32, iAS 34 and ifRiC 2 within the framework of the “Annual improvements - 2009-2011 cycle” published by the iASB on 17 May 2012. The application of these amendments did not have any impact on Groupe OCP’s accounts as at 31 December 2013;
15

1.2. Standards not adopted early
Groupe OCP has not opted for early adoption of the following texts that were adopted by the European union as at 31 December 2013 but had not yet entered into force as at that date:
- Amendment to iAS 32 “financial instruments: presentation”, which is applicable retrospectively to financial years beginning on or after 1 January 2014. it establishes the conditions for offsetting financial instruments in the balance sheet. The scope of the clarifications made by the amendment to iAS 32 is being established;
- The new standards on consolidation, ifRS 10 “Consolidated financial statements”, ifRS 11 “Joint arrangements” and ifRS 12 “Disclosure of interests in other entities” published by the iASB on 12 May 2011 and adopted by the European Commission on 11 December 2012. They are subject to mandatory application for financial years beginning on or after 1 January 2014. ifRS 10 replaces iAS 27 “Consolidated and separate financial statements” for the part relating to consolidated financial statements and SiC interpretation 12 for special purpose entities. it defines a single control model applicable to all entities, whether structured or not. ifRS 11 replaces iAS 31 “interests in joint ventures” and SiC 13 “Jointly controlled entities – non-monetary contributions by venturers”. it bases the recognition of joint arrangements on their substance, thus making it necessary to analyze the rights and obligations arising from the joint arrangement. ifRS 12 combines and improves disclosures to be made about subsidiaries, joint arrangements, associates and structured entities;
The application of ifRS 12 will result in the enrichment of disclosures to be made in respect of subsidiaries, joint arrangements and associates.
As a consequence of these new standards, the iASB has also published amended versions of iAS 27 “Separate financial statements” and iAS 28 “investments in associates and joint ventures” which were adopted by the European Commission on 11 December 2012 and are subject to mandatory application for financial years beginning on or after 1 January 2014;
Groupe OCP concluded its assessment of the impact of the adoption of ifRS 11, and all of its joint ventures, which are currently consolidated according to the proportionate consolidate method, must be recognized according to the equity method in accordance with this standard. According to this method, our share of the net assets, net profit or loss and the other comprehensive income of the joint ventures will be presented on one line, in the consolidated statement of financial position, the consolidated profit and loss account and the consolidated statement of comprehensive income respectively. in addition, the consolidated statement of cash flows drawn up will include the cash flows between us and our joint ventures, and not our share of the cash flows of the joint ventures.
16

The amendments to ifRS 10, ifRS 11 and ifRS 12 published by the iASB on 28 June 2012 and adopted by the European Commission on 4 April 2013 are subject to mandatory application as from 1 January 2014. The amendment to ifRS 10 provides clarifications on transitional provisions and provides some relief concerning comparative information to be presented, limiting adjustments to the previous financial year.
The following tables summarize the retroactive adjustments that will be made to our consolidated financial statements upon the adoption of ifRS 11 “Joint arrangements”.
The impacts on the Consolidated Statement of Profit and loss for financial years 2013 are as follows:
(in millions of dirhams)fy 2013
As presented Partnerships As adjusted
Revenue 45,992 (7,140) 38,853
Profit (loss) of equity-accounted operating companies (0) 50 50
Current operating profit (loss) 8,746 (284) 8,462
Other non-current operating income and expenses 415 7 422
Operating profit (loss) 9,161 (277) 8,884
Financial profit (loss) 32 302 334
Net profit (loss) 7,087 - 7,087
Earnings per share in dirhams 86.28 - 86.28
17

The impacts on the consolidated statement of financial position are as follows:
(in millions of dirhams)31 December 2013
As presented Partnerships As adjusted
ASSETS
Total current assets 45,355 (4,497) 40,857
Total non-current assets 61,601 (92) 61,508
including stake in equity-accounted enterprises - 2,632 2,632
Total Assets 106,955 (4,590) 102,366
(in millions of dirhams)31 December 2013
As presented Partnerships As adjusted
LIABILITIES
Total current liabilities 24,116 (3,464) 20,652
Total non-current liabilities 27,972 (1,126) 26,846
Total equity 54,868 - 54,867
Total Liabilities and equity 106,955 (4,590) 102,366
(in millions of dirhams)31 December 2012
As presented Partnerships As adjusted
ASSETS
Total current assets 58,122 (5,061) 53,061
Total non-current assets 42,091 (699) 41,392
including stake in equity-accounted enterprises - 3,278 3,278
Total Assets 100,212 (5,759) 94,453
(in millions of dirhams)31 December 2012
As presented Partnerships As adjusted
LIABILITIES
Total current liabilities 21,735 (4,532) 17,203
Total non-current liabilities 26,669 (1,227) 25,442
Total equity 51,808 - 51,808
Total Liabilities and equity 100,212 (5,759) 94,453
18
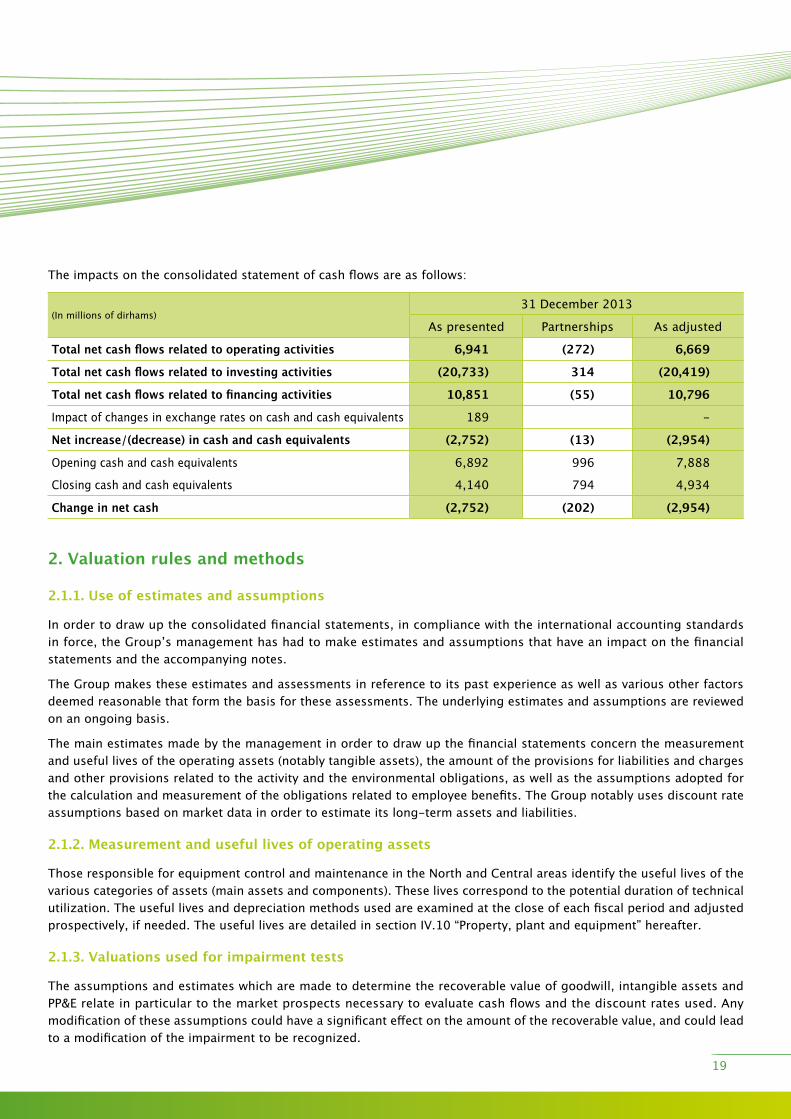
The impacts on the consolidated statement of cash flows are as follows:
(in millions of dirhams)31 December 2013
As presented Partnerships As adjusted
Total net cash flows related to operating activities 6,941 (272) 6,669
Total net cash flows related to investing activities (20,733) 314 (20,419)
Total net cash flows related to financing activities 10,851 (55) 10,796
impact of changes in exchange rates on cash and cash equivalents 189 -
Net increase/(decrease) in cash and cash equivalents (2,752) (13) (2,954)
Opening cash and cash equivalents 6,892 996 7,888
Closing cash and cash equivalents 4,140 794 4,934
Change in net cash (2,752) (202) (2,954)
2. Valuation rules and methods
2.1.1. Use of estimates and assumptions
in order to draw up the consolidated financial statements, in compliance with the international accounting standards in force, the Group’s management has had to make estimates and assumptions that have an impact on the financial statements and the accompanying notes.
The Group makes these estimates and assessments in reference to its past experience as well as various other factors deemed reasonable that form the basis for these assessments. The underlying estimates and assumptions are reviewed on an ongoing basis.
The main estimates made by the management in order to draw up the financial statements concern the measurement and useful lives of the operating assets (notably tangible assets), the amount of the provisions for liabilities and charges and other provisions related to the activity and the environmental obligations, as well as the assumptions adopted for the calculation and measurement of the obligations related to employee benefits. The Group notably uses discount rate assumptions based on market data in order to estimate its long-term assets and liabilities.
2.1.2. Measurement and useful lives of operating assets
Those responsible for equipment control and maintenance in the north and Central areas identify the useful lives of the various categories of assets (main assets and components). These lives correspond to the potential duration of technical utilization. The useful lives and depreciation methods used are examined at the close of each fiscal period and adjusted prospectively, if needed. The useful lives are detailed in section iv.10 “Property, plant and equipment” hereafter.
2.1.3. Valuations used for impairment tests
The assumptions and estimates which are made to determine the recoverable value of goodwill, intangible assets and PP&E relate in particular to the market prospects necessary to evaluate cash flows and the discount rates used. Any modification of these assumptions could have a significant effect on the amount of the recoverable value, and could lead to a modification of the impairment to be recognized.
19

2.1.4. Measurement of provisions for site rehabilitation
The OCP Group has developed an agricultural rehabilitation plan for exhausted mines. This program consists of the rehabilitation of 37,531 hectares of land at the three sites of Khouribga, Ben guerir and youssoufia. A large range of crop types which can be cultivated there has been identified: cereals, fruit trees and forests, vegetables and plants for biofuels. As of 31 December 2013, 17,286 hectares were being farmed. in this respect, the Group recognizes provisions for site rehabilitation in its accounts, amounting to 141 million dirhams as at 31 December 2013.
2.1.5. Measurement of employee benefits
A provision is recognized for the defined-benefit plans, determined based on an actuarial analysis of the obligation according to the projected unit credit method, taking into account demographic and financial assumptions. The value of potential assets to cover these is deducted from the obligation determined in this way. The actuarial assumptions are reviewed annually. Differences linked to changes in actuarial assumptions and adjustments related to experience (effect of differences noted between the previous actuarial assumptions and what has actually occurred) constitute actuarial gains and losses, not reclassifiable, recognized in equity in accordance with the provisions of iAS 19 (Revised), and are recorded in “Other reserves” under shareholders’ equity. The main assumptions used by the Group are described in note 21, “Employee Benefits”.
2.2. Use of Management’s judgment
The Group’s Management uses its best judgment to define the appropriate accounting treatment of certain activities and transactions, notably when the ifRS standards and interpretations in force do not fully address the accounting issues concerned. in particular, the Group has exercised its judgment in relation to the presentation, in the consolidated statement of financial position, of current and non-current assets and liabilities combined with a presentation by order of liquidity. Given the Group’s financial status, it was considered that the criterion for classification within current and non-current assets and liabilities based on order of liquidity was more relevant, as it is in line with the practices of the Group’s major global competitors.
furthermore, under standards iAS 28 and iAS 31, respectively, it is possible not to use the equity accounted method for venture capital funds, or not to consolidate them proportionately when these interests are measured at fair value through profit or loss. in this context, Groupe OCP chose to measure its interests in “Atlas Arranib” and “inovag Processing,” held by OCP innovation fund for Agriculture (OiffA), using this latter method, considering that it provides more relevant information.
20
3. Consolidation principles
3.1. Consolidation methods
3.1.1. Subsidiaries
The companies in which the Group exercises exclusive de facto or de jure control are consolidated according to the full consolidation method. Control is understood as the power to govern the financial and operating policies of an entity so as to obtain benefits from its activities. The financial statements of controlled companies are consolidated from the time that the control becomes effective until the time that this control ceases.
Control is presumed to exist when the parent owns, directly or indirectly through subsidiaries, more than half of the voting power of an entity unless, in exceptional circumstances, it can be clearly demonstrated that such ownership does not constitute control. The existence and effect of potential voting rights that are exercisable at the date of the close of the financial statements are also considered when assessing whether one entity exercises control over another entity. However, the breakdown between the percentage of the Group’s interest and the minority interests is determined on the basis of present ownership interests.
Acquisitions and disposals of non-controlling interests that do not affect the Group’s exclusive control over the subsidiary are recognized directly in equity as transactions between shareholders.
3.1.2. Interests in joint ventures
Jointly controlled entities are entities over whose activities the Group exercises joint control under an agreement which requires unanimous agreement for strategic financial and operational decisions. Jointly controlled entities are consolidated according to the proportionate consolidation method.
3.1.3. Eliminated transactions
All intragroup transactions, as well as any significant reciprocal assets and liabilities between the fully or proportionately consolidated companies are eliminated. The same applies to profits generated within the Group (dividends, capital gains, etc.).
21
3.2. Translation method
3.2.1. Translation of foreign financial statements
The reporting currency used for the consolidated financial statements is the Moroccan dirham, which is also the parent company’s functional currency.
The functional currency of an entity is the currency used in the economic environment in which this entity principally functions. The financial statements of foreign companies with a functional currency other than the Moroccan dirham are translated at the closing exchange rate for balance sheet items, and at the average exchange rate for the financial year for profit and loss account items. The resulting translation differences are recognized in “Translation differences” in equity.
3.2.2. Transactions in a currency other than the functional currency
foreign currency transactions are recorded in the functional currency of the entity applying the exchange rate in force at the transaction date. Monetary assets and liabilities denominated in foreign currency at the balance sheet date are translated into the functional currency using the exchange rate at that date. The resulting translation differences are recognized in financial profit or loss for financing operations and in operating profit or loss for operating receivables and debts.
3.2.3. Net investment in a foreign operation
Exchange differences resulting from the translation of a net investment in a foreign operation and the corresponding hedges are recognized in “Translation reserves”. They are recognized in profit or loss upon the derecognition of the foreign operation.
4. Accounting rules and methods
4.1. Recognition of sales
Revenue from the sale of goods is measured at the fair value of the consideration received or receivable, taking into account the amount of any trade discounts and volume rebates allowed. Revenue is recognized upon the transfer of the significant risks and rewards of ownership of the goods, and when the amount of revenue can be reasonably estimated. This transfer of ownership is made at the time of delivery of goods for local sales and as per incoterms for export sales:
• sales carried out fOB (free on Board): transfer of ownership takes place when the goods are placed on board the ship at the port of shipment. This primarily concerns sales related to the mining activities,
• sales carried out under the incoterm CfR (Cost and freight): OCP bears, in addition, the transport costs to the destination port, loading costs, export formalities and the related duties and taxes. This primarily concerns sales related to the chemical activities. The transfer of risk occurs when the goods are delivered on board the ship in the port of shipment.
22

4.2. Operating result
The operating result includes all the income and expenses directly related to the Group’s business, including exchange gains and losses on operating receivables and payables, whether such income and expenses are recurring or whether they result from occasional, unusual decisions or transactions. Other non-current income and expenses include:
• Amortization of goodwill and other intangible assets;
• Profit or loss from disposals of intangible assets and PP&E;
• Restructuring costs and costs relating to workforce adjustment measures;
• unusual items corresponding to income and expenses that are unusual as regards their frequency, nature or amount.
4.3. Cost of net financial debt
The cost of net financial debt includes:
• Cost of gross debt: This includes interest charges calculated using the effective interest rate method, the costs of early repayment of loans or cancellation of lines of credit.
• financial income from cash investments: This is composed of income from investments of cash and cash equivalents as well as financial cash assets.
4.4. Other financial income and expenses
Other financial income and expenses primarily include income from loans and receivables calculated using the effective interest rate method, dividends from non-consolidated entities, exchange gains and losses on financing operations, accretion of provisions, impairment losses and income relating to financial assets.
4.5. Income taxes
income taxes include the current tax expense (or income) and the deferred tax expense (or income). Tax is recognized in profit or loss, unless it relates to items that are recognized directly in equity, in which case it is recognized in equity. The tax rates used are those that have been enacted or substantially enacted as of the closing date.
Deferred tax is determined according to the balance sheet approach. The Group applies the liability method. Groupe OCP recognizes deferred tax for all temporary differences that exist between the tax bases and the carrying amounts of the assets and liabilities in the balance sheet except for goodwill.
Tax assets relating to temporary differences, net of chargeable deferred tax liabilities, and loss carry-forwards are only recognized if it is probable that a likely future profit, determined with sufficient precision, will be generated by the tax entity.
A Group entity shall offset current tax assets and current tax liabilities if, and only if, the entity:
• has a legally enforceable right to set off the recognized amounts; and
• intends either to settle on a net basis, or to realize the asset and settle the liability simultaneously.
Deferred tax assets and liabilities, whatever their maturity, must be offset when they are levied by the same tax authority and concern a single tax entity that has the right to set off current tax assets against current tax liabilities.
23

4.6. Earnings per share
Basic earnings per share are calculated by dividing the net profit for the year attributable to ordinary shareholders of the parent company, OCP SA, by the weighted average number of ordinary shares outstanding excluding own shares.
4.7. Cash and cash equivalents
Cash and cash equivalents include cash as well as short-term investments (with a maturity of less than three months) classified in this category as long as the following criteria are met:
• highly liquid
• easily convertible to a known cash amount
• subject to a negligible risk of change in value
Short-term investments primarily correspond to cash unit trusts measured at fair value at the closing date and changes in fair value are recognized in financial profit or loss.
4.8. Financial assets
financial assets mainly include cash financial assets, financial assets available for sale and loans and receivables at amortized cost. A financial asset is classified as current when the cash flows expected to flow from the instrument mature within one year.
Cash financial assets
Cash financial assets mainly correspond to term deposits. These are investments whose maturity and income conditions are determined when they are made and which the Group intends and has the means to keep until their maturity. They are measured at amortized cost. Remuneration of term deposits is recognized in financial profit or loss.
Available-for-sale financial assets
Available-for-sale financial assets primarily include non-consolidated investment shares. They are valued at fair value. Subsequent changes in fair value are recognized directly in “Other items of comprehensive income”, except in the case of significant or prolonged unrealized loss. The Group considers that a significant loss is assumed if the asset available for sale has lost 20% of its value and that loss is prolonged if it lasts for more than 6 months. fair value corresponds to the market price for quoted shares or to an estimate of fair value for non-quoted shares, determined according to the most appropriate financial criteria for the particular situation of each shareholding. The Group uses historic cost less any possible depreciation to value its shares that are not quoted on an active market and whose fair value cannot be measured reliably.
Loans and receivables at amortized cost
This category includes operating receivables, deposits and guarantees, as well as loans. upon initial recognition, loans and receivables are recorded in the balance sheet at their fair value plus transaction costs directly attributable to the acquisition or issue of the asset. At the closing date, these assets are measured using the amortized cost method. A loss in value is recorded depending on the risk of non-recovery.
24

4.9. Inventories
inventories are measured at the lower of cost and net realizable value.
The cost of inventories is determined according to the weighted average cost method. it comprises the costs of purchase, production, conversion and other costs incurred in bringing the inventories to their present location and condition. for manufactured inventories and work-in-progress, the cost includes an appropriate share of the overheads based on normal production capacity.
net realizable value is the estimated selling price in the ordinary course of business less the estimated costs of completion and the estimated costs necessary to make the sale.
4.10. Property, plant and equipment
4.10.1. Initial and subsequent measurement
Property, plant & Equipment (PP&E) is recognized at its historic acquisition cost, production cost or cost of entry to the Group, less depreciation and possible loss of value. Borrowing costs incurred during the construction of a qualified asset are incorporated into the cost of the asset. Costs of day-to-day maintenance are recognized as maintenance costs if the frequency of renewal of this maintenance in terms of volume is annual. The partial or total restoration of one or several components constitutes major maintenance. This is recognized in fixed assets and the net carrying amount is derecognized.
4.10.2. Depreciation
in accordance with the component approach, the Group uses differentiated depreciation periods for each of the significant components of the same asset if the useful life of one of the components is different from the useful life of the principal asset to which it belongs. Depreciation is calculated using the straight-line method on useful lives corresponding to the following technical lives:
Depreciation times for the mining sites property, plant and equipment
Property, plant and equipment Duration
Mining land 10 to 30 years
Office buildings 15 to 30 years
industrial buildings 50 to 60 years
fixtures and fittings 5 to 10 years
Equipment and tools 5 to 20 years
Rolling stock and operating equipment 10 to 30 years
iT and office equipment 3 to 5 years
industrial equipment 6 to 15 years
25

Depreciation times for the chemicals sites property, plant and equipment
Property, plant and equipment Duration
Office buildings 15 to 30 years
industrial buildings 50 to 60 years
fixtures and fittings 10 to 20 years
Equipment and tools 5 to 30 years
Rolling stock and operating equipment 5 to 15 years
iT and office equipment 3 to 10 years
industrial equipment 5 to 30 years
useful lives are analyzed at the end of each fiscal period and adjusted prospectively if necessary.
4.11. Intangible assets
4.11.1. Initial and subsequent measurement
intangible assets are composed of patents, licenses, software, and research and development costs. They are recognized at their acquisition cost less accumulated amortization and impairment losses. Expenses thus recorded in assets include costs for equipment and services, costs of personnel directly assigned to the production and preparation of software for its use and costs of borrowing if eligibility conditions are satisfied.
Expenses undertaken over the development phase are capitalized when the criteria for recognition of an asset set forth in iAS 38 are met: technical feasibility, intention to complete the asset and to use it or to sell it, probability of future economic benefits, availability of resources, ability to measure the development expenses reliably. Expenses incurred during the research phase are not capitalized, but are expensed.
26

4.11.2. Amortization
intangible assets are amortized on a straight-line basis according to their useful life:
intangible assets Duration
Patents and licenses 1 to 5 years
Software 1 to 5 years
Capitalized development expenses 1 to 5 years
4.12. Leases
leases that transfer to the Group substantially all the risks and rewards incidental to ownership of an asset are classified as finance leases. All other leases are classified as operating leases.
Finance leases: finance leases are recognized as assets in the balance sheet, at the fair value of the leased property or, if lower, the present value of the minimum lease payments under the lease. The corresponding debt due to the lessor is recognized as a liability under financial debts in the balance sheet. A leased asset is depreciated over the shorter of the lease term and its useful life (unless the Group is reasonably certain that it will obtain ownership by the end of the lease term).
Operating leases: Payments made under operating leases are expensed in the profit and loss account on a straight-line basis over the duration of the lease contract.
4.13. Goodwill
At the acquisition date, goodwill is measured as the difference between:
• the aggregate of the fair value of the consideration transferred, the amount of any non-controlling interest in the acquiree and, in a business combination achieved in stages, the acquisition-date fair value of the acquirer’s previously-held equity interest in the acquiree, and
• the net of the acquisition-date amounts of the identifiable assets acquired and the liabilities assumed.
in order to evaluate interests which do not confer control at the acquisition date, the Group can retain either their fair value (complete goodwill method), or the portion that they represent in the net acquired asset (partial goodwill method). This option can be exercised at the time of each business combination.
in the case of the first consolidation of an entity, the Group measures all the identifiable assets, liabilities and contingent liabilities at their fair value, within a period not exceeding one year as from the date of acquisition.
27

Goodwill is not amortized, but is tested for impairment at least once per year and whenever there is an indication of impairment. if impairment is confirmed, the difference between the book value of the asset and its recoverable value is recognized in operating profit for the current fiscal year. impairment losses recorded cannot subsequently be reversed.
4.14. Impairment tests
A cash-generating unit (CGu) is the smallest identifiable group of assets that generates cash inflows that are largely independent of the cash inflows from other assets or groups of assets. Given the Group’s activities, two cash generating units, Rock and Chemicals, can be identified.
The impairment tests for assets apply the following rules:
• goodwill and intangible assets with indefinite useful lives are tested for impairment at least once per year.
• PP&E and intangible assets with finite lives are tested for impairment if there is an indication of impairment, as defined hereafter:
- significant reduction in the market price of the asset,
- obsolescence or physical deterioration of the asset,
- significant negative changes in past or planned use of an asset,
- significant change in the technological, economic or legal environment,
- increase in interest rates or yield which could affect useful value.
An impairment loss is recognized when the recoverable value of a CGu is lower than the net carrying amount of the assets that belong to it. The recoverable amount of a CGu is the higher of its fair value less costs to sell, and its value in use. The value in use is equal to the present value of the future cash flows that it generates, as per the budget and strategic plan approved by the Board of Directors, increased, if applicable, by its exit value at the end of its expected useful life.
impairment tests were carried out for these two cash-generating units. no depreciation was noted at the close of financial years 2011, 2012 and 2013.
4.15. Provisions
The Group recognizes a provision as soon as there is a current, legal or constructive obligation, resulting from a past event, and where it is probable that an outflow of resources will be required to extinguish the obligation.
An obligation is qualified as constructive if the following two conditions are met:
• it has been indicated to other parties, by past practice, published policies or a sufficiently specific current statement, that the entity will accept certain responsibilities;
• The entity has created a valid expectation on the part of those other parties that it will discharge those responsibilities.
28

4.16. Financial liabilities
financial liabilities include financial loans and debts, and bank overdrafts.
They are initially recognized at the fair value of the amount required to settle the corresponding obligation, less related costs. A financial liability is qualified as current if it must be settled within 12 months following the closure date of the fiscal period.
upon subsequent measurement, these financial liabilities are recognized at amortized cost, using the effective interest rate method. The interest calculated at the effective interest rate is recognized in the item “Cost of gross financial debt” over the term of the financial debt.
5. Mining exploration and studies
5.1. Exploration and evaluation expenditures
The exploration and evaluation activity includes the search for mineral resources with an economic potential, and the determination of the technical feasibility and evaluation of the commercial viability of the resources identified. in particular, it includes prospecting and topographic coverage work, geological studies and sampling and mineralogical characterization activities. Exploration and evaluation expenditures are recorded as expenses for the period.
5.2. Development expenditures
The development phase starts when the deposit has been analyzed as economically feasible and a decision has been taken to develop it. Only the expenditure incurred before the production phase and for the development of the deposit is capitalized. Development expenditure incurred to maintain the existing production is recognized as expenses. Capitalized development expenditure is depreciated on a straight-line basis over a maximum of five years.
Research and development costs amount to 98 million dirhams for financial year 2013 compared to 82 million dirhams for financial year 2012. fixed assets in research and development are recorded for 48 million dirhams as at 31 December 2013 compared to 44 million dirhams as at 31 December 2012.
B – Segment reporting
The Group’s activities are organized according to an integrated model, including all operations in the value chain from extraction of phosphates to production and marketing of various products, especially fertilizers and phosphoric acid.
Sector information is presented by sector, in conformity with the specifics of the Group’s activities. it is based on an internal management database used to analyze the performance of the activities and to allocate resources. Each operating sector is monitored individually in terms of internal reporting in accordance with common performance indicators for all sectors. The sectors presented are operating sectors or combinations of similar operating sectors.
These are the Rock, Chemicals and Support activities.
• The Rock activity comprises the extraction, processing and marketing of phosphates.
• The Chemicals activity comprises the production of fertilizers and phosphoric acid, and all other chemicals activities such as those related to horticulture, zinc processing, etc.
• The Support activity consists of support for the Rock and Chemicals activities.
29

(in millions of dirhams)Rock Chemicals Support intersegment eliminations** TOTAl
fy 2013 fy 2012 * fy 2011 * fy 2013 fy 2012 * fy 2011 * fy 2013 fy 2012 * fy 2011 * fy 2013 fy 2012 * fy 2011 * fy 2013* fy 2012 * fy 2011 *
Revenue 18,897 22,781 32,449 37,365 46,246 44,341 357 277 291 (10,627) (11,142) (20,667) 45,992 58,162 56,415
Production held as inventory 182 390 55 (627) (65) 1,825 220 - - - - - (225) 324 1,881
Purchases consumed (3,612) (3,923) (4,132) (19,972) (25,229) (37,159) (640) (421) (330) 5,242 6,673 20,822 (18,983) (22,899) (20,799)
External expenses (5,205) (5,423) (2,870) (6,280) (6,382) (3,106) (484) (665) (79) 4,422 4,186 366 (7,546) (8,284) (5,689)
Personnel expenses (5,503) (5,239) (4,376) (5,395) (5,250) (3,266) (310) (219) (155) 2,133 1,732 - (9,076) (8,976) (7,798)
Taxes (144) (137) (133) (153) (149) (89) (4) (3) (4) 65 56 - (236) (233) (226)
Amortization, depreciation and operating provisions (694) (460) (604) (1,552) (1,226) (946) (60) (5) (45) 452 279 - (1,854) (1,412) (1,595)
Other operating income and expenses 1,611 579 499 82 1,601 279 667 591 421 (1,687) (1,785) (521) 673 987 679
Current operating profit (loss) 5,531 8,568 20,889 3,468 9,547 1,880 (253) (446) 99 (0) (0) - 8,746 17,670 22,867
Other non-current operating income and expenses 541 (310) 105 152 (429) (179) (279) (9) (0) - - - 415 (748) (74)
Operating profit (loss)* 6,072 8,258 20,994 3,620 9,118 1,701 (532) (455) 99 (0) (0) - 9,161 16,921 22,793
1. Reporting by business activity
*Amounts adjusted in accordance with the change in accounting method related to the application of iAS 19 (Revised), “Employee benefits”
**intersegment eliminations relate to the elimination of transactions between consolidated joint ventures and subsidiaries. At OCP SA, phosphates are transferred from the Rock activity to the Chemicals activity at cost price. Detailed information on joint ventures is given in note 26.
2. Income from ordinary activities by geographic sector as at 31 December 2013
After elimination of internal transactions:
- The Rock activity represents 23% of consolidated turnover in financial year 2013, 87% of which is mainly for export to Europe and the united States.
- The Chemicals activity generates 73% of the Group’s consolidated turnover for the same period, 83% of which is for export notably to Brazil, india and Europe.
30
(in millions of dirhams)Rock Chemicals Support intersegment eliminations** TOTAl
fy 2013 fy 2012 * fy 2011 * fy 2013 fy 2012 * fy 2011 * fy 2013 fy 2012 * fy 2011 * fy 2013 fy 2012 * fy 2011 * fy 2013* fy 2012 * fy 2011 *
Revenue 18,897 22,781 32,449 37,365 46,246 44,341 357 277 291 (10,627) (11,142) (20,667) 45,992 58,162 56,415
Production held as inventory 182 390 55 (627) (65) 1,825 220 - - - - - (225) 324 1,881
Purchases consumed (3,612) (3,923) (4,132) (19,972) (25,229) (37,159) (640) (421) (330) 5,242 6,673 20,822 (18,983) (22,899) (20,799)
External expenses (5,205) (5,423) (2,870) (6,280) (6,382) (3,106) (484) (665) (79) 4,422 4,186 366 (7,546) (8,284) (5,689)
Personnel expenses (5,503) (5,239) (4,376) (5,395) (5,250) (3,266) (310) (219) (155) 2,133 1,732 - (9,076) (8,976) (7,798)
Taxes (144) (137) (133) (153) (149) (89) (4) (3) (4) 65 56 - (236) (233) (226)
Amortization, depreciation and operating provisions (694) (460) (604) (1,552) (1,226) (946) (60) (5) (45) 452 279 - (1,854) (1,412) (1,595)
Other operating income and expenses 1,611 579 499 82 1,601 279 667 591 421 (1,687) (1,785) (521) 673 987 679
Current operating profit (loss) 5,531 8,568 20,889 3,468 9,547 1,880 (253) (446) 99 (0) (0) - 8,746 17,670 22,867
Other non-current operating income and expenses 541 (310) 105 152 (429) (179) (279) (9) (0) - - - 415 (748) (74)
Operating profit (loss)* 6,072 8,258 20,994 3,620 9,118 1,701 (532) (455) 99 (0) (0) - 9,161 16,921 22,793
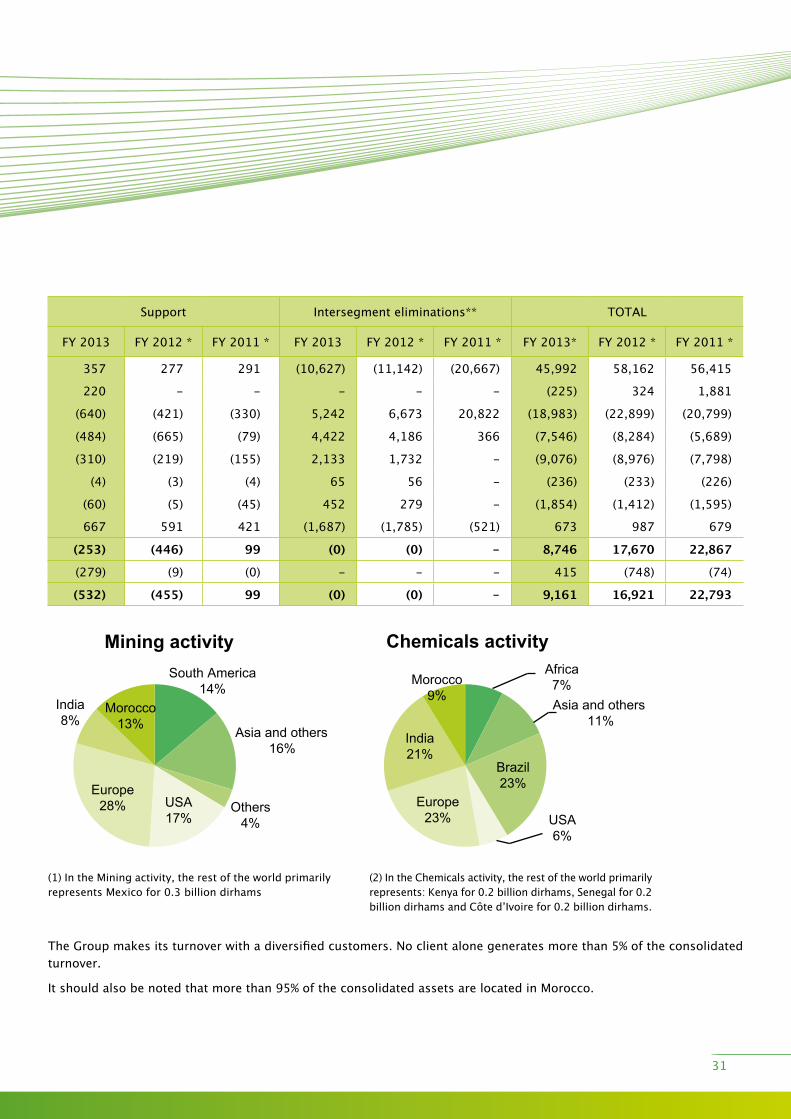
The Group makes its turnover with a diversified customers. no client alone generates more than 5% of the consolidated turnover.
it should also be noted that more than 95% of the consolidated assets are located in Morocco.
(1) in the Mining activity, the rest of the world primarily represents Mexico for 0.3 billion dirhams
(2) in the Chemicals activity, the rest of the world primarily represents: Kenya for 0.2 billion dirhams, Senegal for 0.2 billion dirhams and Côte d’ivoire for 0.2 billion dirhams.
Mining activity Chemicals activitySouth America
14%
Asia and others16%
Others4%
USA17%
Europe28%
India8%
Morocco13%
Asia and others11%
USA6%
Africa7%
Brazil23%
Europe23%
India21%
Morocco9%
31
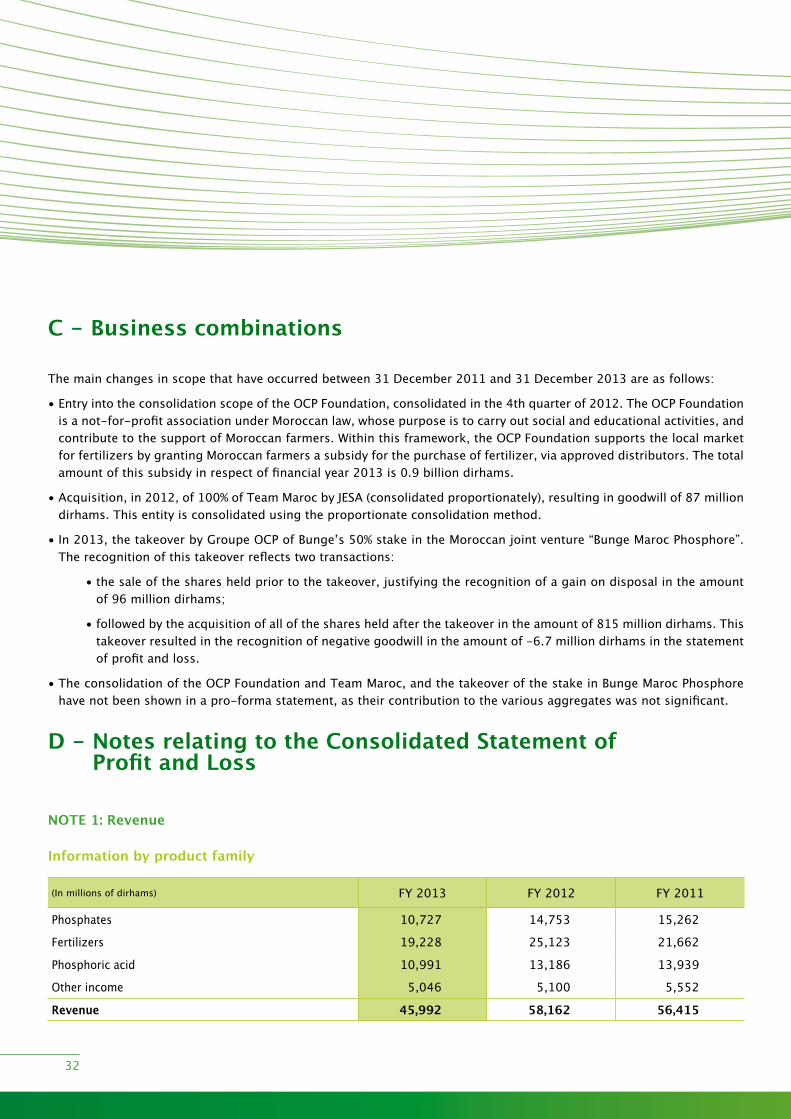
C - Business combinations
The main changes in scope that have occurred between 31 December 2011 and 31 December 2013 are as follows:
• Entry into the consolidation scope of the OCP foundation, consolidated in the 4th quarter of 2012. The OCP foundation is a not-for-profit association under Moroccan law, whose purpose is to carry out social and educational activities, and contribute to the support of Moroccan farmers. within this framework, the OCP foundation supports the local market for fertilizers by granting Moroccan farmers a subsidy for the purchase of fertilizer, via approved distributors. The total amount of this subsidy in respect of financial year 2013 is 0.9 billion dirhams.
• Acquisition, in 2012, of 100% of Team Maroc by JESA (consolidated proportionately), resulting in goodwill of 87 million dirhams. This entity is consolidated using the proportionate consolidation method.
• in 2013, the takeover by Groupe OCP of Bunge’s 50% stake in the Moroccan joint venture “Bunge Maroc Phosphore”. The recognition of this takeover reflects two transactions:
• the sale of the shares held prior to the takeover, justifying the recognition of a gain on disposal in the amount of 96 million dirhams;
• followed by the acquisition of all of the shares held after the takeover in the amount of 815 million dirhams. This takeover resulted in the recognition of negative goodwill in the amount of -6.7 million dirhams in the statement of profit and loss.
• The consolidation of the OCP foundation and Team Maroc, and the takeover of the stake in Bunge Maroc Phosphore have not been shown in a pro-forma statement, as their contribution to the various aggregates was not significant.
D - Notes relating to the Consolidated Statement of Profit and Loss
NOTE 1: Revenue
Information by product family
(in millions of dirhams) fy 2013 fy 2012 fy 2011
Phosphates 10,727 14,753 15,262
fertilizers 19,228 25,123 21,662
Phosphoric acid 10,991 13,186 13,939
Other income 5,046 5,100 5,552
Revenue 45,992 58,162 56,415
32
• Phosphate sales have decreased by 4 billion dirhams between financial year 2013 and financial year 2012. This reduction is mainly attributable to the overall decrease in average export selling prices for phosphates (uSD118 per ton in financial year 2013, compared to uSD159 per ton in financial year 2012), as well as, to a lesser degree, a reduction in volumes of export sales.
• Sales of fertilizers have decreased by 5.9 billion dirhams between financial year 2013 and financial year 2012. This reduction is mainly due to the drop in the average local and export selling prices of phosphate fertilizers (uSD435 per ton in financial year 2013, compared to uSD539 per ton in financial year 2012) combined with a reduction in sales volumes. The latter decreased from 5,493 kt in financial year 2012 to 5,215 kt in financial year 2013.
• Sales of phosphoric acid have decreased by 2.2 billion dirhams between financial year 2013 and financial year 2012. This reduction is mainly due to the downward trend in selling prices (uSD803 per ton in 2013 compared to uSD993 per ton in 2012), slightly offset by the increase in sales volumes, which rose from 1,565 kt in 2012 to 1,609 kt in 2013.
• Phosphate sales decreased by 0.5 billion dirhams between financial year 2012 and financial year 2011. This reduction is mainly due to the overall reduction in the average selling prices of phosphates (uSD159 per ton in financial year 2012, compared to uSD166 per ton in financial year 2011). The reduction in turnover is also due, to a lesser degree, to the reduction in the volumes of export sales.
• fertilizer sales increased by 3.5 billion dirhams between financial year 2012 and financial year 2011. This increase is mainly due to the increase in volumes sold, which rose from 4,349 kt in financial year 2011 to 5,493 kt in financial year 2012. This increase is nevertheless limited by the decrease in the average selling prices of phosphate fertilizers (uSD539 per ton in financial year 2012, compared to uSD616 per ton in financial year 2011).
• Phosphoric acid sales decreased by 0.8 billion dirhams between financial year 2012 and financial year 2011. This reduction is mainly due to the downward trend in selling prices (uSD993 per ton in 2012 compared to uSD1,041 per ton in 2011), accentuated by the decrease in volumes of sales which dropped from 1,656 kt in 2011 to 1,565 kt in 2012.
It should be noted that OCP subsidizes purchases of fertilizer by Moroccan farmers through the OCP Foundation. This subsidy was deducted from fertilizer turnover in the amount of 946 million dirhams in financial year 2013 and in the amount of 1,218 million dirhams in financial year 2012.
33
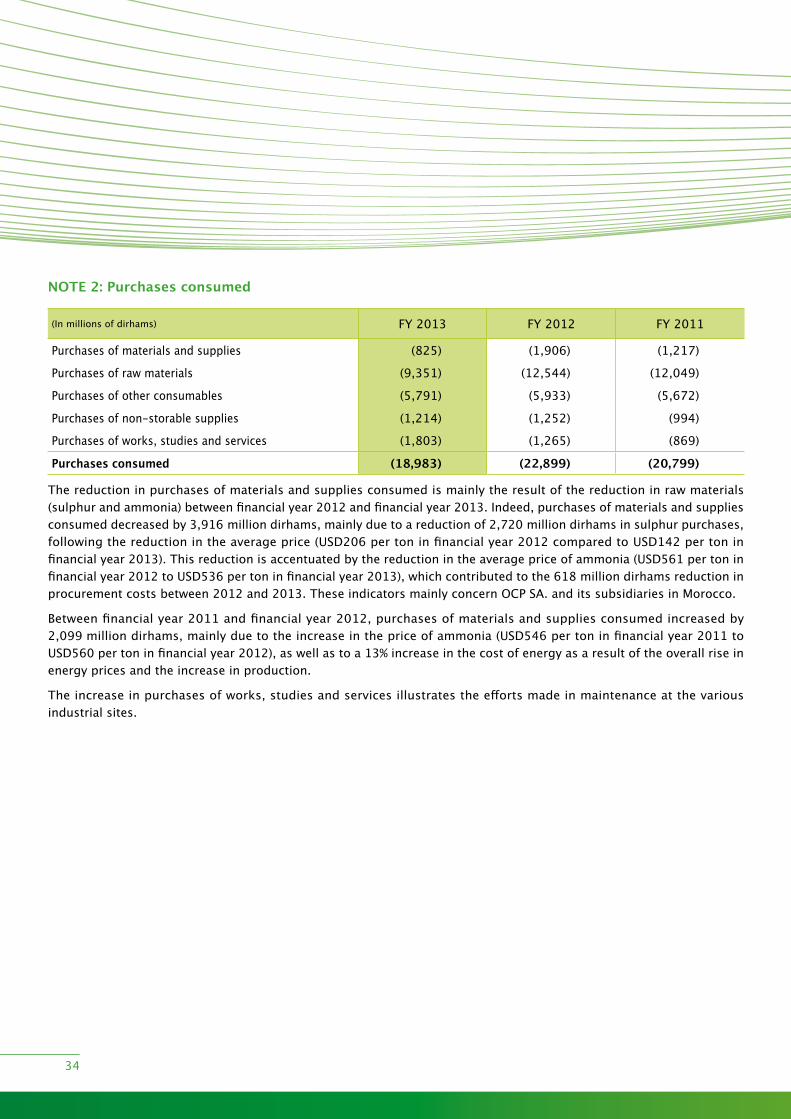
NOTE 2: Purchases consumed
(in millions of dirhams) fy 2013 fy 2012 fy 2011
Purchases of materials and supplies (825) (1,906) (1,217)
Purchases of raw materials (9,351) (12,544) (12,049)
Purchases of other consumables (5,791) (5,933) (5,672)
Purchases of non-storable supplies (1,214) (1,252) (994)
Purchases of works, studies and services (1,803) (1,265) (869)
Purchases consumed (18,983) (22,899) (20,799)
The reduction in purchases of materials and supplies consumed is mainly the result of the reduction in raw materials (sulphur and ammonia) between financial year 2012 and financial year 2013. indeed, purchases of materials and supplies consumed decreased by 3,916 million dirhams, mainly due to a reduction of 2,720 million dirhams in sulphur purchases, following the reduction in the average price (uSD206 per ton in financial year 2012 compared to uSD142 per ton in financial year 2013). This reduction is accentuated by the reduction in the average price of ammonia (uSD561 per ton in financial year 2012 to uSD536 per ton in financial year 2013), which contributed to the 618 million dirhams reduction in procurement costs between 2012 and 2013. These indicators mainly concern OCP SA. and its subsidiaries in Morocco.
Between financial year 2011 and financial year 2012, purchases of materials and supplies consumed increased by 2,099 million dirhams, mainly due to the increase in the price of ammonia (uSD546 per ton in financial year 2011 to uSD560 per ton in financial year 2012), as well as to a 13% increase in the cost of energy as a result of the overall rise in energy prices and the increase in production.
The increase in purchases of works, studies and services illustrates the efforts made in maintenance at the various industrial sites.
34
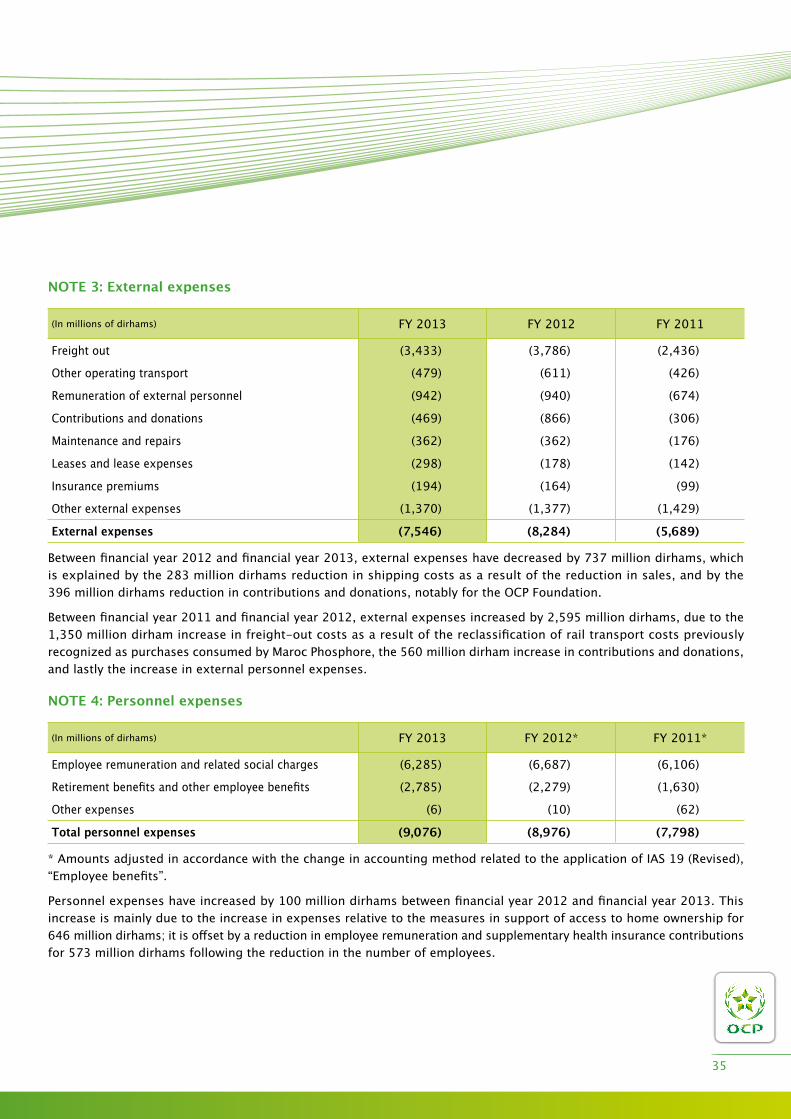
NOTE 3: External expenses
(in millions of dirhams) fy 2013 fy 2012 fy 2011
freight out (3,433) (3,786) (2,436)
Other operating transport (479) (611) (426)
Remuneration of external personnel (942) (940) (674)
Contributions and donations (469) (866) (306)
Maintenance and repairs (362) (362) (176)
leases and lease expenses (298) (178) (142)
insurance premiums (194) (164) (99)
Other external expenses (1,370) (1,377) (1,429)
External expenses (7,546) (8,284) (5,689)
Between financial year 2012 and financial year 2013, external expenses have decreased by 737 million dirhams, which is explained by the 283 million dirhams reduction in shipping costs as a result of the reduction in sales, and by the 396 million dirhams reduction in contributions and donations, notably for the OCP foundation.
Between financial year 2011 and financial year 2012, external expenses increased by 2,595 million dirhams, due to the 1,350 million dirham increase in freight-out costs as a result of the reclassification of rail transport costs previously recognized as purchases consumed by Maroc Phosphore, the 560 million dirham increase in contributions and donations, and lastly the increase in external personnel expenses.
NOTE 4: Personnel expenses
(in millions of dirhams) fy 2013 fy 2012* fy 2011*
Employee remuneration and related social charges (6,285) (6,687) (6,106)
Retirement benefits and other employee benefits (2,785) (2,279) (1,630)
Other expenses (6) (10) (62)
Total personnel expenses (9,076) (8,976) (7,798)
* Amounts adjusted in accordance with the change in accounting method related to the application of iAS 19 (Revised), “Employee benefits”.
Personnel expenses have increased by 100 million dirhams between financial year 2012 and financial year 2013. This increase is mainly due to the increase in expenses relative to the measures in support of access to home ownership for 646 million dirhams; it is offset by a reduction in employee remuneration and supplementary health insurance contributions for 573 million dirhams following the reduction in the number of employees.
35

(number) 31 December 2013 31 December 2012 31 December 2011 *
Non-executives 1,972 1,923 1,673Technicians, Supervisors and Administrative executives 7,620 7,405 6,661Manual workers and Clerical staff 14,050 15,047 12,683Employees 23,641 24,374 21,016
(*) number of employees restated for Sotreg and for the Jesa, team, Prayon and PPl staff.
The number of employees is 3% lower than at the end of December 2012, having decreased from 24,374 to 23,641. This reduction is essentially due to retirements.
Between financial year 2011 and financial year 2012, the number of employees increased by 16% as a result of the increase in recruitments in connection with the OCP Skills program.
NOTE 5: Depreciation, amortization and provisions
(in millions of dirhams) fy 2013 fy 2012 fy 2011Depreciation and amortization (2,044) (1,616) (1,631)Provisions 191 205 36Total (1,854) (1,412) (1,595)
net depreciation and amortization has increased by 442 million dirhams (i.e. +31%) between financial year 2012 and financial year 2013. This variation is mainly due to the following:
• Completion of Rock sector projects, notably the Khouribga site projects: implementation of the Merah washing plant, STEP, T2 hopper;
• Completion of the Chemicals sector projects, notably with the implementation of the two new fertilizer production lines in Jorf.
Between financial year 2011 and financial year 2012, net depreciation and amortization decreased by 183 million dirhams (i.e. -11%).
36

NOTE 6: Other operating income and expenses
6.1 Other current operating income and expenses
(in millions of dirhams) fy 2013 fy 2012 fy 2011Exchange gains or losses on operating receivables and payables 49 311 404Capitalized production 709 724 23Other (85) (48) 252Other current operating income and expenses 673 987 679
Other current operating income and expenses have decreased by 314 million dirhams between financial year 2012 and financial year 2013. This variation is mainly due to the reduction in exchange gains made on trade receivables in the amount of 262 million dirhams.
Between financial year 2011 and financial year 2012, other current operating income and expenses increased by 308 million dirhams. This variation is mainly due to the increase in capitalized production in the amount of 702 million dirhams offset by a reduction in transfers of charges in the amount of 326 million dirhams and a reduction in exchange losses made on trade receivables in the amount of 118 million dirhams.
6.2 Other non-current operating income and expenses
(in millions of dirhams) fy 2013 fy 2012* fy 2011*Gains or losses on other assets 113 153 228Grants awarded (155) (106) (108)Other non-current operating income and expenses 456 (795) (194)Other non-current operating income and expenses 415 (748) (74)
(*) Amounts adjusted in accordance with the change in accounting method related to the application of iAS 19 (Revised), “Employee benefits”.
A variation of 1,163 million dirhams has been recorded in other non-current operating income and expenses between financial year 2012 and 2013. This variation is mainly due to the write-back of the self-insurance fund surplus, for 765 million dirhams.
As at 31 December 2013, the Group reversed the surpluses recorded annually by the assets mutual fund. This is mainly explained by an equilibrium rate that is lower than the effective rate and a constantly changing contribution base.
37

NOTE 7: Net financial income
net financial income can be broken down as follows:
(in millions of dirhams) fy 2013 fy 2012 fy 2011interest expenses (689) (692) (622)Cost of gross debt (689) (692) (622)financial income from cash investments 760 1,055 882Cost of net debt 71 363 260income from assets held for sale 50 43 37Exchange income from financing operations (70) 26 28Revenue from financial receivables 9 32 2Other (28) 16 (12)Other financial income and expenses (39) 117 55Financial profit (loss) 32 479 315
financial income from cash investments has decreased by 295 million dirhams between financial year 2012 and financial year 2013. This reduction is due to the decrease in term deposits and equivalent instruments recorded in OCP’s accounts for 9 billion dirhams as at 31 December 2013 compared to 23.4 billion dirhams as at 31 December 2012.
Other financial income and expenses have decreased by 156 million dirhams between financial year 2012 and financial year 2013, mainly due to a decrease in net unrealized exchange gains on financial loans and debts for 92 million dirhams, and a change in the fair-value of the indian treasury bills (GOi Bonds) held by PPl for 26 million dirhams.
Between financial year 2011 and financial year 2012, financial income increased by 164 million dirhams. This increase is due to the increase in financial income from cash investments.
38
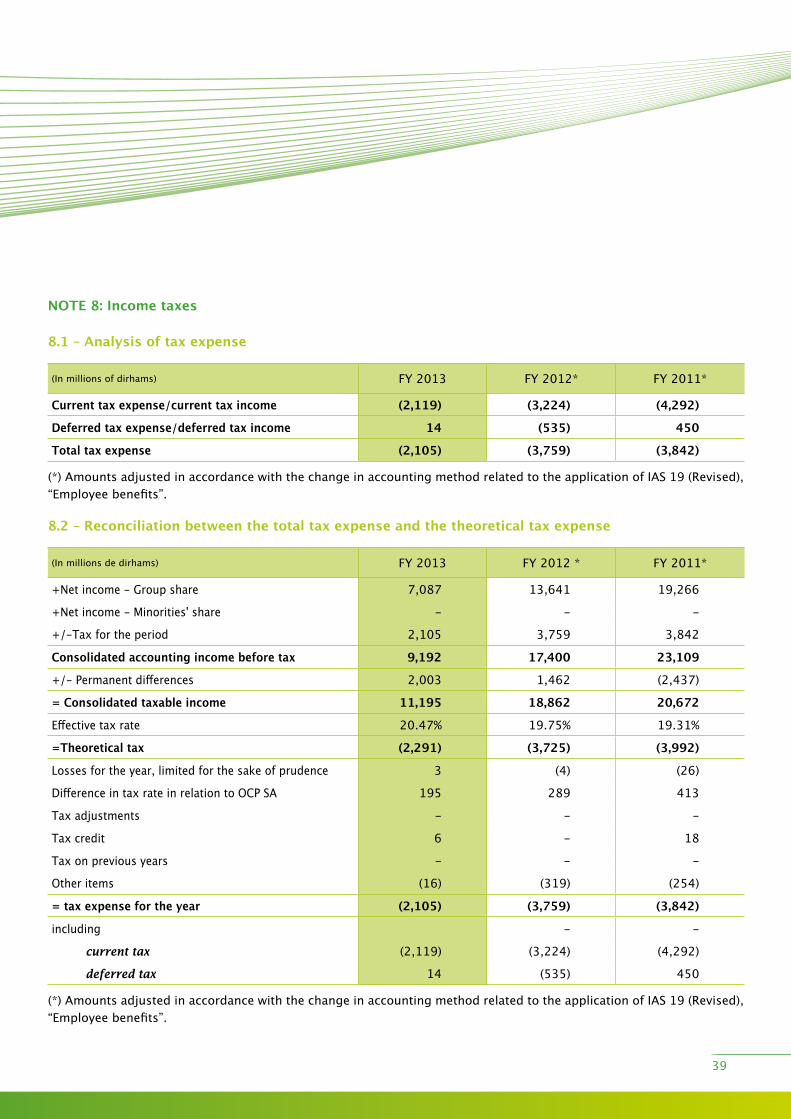
NOTE 8: Income taxes
8.1 – Analysis of tax expense
(in millions of dirhams) fy 2013 fy 2012* fy 2011*
Current tax expense/current tax income (2,119) (3,224) (4,292)
Deferred tax expense/deferred tax income 14 (535) 450
Total tax expense (2,105) (3,759) (3,842)
(*) Amounts adjusted in accordance with the change in accounting method related to the application of iAS 19 (Revised), “Employee benefits”.
8.2 – Reconciliation between the total tax expense and the theoretical tax expense
(in millions de dirhams) fy 2013 fy 2012 * fy 2011*
+Net income - Group share 7,087 13,641 19,266
+net income - Minorities' share - - -
+/-Tax for the period 2,105 3,759 3,842
Consolidated accounting income before tax 9,192 17,400 23,109
+/- Permanent differences 2,003 1,462 (2,437)
= Consolidated taxable income 11,195 18,862 20,672
Effective tax rate 20.47% 19.75% 19.31%
=Theoretical tax (2,291) (3,725) (3,992)
losses for the year, limited for the sake of prudence 3 (4) (26)
Difference in tax rate in relation to OCP SA 195 289 413
Tax adjustments - - -
Tax credit 6 - 18
Tax on previous years - - -
Other items (16) (319) (254)
= tax expense for the year (2,105) (3,759) (3,842)
including - -
current tax (2,119) (3,224) (4,292)
deferred tax 14 (535) 450
(*) Amounts adjusted in accordance with the change in accounting method related to the application of iAS 19 (Revised), “Employee benefits”.
39
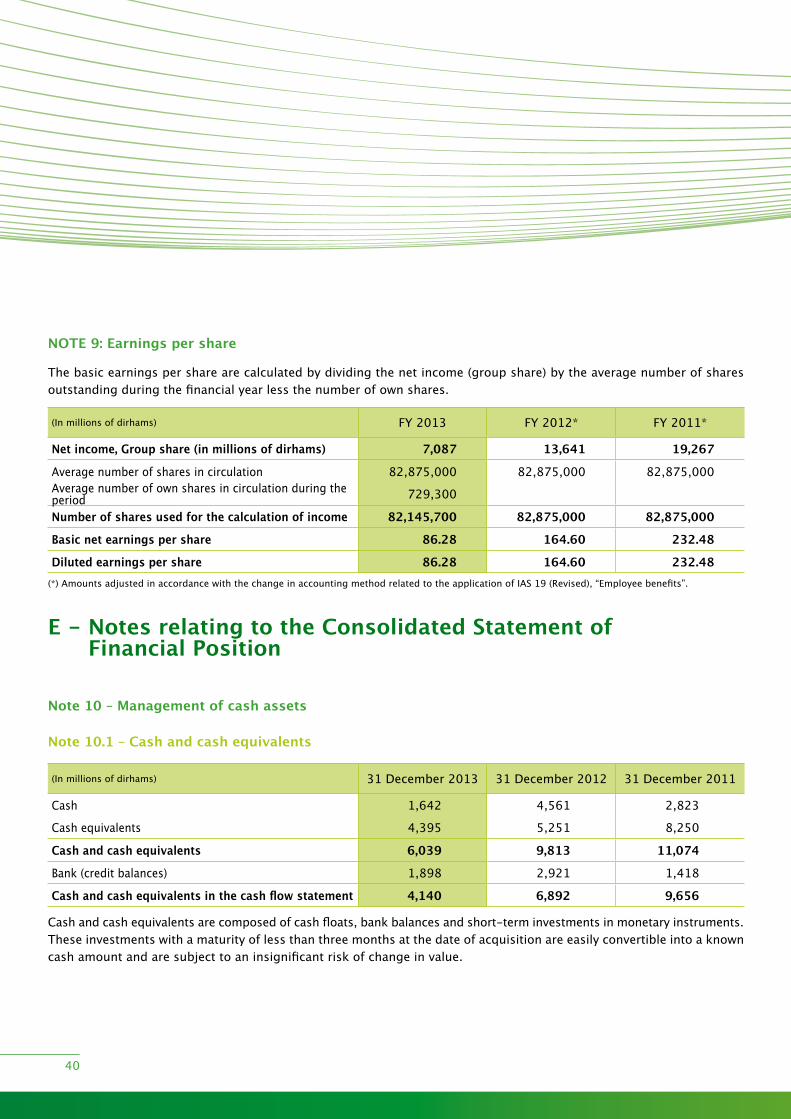
NOTE 9: Earnings per share
The basic earnings per share are calculated by dividing the net income (group share) by the average number of shares outstanding during the financial year less the number of own shares.
(in millions of dirhams) fy 2013 fy 2012* fy 2011*
Net income, Group share (in millions of dirhams) 7,087 13,641 19,267
Average number of shares in circulation 82,875,000 82,875,000 82,875,000Average number of own shares in circulation during the period 729,300
Number of shares used for the calculation of income 82,145,700 82,875,000 82,875,000
Basic net earnings per share 86.28 164.60 232.48
Diluted earnings per share 86.28 164.60 232.48(*) Amounts adjusted in accordance with the change in accounting method related to the application of iAS 19 (Revised), “Employee benefits”.
E - Notes relating to the Consolidated Statement of Financial Position
Note 10 – Management of cash assets
Note 10.1 – Cash and cash equivalents
(in millions of dirhams) 31 December 2013 31 December 2012 31 December 2011
Cash 1,642 4,561 2,823
Cash equivalents 4,395 5,251 8,250
Cash and cash equivalents 6,039 9,813 11,074
Bank (credit balances) 1,898 2,921 1,418
Cash and cash equivalents in the cash flow statement 4,140 6,892 9,656
Cash and cash equivalents are composed of cash floats, bank balances and short-term investments in monetary instruments. These investments with a maturity of less than three months at the date of acquisition are easily convertible into a known cash amount and are subject to an insignificant risk of change in value.
40

Note 10.2 – Cash financial assets
(in millions of dirhams) 31 December 2013 31 December 2012 31 December 2011
Cash financial assets 4,631 18,147 16,075
Total 4,631 18,147 16,075
The funds liquidated in the amount of 13.5 billion dirhams have served to finance a part of the investment program.
Note 10.3 – Investment maturities
The investment portfolio, composed of cash equivalents and cash financial assets, must be sufficiently liquid to meet the financing needs generated by the Group’s operations and investment.
in this respect, the investment portfolio is divided between very short-term instruments to meet operating needs, and instruments with an investment horizon of more than one month with the aim of improving yields and being in line with the targets.
(in millions of dirhams) 0-1 month 1-6 months 6-12 months > 1 year Total
Money market funds 2,199 2,199
Term deposit 2,000 3,628 1,200 6,828
Management mandate
Treasury bills
Total 4,199 3,628 1,200 9,027
41
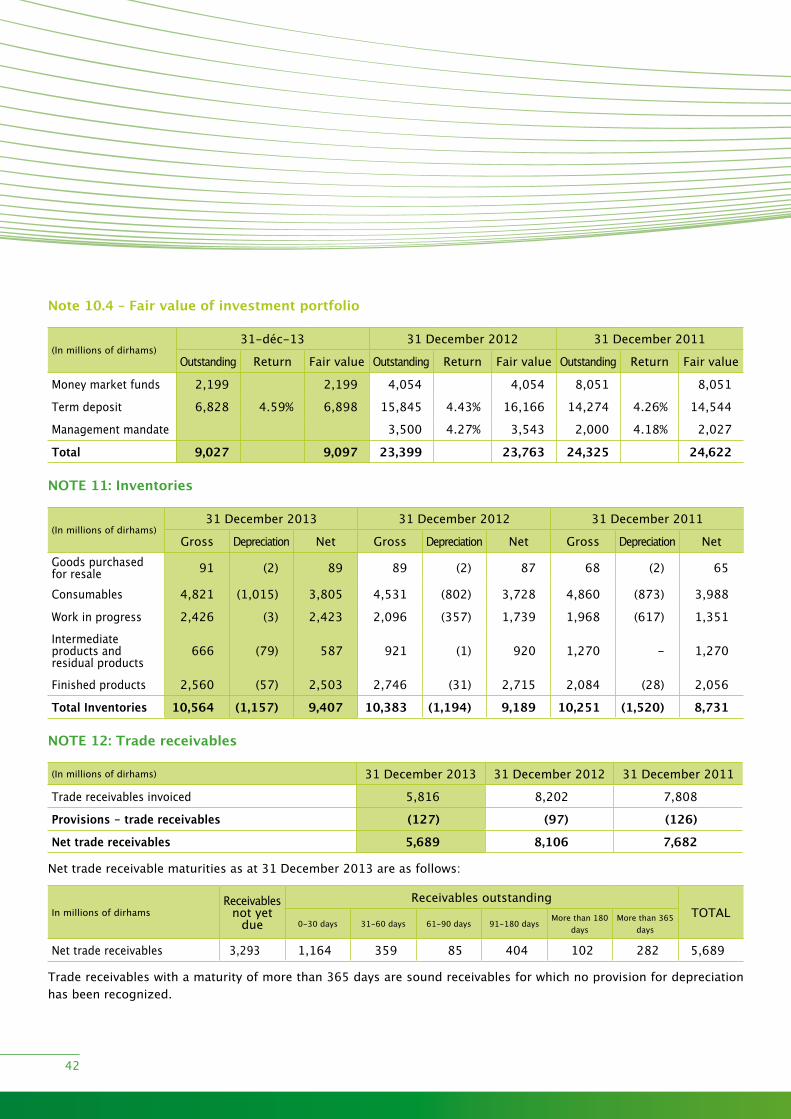
Note 10.4 – Fair value of investment portfolio
(in millions of dirhams)31-déc-13 31 December 2012 31 December 2011
Outstanding Return fair value Outstanding Return fair value Outstanding Return fair value
Money market funds 2,199 2,199 4,054 4,054 8,051 8,051
Term deposit 6,828 4.59% 6,898 15,845 4.43% 16,166 14,274 4.26% 14,544
Management mandate 3,500 4.27% 3,543 2,000 4.18% 2,027
Total 9,027 9,097 23,399 23,763 24,325 24,622
NOTE 11: Inventories
(in millions of dirhams)31 December 2013 31 December 2012 31 December 2011
Gross Depreciation Net Gross Depreciation Net Gross Depreciation NetGoods purchased for resale 91 (2) 89 89 (2) 87 68 (2) 65
Consumables 4,821 (1,015) 3,805 4,531 (802) 3,728 4,860 (873) 3,988
work in progress 2,426 (3) 2,423 2,096 (357) 1,739 1,968 (617) 1,351
intermediate products and residual products
666 (79) 587 921 (1) 920 1,270 - 1,270
finished products 2,560 (57) 2,503 2,746 (31) 2,715 2,084 (28) 2,056
Total Inventories 10,564 (1,157) 9,407 10,383 (1,194) 9,189 10,251 (1,520) 8,731
NOTE 12: Trade receivables
(in millions of dirhams) 31 December 2013 31 December 2012 31 December 2011
Trade receivables invoiced 5,816 8,202 7,808
Provisions - trade receivables (127) (97) (126)
Net trade receivables 5,689 8,106 7,682
net trade receivable maturities as at 31 December 2013 are as follows:
in millions of dirhamsReceivables
not yet due
Receivables outstandingTOTAl
0-30 days 31-60 days 61-90 days 91-180 daysMore than 180
daysMore than 365
days
net trade receivables 3,293 1,164 359 85 404 102 282 5,689
Trade receivables with a maturity of more than 365 days are sound receivables for which no provision for depreciation has been recognized.
42

NOTE 13: Other current assets
(in millions of dirhams)31 December 2013 31 December 2012* 31 December 2011*
Gross Depreciation Net Gross Depreciation Net Gross Depreciation Net
Receivables from suppliers, advances and payments on account 6,215 (6) 6,208 4,565 (6) 4,559 2,469 (6) 2,462
Personnel 67 (30) 36 73 (31) 42 108 (33) 75Social organizations 189 - 189 178 - 178 232 - 232State (excluding corporate income tax) 11,132 - 11,132 6,577 - 6,577 4,082 - 4,082
Other receivables 839 (7) 832 472 (50) 422 1,067 (593) 474Total other current receivables 18,441 (43) 18,397 11,865 (87) 11,777 7,957 (632) 7,325
Receivables from suppliers, advances and payments on account have increased by 1,650 million dirhams between 31 December 2012 and 31 December 2013. This increase is due to the rise in advances recognized within the context of the industrial programs carried out by the Group.
The line “State excluding corporate income tax” mainly includes vAT, vAT credits, the phosphate royalty, the contribution to social cohesion and other taxes.
The tax receivable maturities as at 31 December 2013 are detailed in the table below:
Taxes by nature Total not yet dueDue
<30 DAyS 30 -60 DAyS 61-90 DAyS 91-120 JOuRS > 120 DAyS
State, vAT 2,792 2,776 2 1 15 - 0vAT credit 8,173 3,896 132 9 780 40 3,316State, Other taxes 166 81 1 0 0 1 83Total 11,132 6,752 134 10 795 42 3,399
There is no risk of recovery of the vAT credit lines with a maturity exceeding 120 days. This concerns a late payment by the Directorate-General of Taxes.
43

NOTE 14: Non-current financial assets
(in millions of dirhams)31 December 2013 31 December 2012 31 December 2011
Gross RevaluationDepreciation Net Gross RevaluationDepreciation Net Gross RevaluationDepreciation Net
Available-for-sale financial assets 1,720 694 (6) 2,407 1,579 721 (6) 2,285 2,203 737 (1,163) 1,777
financial assets measured at fair value through profit or loss 9 - - 9 9 - - 9 - - -
Receivables from fixed asset disposals 90 - (43) 47 145 - (42) 103 138 - (42) 97
Other financial receivables 471 (48) 423 446 (37) 408 411 (51) 360
Total non-current financial assets 2,289 694 (96) 2,887 2,179 721 (84) 2,805 2,752 737 (1,256) 2,233
BCP available for sale represent an underlying capital gain of 694 million dirhams as at 31 December 2013 compared to 721 million dirhams as at 31 December 2012.
NOTE 15: Available-for-sale assets
(in millions of dirhams) listed securities unlisted securities TOTAl
At 31 December 2011 1,737 40 1,777Acquisitions for the period 522 522Disposals for the period -Change in fair value recognized in equity (17) (17)impairment losses 1,155 1,155Translation differences -Changes in scope and others (1,152) (1,152)At 31 December 2012 1,721 565 2,285Acquisitions for the period 152 152Disposals for the period (2) (2)Change in fair value recognized in equity (27) (27)impairment losses -Translation differences -Changes in scope and others -At 31 December 2013 1,694 716 2,407
quoted securities concern the BCP shares which represent an underlying capital gain of 694 million dirhams as at 31 December 2013.
unquoted securities include the shares in Jorf fertilizers Company i (JfC-i), Jorf fertilizers Company ii (JfC-ii) and the université Mohammed vi Polytechnique uM6P for 250 million dirhams, 250 million dirhams and 100 million dirhams respectively.
44

NOTE 16: Deferred tax assets and liabilities
The trend in deferred tax assets and liabilities is as follows:
(in millions of dirhams) 1 January 2012*
1 January 2013*
Activity changes in
income
Activity changes not in income
Change in consolidation
scope31 December
2013
Gross deferred tax assets 1,050 308 74 (142) 240unrecognized deferred tax assets -Net deferred tax assets 1,050 308 74 (142) - 240Deferred tax liabilities 330 109 162 (138) 133
(*) Amounts adjusted in accordance with the change in accounting method related to the application of iAS 19 (Revised), “Employee benefits”.
The breakdown by type of deferred tax asset and liability is as follows:
(in millions of dirhams) 31 December 2013 31 December 2012* 31 December 2011*
Tangible and intangible assets 54 420 509
financial assets at fair value through profit or loss 7 8 8
financial assets available for sale (142)
inventories (398) (365) (82)
Other asset items 765 233 (28)
Provisions for employee benefits 1,618 1,618 1,617
Other provisions 29 29 30
Temporary differences 348 79 61
Tax loss carryforwards 46 37 194
Offsetting (2,088) (1,752) (1,260)
Total deferred tax assets 240 308 1,050
(in millions of dirhams) 31 December 2013 31 December 2012* 31 December 2011*
Tangible and intangible assets 1,893 1,496 1,259
financial assets available for sale 4 142 145
Other liability items 118 114 103
Temporary differences 196 98 80
Tax loss carryforwards 9 9 -
Offsetting (2,088) (1,752) (1,260)
Total deferred tax liabilities 133 109 330(*) Amounts adjusted in accordance with the change in accounting method related to the application of iAS 19 (Revised), “Employee benefits”.
45
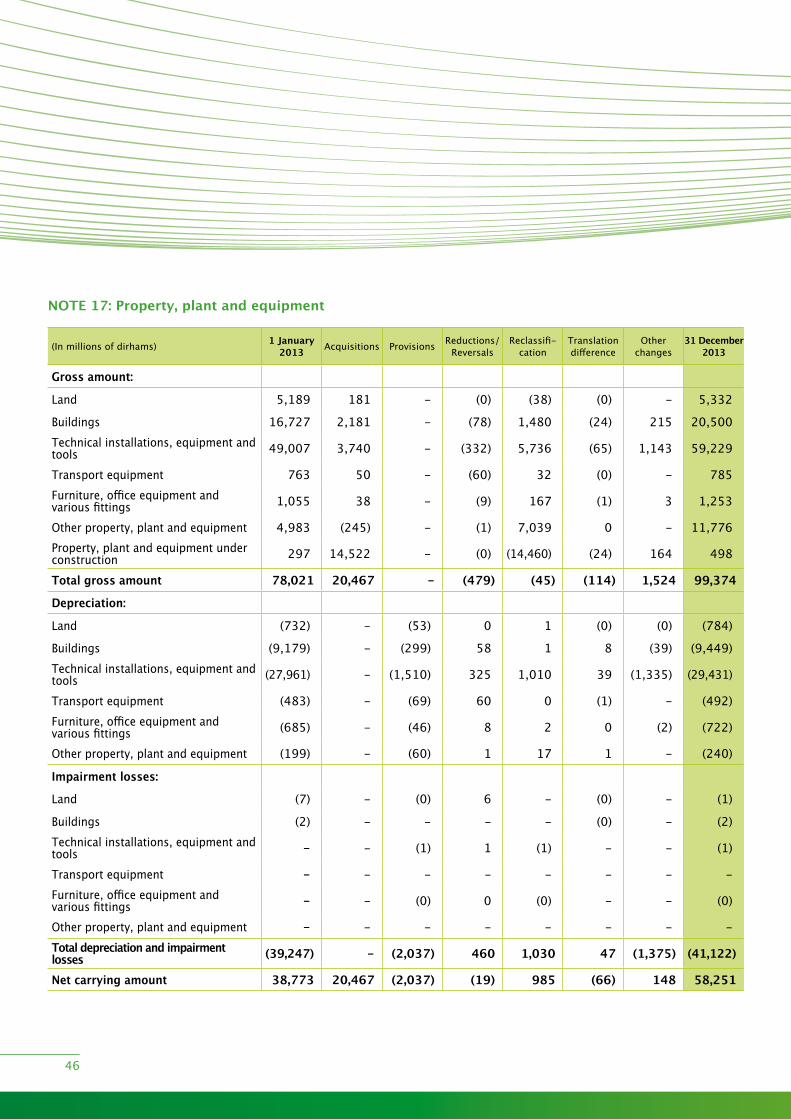
NOTE 17: Property, plant and equipment
(in millions of dirhams) 1 January 2013 Acquisitions Provisions Reductions/
ReversalsReclassifi-
cationTranslation difference
Other changes
31 December 2013
Gross amount:
land 5,189 181 - (0) (38) (0) - 5,332
Buildings 16,727 2,181 - (78) 1,480 (24) 215 20,500Technical installations, equipment and tools 49,007 3,740 - (332) 5,736 (65) 1,143 59,229
Transport equipment 763 50 - (60) 32 (0) - 785furniture, office equipment and various fittings 1,055 38 - (9) 167 (1) 3 1,253
Other property, plant and equipment 4,983 (245) - (1) 7,039 0 - 11,776Property, plant and equipment under construction 297 14,522 - (0) (14,460) (24) 164 498
Total gross amount 78,021 20,467 - (479) (45) (114) 1,524 99,374
Depreciation:
land (732) - (53) 0 1 (0) (0) (784)
Buildings (9,179) - (299) 58 1 8 (39) (9,449)Technical installations, equipment and tools (27,961) - (1,510) 325 1,010 39 (1,335) (29,431)
Transport equipment (483) - (69) 60 0 (1) - (492)furniture, office equipment and various fittings (685) - (46) 8 2 0 (2) (722)
Other property, plant and equipment (199) - (60) 1 17 1 - (240)
Impairment losses:
land (7) - (0) 6 - (0) - (1)
Buildings (2) - - - - (0) - (2)Technical installations, equipment and tools - - (1) 1 (1) - - (1)
Transport equipment - - - - - - - -furniture, office equipment and various fittings - - (0) 0 (0) - - (0)
Other property, plant and equipment - - - - - - - -Total depreciation and impairment losses (39,247) - (2,037) 460 1,030 47 (1,375) (41,122)
Net carrying amount 38,773 20,467 (2,037) (19) 985 (66) 148 58,251
46
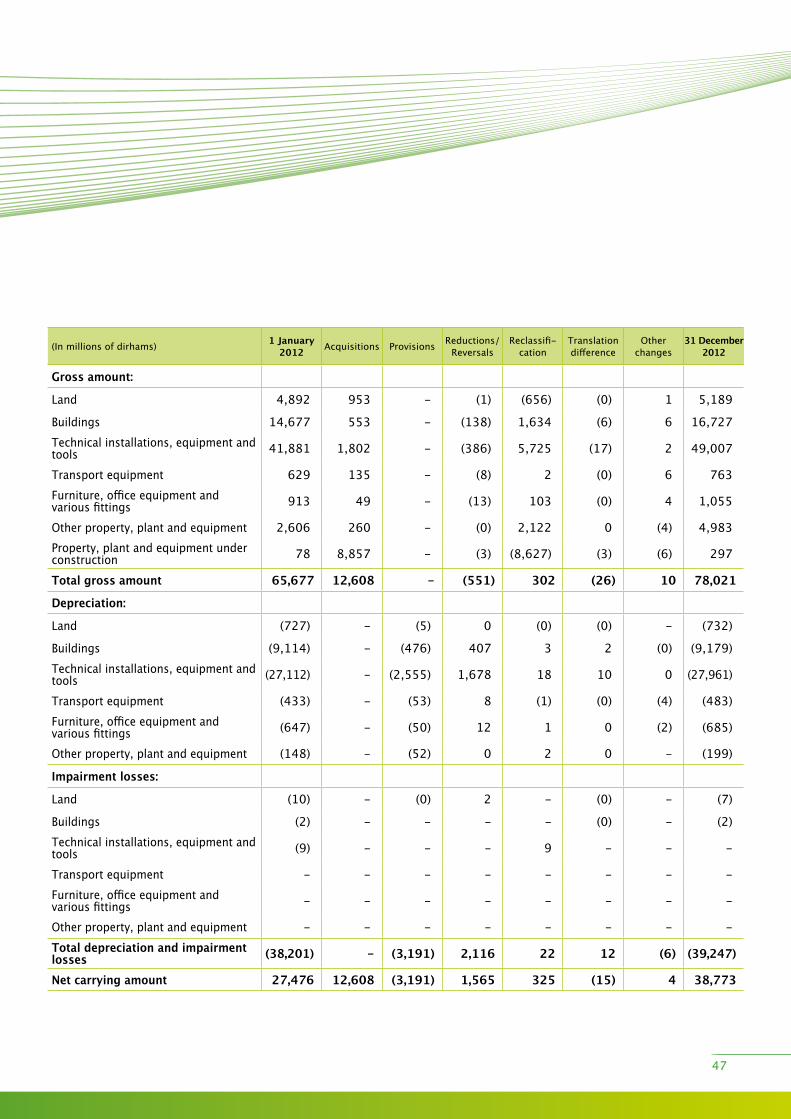
(in millions of dirhams) 1 January 2012 Acquisitions Provisions Reductions/
ReversalsReclassifi-
cationTranslation difference
Other changes
31 December 2012
Gross amount:
land 4,892 953 - (1) (656) (0) 1 5,189
Buildings 14,677 553 - (138) 1,634 (6) 6 16,727Technical installations, equipment and tools 41,881 1,802 - (386) 5,725 (17) 2 49,007
Transport equipment 629 135 - (8) 2 (0) 6 763furniture, office equipment and various fittings 913 49 - (13) 103 (0) 4 1,055
Other property, plant and equipment 2,606 260 - (0) 2,122 0 (4) 4,983Property, plant and equipment under construction 78 8,857 - (3) (8,627) (3) (6) 297
Total gross amount 65,677 12,608 - (551) 302 (26) 10 78,021
Depreciation:
land (727) - (5) 0 (0) (0) - (732)
Buildings (9,114) - (476) 407 3 2 (0) (9,179)Technical installations, equipment and tools (27,112) - (2,555) 1,678 18 10 0 (27,961)
Transport equipment (433) - (53) 8 (1) (0) (4) (483)furniture, office equipment and various fittings (647) - (50) 12 1 0 (2) (685)
Other property, plant and equipment (148) - (52) 0 2 0 - (199)
Impairment losses:
land (10) - (0) 2 - (0) - (7)
Buildings (2) - - - - (0) - (2)Technical installations, equipment and tools (9) - - - 9 - - -
Transport equipment - - - - - - - -furniture, office equipment and various fittings - - - - - - - -
Other property, plant and equipment - - - - - - - -Total depreciation and impairment losses (38,201) - (3,191) 2,116 22 12 (6) (39,247)
Net carrying amount 27,476 12,608 (3,191) 1,565 325 (15) 4 38,773
47

(in millions of dirhams) 1 January 2011 Acquisitions Provisions Reductions/
ReversalsReclassifi-
cationTranslation difference
Other changes
31 December
2011
Gross amount:
land 3,933 184 - (0) 777 (1) (0) 4,892
Buildings 14,336 446 - (309) 237 (30) (3) 14,677Technical installations, equipment and tools 38,982 2,764 - (400) 601 (79) 13 41,881
Transport equipment 535 95 - (13) 12 (0) - 629furniture, office equipment and various fittings 831 62 - (21) 42 (1) (1) 913
Other property, plant and equipment 1,358 73 - (0) 1,179 (5) - 2,606Property, plant and equipment under construction 64 2,628 - (0) (2,613) (1) - 78
Total gross amount 60,040 6,253 - (744) 235 (116) 9 65,677
Depreciation:
land (663) - (64) 0 (0) 0 - (727)
Buildings (9,148) - (327) 309 6 16 28 (9,114)Technical installations, equipment and tools (26,617) - (1,082) 427 30 66 64 (27,112)
Transport equipment (413) - (39) 13 0 0 5 (433)furniture, office equipment and various fittings (616) - (49) 20 (3) 1 1 (647)
Other property, plant and equipment (104) - (47) 0 (0) 3 - (148)
Impairment losses:
land (3) - (6) - - 0 - (10)
Buildings - - (2) - - 0 - (2)Technical installations, equipment and tools - - - - (9) - - (9)
Transport equipment - - - - - - - -furniture, office equipment and various fittings - - - - - - - -
Other property, plant and equipment - - - - - - - -Total depreciation and impairment losses (37,564) - (1,624) 777 33 86 91 (38,201)
Net carrying amount 22,476 6,253 (1,624) 32 268 (30) 100 27,476
The Group has pursued its industrial projects in 2013 representing a total of 20 billion dirhams. These projects relate mainly to Jorf lasfar Hub, Jorf fertilzers i and ii, and the Pipeline.
48

NOTE 18: Intangible assets
(in millions of dirhams) 1 January 2013 Acquisitions Provisions Reductions/
ReversalsReclassifi-
cationTranslation difference
Other changes
31 December
2013
Gross amount:
R&D assets 66 5 - - 2 0 (0) 72Patents, trademarks, rights and similar items 218 13 - - (5) 0 8 234
licences and software 132 51 - - (34) 0 - 149
Other intangible assets 58 (67) - (0) 66 (1) (2) 54
Goodwill 46 - - - - (0) - 46
Total gross amount 521 1 - (0) 28 (0) 6 555
Amortization:
Amortization of R&D assets (22) - (3) - 1 0 - (24)Amortization of patents, trademarks, rights and similar items (158) - (10) - 2 0 (7) (173)
Amortization of licences and software (106) - (1) - - (0) 0 (107)Amortizaiton of other intangible assets (29) - (1) 0 (1) 1 2 (28)
Depreciation of goodwill (2) - - - - 0 - (1)Total amortization and impairment losses (316) - (15) 0 2 1 (5) (333)
Net carrying amount 205 1 (15) (0) 30 0 1 222
49
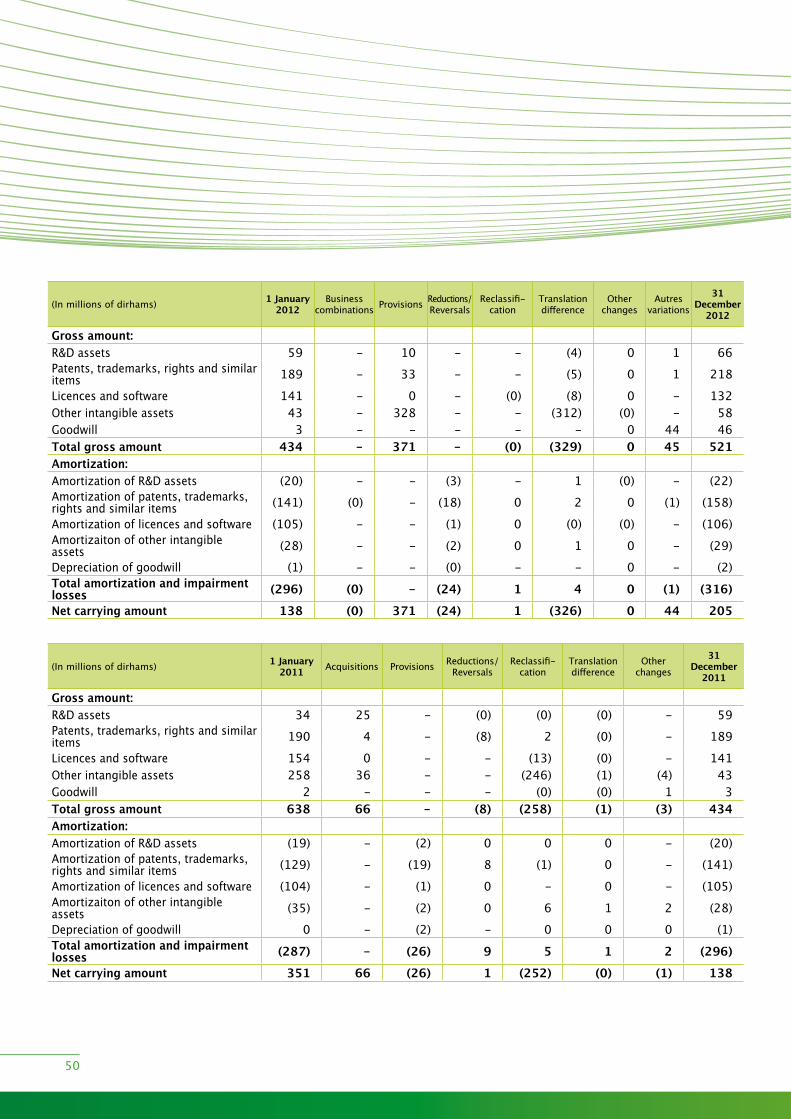
(in millions of dirhams) 1 January 2012
Business combinations Provisions Reductions/
ReversalsReclassifi-
cationTranslation difference
Other changes
Autres variations
31 December
2012
Gross amount:R&D assets 59 - 10 - - (4) 0 1 66Patents, trademarks, rights and similar items 189 - 33 - - (5) 0 1 218
licences and software 141 - 0 - (0) (8) 0 - 132Other intangible assets 43 - 328 - - (312) (0) - 58Goodwill 3 - - - - - 0 44 46Total gross amount 434 - 371 - (0) (329) 0 45 521Amortization:Amortization of R&D assets (20) - - (3) - 1 (0) - (22)Amortization of patents, trademarks, rights and similar items (141) (0) - (18) 0 2 0 (1) (158)
Amortization of licences and software (105) - - (1) 0 (0) (0) - (106)Amortizaiton of other intangible assets (28) - - (2) 0 1 0 - (29)Depreciation of goodwill (1) - - (0) - - 0 - (2)Total amortization and impairment losses (296) (0) - (24) 1 4 0 (1) (316)
Net carrying amount 138 (0) 371 (24) 1 (326) 0 44 205
(in millions of dirhams) 1 January 2011 Acquisitions Provisions Reductions/
ReversalsReclassifi-
cationTranslation difference
Other changes
31 December
2011
Gross amount:R&D assets 34 25 - (0) (0) (0) - 59Patents, trademarks, rights and similar items 190 4 - (8) 2 (0) - 189
licences and software 154 0 - - (13) (0) - 141Other intangible assets 258 36 - - (246) (1) (4) 43Goodwill 2 - - - (0) (0) 1 3Total gross amount 638 66 - (8) (258) (1) (3) 434Amortization:Amortization of R&D assets (19) - (2) 0 0 0 - (20)Amortization of patents, trademarks, rights and similar items (129) - (19) 8 (1) 0 - (141)
Amortization of licences and software (104) - (1) 0 - 0 - (105)Amortizaiton of other intangible assets (35) - (2) 0 6 1 2 (28)Depreciation of goodwill 0 - (2) - 0 0 0 (1)Total amortization and impairment losses (287) - (26) 9 5 1 2 (296)
Net carrying amount 351 66 (26) 1 (252) (0) (1) 138
50

NOTE 19: Net debt
Note 19.1 – Net debt by category
(in millions of dirhams) 31 December 2013
31 December 2012
31 December 2011
Assets measured at fair value through profit or loss 6,039 9,813 11,074Cash equivalents 4,397 5,252 8,251Cash 1,642 4,561 2,823
Assets measured at amortized cost financial assets for cash management 4,631 18,147 16,075Financial assets 10,670 27,960 27,149
liabilities measured at amortized cost financial credits 16,433 11,949 8,950Bonds 2,000 2,000 2,000Other loans and assimilated debts 2,144 2,591 545financial lease debt 1,659 1,211 567Financial debt 22,235 17,751 12,061Bank overdrafts 1,898 2,920 1,417Gross financial debt (cash) 24,132 20,671 13,479Net financial debt (cash) 13,462 (7,290) (13,670)Pension funds and health insurance 8,377 10,829 11,408Net debt (cash) 21,839 3,539 (2,262)
Note 19.2 – Reconciliation of net debt accounts
The reconciliation with balance sheet items is shown below:
(in millions of dirhams) 31 December 2013 31 December 2012 31 December 2011
Current loans and financial debts 5,891 6,888 3,275non-current loans and financial debts 18,242 13,783 10,203Gross financial debt 24,132 20,671 13,479financial assets for cash management (4,631) (18,147) (16,075)Cash and cash equivalents (6,039) (9,813) (11,074)Net financial debt 13,462 (7,290) (13,670)Pension and health insurance funds 8,377 10,829 11,408Net debt 21,839 3,539 (2,262)
51
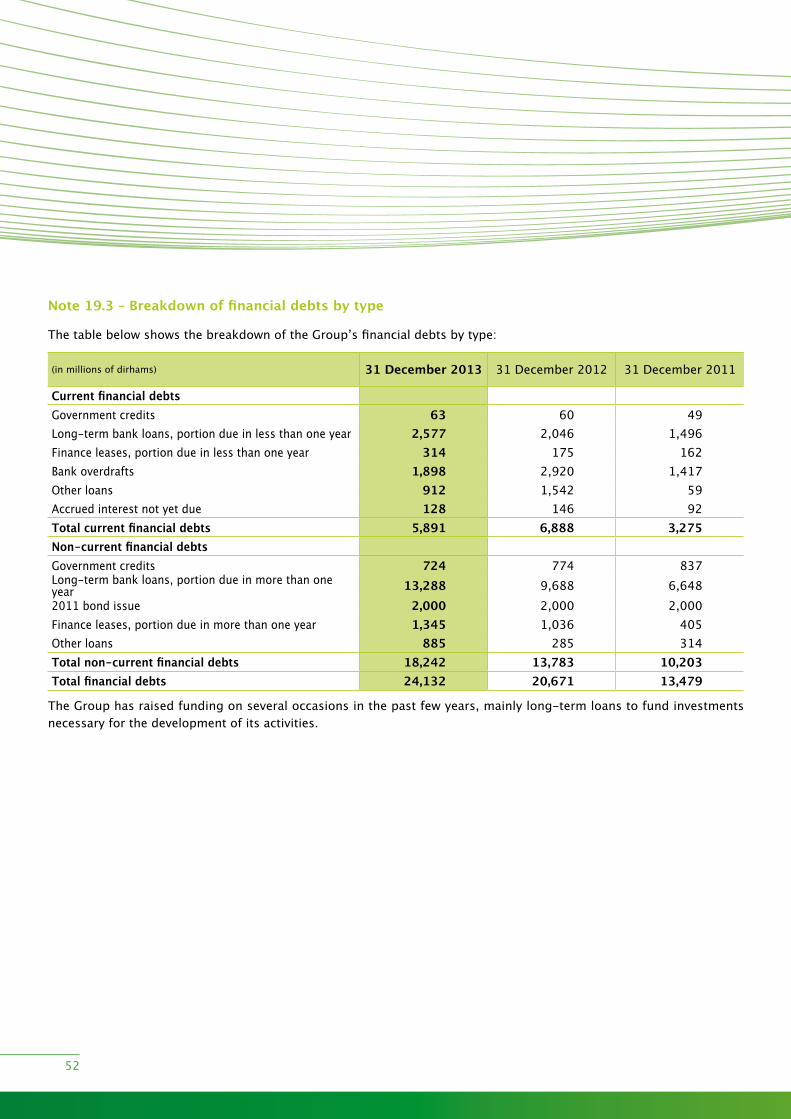
Note 19.3 – Breakdown of financial debts by type
The table below shows the breakdown of the Group’s financial debts by type:
(in millions of dirhams) 31 December 2013 31 December 2012 31 December 2011
Current financial debtsGovernment credits 63 60 49long-term bank loans, portion due in less than one year 2,577 2,046 1,496finance leases, portion due in less than one year 314 175 162Bank overdrafts 1,898 2,920 1,417Other loans 912 1,542 59Accrued interest not yet due 128 146 92Total current financial debts 5,891 6,888 3,275Non-current financial debtsGovernment credits 724 774 837long-term bank loans, portion due in more than one year 13,288 9,688 6,6482011 bond issue 2,000 2,000 2,000finance leases, portion due in more than one year 1,345 1,036 405Other loans 885 285 314Total non-current financial debts 18,242 13,783 10,203Total financial debts 24,132 20,671 13,479
The Group has raised funding on several occasions in the past few years, mainly long-term loans to fund investments necessary for the development of its activities.
52
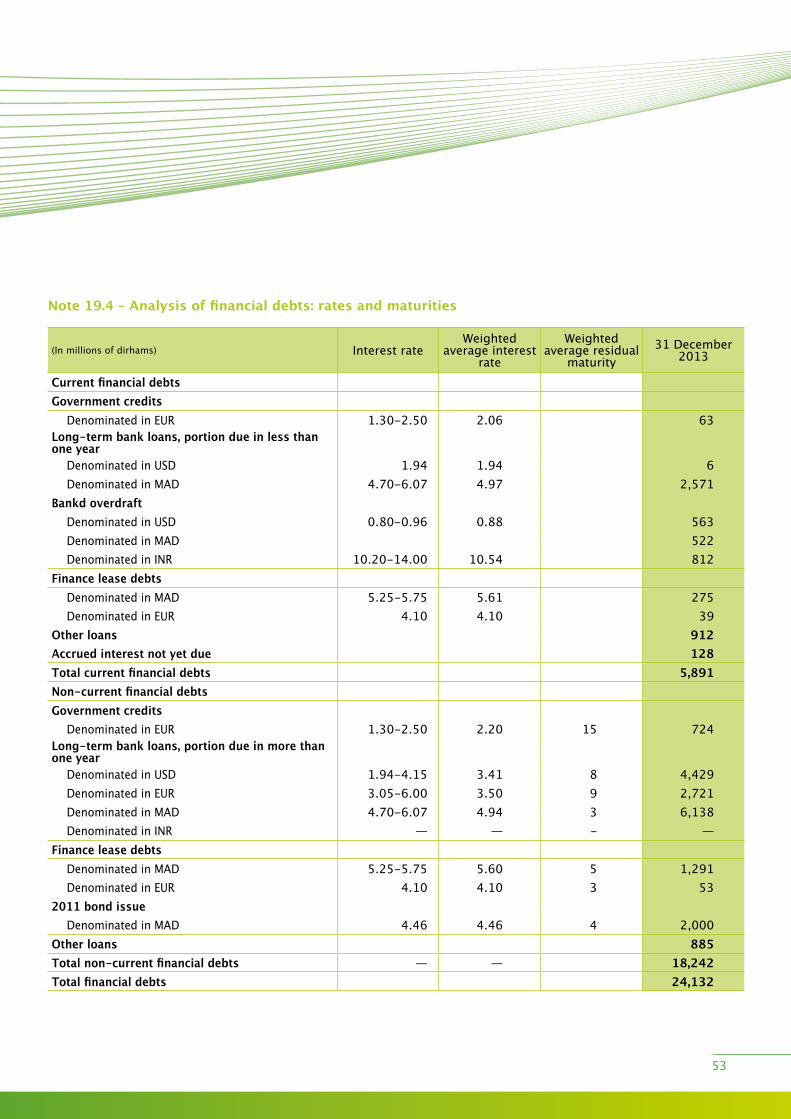
Note 19.4 – Analysis of financial debts: rates and maturities
(in millions of dirhams) interest rateweighted
average interest rate
weighted average residual
maturity31 December
2013
Current financial debtsGovernment credits
Denominated in EuR 1.30-2.50 2.06 63Long-term bank loans, portion due in less than one year
Denominated in uSD 1.94 1.94 6Denominated in MAD 4.70-6.07 4.97 2,571
Bankd overdraftDenominated in uSD 0.80-0.96 0.88 563Denominated in MAD 522Denominated in inR 10.20-14.00 10.54 812
Finance lease debtsDenominated in MAD 5.25-5.75 5.61 275Denominated in EuR 4.10 4.10 39
Other loans 912Accrued interest not yet due 128Total current financial debts 5,891Non-current financial debtsGovernment credits
Denominated in EuR 1.30-2.50 2.20 15 724Long-term bank loans, portion due in more than one year
Denominated in uSD 1.94-4.15 3.41 8 4,429Denominated in EuR 3.05-6.00 3.50 9 2,721Denominated in MAD 4.70-6.07 4.94 3 6,138Denominated in inR — — - —
Finance lease debtsDenominated in MAD 5.25-5.75 5.60 5 1,291Denominated in EuR 4.10 4.10 3 53
2011 bond issueDenominated in MAD 4.46 4.46 4 2,000
Other loans 885Total non-current financial debts — — 18,242Total financial debts 24,132
53
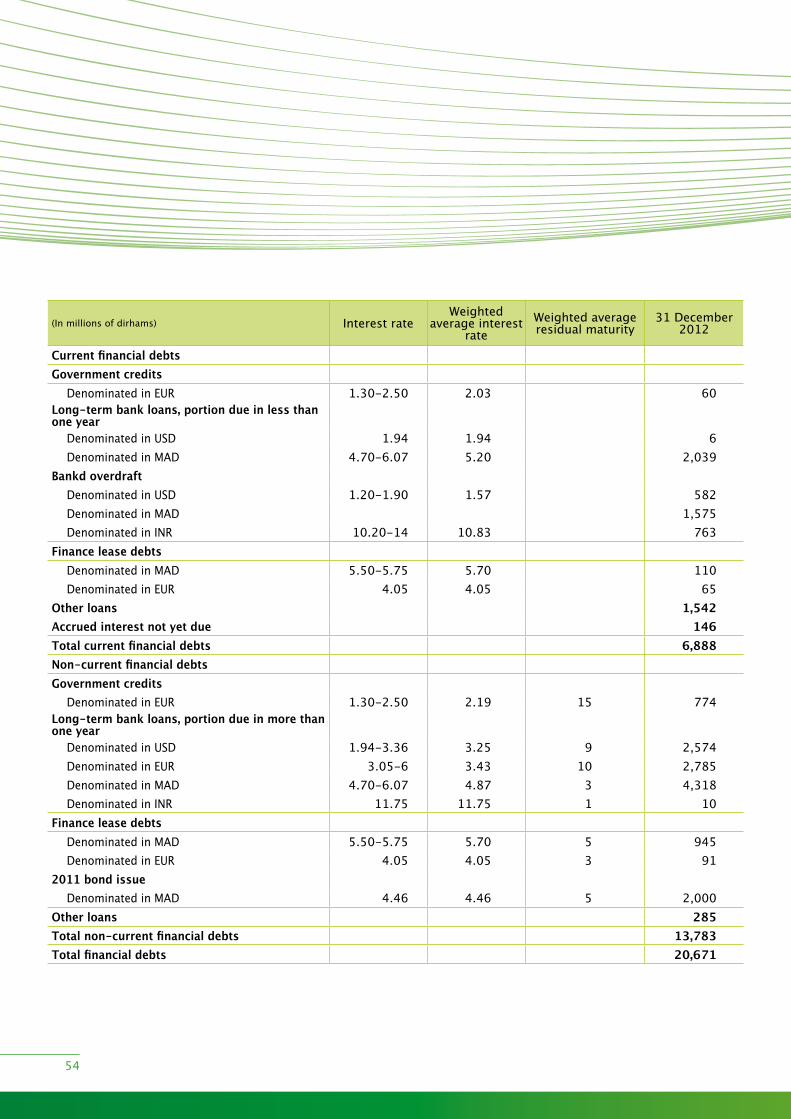
(in millions of dirhams) interest rateweighted
average interest rate
weighted average residual maturity
31 December 2012
Current financial debtsGovernment credits
Denominated in EuR 1.30-2.50 2.03 60Long-term bank loans, portion due in less than one year
Denominated in uSD 1.94 1.94 6Denominated in MAD 4.70-6.07 5.20 2,039
Bankd overdraftDenominated in uSD 1.20-1.90 1.57 582Denominated in MAD 1,575Denominated in inR 10.20-14 10.83 763
Finance lease debtsDenominated in MAD 5.50-5.75 5.70 110Denominated in EuR 4.05 4.05 65
Other loans 1,542Accrued interest not yet due 146Total current financial debts 6,888Non-current financial debtsGovernment credits
Denominated in EuR 1.30-2.50 2.19 15 774Long-term bank loans, portion due in more than one year
Denominated in uSD 1.94-3.36 3.25 9 2,574Denominated in EuR 3.05-6 3.43 10 2,785Denominated in MAD 4.70-6.07 4.87 3 4,318Denominated in inR 11.75 11.75 1 10
Finance lease debtsDenominated in MAD 5.50-5.75 5.70 5 945Denominated in EuR 4.05 4.05 3 91
2011 bond issueDenominated in MAD 4.46 4.46 5 2,000
Other loans 285Total non-current financial debts 13,783Total financial debts 20,671
54

(in millions of dirhams) interest rateweighted
average interest rate
weighted average residual
maturity31 December
2011
Current financial debtsGovernment credits
Denominated in EuR 1.30-2.50 1.92% 49Long-term bank loans, portion due in less than one year
Denominated in uSD 1.94 1.94 6Denominated in MAD 5.07-6.07 5.56 1,490
Bankd overdraftDenominated in uSD 2.43-3 2.63 247Denominated in EuR 3.11 3.11 577Denominated in MAD 285Denominated in inR 10.2-14.25 10.54 308
Finance lease debtsDenominated in MAD 5.65-5.75 5.86 101Denominated in EuR 4.00 4.00 61
Other loans 59Accrued interest not yet due 92Total current financial debts 3,275Non-current financial debtsGovernment credits
Denominated in EuR 1.30-2.50 2.18 16 837Long-term bank loans, portion due in more than one year
Denominated in uSD 1.94 1.94 4 24Denominated in EuR 3.56-6.17 3.99 11 1,074Denominated in MAD 4.72-6.07 5.51 4 5,500Denominated in inR 9.00 9.00 2 50
Finance lease debtsDenominated in MAD 5.65-5.75 5.75 5 269Denominated in EuR 4.00 4.00 4 136
2011 bond issueDenominated in MAD 4.46 4.46 6 2,000
Other loans 314Total non-current financial debts 10,203Total financial debts 13,479
55
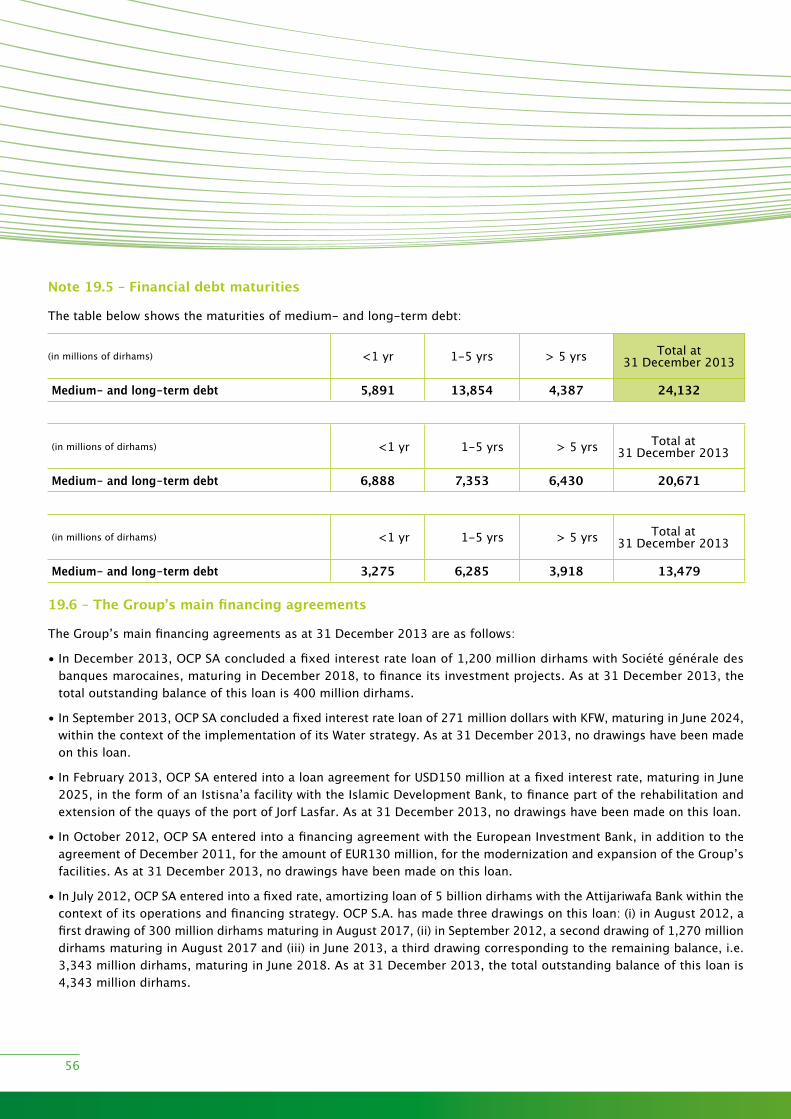
Note 19.5 – Financial debt maturities
The table below shows the maturities of medium- and long-term debt:
(in millions of dirhams) <1 yr 1-5 yrs > 5 yrs Total at 31 December 2013
Medium- and long-term debt 5,891 13,854 4,387 24,132
(in millions of dirhams) <1 yr 1-5 yrs > 5 yrs Total at 31 December 2013
Medium- and long-term debt 6,888 7,353 6,430 20,671
(in millions of dirhams) <1 yr 1-5 yrs > 5 yrs Total at 31 December 2013
Medium- and long-term debt 3,275 6,285 3,918 13,479
19.6 – The Group’s main financing agreements
The Group’s main financing agreements as at 31 December 2013 are as follows:
• in December 2013, OCP SA concluded a fixed interest rate loan of 1,200 million dirhams with Société générale des banques marocaines, maturing in December 2018, to finance its investment projects. As at 31 December 2013, the total outstanding balance of this loan is 400 million dirhams.
• in September 2013, OCP SA concluded a fixed interest rate loan of 271 million dollars with Kfw, maturing in June 2024, within the context of the implementation of its water strategy. As at 31 December 2013, no drawings have been made on this loan.
• in february 2013, OCP SA entered into a loan agreement for uSD150 million at a fixed interest rate, maturing in June 2025, in the form of an istisna’a facility with the islamic Development Bank, to finance part of the rehabilitation and extension of the quays of the port of Jorf lasfar. As at 31 December 2013, no drawings have been made on this loan.
• in October 2012, OCP SA entered into a financing agreement with the European investment Bank, in addition to the agreement of December 2011, for the amount of EuR130 million, for the modernization and expansion of the Group’s facilities. As at 31 December 2013, no drawings have been made on this loan.
• in July 2012, OCP SA entered into a fixed rate, amortizing loan of 5 billion dirhams with the Attijariwafa Bank within the context of its operations and financing strategy. OCP S.A. has made three drawings on this loan: (i) in August 2012, a first drawing of 300 million dirhams maturing in August 2017, (ii) in September 2012, a second drawing of 1,270 million dirhams maturing in August 2017 and (iii) in June 2013, a third drawing corresponding to the remaining balance, i.e. 3,343 million dirhams, maturing in June 2018. As at 31 December 2013, the total outstanding balance of this loan is 4,343 million dirhams.
56
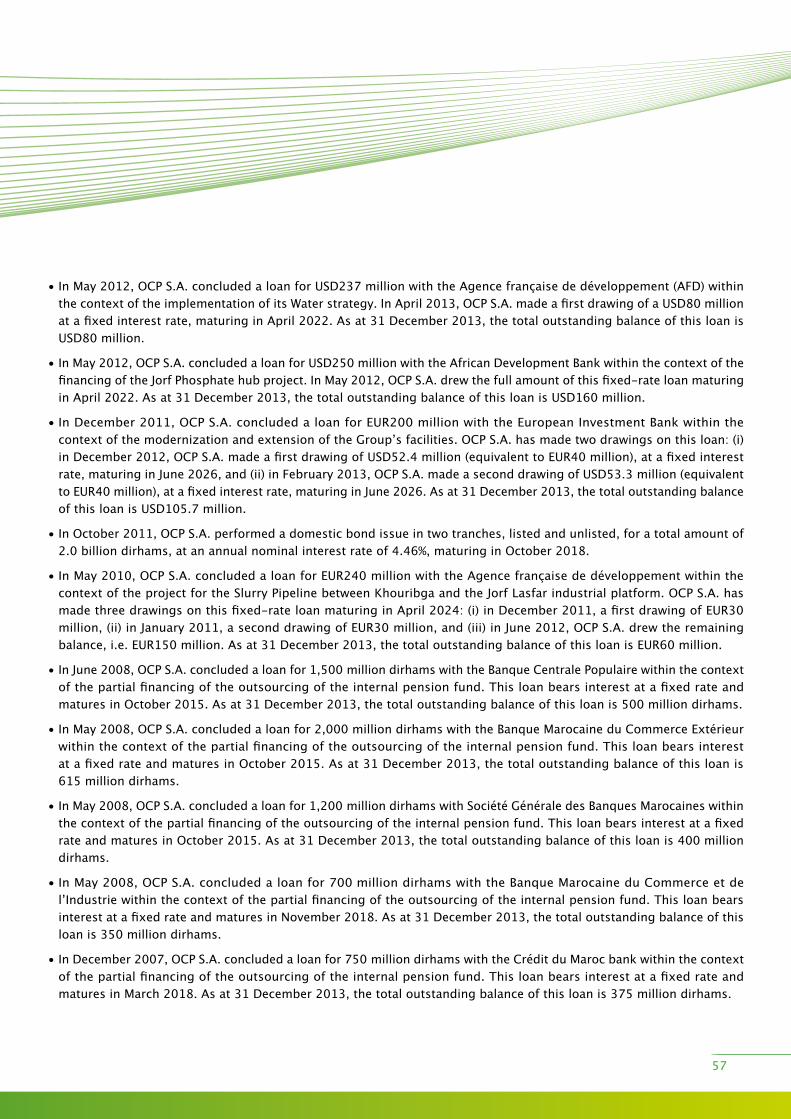
• in May 2012, OCP S.A. concluded a loan for uSD237 million with the Agence française de développement (AfD) within the context of the implementation of its water strategy. in April 2013, OCP S.A. made a first drawing of a uSD80 million at a fixed interest rate, maturing in April 2022. As at 31 December 2013, the total outstanding balance of this loan is uSD80 million.
• in May 2012, OCP S.A. concluded a loan for uSD250 million with the African Development Bank within the context of the financing of the Jorf Phosphate hub project. in May 2012, OCP S.A. drew the full amount of this fixed-rate loan maturing in April 2022. As at 31 December 2013, the total outstanding balance of this loan is uSD160 million.
• in December 2011, OCP S.A. concluded a loan for EuR200 million with the European investment Bank within the context of the modernization and extension of the Group’s facilities. OCP S.A. has made two drawings on this loan: (i) in December 2012, OCP S.A. made a first drawing of uSD52.4 million (equivalent to EuR40 million), at a fixed interest rate, maturing in June 2026, and (ii) in february 2013, OCP S.A. made a second drawing of uSD53.3 million (equivalent to EuR40 million), at a fixed interest rate, maturing in June 2026. As at 31 December 2013, the total outstanding balance of this loan is uSD105.7 million.
• in October 2011, OCP S.A. performed a domestic bond issue in two tranches, listed and unlisted, for a total amount of 2.0 billion dirhams, at an annual nominal interest rate of 4.46%, maturing in October 2018.
• in May 2010, OCP S.A. concluded a loan for EuR240 million with the Agence française de développement within the context of the project for the Slurry Pipeline between Khouribga and the Jorf lasfar industrial platform. OCP S.A. has made three drawings on this fixed-rate loan maturing in April 2024: (i) in December 2011, a first drawing of EuR30 million, (ii) in January 2011, a second drawing of EuR30 million, and (iii) in June 2012, OCP S.A. drew the remaining balance, i.e. EuR150 million. As at 31 December 2013, the total outstanding balance of this loan is EuR60 million.
• in June 2008, OCP S.A. concluded a loan for 1,500 million dirhams with the Banque Centrale Populaire within the context of the partial financing of the outsourcing of the internal pension fund. This loan bears interest at a fixed rate and matures in October 2015. As at 31 December 2013, the total outstanding balance of this loan is 500 million dirhams.
• in May 2008, OCP S.A. concluded a loan for 2,000 million dirhams with the Banque Marocaine du Commerce Extérieur within the context of the partial financing of the outsourcing of the internal pension fund. This loan bears interest at a fixed rate and matures in October 2015. As at 31 December 2013, the total outstanding balance of this loan is 615 million dirhams.
• in May 2008, OCP S.A. concluded a loan for 1,200 million dirhams with Société Générale des Banques Marocaines within the context of the partial financing of the outsourcing of the internal pension fund. This loan bears interest at a fixed rate and matures in October 2015. As at 31 December 2013, the total outstanding balance of this loan is 400 million dirhams.
• in May 2008, OCP S.A. concluded a loan for 700 million dirhams with the Banque Marocaine du Commerce et de l’industrie within the context of the partial financing of the outsourcing of the internal pension fund. This loan bears interest at a fixed rate and matures in november 2018. As at 31 December 2013, the total outstanding balance of this loan is 350 million dirhams.
• in December 2007, OCP S.A. concluded a loan for 750 million dirhams with the Crédit du Maroc bank within the context of the partial financing of the outsourcing of the internal pension fund. This loan bears interest at a fixed rate and matures in March 2018. As at 31 December 2013, the total outstanding balance of this loan is 375 million dirhams.
57
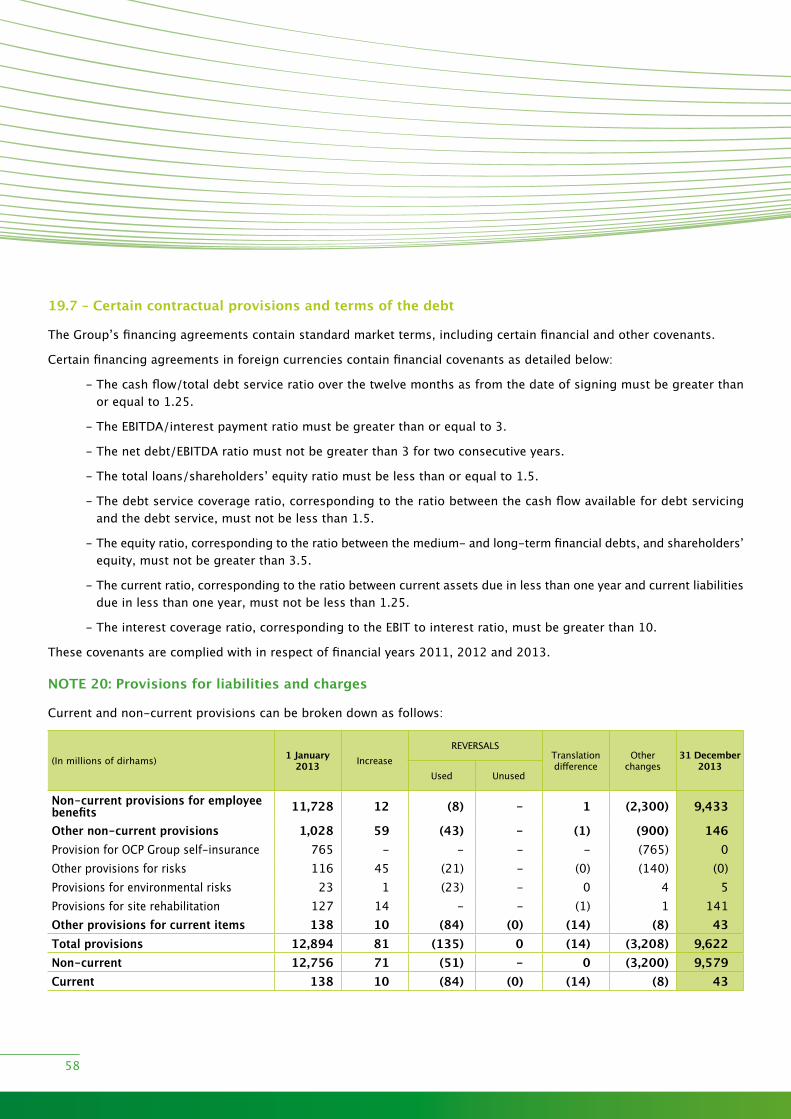
19.7 – Certain contractual provisions and terms of the debt
The Group’s financing agreements contain standard market terms, including certain financial and other covenants.
Certain financing agreements in foreign currencies contain financial covenants as detailed below:
- The cash flow/total debt service ratio over the twelve months as from the date of signing must be greater than or equal to 1.25.
- The EBiTDA/interest payment ratio must be greater than or equal to 3.
- The net debt/EBiTDA ratio must not be greater than 3 for two consecutive years.
- The total loans/shareholders’ equity ratio must be less than or equal to 1.5.
- The debt service coverage ratio, corresponding to the ratio between the cash flow available for debt servicing and the debt service, must not be less than 1.5.
- The equity ratio, corresponding to the ratio between the medium- and long-term financial debts, and shareholders’ equity, must not be greater than 3.5.
- The current ratio, corresponding to the ratio between current assets due in less than one year and current liabilities due in less than one year, must not be less than 1.25.
- The interest coverage ratio, corresponding to the EBiT to interest ratio, must be greater than 10.
These covenants are complied with in respect of financial years 2011, 2012 and 2013.
NOTE 20: Provisions for liabilities and charges
Current and non-current provisions can be broken down as follows:
(in millions of dirhams) 1 January 2013 increase
REvERSAlSTranslationdifference
Otherchanges
31 December 2013
used unused
Non-current provisions for employee benefits 11,728 12 (8) - 1 (2,300) 9,433
Other non-current provisions 1,028 59 (43) - (1) (900) 146Provision for OCP Group self-insurance 765 - - - - (765) 0Other provisions for risks 116 45 (21) - (0) (140) (0)Provisions for environmental risks 23 1 (23) - 0 4 5Provisions for site rehabilitation 127 14 - - (1) 1 141Other provisions for current items 138 10 (84) (0) (14) (8) 43Total provisions 12,894 81 (135) 0 (14) (3,208) 9,622Non-current 12,756 71 (51) - 0 (3,200) 9,579Current 138 10 (84) (0) (14) (8) 43
58
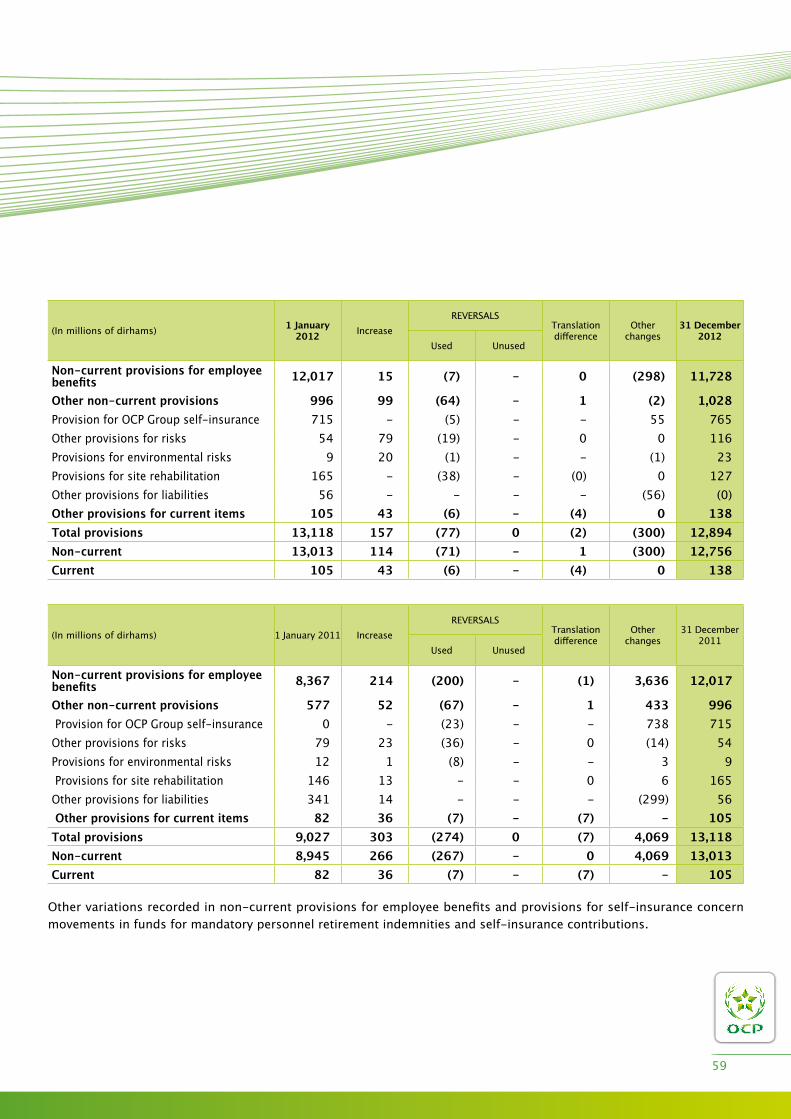
(in millions of dirhams) 1 January 2012 increase
REvERSAlSTranslationdifference
Otherchanges
31 December 2012
used unused
Non-current provisions for employee benefits 12,017 15 (7) - 0 (298) 11,728
Other non-current provisions 996 99 (64) - 1 (2) 1,028Provision for OCP Group self-insurance 715 - (5) - - 55 765Other provisions for risks 54 79 (19) - 0 0 116Provisions for environmental risks 9 20 (1) - - (1) 23Provisions for site rehabilitation 165 - (38) - (0) 0 127Other provisions for liabilities 56 - - - - (56) (0)Other provisions for current items 105 43 (6) - (4) 0 138Total provisions 13,118 157 (77) 0 (2) (300) 12,894Non-current 13,013 114 (71) - 1 (300) 12,756Current 105 43 (6) - (4) 0 138
(in millions of dirhams) 1 January 2011 increaseREvERSAlS
Translationdifference
Otherchanges
31 December 2011
used unused
Non-current provisions for employee benefits 8,367 214 (200) - (1) 3,636 12,017
Other non-current provisions 577 52 (67) - 1 433 996 Provision for OCP Group self-insurance 0 - (23) - - 738 715Other provisions for risks 79 23 (36) - 0 (14) 54Provisions for environmental risks 12 1 (8) - - 3 9 Provisions for site rehabilitation 146 13 - - 0 6 165Other provisions for liabilities 341 14 - - - (299) 56 Other provisions for current items 82 36 (7) - (7) - 105Total provisions 9,027 303 (274) 0 (7) 4,069 13,118Non-current 8,945 266 (267) - 0 4,069 13,013Current 82 36 (7) - (7) - 105
Other variations recorded in non-current provisions for employee benefits and provisions for self-insurance concern movements in funds for mandatory personnel retirement indemnities and self-insurance contributions.
59

NOTE 21: Employee benefits
Groupe OCP has three types of retirement schemes:
• Post-employment defined-contribution schemes, for which Groupe OCP’s obligation is limited to the payment of a contribution which does not obligate the employer in any way as to the level of payments made by the Collective Retirement Benefit Scheme. The contributions are recognized in charges in the period during which the employees have rendered the corresponding services.
• Post-employment defined-benefit plans which include all post-employment benefits for which Groupe OCP is committed to provide a certain level of benefits. This includes in particular the supplementary pension, retirement indemnities and post-employment medical cover for OCP staff.
• Other long-term employee benefits, other than post-employment benefits and termination benefits, which are not due wholly within twelve months after the end of the year during which the employees rendered the relevant services. This particularly concerns insurance benefits in relation to death insurance, disability and work-related accidents. Obligations for other long-term benefits are measured using an actuarial method similar to that applied to post-employment defined benefits.
As from 1 January 2013 Groupe OCP has applied the provisions of iAS 19 (Revised) “Employee benefits” which introduces several changes in the recognition of post-employment benefits, in particular:
- The recognition in the balance sheet of all post-employment benefits granted to the Group’s employees. The corridor option and the possibility of amortizing past service costs in profit or loss over the average period of vesting of the rights by the employees are cancelled;
- The recognition in profit or loss of the impacts of plan changes;
- The recognition of the impacts of remeasurement in other comprehensive income: actuarial gains and losses gains on the commitment, overperformance (underperformance) of the plan assets, i.e. the difference between the effective yield of the plan assets and their remuneration calculated on the basis of the discount rate of the actuarial liability, and variation of the effect of the limit on the asset. These impacts are presented in the consolidated statement of comprehensive income.
not having any coverage assets, the Group is not concerned by the calculation of interest income on pension plan assets, which is henceforth calculated based on the same rate as the discount rate used to determine the defined benefit obligation.
in the accounts presented, the impact of these standards is as follows:
• immediate recognition of actuarial gains and losses through equity as at 1 January 2011 in the amount of -2,450 million dirhams.
• As a result of the new provisions relating to mortality, the mortality tables must integrate the expected increases in life expectancy, hence the use of a generational mortality table.
- Pension
The Group continues to measure its obligation using mortality table 73-77, as this table is the most relevant to the OCP personnel concerned by the company pension scheme.
- Sickness
60

The CiMR generational table is used for the measurement of the obligations to be recognized as at 31 December 2013. There are plans to outsource the compulsory health insurance (AMO) in 2020.
As iAS 19 (Revised) “Employee benefits” is applied retrospectively, the impacts of this change in accounting method on the comparative 2012 period and on the balance sheets as at 31 December 2012 and 31 December 2011 are presented below.
Key figures adjusted
(in millions of dirhams) fy 2012 impact of iAS 19 Revised
fy 2012 adjusted
Exercice 2011
impact of iAS 19 Revised
fy 2011 adjusted
Revenue 58,162 58,162 56,415 56,415Operating profit 17,671 (749) 16,921 19,457 3,336 22,793Cost of net financial debt 363 363 260 260Net profit (loss) 14,394 (753) 13,641 16,594 2,673 19,267Consolidated equity 51,808 - 51,808 43,474 - 43,474net financial debt (7,290) (7,290) (13,670) (13,670)Net debt 3,539 3,539 (2,262) (2,262)Net operating investments 12,813 12,813 6,060 6,060Basic earnings per share (in dirhams) 173.69 (9.1) 164.60 200.23 32.25 232.48Dividend per share (in dirhams) 56.98 56.98 42.74 42.74
Consolidated profit and loss account adjusted
(in millions of dirhams) fy 2012 impact of iAS 19 Revised
fy 2012 adjusted fy 2011 impact of iAS
19 Revisedfy 2011 adjusted
Revenue 58,162 58,162 56,415 - 56,415Production held as inventory 324 324 1,881 - 1,881Purchases consumed (22,899) (22,899) (20,800) 1 (20,799)External expenses (8,284) (8,284) (5,689) - (5,689)Personnel expenses (8,601) (374) (8,976) (8,046) 248 (7,798)Taxes (233) (233) (226) - (226)Amortization, depreciation and operating provisions (1,412) (1,412) (1,595) - (1,595)
Other operating income and expenses 987 987 679 - 679Current operating profit (loss) 18,044 (374) 17,670 22,619 248 22,867Other non-current operating income and expenses (373) (375) (748) (3,162) 3,088 (74)
Operating profit (loss) 17,670 (749) 16,921 19,457 3,336 22,793Cost of gross financial debt (692) (692) (622) - (622)financial income from cash investments 1,055 1,055 882 - 882Cost of net financial debt 363 363 260 - 260Other financial income and expenses 117 117 55 - 55Financial profit (loss) 479 479 316 (1) 315Profit (loss) before tax 18,149 (749) 17,400 19,772 3,336 23,107Corporate income tax (3,756) (2) (3,759) (3,176) (665) (3,842)Net profit (loss) 14,394 (751) 13,641 16,594 2,673 19,267Earnings per share in dirhams 173.69 164.60 200.23 232.48
61

Consolidated statement of financial position adjusted
(in millions of dirhams) 31 Dec 2012
impact of iAS 19 Revised
31 Dec 2012 adjusted
31 Dec 2011
impact of iAS 19 Revised
31 Dec 2011 adjusted
ASSETSCurrent assetsCash and cash equivalents 9,813 9,813 11,074 11,074Cash financial assets 18,147 18,147 16,075 16,075inventories 9,189 9,189 8,731 8,731Trade receivables 8,106 8,106 7,682 7,682Current tax receivables 1,089 1,089 299 299Other current assets 11,777 11,777 7,325 7,325Total current assets 58,122 58,122 51,186 51,186Non-current assetsnon-current financial assets 2,805 2,805 2,234 2,233Deferred tax assets 308 308 1,051 1,050Property, plant and equipment 38,773 38,773 27,476 27,476intangible assets 205 205 138 - 138Total non-current assets 42,090 42,091 30,898 - 30,897Total assets 100,212 100,212 82,083 - 82,083
(in millions of dirhams) 31 Dec 2012
impact of iAS 19 Revised
31 Dec 2012 adjusted
31 Dec 2011
impact of iAS 19 Revised
31 Dec 2011 adjusted
LIABILITIESCurrent liabilitiesCurrent loans and financial debts 6,888 6,888 3,275 3,275Current provisions 138 138 105 105Trade payables 7,691 7,691 5,455 5,455Current tax payables 37 37 1,889 1,889Other current liabilities 6,982 6,982 4,319 4,319Total current liabilities 21,735 21,735 15,043 15,043Non-current liabilitiesnon-current loans and financial debts 13,783 13,783 10,203 10,203non-current provisions for employee benefits 11,724 11,728 12,017 12,017
Other non-current provisions 1,032 1,028 996 996Deferred tax liabilities 109 - 109 329 - 330Other non-current liabilities 20 20 20 20Total non-current liabilities 26,669 - 26,669 23,566 - 23,566issued capital 8,288 8,288 8,288 8,288Paid-in capital 18,698 18,698 4,513 4,513Consolidated reserves 10,429 753 11,182 14,080 (2,672) 11,407net profit (loss) 14,394 (753) 13,641 16,594 2,673 19,267Total equity 51,808 - 51,808 43,474 - 43,474Total liabilities 100,212 100,212 82,083 82,083
62
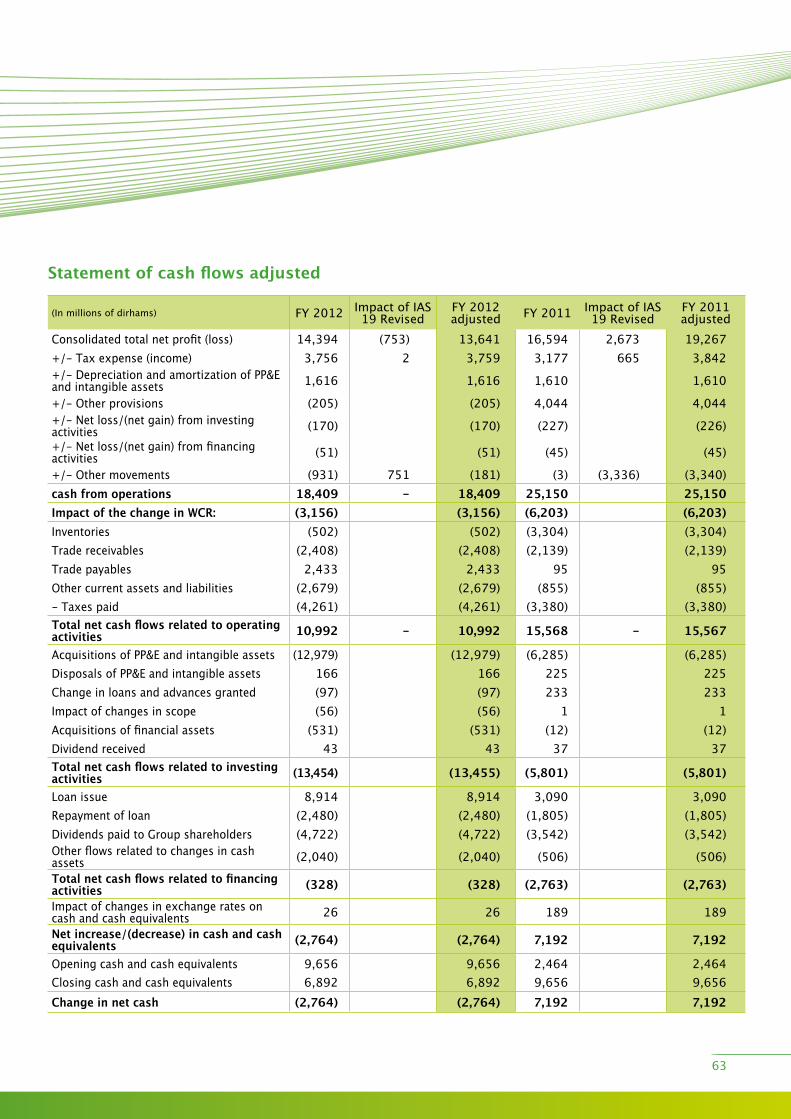
Statement of cash flows adjusted
(in millions of dirhams) fy 2012 impact of iAS 19 Revised
fy 2012 adjusted fy 2011 impact of iAS
19 Revisedfy 2011 adjusted
Consolidated total net profit (loss) 14,394 (753) 13,641 16,594 2,673 19,267+/- Tax expense (income) 3,756 2 3,759 3,177 665 3,842+/- Depreciation and amortization of PP&E and intangible assets 1,616 1,616 1,610 1,610
+/- Other provisions (205) (205) 4,044 4,044+/- net loss/(net gain) from investing activities (170) (170) (227) (226)+/- net loss/(net gain) from financing activities (51) (51) (45) (45)
+/- Other movements (931) 751 (181) (3) (3,336) (3,340)cash from operations 18,409 - 18,409 25,150 25,150Impact of the change in WCR: (3,156) (3,156) (6,203) (6,203)inventories (502) (502) (3,304) (3,304)Trade receivables (2,408) (2,408) (2,139) (2,139)Trade payables 2,433 2,433 95 95Other current assets and liabilities (2,679) (2,679) (855) (855)- Taxes paid (4,261) (4,261) (3,380) (3,380)Total net cash flows related to operating activities 10,992 - 10,992 15,568 - 15,567
Acquisitions of PP&E and intangible assets (12,979) (12,979) (6,285) (6,285)Disposals of PP&E and intangible assets 166 166 225 225Change in loans and advances granted (97) (97) 233 233impact of changes in scope (56) (56) 1 1Acquisitions of financial assets (531) (531) (12) (12)Dividend received 43 43 37 37Total net cash flows related to investing activities (13,454) (13,455) (5,801) (5,801)
loan issue 8,914 8,914 3,090 3,090Repayment of loan (2,480) (2,480) (1,805) (1,805)Dividends paid to Group shareholders (4,722) (4,722) (3,542) (3,542)Other flows related to changes in cash assets (2,040) (2,040) (506) (506)
Total net cash flows related to financing activities (328) (328) (2,763) (2,763)
impact of changes in exchange rates on cash and cash equivalents 26 26 189 189
Net increase/(decrease) in cash and cash equivalents (2,764) (2,764) 7,192 7,192
Opening cash and cash equivalents 9,656 9,656 2,464 2,464Closing cash and cash equivalents 6,892 6,892 9,656 9,656Change in net cash (2,764) (2,764) 7,192 7,192
63
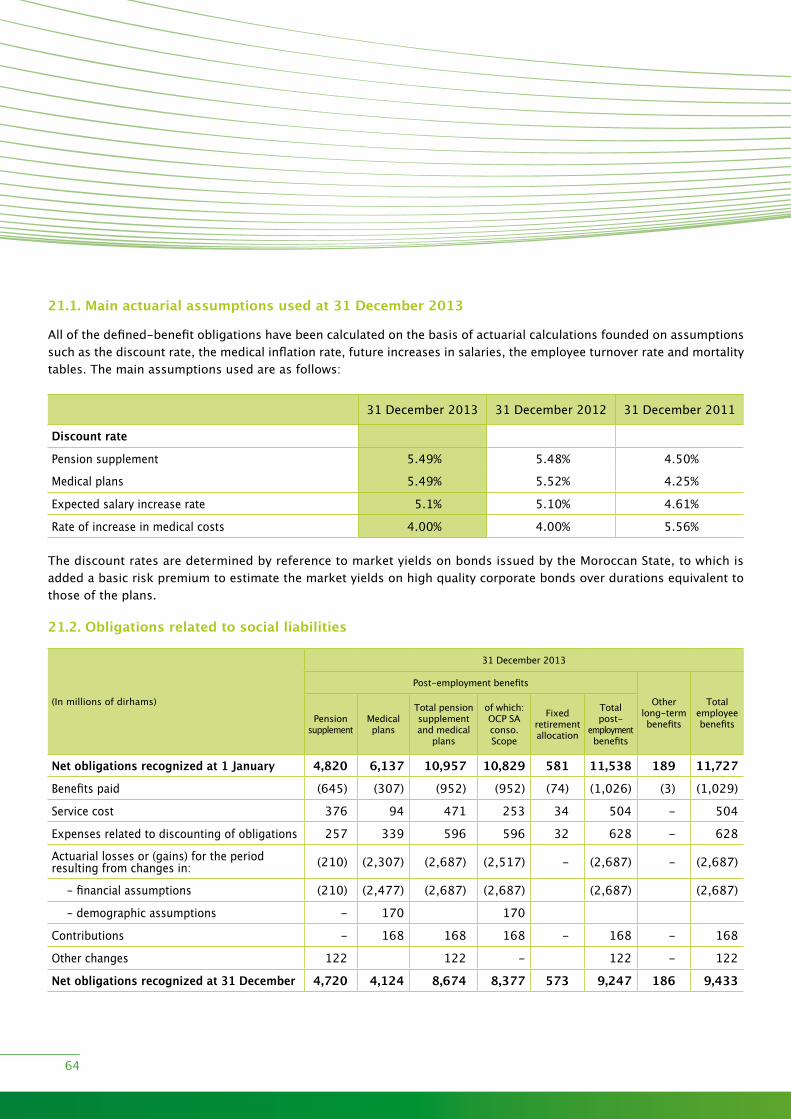
21.1. Main actuarial assumptions used at 31 December 2013
All of the defined-benefit obligations have been calculated on the basis of actuarial calculations founded on assumptions such as the discount rate, the medical inflation rate, future increases in salaries, the employee turnover rate and mortality tables. The main assumptions used are as follows:
31 December 2013 31 December 2012 31 December 2011
Discount rate
Pension supplement 5.49% 5.48% 4.50%
Medical plans 5.49% 5.52% 4.25%
Expected salary increase rate 5.1% 5.10% 4.61%
Rate of increase in medical costs 4.00% 4.00% 5.56%
The discount rates are determined by reference to market yields on bonds issued by the Moroccan State, to which is added a basic risk premium to estimate the market yields on high quality corporate bonds over durations equivalent to those of the plans.
21.2. Obligations related to social liabilities
(in millions of dirhams)
31 December 2013
Post-employment benefits
Other long-term benefits
Total employee benefitsPension
supplementMedical plans
Total pension supplement and medical
plans
of which: OCP SA conso. Scope
fixed retirement allocation
Total post-
employment benefits
Net obligations recognized at 1 January 4,820 6,137 10,957 10,829 581 11,538 189 11,727
Benefits paid (645) (307) (952) (952) (74) (1,026) (3) (1,029)
Service cost 376 94 471 253 34 504 - 504
Expenses related to discounting of obligations 257 339 596 596 32 628 - 628
Actuarial losses or (gains) for the period resulting from changes in: (210) (2,307) (2,687) (2,517) - (2,687) - (2,687)
- financial assumptions (210) (2,477) (2,687) (2,687) (2,687) (2,687)
- demographic assumptions - 170 170
Contributions - 168 168 168 - 168 - 168
Other changes 122 122 - 122 - 122
Net obligations recognized at 31 December 4,720 4,124 8,674 8,377 573 9,247 186 9,433
64
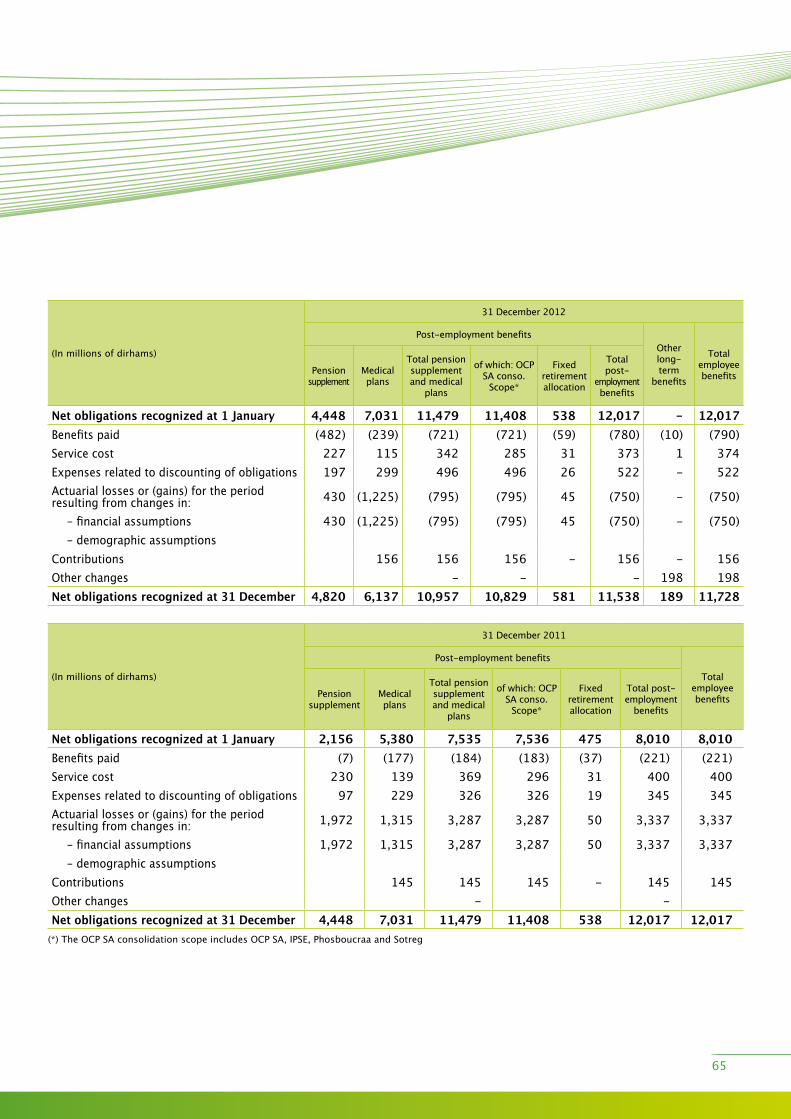
(in millions of dirhams)
31 December 2012
Post-employment benefitsOther long-term
benefits
Total employee benefitsPension
supplementMedical plans
Total pension supplement and medical
plans
of which: OCP SA conso.
Scope*
fixed retirement allocation
Total post-
employment benefits
Net obligations recognized at 1 January 4,448 7,031 11,479 11,408 538 12,017 - 12,017Benefits paid (482) (239) (721) (721) (59) (780) (10) (790)Service cost 227 115 342 285 31 373 1 374Expenses related to discounting of obligations 197 299 496 496 26 522 - 522Actuarial losses or (gains) for the period resulting from changes in: 430 (1,225) (795) (795) 45 (750) - (750)
- financial assumptions 430 (1,225) (795) (795) 45 (750) - (750)- demographic assumptions
Contributions 156 156 156 - 156 - 156Other changes - - - 198 198Net obligations recognized at 31 December 4,820 6,137 10,957 10,829 581 11,538 189 11,728
(in millions of dirhams)
31 December 2011
Post-employment benefits
Total employee benefitsPension
supplementMedical plans
Total pension supplement and medical
plans
of which: OCP SA conso.
Scope*
fixed retirement allocation
Total post-employment
benefits
Net obligations recognized at 1 January 2,156 5,380 7,535 7,536 475 8,010 8,010Benefits paid (7) (177) (184) (183) (37) (221) (221)Service cost 230 139 369 296 31 400 400Expenses related to discounting of obligations 97 229 326 326 19 345 345Actuarial losses or (gains) for the period resulting from changes in: 1,972 1,315 3,287 3,287 50 3,337 3,337
- financial assumptions 1,972 1,315 3,287 3,287 50 3,337 3,337- demographic assumptions
Contributions 145 145 145 - 145 145Other changes - -Net obligations recognized at 31 December 4,448 7,031 11,479 11,408 538 12,017 12,017
(*) The OCP SA consolidation scope includes OCP SA, iPSE, Phosboucraa and Sotreg
65
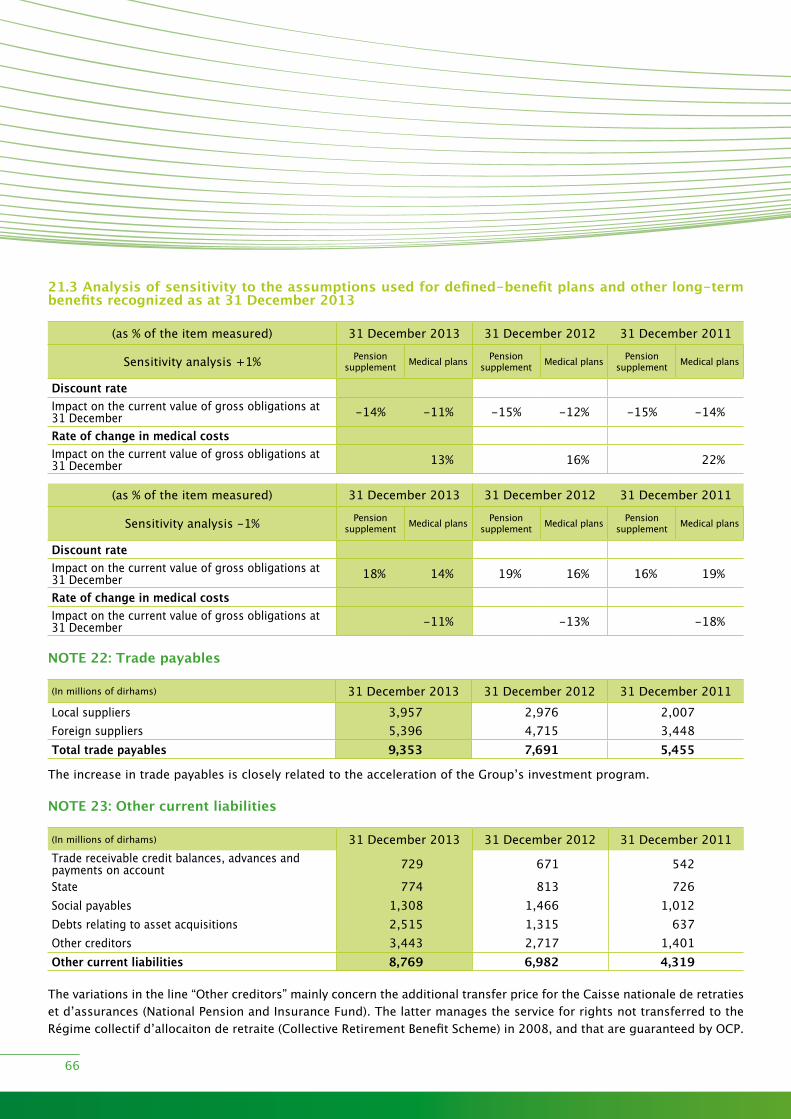
21.3 Analysis of sensitivity to the assumptions used for defined-benefit plans and other long-term benefits recognized as at 31 December 2013
(as % of the item measured) 31 December 2013 31 December 2012 31 December 2011
Sensitivity analysis +1% Pension supplement Medical plans Pension
supplement Medical plans Pension supplement Medical plans
Discount rateimpact on the current value of gross obligations at 31 December -14% -11% -15% -12% -15% -14%
Rate of change in medical costsimpact on the current value of gross obligations at 31 December 13% 16% 22%
(as % of the item measured) 31 December 2013 31 December 2012 31 December 2011
Sensitivity analysis -1% Pension supplement Medical plans Pension
supplement Medical plans Pension supplement Medical plans
Discount rateimpact on the current value of gross obligations at 31 December 18% 14% 19% 16% 16% 19%
Rate of change in medical costsimpact on the current value of gross obligations at 31 December -11% -13% -18%
NOTE 22: Trade payables
(in millions of dirhams) 31 December 2013 31 December 2012 31 December 2011local suppliers 3,957 2,976 2,007foreign suppliers 5,396 4,715 3,448Total trade payables 9,353 7,691 5,455
The increase in trade payables is closely related to the acceleration of the Group’s investment program.
NOTE 23: Other current liabilities
(in millions of dirhams) 31 December 2013 31 December 2012 31 December 2011Trade receivable credit balances, advances and payments on account 729 671 542
State 774 813 726Social payables 1,308 1,466 1,012Debts relating to asset acquisitions 2,515 1,315 637Other creditors 3,443 2,717 1,401Other current liabilities 8,769 6,982 4,319
The variations in the line “Other creditors” mainly concern the additional transfer price for the Caisse nationale de retraties et d’assurances (national Pension and insurance fund). The latter manages the service for rights not transferred to the Régime collectif d’allocaiton de retraite (Collective Retirement Benefit Scheme) in 2008, and that are guaranteed by OCP.
66
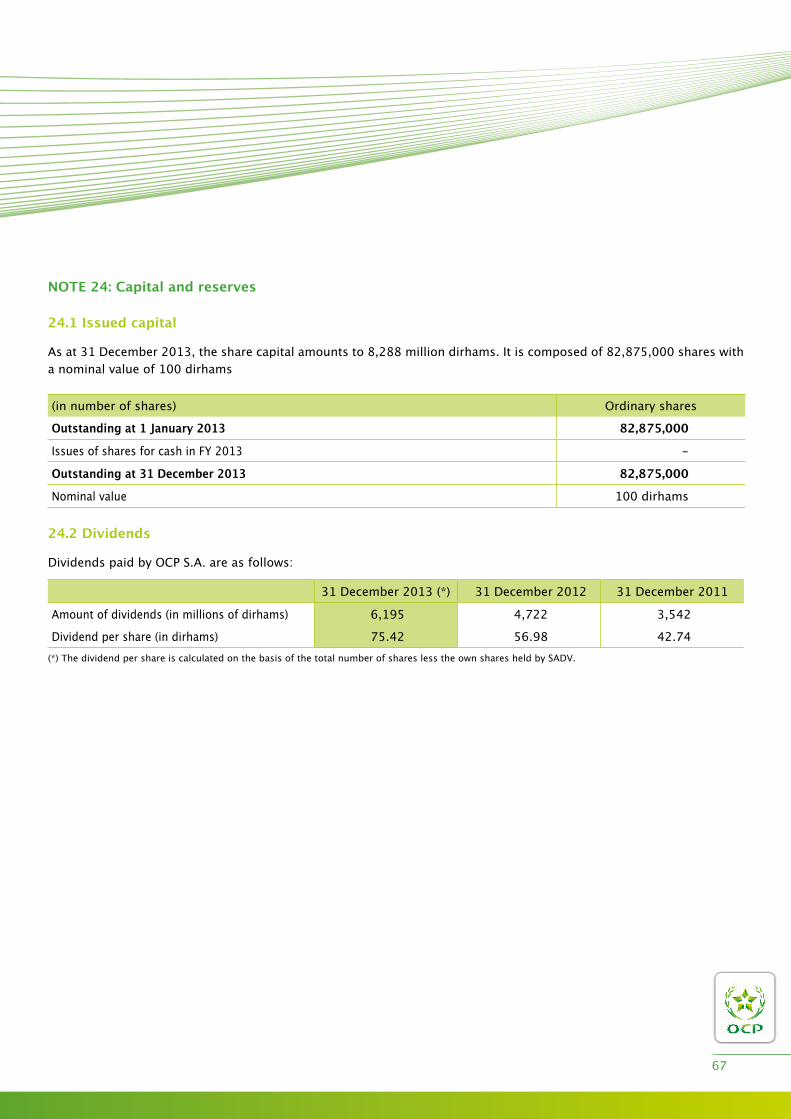
NOTE 24: Capital and reserves
24.1 Issued capital
As at 31 December 2013, the share capital amounts to 8,288 million dirhams. it is composed of 82,875,000 shares with a nominal value of 100 dirhams
(in number of shares) Ordinary shares
Outstanding at 1 January 2013 82,875,000
issues of shares for cash in fy 2013 -
Outstanding at 31 December 2013 82,875,000
Nominal value 100 dirhams
24.2 Dividends
Dividends paid by OCP S.A. are as follows:
31 December 2013 (*) 31 December 2012 31 December 2011
Amount of dividends (in millions of dirhams) 6,195 4,722 3,542
Dividend per share (in dirhams) 75.42 56.98 42.74(*) The dividend per share is calculated on the basis of the total number of shares less the own shares held by SADv.
67

F – Other Notes
NOTE 25: Other commitments and contingent liabilities
25.1 Commitments given and received
(in millions of dirhams) 31 December 2013 31 December 2012* 31 December 2011*
letters of credit 2,472 3,246 531Guarantees given by the Group on behalf of third parties 1,164 40 21
Equity commitments 1,500 1,500
Commitments resulting from operations relating to:
- interest rate 351 245 386
- exchange rate 456 412 290
- prices of raw materials or goods 72 85 68
Miscellaneous rights and commitments 401 569 207
Total Commitments given 6,415 6,097 1,504
Sureties and guarantees 168 86 189Guarantees given by third parties on behalf of the Group 19 87 106
unused borrowings 7,651 8,653 -
Other commitments received for contracts 7,682 6,050 -
loans guaranteed by the State 787 834 861
Total Commitments received 16,306 15,710 1,156(*) with reconstitution of off-balance-sheet commitments given in the amount of 31 million dirhams for PPl and 113 million dirhams for Jesa as at 31 December 2011, and in the amount of 401 million dirhams for PPl and 46 million dirhams for Jesa as at 31 December 2012.
Guarantees provided by the Group on behalf of third parties: these mainly concern:
- Pledges of collateral and encumbrances or sureties provided by Prayon SA, Prayon Benelux, and Prayon Technologies within the context of the club deal, as well as by certain subsidiaries of the Prayon Group, Transpek Silox and Hydro Technologies Canada, granted to guarantee bank credit lines.
- Guarantees provided by third parties on behalf of the Prayon Group, notably concerning bank guarantees given at the request of PRAyOn S.A. in favour of clients (within the context of the operations of the Profile division), or administrations (vAT, environment), as well as a major Jordanian supplier.
68

Commitments resulting from operations relating to the interest rate, exchange rate or prices of raw materials or goods concern hedging instruments.
Other commitments received for contracts concern commitments received from suppliers relating to advances paid within the context of the industrial programs undertaken by the Group.
25.2 Contingent liabilities
Contingent liabilities concern bank guarantees and other items arising in the ordinary course of the Group’s business. Groupe OCP does not expect these items to result in significant liabilities.
Note 26: Related parties
Note 26.1 – Management compensation
Key management includes the Chairman and Chief Executive Officer, Deputy Executive Officers, Advisors to the Chief Executive Officer and the Group’s top Executives.
(in millions of dirhams) fy 2013 fy 2012 fy 2011
Short-term employee benefits 145 147 121
Post-employment benefits 0 0 0
Termination benefits 19 0 0
Total management compensation 164 147 121
Note 26.2 – Relations with the State
Dividend policy
The Moroccan State is the majority shareholder of OCP with a 94.12% stake. in this respect, the State receives annual dividends in accordance with the company’s dividend distribution policy. The dividends to be paid are proposed by the Board of Directors to the General Meeting of Shareholders. Their amount depends on several parameters, in particular the profits made, cash available and the company’s financial structure, as well as other factors that the Board of Directors may consider to be relevant.
in 2013, the Moroccan State received dividends net of taxes amounting to 5 billion dirhams in respect of the distributable profit for financial year 2012.
69

Guaranteed loans
OCP has been a Société Anonyme (public limited liability company) since March 2008. Prior to that date, OCP, as a public enterprise, benefited from the State guarantee for loans taken out with foreign organizations.
Purpose of loan loan currency
Date of loan
Amount in millions of
euros as at 31 December 2013
Amount in millions of
dirhams as at 31 December
2013
Amount in millions of euros as at
31 December 2012
Amount in millions of
dirhams as at 31 December
2012
Amount in millions of euros as at
31 December 2011
Amount in millions of
dirhams as at 31 December
2011
AfD outstanding loans consolidation EuR 2005 42 467 43 481 44 491
Sidi Chennane mining operations EuR 2002 26 292 29 323 32 356Renewal of the sulphur unit circulation tank and supply circuit EuR 2007 1 11 1 12 1 13
Renewal of three absorption towers EuR 2003 1 7 1 9 1 10
Acquisition of two hydraulic excavators EuR 2001 1 8 1 10 1 11
TOTAL EUR 70 785 75 835 79 881
Transactions with the State
in the same way as all companies resident in Morocco, OCP is subject to the tax legislation in force, which requires the payment of duties, taxes and levies to the Moroccan State.
The following table shows the transactions performed with the State or with State-controlled enterprises for the years 2013, 2012 and 2011:
(in millions of dirhams)
31 December 2013 31 December 2012 31 December 2011
State and State-controlled enterprises
BCPState and State-
controlled enterprises
BCPState and State-
controlled enterprises
BCP
interest on investments 25 85 19 169 19 242
utility costs 822 - 859 - 762 -
Other operating expenses 241 - 94 - 81 -
interest on loans - 31 - 46 - 59
Deductions of social charges 392 - 406 - 329 -
Transport expenses 1,532 - 1,551 - 1,489 -Purchases of fixed assets and inventories 7 - 30 - 544 -
Dividends received - 42 - 39 - 35
70

(in millions of dirhams)
31 December 2013 31 December 2012 31 December 2011
State and State-controlled enterprises
BCPState and State-
controlled enterprises
BCPState and State-
controlled enterprises
BCP
Trade receivables - - - - - -
Trade payables 512 - 572 - 421 -
Other receivables 118 - 136 - 123 -
Cash and cash equivalents 187 (327) 361 1,027 505 1,446
investments 519 1,000 500 3,500 500 4,000
loans - 500 - 750 - 1,000
Note 26.3 – Joint venture contributions
The list of consolidated companies in the OCP Group is presented in note 28 “Consolidation scope”. Transactions carried out and under way existing at the end of the financial year between the Group’s companies which are fully consolidated were totally eliminated upon consolidation; the following table includes only the data relating to these reciprocal transactions when they concern companies over which the Group exercises joint control (proportionate consolidation) for the portion not eliminated upon consolidation.
(in millions of dirhams) fy 2013 fy 2012 fy 2011Revenu 9,604 12,476 11,796Production held as inventory (232) 137 688Purchases consumed (4,751) (5,853) (4,244)External expenses (1,348) (1,594) (1,359)Personnel expenses (805) (738) (652)Taxes (5) (7) (4)Amortization, depreciation and operating provisions (339) (427) (348)Other operating income and expenses (1,789) (3,690) (5,010)Current operating profit (loss) 334 303 865Other non-current operating income and expenses (7) 17 20Operating profit (loss) 327 321 885Cost of gross financial debt (180) (199) (165)financial income from cash investments 20 45 65Cost of net financial debt (160) (154) (99)Other financial income and expenses (142) (100) (134)Financial profit (loss) (302) (254) (234)Profit (loss) before tax 24 65 650Corporate income tax 25 (89) (159)Net profit (loss) 50 (23) 491
71
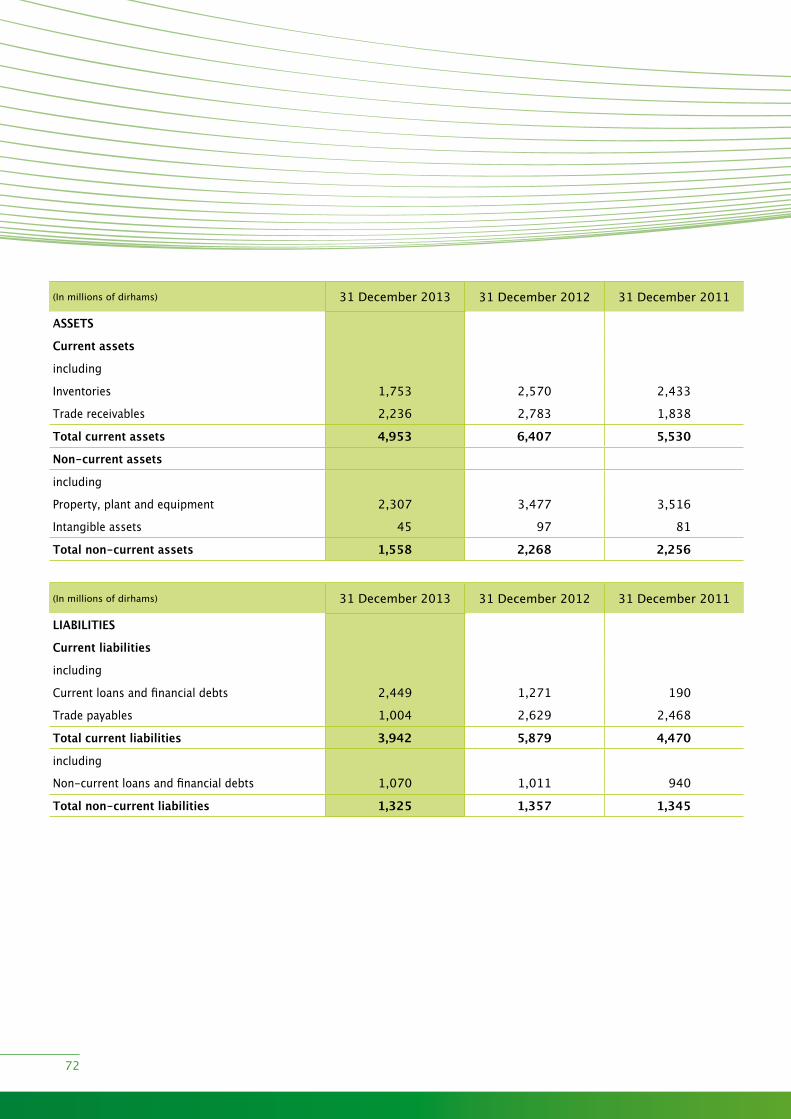
(in millions of dirhams) 31 December 2013 31 December 2012 31 December 2011
ASSETS
Current assets
including
inventories 1,753 2,570 2,433
Trade receivables 2,236 2,783 1,838
Total current assets 4,953 6,407 5,530
Non-current assets
including
Property, plant and equipment 2,307 3,477 3,516
intangible assets 45 97 81
Total non-current assets 1,558 2,268 2,256
(in millions of dirhams) 31 December 2013 31 December 2012 31 December 2011
LIABILITIES
Current liabilities
including
Current loans and financial debts 2,449 1,271 190
Trade payables 1,004 2,629 2,468
Total current liabilities 3,942 5,879 4,470
including
non-current loans and financial debts 1,070 1,011 940
Total non-current liabilities 1,325 1,357 1,345
72

26.4 – Services provided by OCP to joint ventures
OCP provides its joint ventures with various services as summarized below:
1. Supply of phosphate
Contractual provisions govern OCP’s supply of phosphate to its joint ventures. These provisions notably concern the following:
• The quality of the rock, defined according to specifications determined by the joint venture annually;
• The quantity to be delivered which corresponds to 100% of the joint venture’s requirements;
• The price invoiced to the joint venture which corresponds to the average export market prices for the year. The same price determination formula is used for all of the joint ventures;
• And other conditions related to invoicing and payment terms.
in respect of these transactions, OCP has recorded phosphate sales to joint ventures in the amount of 2,869 million dirhams in 2013, 4,111 million dirhams in 2012 and 5,700 million dirhams in 2011.
2. Supply of services and utilities
The supply of services and utilities mainly concerns: the use of the infrastructures at the Jorf lasfar site, the supply of the liquid sulphur required for industrial operation, the know-how of the OCP personnel, facility and equipment maintenance services, and equipment and vehicle rental services.
OCP also provides the joint ventures with services performed by the various head-office departments. These are governed by unwritten agreements and concern in particular marketing, sales administration, debt recovery, iT services, purchasing assistance and contract negotiation.
3. Leases
OCP has signed lease agreements with the local joint ventures for the lease of the land on which the production facilities have been built (in the case of JESA, the lease agreement is for the offices). The rents are payable in advance at the beginning of the year and are revised according to the conditions determined in the agreements.
4. Other services
The other services provided by OCP to the joint ventures essentially concern social benefits including holiday packages, hotels, children’s holiday camps, and training programs.
5. Shareholder current account advances
in 2012 OCP granted JESA a shareholder current account advance in the amount of 68 million dirhams within the context of exceptional operations such as the acquisition of the company Transportation Engineering and Management Consultants in 2012.
in 2013, OCP also signed a subordinated loan agreement with Prayon for 9 million euros to meet the company’s cash flow requirements.
73

NOTE 27: Risk management
Note 27.1 – Management of financial risks
A – Exchange riskThe Group is exposed to exchange rate risks within the framework of its industrial and commercial activities with respect to:
• transactions in foreign currencies recognized in the balance sheet, but not yet paid.
• future flows in foreign currencies of a firm or probable nature.
indeed, the Group entities make virtually all of their external turnover in uSD, while their accounting currency is the Moroccan dirham; in addition, the Group makes a substantial portion of its purchases in the uS dollar: raw materials (sulphur, ammonia), freight, spare parts. Exposure to the MAD/uSD exchange risk related to operating flows therefore constitutes a major risk for the Group.
in this respect, the Group’s Trading Room operates according to the following rules:
• favoring natural hedging resulting from matching expense and revenue currencies.
• Progressive hedging of total net exposure. Coverage is limited to 50% of net exposure. The exposure to be covered against exchange rate fluctuations is matched to the budget period, for a maximum of one year.
• use of flexible instruments making it possible to adapt to market trend reversals. Taking into account the strong volatility of the exchange rate market, net exposure is hedged using options (plain vanilla) which offer the possibility of profiting from a rise in the dollar while ensuring an exercise price making it possible to freeze commercial margins in return for the payment of a premium.
• Ban on the use of speculative instruments.
74

B – Counterparty risksCapital security is a fundamental principle of the Group’s investment policy. Cash surpluses are invested at an accepted level of risk, with high-quality counterparties.
in this respect, the trading room acts in compliance with the following rules and procedures
• Pre-qualifying bank counterparties, issuers of debt, management companies and mutual funds with which the OCP Group is exposed directly or indirectly
• Diversifying the counterparties to which Groupe OCP is exposed according to the defined rules.
• fixing limits by type of instruments held by counterparties
• Bank counterparties: the Trading Room is only authorized to deal with bank counterparties if the latter have a minimum of three ratings higher than the S&P and fitch ratings for the Moroccan debt. As at 31 December 2013, the Moroccan debt is rated BBB-, and the minimum rating required for bank counterparties is therefore B+. in the absence of rating, the bank counterparty must have equity exceeding 3 billion dirhams and a core capital ratio and solvency ratio exceeding the Basel criteria. These ratios are communicated by the bank counterparties in their annual reports within the framework of Directive no. 44/G/2007 issued by Bank Al Maghrib.
in addition the choice of bank counterparties is based on a criterion of counterparty diversification. Thus, outstanding direct investment with a bank counterparty is classified by instrument type and is limited according to the credit standard of the said counterparty. These limits fix:
- The maximum outstanding amount authorized with a counterparty as a percentage of equity.
- The outstanding amount with a counterparty by instrument type which must not exceed the Group’s total outstanding amount invested directly in this type of instrument.
- The outstanding amount with a counterparty by instrument type which must not exceed a percentage of the counterparty’s total outstanding amount in this type of instrument.
75
• Debt issuers: the Trading Room is authorized to deal with debt issuers if the following conditions are met:
- State Treasury issue: treasury bills with a residual maturity less than or equal to two years. Derogations may be granted by the Management Committee for any other maturities on a case-by-case basis.
- Private debt issue other than with bank counterparties: any subscription must be validated by the Management Committee on a case-by-case basis.
• UCITS: the prequalification of uCiTS consists of the following two stages:
- Choice of the management company: the management company must have a minimum management rating of M2 according to the fitch scale. in the event of absence of rating by a rating agency, the management company must manage net assets amounting to a total of at least 5 billion dirhams and have been engaged in the management of uCiTS for at least two years.
- Choice of the uCiTS:
• investment in equity and diversified uCiTS is prohibited. investment in medium- and long-term bond uCiTS is exceptional and must be approved by the Management Committee.
• The uCiTS assets must be greater than or equal to 1 billion dirhams with at least one year of activity.
• The Middle Office verifies that each prequalified management company and uCiTS complies with the conditions described above and informs the Management Committee of any event or change in the prequalification conditions relating to the management companies and the uCiTS.
The outstanding amount with a uCiTS is limited according to the credit rating of the management company and of the said uCiTS. These limits fix the maximum outstanding amount authorized with a uCiTS as a percentage of net assets and the maximum outstanding amount authorized with the management company.
• Management mandates: the Trading Room is authorized to deal with investment mandate management companies if the following conditions are met, according to two phases:
- Choice of the management company:
• the management company must have a minimum management rating of M2 according to the fitch scale.
• in the event of absence of rating by a rating agency, the management company must manage net assets amounting to a total of at least 5 billion dirhams and have been engaged in the management of uCiTS and mandates for at least two years, to the satisfaction of OCP.
- Choice of the investment universe:
• The investment universe must be approved by the Management Committee;
• The choice of the counterparties must comply with the criteria for the prequalification of the counterparties and uCiTS defined above.
76
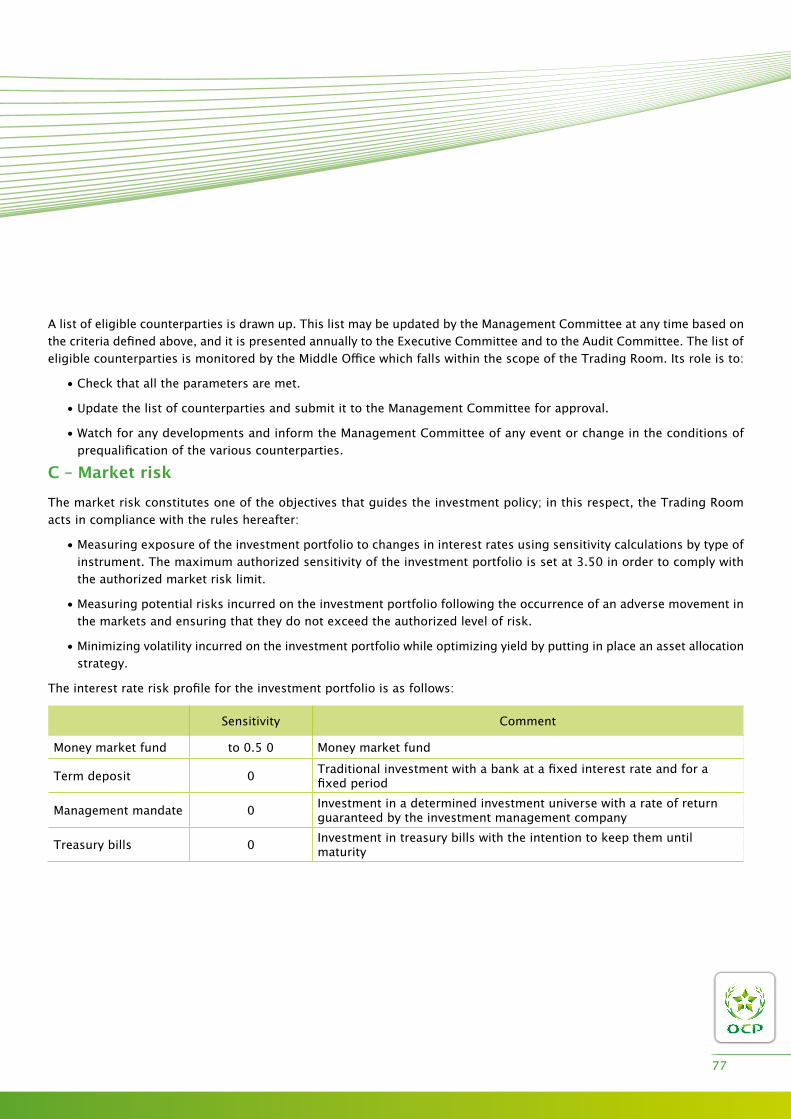
A list of eligible counterparties is drawn up. This list may be updated by the Management Committee at any time based on the criteria defined above, and it is presented annually to the Executive Committee and to the Audit Committee. The list of eligible counterparties is monitored by the Middle Office which falls within the scope of the Trading Room. its role is to:
• Check that all the parameters are met.
• update the list of counterparties and submit it to the Management Committee for approval.
• watch for any developments and inform the Management Committee of any event or change in the conditions of prequalification of the various counterparties.
C – Market riskThe market risk constitutes one of the objectives that guides the investment policy; in this respect, the Trading Room acts in compliance with the rules hereafter:
• Measuring exposure of the investment portfolio to changes in interest rates using sensitivity calculations by type of instrument. The maximum authorized sensitivity of the investment portfolio is set at 3.50 in order to comply with the authorized market risk limit.
• Measuring potential risks incurred on the investment portfolio following the occurrence of an adverse movement in the markets and ensuring that they do not exceed the authorized level of risk.
• Minimizing volatility incurred on the investment portfolio while optimizing yield by putting in place an asset allocation strategy.
The interest rate risk profile for the investment portfolio is as follows:
Sensitivity Comment
Money market fund to 0.5 0 Money market fund
Term deposit 0 Traditional investment with a bank at a fixed interest rate and for afixed period
Management mandate 0 investment in a determined investment universe with a rate of returnguaranteed by the investment management company
Treasury bills 0 investment in treasury bills with the intention to keep them untilmaturity
77
D – Liquidity riskThe investment portfolio must remain sufficiently liquid to respond to the financing needs generated by the Group’s operations and investment. To this end, it must be composed of liquid, flexible and available instruments.
Thus, the investment portfolio is split between:
• short-term, liquid instruments, providing for daily operating needs. These instruments will be grouped under the heading “Operating portfolio” and must at any time contain net assets exceeding 1 billion dirhams.
• mid- to long-term instruments, in conformity with counterparty risk management and market risk management, generating a yield which is in line with the yield objectives of the investment policy. These instruments will be grouped under the title “Basic portfolio”.
The assets invested are divided between the operating portfolio and the basic portfolio on the basis of cash flow forecasts.
E – Carrying value and fair value of financial assets and liabilities by accounting categoryin accordance with ifRS 7, “financial instruments: Disclosures”, fair value measurements must be classed according to a hierarchy based on the input used to measure the fair value of the instrument which includes the following three levels:
- level 1: the use of quoted (unadjusted) market prices in active markets for identical assets or liabilities;
- level 2: the use of quoted market prices in active markets for similar assets or liabilities or measurement techniques where the relevant inputs are based on observable market data;
- level 3: the use of measurement techniques where the relevant inputs are not all based on observable market data.
78
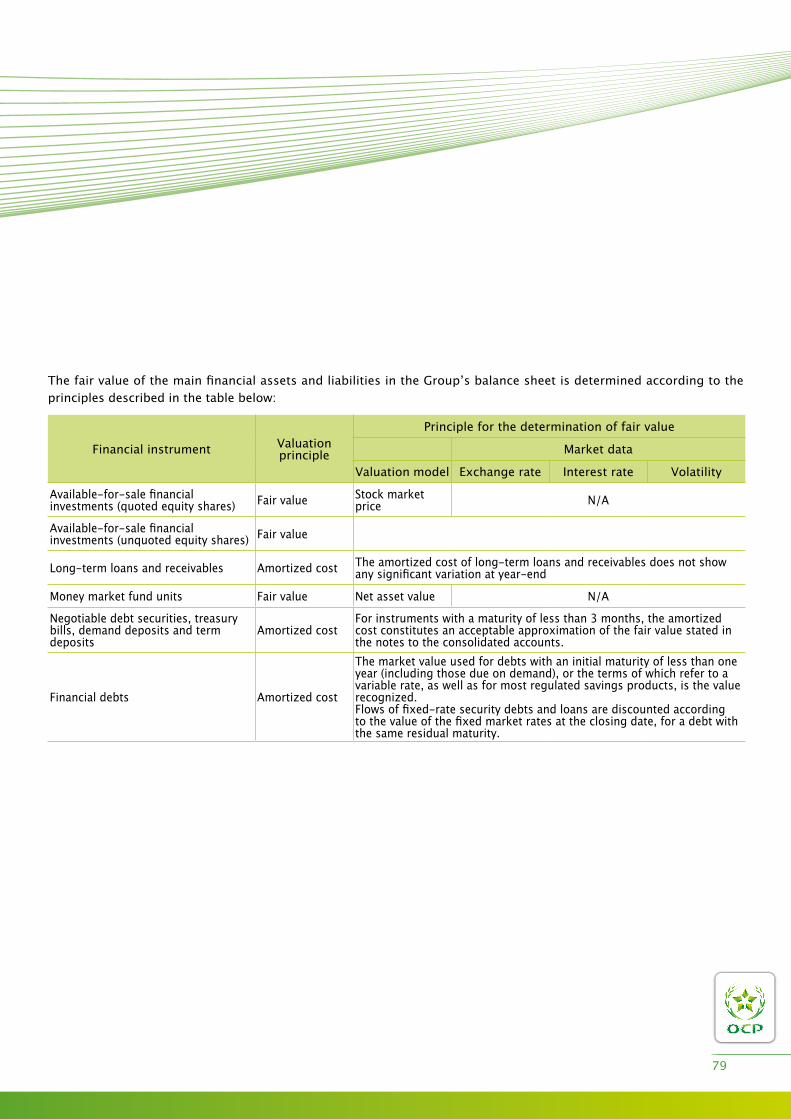
The fair value of the main financial assets and liabilities in the Group’s balance sheet is determined according to the principles described in the table below:
financial instrument valuation principle
Principle for the determination of fair value
Market data
valuation model Exchange rate interest rate volatility
Available-for-sale financial investments (quoted equity shares) fair value Stock market
price n/A
Available-for-sale financial investments (unquoted equity shares) fair value
long-term loans and receivables Amortized cost The amortized cost of long-term loans and receivables does not show any significant variation at year-end
Money market fund units fair value Net asset value n/A
negotiable debt securities, treasury bills, demand deposits and term deposits
Amortized costfor instruments with a maturity of less than 3 months, the amortized cost constitutes an acceptable approximation of the fair value stated in the notes to the consolidated accounts.
financial debts Amortized cost
The market value used for debts with an initial maturity of less than one year (including those due on demand), or the terms of which refer to a variable rate, as well as for most regulated savings products, is the value recognized.flows of fixed-rate security debts and loans are discounted according to the value of the fixed market rates at the closing date, for a debt with the same residual maturity.
79

(in millions of dirhams) At 31 December 2013
Balance sheet captions andinstrument classes Carrying value fair value
level 1:quoted prices
andavailable funds
level 2:internal
model withobservable
inputs
level 3:internal
model withunobservable
inputs
Cash and cash equivalents 6 039 6 039 3 842 2 197Cash financial assets 4 631 4 701 4 701Trade receivables 25 277 25 277 25 277Total current financial assets 35 947 36 017 3 842 25 277 6 898Available-for-sale financial assets 2 407 2 407 1 694 713financial assets measured at fair value through profit or loss 9 9 9Other receivables 471 471 471Total non-current financial assets 2 887 2 887 1 694 1 193Current loans and financial debts 5 891 5 891 5 891Trade payables 18 182 18 182 18 182Total current financial liabilities 24 073 24 073 18 182 5 891non-current loans and financial debts 18 242 18 392 157 18 235Other non-current financial liabilities 17 17 17Total non-current financial liabilities 18 259 18 409 157 18 252
(in millions of dirhams) At 31 December 2012
Balance sheet captions andinstrument classes Carrying value fair value
level 1:quoted prices
andavailable
funds
level 2:internal
model withobservable
inputs
level 3:internal
model withunobservable
inputsCash and cash equivalents 9 813 9 813 8 615 1 198Cash financial assets 18 147 18 511 18 511Trade receivables 20 972 20 972 20 972Total current financial assets 48 932 49 296 8 615 20 972 19 709Available-for-sale financial assets 2 285 2 285 1 721 564financial assets measured at fair value through profit or loss 9 9 9
Other receivables 511 511 511Total non-current financial assets 2 805 2 805 1 721 1 084Current loans and financial debts 6 888 6 888 6 888Trade payables 14 710 14 710 14 710Total current financial liabilities 21 598 21 598 14 710 6 888non-current loans and financial debts 13 783 13 872 157 13 715Other non-current financial liabilities 20 20 20Total non-current financial liabilities 13 803 13 892 157 13 735
80

(in millions of dirhams) At 31 December 2011
Balance sheet captions andinstrument classes Carrying value fair value
level 1:quoted prices
andavailable
funds
level 2:internal
model withobservable
inputs
level 3:internal
model withunobservable
inputsCash and cash equivalents 11 074 11 074 10 874 200Cash financial assets 16 075 16 372 16 372Trade receivables 15 306 15 306 15 306Total current financial assets 42 455 42 752 10 874 15 306 16 572Available-for-sale financial assets 1 777 1 777 1 737 40financial assets measured at fair value through profit or lossOther receivables 456 456 456Total non-current financial assets 2 233 2 233 1 737 496Current loans and financial debts 3 275 3 275 3 275Trade payables 11 663 11 663 11 663Total current financial liabilities 14 938 14 938 11 663 3 275non-current loans and financial debts 10 203 10 233 157 10 076Other non-current financial liabilities 20 20 20Total non-current financial liabilities 10 223 10 253 157 10 096
The methods of measuring the fair value of financial assets and liabilities have not changed in financial years 2011, 2012 and 2013.
81

27.2 – Credit risk
Groupe OCP is present in more than 50 countries around the globe. its turnover is mainly generated by exports. Groupe OCP’s customers include major international groups who have had an ongoing business relationship with the Group for several years.
The credit risk is the risk of financial loss if a customer or counterparty fails to meet its contractual obligations.
within the framework of credit risk management, the Group has set up a process to measure customer credit risk. The analysis of the customer portfolio takes the following criteria into account: country risk, payment default or insolvability risk, payment history, and the customer relationship. Groupe OCP also makes sure of the financial strength of its customers based on information provided by internationally recognized rating agencies. This analysis is then reviewed periodically so as to take market trends and the customer relationship into consideration.
The customers and their debts are thus divided into risk categories. Trade receivables are monitored rigorously on a daily basis in order to anticipate any delay in payment.
Payment terms are granted to customers according to the level of risk. They range from prepayment to simple transfers, and include letters of credit, bank guarantees, etc. The Group has not noted any default on payment in the last three years.
27.3 – Risks related to raw materials
Sulphur supplies:
with global trade in sulphur representing 30 million tons per year, Groupe OCP imports almost 4 million tons per year. These imports are made via direct contracts with the world’s main exporters of sulphur. The contracts are framework contracts under which volumes are fixed annually and prices are negotiated periodically. The portfolio of suppliers is diversified to limit exposure to any given supplier. it includes all the main suppliers, from the Middle East (Saudi Arabia, uAE, qatar, Kuwait), Europe (Total, Shell, Repsol, etc.), north America (Shell, Koch, etc.), Russia (Gazprom) and Kazakhstan (TCO).
As sulphur is a byproduct of hydrocarbons, the market is expected to be oversupplied as from 2014/15, which will result in additional reserves for the coming years.
Price:
in view of price instability, for 80% of our contractual volumes the price is fixed on a quarterly basis. The prices are among the most competitive as a result of the diversification policy and the importance of Groupe OCP in the international market.
82
Ammonia supplies
Global trade in ammonia represents approximately 20 million tons per year. This market is a very regional one due to the high logistics costs involved (requiring special ships). Annual procurements represent around 800 kt per year and should increase significantly with the development of the granulation capacities. Morocco’s geographical situation is advantageous in that it enables the Group to be close to the locations of its two main exporters of ammonia in the world (Black Sea 3.5 million tons per year and Trinidad 5 million tons). furthermore, the imminent start of the export of ammonia (700 kt) from Sorfret in Algeria will confirm the Group’s regional advantage.
The new dynamic of shale gas in north America and the nitrogen fertilizer projects announced in Africa will provide further potential supply sources for the Group in the future.
Globally, the Middle East constitutes a relatively significant center of production and any prolonged instability of the region may impact the ammonia market.
Price:
The price of ammonia is relatively volatile and consequently prices are fixed cargo by cargo. However, the Group has entered into contracts with all its main suppliers (Russia, Algeria, ukraine, etc.) to guarantee the availability of the product.
upon the completion of the storage facilities currently being built, Groupe OCP could use this lever to seize opportunities in the ammonia market.
83

NOTE 28: Consolidation scope
EntityConsolidation method as of 31 December
2013
31 December 2013 31 December 2012 31 December 2011
% control % interest % control % interest % control % interest
OCP SA - Holding full 100.00 100.00 100.00 100.00 100.00 100.00Maroc Phosphore(*) - - - - 100.00 100.00Bunge Maroc Phosphore full 100.00 100.00 50.00 50.00 50.00 50.00Centre d'Etudes et de Recherches des Phosphates Minéraux
full 100.00 100.00 100.00 100.00 100.00 100.00
Euro Maroc Phosphore Proportionate 50.00 50.00 50.00 50.00 50.00 50.00fOnDATiOn OCP full 100.00 100.00 100.00 100.00 - -indo Maroc Phosphore Proportionate 33.33 33.33 33.33 33.33 33.33 33.33OCP Services full 100.00 100.00 100.00 100.00 100.00 100.00JACOBS EnGinEERinG Proportionate 50.00 50.00 50.00 50.00 50.00 50.00lEJOn & CiE full 100.00 100.00 100.00 100.00 100.00 100.00OCP innOvATiOn funD fOR AGRiCulTuRE full 100.00 100.00 100.00 100.00 100.00 100.00
Phosboucraa full 100.00 100.00 100.00 100.00 100.00 100.00PAKiSTAn MAROC PHOSPHORE Proportionate 50.00 50.00 50.00 50.00 50.00 50.00
PPl Proportionate 50.00 50.00 50.00 50.00 50.00 50.00Groupe PRAyOn Proportionate 50.00 50.00 50.00 50.00 50.00 50.00Société d'amenagement et de developpement vert full 100.00 100.00 100.00 100.00 100.00 100.00
Société Marocaine d'Etudes Spéciales et industrielles full 100.00 100.00 100.00 100.00 100.00 100.00
Société de Transports Régionaux full 100.00 100.00 100.00 100.00 100.00 100.00
Transportation engineering and management consultants
Proportionate 50.00 50.00 50.00 50.00 - -
(*) Merger with OCP SA with retroactive effect as of 1 January 2012.
84

G – Events after the reporting period
no events after the reporting period have been noted.
85
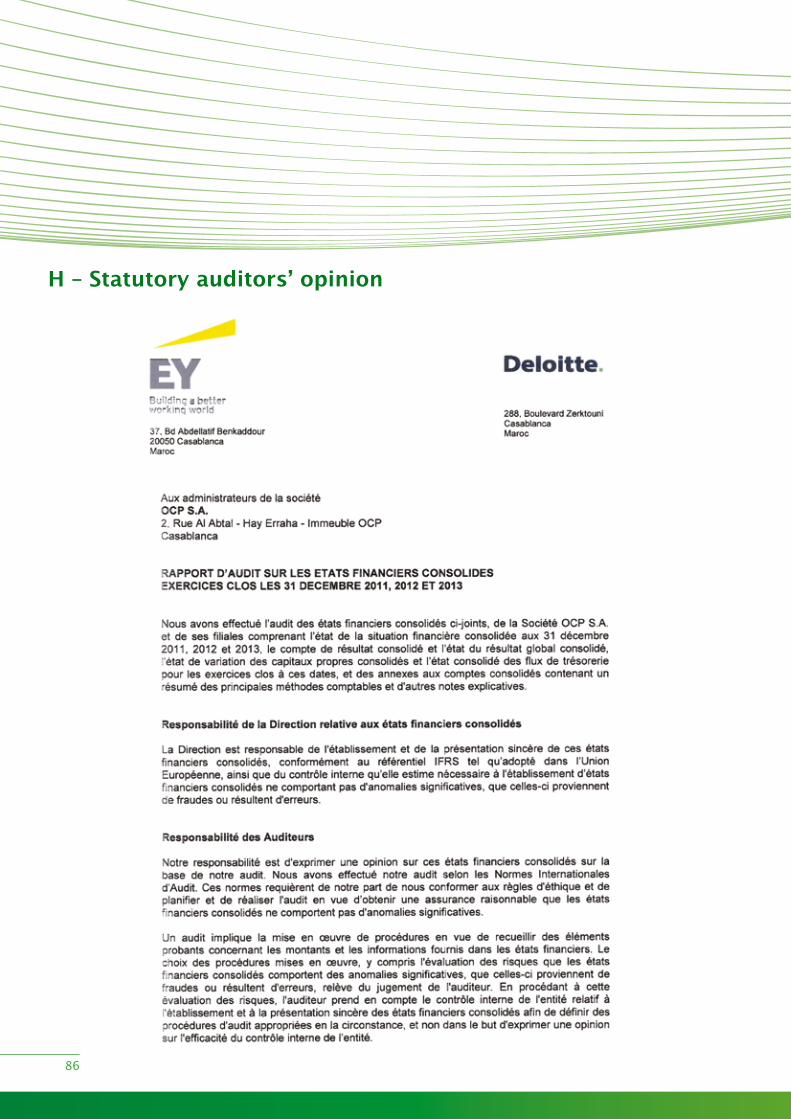
H – Statutory auditors’ opinion
86
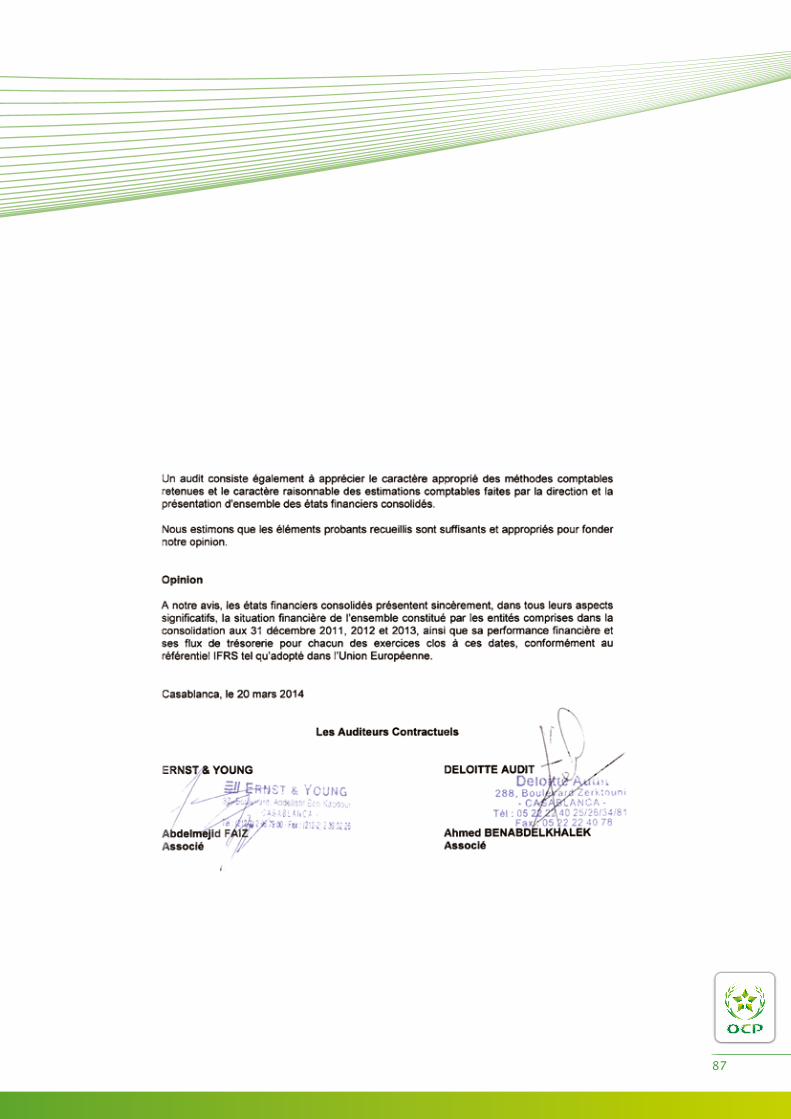
87