consolidated financial statements kyudenko corporation · revenue and expense accounts of the...
TRANSCRIPT

Consolidated Financial Statements
KYUDENKO CORPORATION
Years ended March 31, 2010 and 2009
with Report of Independent Auditors

2
KYUDENKO CORPORATION and Consolidated Subsidiaries
Consolidated Balance Sheets
March 31,
2010 2009 2010
(Millions of yen) (Thousands of U.S. dollars)
(Note 3)
Assets Current assets:
Cash and cash equivalents (Note 15) ¥ 14,360 ¥ 12,813 $ 154,342 Short-term investments (Note 14) 1,018 2,230 10,942 Trade notes and accounts receivable (Note 15) 51,834 49,852 557,115 Lease receivables and lease investment assets (Note 15)
17,532
18,337
188,435
Less: Allowance for doubtful receivables (485) (997) (5,213) Inventories (Note 4) 19,324 30,868 207,696 Deferred tax assets (Note 8) 2,997 3,313 32,212 Other current assets 2,309 2,600 24,817
Total current assets 108,889 119,016 1,170,346
Property, plant and equipment (Note 5):
Land 26,619 26,782 286,103 Buildings and structures 55,328 53,847 594,669 Machinery and equipment 17,915 15,038 192,552 Construction in progress 197 3,426 2,117
100,059 99,093 1,075,441 Accumulated depreciation (34,313) (32,675) (368,799)
Property, plant and equipment, net 65,746 66,418 706,642 Investments and other assets:
Investment securities (Note 14 and 15) 15,251 13,985 163,919 Long-term loans receivable 727 776 7,814 Investments in unconsolidated subsidiaries and affiliates (Note 15)
7,290
7,084
78,353
Deferred tax assets (Note 8) 10,100 11,642 108,555 Other 9,591 10,004 103,085
Less: Allowance for doubtful receivables (5,032) (5,050) (54,084)
Total investments and other assets 37,927 38,441 407,642
Total assets ¥212,562 ¥223,875 $2,284,630

3
March 31,
2010 2009 2010
(Millions of yen) (Thousands of U.S. dollars)
(Note 3)
Liabilities and net assets Current liabilities:
Short-term bank loans and current portion of long-term debt (Note 6 and 15)
¥ 12,890
¥ 15,018
$ 138,543
Trade notes and accounts payable (Note 15) 42,985 44,061 462,006 Advances received on construction contracts in progress
16,882
23,274
181,449
Accrued expenses 1,810 2,040 19,454 Accrued income taxes (Note 8) 1,174 602 12,618 Other current liabilities (Notes 6 and 8) 3,833 4,791 41,196
Total current liabilities 79,574 89,786 855,266
Long-term liabilities: Long-term debt (Note 6 and 15) 12,020 15,343 129,192 Long-term accounts payable 1,462 2,817 15,714 Accrued employees’ retirement benefits (Note 9) 26,098 26,819 280,503 Accrued directors’ retirement benefits 198 199 2,128 Other (Notes 6 and 8) 2,801 2,581 30,105
Total long-term liabilities 42,579 47,759 457,642
Total liabilities 122,153 137,545 1,312,908
Contingent liabilities (Note 13)
Net assets: Shareholders’ equity (Note 7):
Common stock, with no par value: Authorized – 250,000,000 shares Issued – 83,005,819 shares in 2010 and 2009 7,902 7,902 84,931
Capital surplus 7,890 7,890 84,802 Retained earnings 76,726 73,517 824,655 Treasury stock, at cost (3,767) (3,758) (40,487)
Total shareholders’ equity 88,751 85,551 953,901
Valuation, translation adjustments and other: Net unrealized gain on other securities 820 2 8,814 Translation adjustments (65) (78) (699)
Total valuation, translation adjustments and other 755 (76) 8,115 Minority interests 903 855 9,706
Total net assets 90,409 86,330 971,722
Total liabilities and net assets ¥212,562 ¥223,875 $2,284,630
See notes to consolidated financial statements.
4
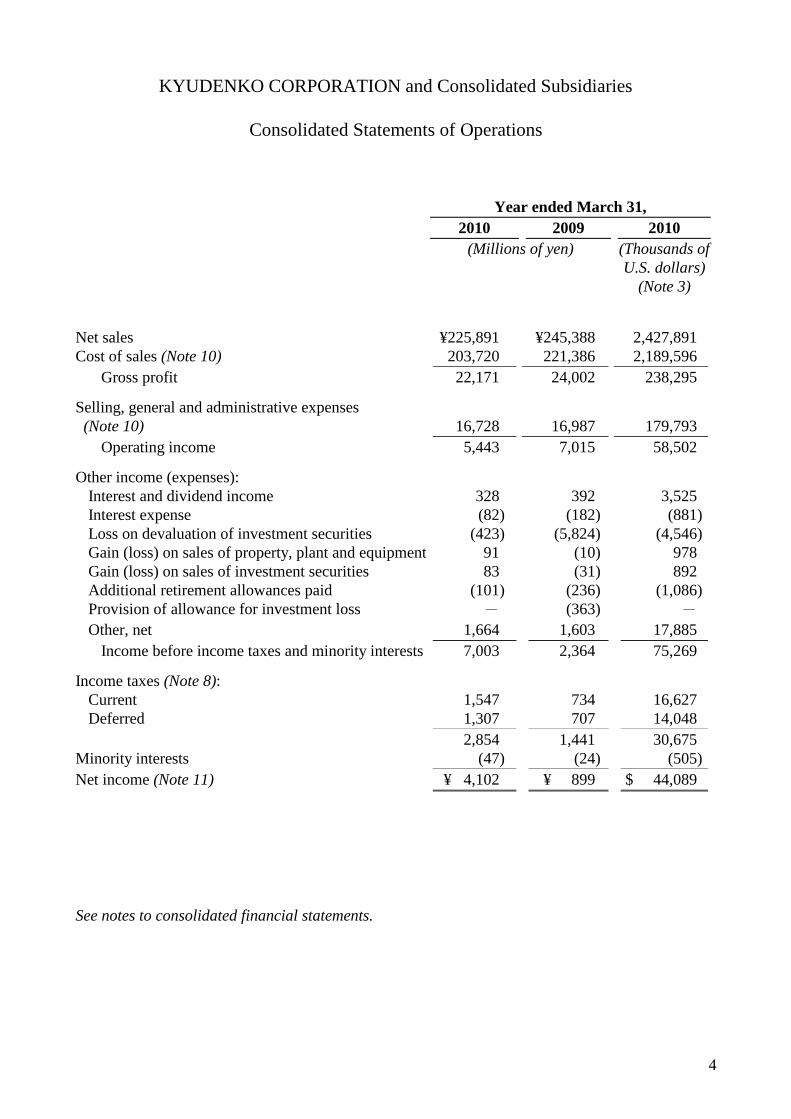
KYUDENKO CORPORATION and Consolidated Subsidiaries
Consolidated Statements of Operations
Year ended March 31,
2010 2009 2010
(Millions of yen) (Thousands of
U.S. dollars)
(Note 3)
Net sales ¥225,891 ¥245,388 2,427,891
Cost of sales (Note 10) 203,720 221,386 2,189,596
Gross profit 22,171 24,002 238,295
Selling, general and administrative expenses
(Note 10)
16,728
16,987
179,793
Operating income 5,443 7,015 58,502
Other income (expenses):
Interest and dividend income 328 392 3,525
Interest expense (82) (182) (881)
Loss on devaluation of investment securities (423) (5,824) (4,546)
Gain (loss) on sales of property, plant and equipment 91 (10) 978
Gain (loss) on sales of investment securities 83 (31) 892
Additional retirement allowances paid (101) (236) (1,086)
Provision of allowance for investment loss - (363) -
Other, net 1,664 1,603 17,885
Income before income taxes and minority interests 7,003 2,364 75,269
Income taxes (Note 8):
Current 1,547 734 16,627
Deferred 1,307 707 14,048
2,854 1,441 30,675
Minority interests (47) (24) (505)
Net income (Note 11) ¥ 4,102 ¥ 899 $ 44,089
See notes to consolidated financial statements.

5
KYUDENKO CORPORATION and Consolidated Subsidiaries
Consolidated Statements of Changes in Net Assets
Shareholders’ equity
Valuation, translation adjustments
and other
Number of
shares
issued
Common
stock
Capital
surplus
Retained
earnings
Treasury
stock
Total
shareholders’
equity
Net
unrealized
gain (loss) on
other
securities
Translation
adjustments
Total
valuation,
translation
adjustments
and other
Minority
interests
Total
net assets
(Thousands) (Millions of yen)
Balance at March 31, 2008 83,005 ¥7,902 ¥7,890 ¥73,371 ¥(3,710) ¥85,453 ¥(1,824) ¥11 ¥(1,813) ¥888 ¥84,528
Cash dividends paid – – – (744) – (744) – – – – (744)
Decrease due to inclusion of
subsidiaries in consolidation – – – (9) – (9) – – – – (9)
Net income – – – 899 – 899 – – – – 899
Purchases of treasury stock – – – – (48) (48) – – – – (48)
Net changes in items other
than those in shareholders’
equity during the year
–
–
–
–
–
–
1,826
(89)
1,737
(33)
1,704
Balance at March 31, 2009 83,005 7,902 7,890 73,517 (3,758) 85,551 2 (78) (76) 855 86,330
Cash dividends paid – – – (893) – (893) – – – – (893)
Net income – – – 4,102 – 4,102 – – – – 4,102
Purchases of treasury stock – – – – (9) (9) – – – – (9)
Net changes in items other
than those in shareholders’
equity during the year
–
–
–
–
–
–
818
13
831
48
879
Balance at March 31, 2010 83,005 ¥7,902 ¥7,890 ¥76,726 ¥(3,767) ¥88,751 ¥820 ¥(65) ¥755 ¥903 ¥90,409
Shareholders’ equity
Valuation, translation adjustments
and other
Number of
shares
issued
Common
stock
Capital
surplus
Retained
earnings
Treasury
stock
Total
shareholders’
equity
Net
unrealized
gain (loss) on
other
securities
Translation
adjustments
Total
valuation,
translation
adjustments
and other
Minority
interests
Total
net assets
(Thousands) (Thousands of U.S. dollars) (Note 3)
Balance at March 31, 2009 83,005 $84,931 $84,802 $790,165 $(40,391) $919,507 $22 $(839) $(817) $9,189 $927,879
Cash dividends paid – – – (9,599) – (9,599) – – – – (9,599)
Net income – – – 44,089 – 44,089 – – – – 44,089
Purchases of treasury stock – – – – (96) (96) – – – – (96)
Net changes in items other
than those in shareholders’
equity during the year
–
–
–
–
–
–
8,792
140
8,932
517
9,449
Balance at March 31, 2010 83,005 $84,931 $84,802 $824,655 $(40,487) $953,901 $8,814 $(699) $8,115 $9,706 $971,722
See notes to consolidated financial statements.
6
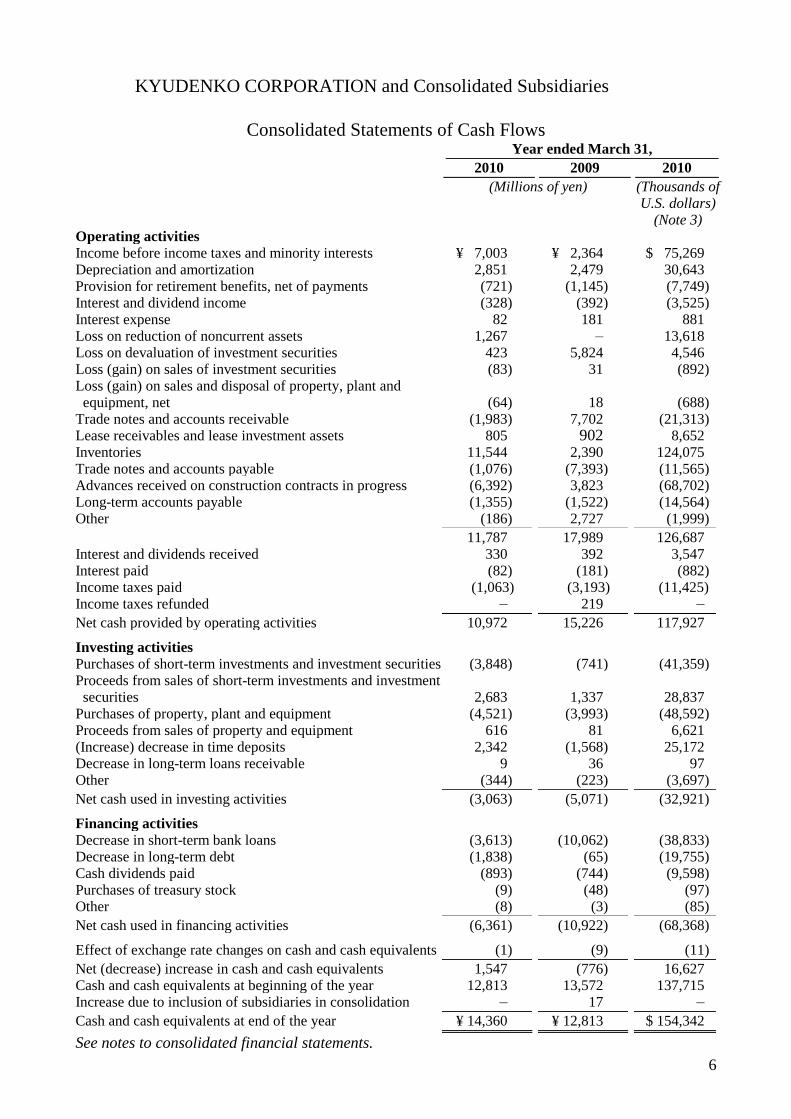
KYUDENKO CORPORATION and Consolidated Subsidiaries
Consolidated Statements of Cash Flows Year ended March 31,
2010 2009 2010
(Millions of yen) (Thousands of U.S. dollars)
(Note 3) Operating activities Income before income taxes and minority interests ¥ 7,003 ¥ 2,364 $ 75,269 Depreciation and amortization 2,851 2,479 30,643 Provision for retirement benefits, net of payments (721) (1,145) (7,749) Interest and dividend income (328) (392) (3,525) Interest expense 82 181 881 Loss on reduction of noncurrent assets 1,267 – 13,618 Loss on devaluation of investment securities 423 5,824 4,546 Loss (gain) on sales of investment securities (83) 31 (892) Loss (gain) on sales and disposal of property, plant and
equipment, net
(64)
18
(688) Trade notes and accounts receivable (1,983) 7,702 (21,313) Lease receivables and lease investment assets 805 902 8,652 Inventories 11,544 2,390 124,075 Trade notes and accounts payable (1,076) (7,393) (11,565) Advances received on construction contracts in progress (6,392) 3,823 (68,702) Long-term accounts payable (1,355) (1,522) (14,564) Other (186) 2,727 (1,999)
11,787 17,989 126,687 Interest and dividends received 330 392 3,547 Interest paid (82) (181) (882) Income taxes paid (1,063) (3,193) (11,425) Income taxes refunded – 219 –
Net cash provided by operating activities 10,972 15,226 117,927
Investing activities Purchases of short-term investments and investment securities (3,848) (741) (41,359) Proceeds from sales of short-term investments and investment
securities 2,683 1,337 28,837 Purchases of property, plant and equipment (4,521) (3,993) (48,592) Proceeds from sales of property and equipment 616 81 6,621 (Increase) decrease in time deposits 2,342 (1,568) 25,172 Decrease in long-term loans receivable 9 36 97 Other (344) (223) (3,697)
Net cash used in investing activities (3,063) (5,071) (32,921)
Financing activities Decrease in short-term bank loans (3,613) (10,062) (38,833) Decrease in long-term debt (1,838) (65) (19,755) Cash dividends paid (893) (744) (9,598) Purchases of treasury stock (9) (48) (97) Other (8) (3) (85)
Net cash used in financing activities (6,361) (10,922) (68,368)
Effect of exchange rate changes on cash and cash equivalents (1) (9) (11)
Net (decrease) increase in cash and cash equivalents 1,547 (776) 16,627 Cash and cash equivalents at beginning of the year 12,813 13,572 137,715 Increase due to inclusion of subsidiaries in consolidation – 17 –
Cash and cash equivalents at end of the year ¥ 14,360 ¥ 12,813 $ 154,342
See notes to consolidated financial statements.

7
KYUDENKO CORPORATION
Notes to Consolidated Financial Statements
March 31, 2010
1. Basis of Presentation
KYUDENKO CORPORATION (the “Company”) and its domestic subsidiaries maintain
their accounting records and prepare their financial statements in accordance with
accounting principles generally accepted in Japan, and its foreign subsidiaries maintain
their books of account in conformity with those of their countries of domicile.
The accompanying consolidated financial statements have been compiled from the
consolidated financial statements prepared by the Company as required under the Financial
Instruments and Exchange Law of Japan and, accordingly, have been prepared in
accordance with accounting principles generally accepted in Japan, which are different in
certain respects as to the application and disclosure requirements of International Financial
Reporting Standards.
Certain amounts in the prior year’s financial statements have been reclassified to conform
to the current year’s presentation.
2. Summary of Significant Accounting Policies
(a) Basis of consolidation and accounting for investments in unconsolidated subsidiaries
and affiliates
The accompanying consolidated financial statements include the accounts of the
Company and significant companies controlled directly or indirectly by the Company.
Significant companies over which the Company exercises significant influence in
terms of their operating and financial policies have been included in the consolidated
financial statements on an equity basis. All significant intercompany balances and
transactions have been eliminated in consolidation.
The excess of cost over underlying net assets at fair value as of the dates of acquisition
is amortized, mainly over a period of 5 years on a straight-line basis.
Investments in companies which are not consolidated or accounted for by the equity
method are carried at cost.
(b) Cash equivalents
All highly liquid investments with a maturity of three months or less when purchased
are considered cash equivalents.

8
2. Summary of Significant Accounting Policies (continued)
(c) Foreign currency translation
Monetary assets and liabilities denominated in foreign currencies are translated into
yen at the exchange rates in effect at the balance sheet date. All other assets and
liabilities denominated in foreign currencies are translated at their historical rates.
All revenues and expenses associated with foreign currencies are translated at the rates
of exchange prevailing when such transactions were made. The resulting exchange
losses and gains are charged or credited to income.
Revenue and expense accounts of the foreign consolidated subsidiaries are translated
at the average rate during the year and, except for the components of net assets
excluding minority interests, the balance sheet accounts are translated into yen at the
exchange rates in effect at the balance sheet date. The components of net assets
excluding minority interests are translated at their historical exchange rates.
(d) Securities
Securities other than those of subsidiaries and affiliates are classified into three
categories: trading, held-to-maturity or other securities. Trading securities are carried
at fair value and held-to-maturity securities are carried at amortized cost. Marketable
securities classified as other securities are carried at fair value with any changes in
unrealized holding gain or loss, net of the applicable income taxes, included directly in
net assets. In cases where an embedded derivative in a compound financial
instrument is unable to be separately measured, the entire compound financial
instrument is measured at fair value with changes in value charged or credited to
income. Non-marketable securities classified as other securities are carried at cost
except for investments in limited partnerships that are accounted for by the equity
method. Cost of securities sold is determined by the moving average method.
(e) Allowance for doubtful receivables
The allowance for doubtful receivables is provided at an amount determined based on
the historical experience of bad debt with respect to ordinary receivables, plus an
estimate of uncollectible amounts determined by reference to specific doubtful
receivables from customers which are experiencing financial difficulties.
(f) Inventories
Construction contracts in progress are stated at cost by the specific identification
method. Real estate construction in progress is stated at cost by the specific
identification method. Materials and supplies are chiefly stated at cost by the average
method.
The balance sheet amounts of inventories are calculated at the lower of cost or net
selling value by decreasing the book value based on any declines in profitability.
9
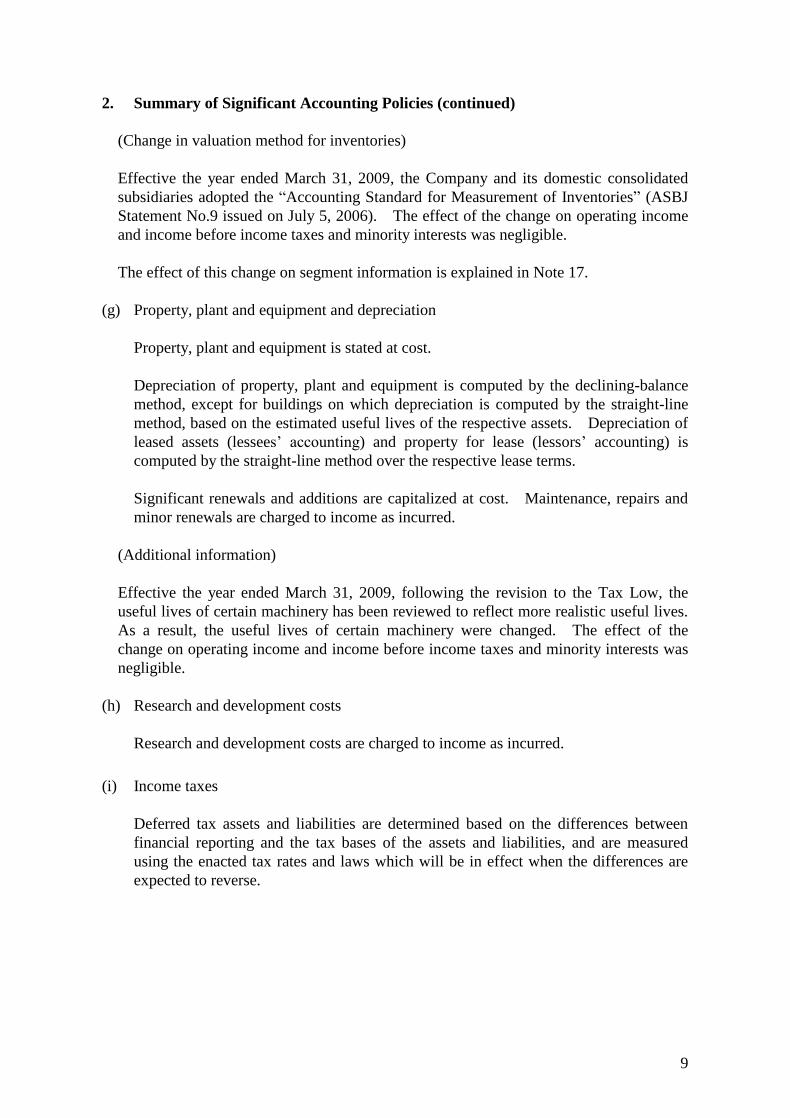
2. Summary of Significant Accounting Policies (continued)
(Change in valuation method for inventories)
Effective the year ended March 31, 2009, the Company and its domestic consolidated
subsidiaries adopted the “Accounting Standard for Measurement of Inventories” (ASBJ
Statement No.9 issued on July 5, 2006). The effect of the change on operating income
and income before income taxes and minority interests was negligible.
The effect of this change on segment information is explained in Note 17.
(g) Property, plant and equipment and depreciation
Property, plant and equipment is stated at cost.
Depreciation of property, plant and equipment is computed by the declining-balance
method, except for buildings on which depreciation is computed by the straight-line
method, based on the estimated useful lives of the respective assets. Depreciation of
leased assets (lessees’ accounting) and property for lease (lessors’ accounting) is
computed by the straight-line method over the respective lease terms.
Significant renewals and additions are capitalized at cost. Maintenance, repairs and
minor renewals are charged to income as incurred.
(Additional information)
Effective the year ended March 31, 2009, following the revision to the Tax Low, the
useful lives of certain machinery has been reviewed to reflect more realistic useful lives.
As a result, the useful lives of certain machinery were changed. The effect of the
change on operating income and income before income taxes and minority interests was
negligible.
(h) Research and development costs
Research and development costs are charged to income as incurred.
(i) Income taxes
Deferred tax assets and liabilities are determined based on the differences between
financial reporting and the tax bases of the assets and liabilities, and are measured
using the enacted tax rates and laws which will be in effect when the differences are
expected to reverse.
10
2. Summary of Significant Accounting Policies (continued)
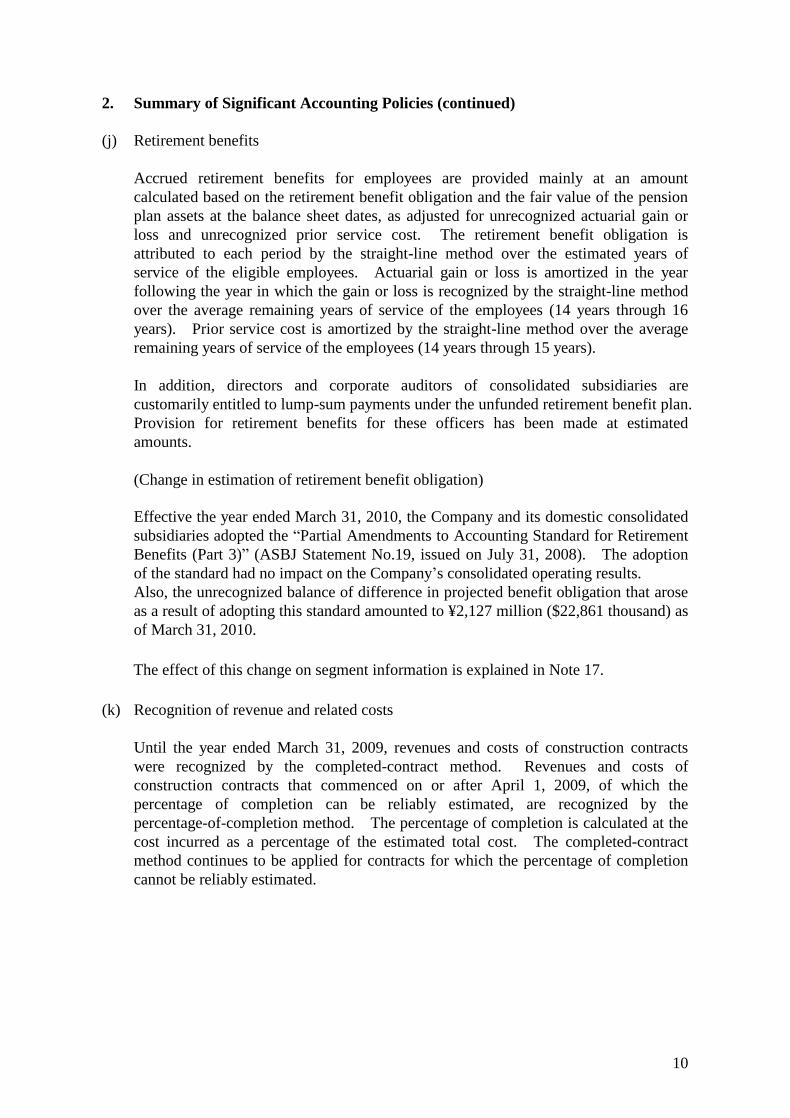
(j) Retirement benefits
Accrued retirement benefits for employees are provided mainly at an amount
calculated based on the retirement benefit obligation and the fair value of the pension
plan assets at the balance sheet dates, as adjusted for unrecognized actuarial gain or
loss and unrecognized prior service cost. The retirement benefit obligation is
attributed to each period by the straight-line method over the estimated years of
service of the eligible employees. Actuarial gain or loss is amortized in the year
following the year in which the gain or loss is recognized by the straight-line method
over the average remaining years of service of the employees (14 years through 16
years). Prior service cost is amortized by the straight-line method over the average
remaining years of service of the employees (14 years through 15 years).
In addition, directors and corporate auditors of consolidated subsidiaries are
customarily entitled to lump-sum payments under the unfunded retirement benefit plan.
Provision for retirement benefits for these officers has been made at estimated
amounts.
(Change in estimation of retirement benefit obligation)
Effective the year ended March 31, 2010, the Company and its domestic consolidated
subsidiaries adopted the “Partial Amendments to Accounting Standard for Retirement
Benefits (Part 3)” (ASBJ Statement No.19, issued on July 31, 2008). The adoption
of the standard had no impact on the Company’s consolidated operating results.
Also, the unrecognized balance of difference in projected benefit obligation that arose
as a result of adopting this standard amounted to ¥2,127 million ($22,861 thousand) as
of March 31, 2010.
The effect of this change on segment information is explained in Note 17.
(k) Recognition of revenue and related costs
Until the year ended March 31, 2009, revenues and costs of construction contracts
were recognized by the completed-contract method. Revenues and costs of
construction contracts that commenced on or after April 1, 2009, of which the
percentage of completion can be reliably estimated, are recognized by the
percentage-of-completion method. The percentage of completion is calculated at the
cost incurred as a percentage of the estimated total cost. The completed-contract
method continues to be applied for contracts for which the percentage of completion
cannot be reliably estimated.
11
2. Summary of Significant Accounting Policies (continued)
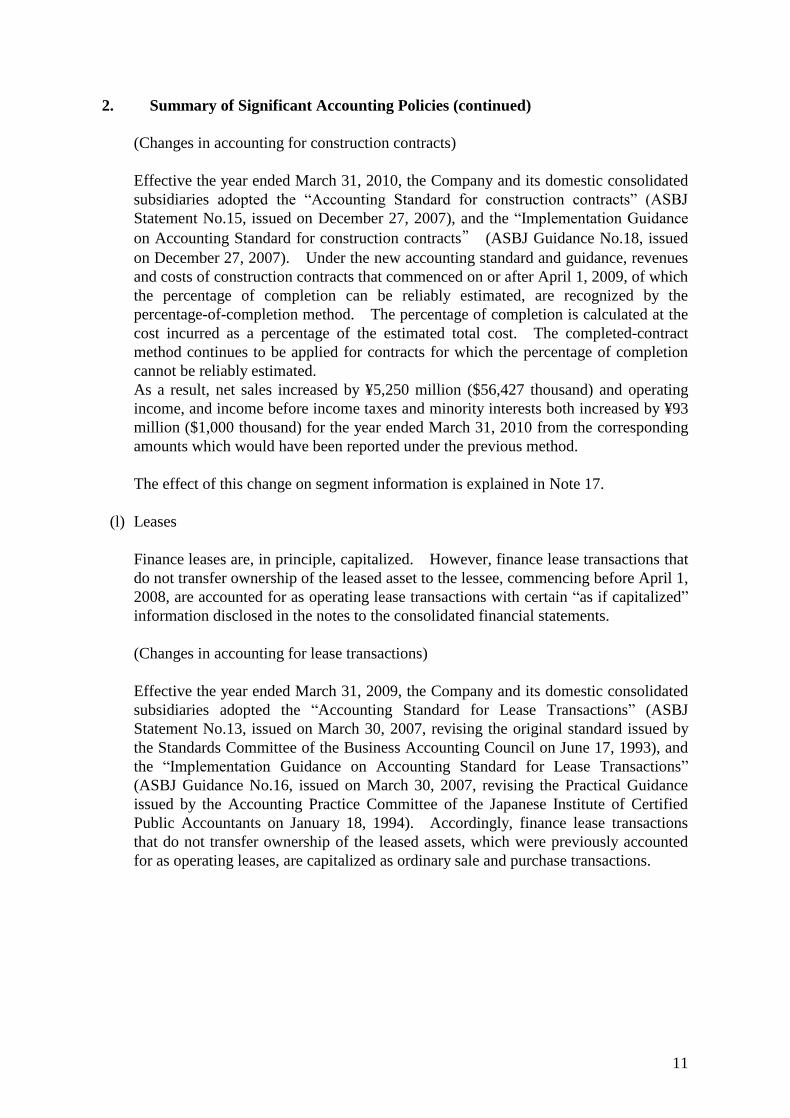
(Changes in accounting for construction contracts)
Effective the year ended March 31, 2010, the Company and its domestic consolidated
subsidiaries adopted the “Accounting Standard for construction contracts” (ASBJ
Statement No.15, issued on December 27, 2007), and the “Implementation Guidance
on Accounting Standard for construction contracts” (ASBJ Guidance No.18, issued
on December 27, 2007). Under the new accounting standard and guidance, revenues
and costs of construction contracts that commenced on or after April 1, 2009, of which
the percentage of completion can be reliably estimated, are recognized by the
percentage-of-completion method. The percentage of completion is calculated at the
cost incurred as a percentage of the estimated total cost. The completed-contract
method continues to be applied for contracts for which the percentage of completion
cannot be reliably estimated.
As a result, net sales increased by ¥5,250 million ($56,427 thousand) and operating
income, and income before income taxes and minority interests both increased by ¥93
million ($1,000 thousand) for the year ended March 31, 2010 from the corresponding
amounts which would have been reported under the previous method.
The effect of this change on segment information is explained in Note 17.
(l) Leases
Finance leases are, in principle, capitalized. However, finance lease transactions that
do not transfer ownership of the leased asset to the lessee, commencing before April 1,
2008, are accounted for as operating lease transactions with certain “as if capitalized”
information disclosed in the notes to the consolidated financial statements.
(Changes in accounting for lease transactions)
Effective the year ended March 31, 2009, the Company and its domestic consolidated
subsidiaries adopted the “Accounting Standard for Lease Transactions” (ASBJ
Statement No.13, issued on March 30, 2007, revising the original standard issued by
the Standards Committee of the Business Accounting Council on June 17, 1993), and
the “Implementation Guidance on Accounting Standard for Lease Transactions”
(ASBJ Guidance No.16, issued on March 30, 2007, revising the Practical Guidance
issued by the Accounting Practice Committee of the Japanese Institute of Certified
Public Accountants on January 18, 1994). Accordingly, finance lease transactions
that do not transfer ownership of the leased assets, which were previously accounted
for as operating leases, are capitalized as ordinary sale and purchase transactions.

12
2. Summary of Significant Accounting Policies (continued)
(l) Leases (continued)
-Lessees’ accounting
For finance lease transactions that do not transfer ownership, those commencing prior
to April 1, 2008 continue to be accounted for as operating leases. As a result, the
effect on operating income and income before income taxes and minority interests was
negligible.
-Lessors’ accounting
Regarding income from finance lease transactions, both sales revenues and cost of
sales are recognized when lease payments are received. For finance lease transaction
entered into prior to April 1, 2008 where ownership of the leased assets is not
transferred, lease investment assets are recognized at the amount of the book value of
the leased assets as of March 31, 2008 as if the finance leases were entered into at the
same amount on April 1, 2008. As a result, leases investment assets at March 31,
2009 increased by ¥12,711 million as compared with the corresponding amounts
which would have been recorded under the previous method, but the effect on
operating income and income before income taxes and minority interests was
negligible.
The effect of this change on segment information is explained in Note 17.
(m) Derivative financial instruments
The Company has invested in compound financial instruments with embedded
derivatives as part of its excess cash management. Derivative financial instruments
are carried at fair value with changes in unrealized gain or loss charged or credited to
operations.
(n) Adoption of new accounting standard
(Unification of accounting policies applied to foreign subsidiaries for the consolidated financial statements)
Effective the year ended March 31, 2009, the Company adopted the “Practical
Solution on Unification of Accounting Policies Applied to Foreign Subsidiaries for the
Consolidated Financial Statements” (ASBJ Practical Issues Task Force No.18, issued
on May 17, 2006). The adoption of the new accounting standard had no impact on
the Company’s consolidated operating results.
The effect of this change on segment information is explained in Note 17.
13
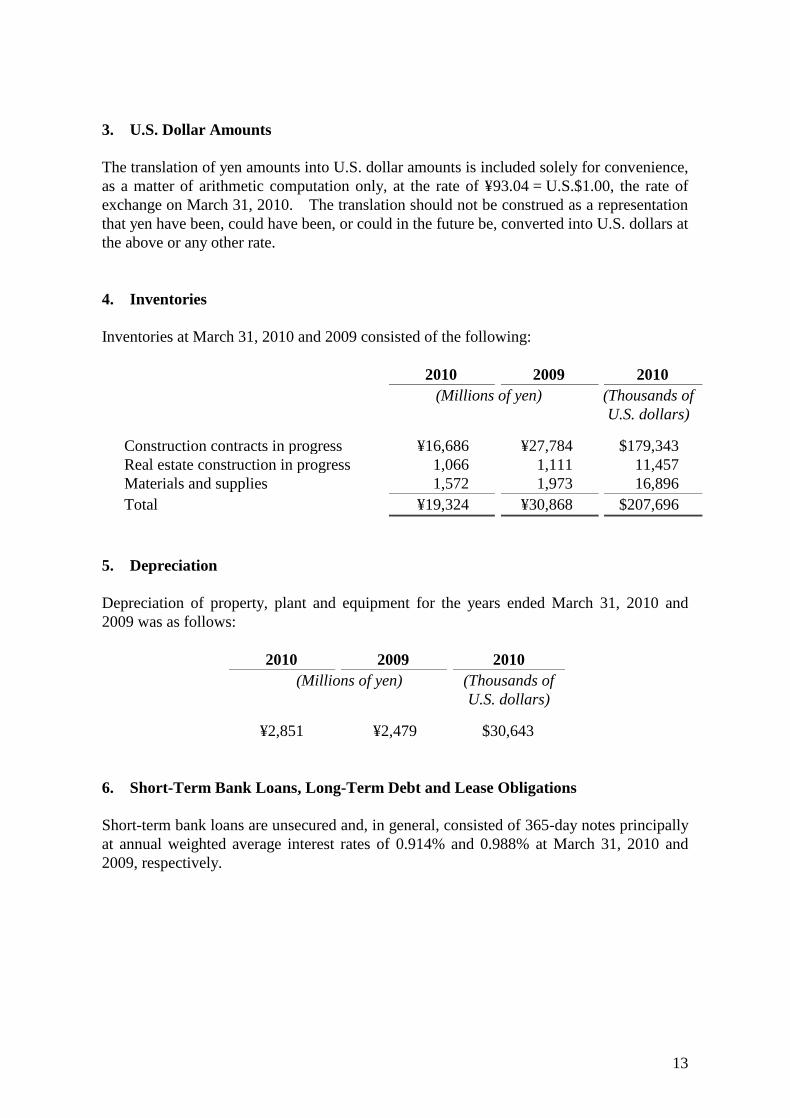
3. U.S. Dollar Amounts
The translation of yen amounts into U.S. dollar amounts is included solely for convenience,
as a matter of arithmetic computation only, at the rate of ¥93.04 = U.S.$1.00, the rate of
exchange on March 31, 2010. The translation should not be construed as a representation
that yen have been, could have been, or could in the future be, converted into U.S. dollars at
the above or any other rate.
4. Inventories
Inventories at March 31, 2010 and 2009 consisted of the following:
2010 2009 2010
(Millions of yen) (Thousands of
U.S. dollars)
Construction contracts in progress ¥16,686 ¥27,784 $179,343
Real estate construction in progress 1,066 1,111 11,457
Materials and supplies 1,572 1,973 16,896
Total ¥19,324 ¥30,868 $207,696
5. Depreciation
Depreciation of property, plant and equipment for the years ended March 31, 2010 and
2009 was as follows:
2010 2009 2010
(Millions of yen) (Thousands of
U.S. dollars)
¥2,851 ¥2,479 $30,643
6. Short-Term Bank Loans, Long-Term Debt and Lease Obligations
Short-term bank loans are unsecured and, in general, consisted of 365-day notes principally
at annual weighted average interest rates of 0.914% and 0.988% at March 31, 2010 and
2009, respectively.

14
6. Short-Term Bank Loans, Long-Term Debt and Lease Obligations (continued)
Long-term debt and lease obligations at March 31, 2010 and 2009 consisted of the
following:
2010 2009 2010
(Millions of yen) (Thousands of
U.S. dollars)
Loans from banks due through 2027
at interest rates ranging from 0.82%
to 3.50% ¥19,473 ¥21,311 $209,297
Lease obligations due through 2014 369 500 3,966
19,842 21,811 213,263
Less current portion (7,642) (6,168) (82,137)
¥12,200 ¥15,643 $131,126
The aggregate annual maturities of long-term debt and lease obligations subsequent to
March 31, 2010 are summarized as follows:
Year ending March 31,
(Millions of
yen)
(Thousands of
U.S. dollars)
2011 ¥ 7,642 $ 82,137
2012 5,564 59,802
2013 3,423 36,791
2014 1,737 18,669
2015 764 8,211
2016 and thereafter 712 7,653
¥19,842 $213,263
7. Shareholders’ Equity
The Corporation Law of Japan provides that an amount equal to 10% of the amount to be
distributed as distributions of capital surplus (other than the capital reserve) and retained
earnings (other than the legal reserve) be transferred to the capital reserve and the legal
reserve, respectively, until the sum of the capital reserve and the legal reserve equals 25%
of the common stock account. Such distributions can be made at any time by resolution of
the shareholders or by the Board of Directors if certain conditions are met, but neither the
capital reserve nor the legal reserve is available for distributions.
The following distribution of retained earnings of the Company, which have not been
reflected in the accompanying consolidated financial statements for the year ended March
31, 2010, was approved at a meeting of the Board of Directors held on May 12, 2010:
(Millions of
yen)
(Thousands of
U.S. dollars)
Cash dividends (¥5 = $0.05 per share) ¥372 $3,998

15
8. Income Taxes
Income taxes applicable to the Company and its domestic consolidated subsidiaries
comprise corporation, enterprise and inhabitants’ taxes which, in the aggregate, resulted in
a statutory tax rate of 40.44% for the years ended March 31, 2010 and 2009.
The effective tax rate reflected in the consolidated statements of income for the year ended
March 31, 2009 differed from the statutory tax rate for the following reasons:
2009
Statutory tax rate 40.44%
Effect of:
Expenses permanently not deductible for
income tax purposes
22.36
Dividend income deductible for income tax purposes (3.03)
Inhabitants’ per capita taxes 6.89
Equity in earnings of affiliates and other consolidation
adjustments
(1.02)
Valuation allowance 0.91
Other, net (5.60)
Effective tax rate 60.95%
In fiscal year 2010, there is no significant difference between the effective tax rate and the
statutory tax rate.
The significant components of deferred tax assets and liabilities as of March 31, 2010 and
2009 were as follows:
2010 2009 2010
(Millions of yen) (Thousands of U.S. dollars)
Deferred tax assets: Accrued bonuses ¥ 2,216 ¥ 2,210 $ 23,818 Accrued retirement benefits 10,044 10,608 107,954 Payables relating to defined
contribution plans
905
1,509
9,727 Depreciation of noncurrent assets 909 1,074 9,769 Allowance for doubtful receivables 1,159 1,453 12,457 Other 4,807 5,010 51,666
Gross deferred tax assets 20,040 21,864 215,391 Valuation allowance (4,294) (4,889) (46,152)
Total deferred tax assets 15,746 16,975 169,239
Deferred tax liabilities: Reserve under Special Taxation Measures Law
(1,725)
(1,659)
(18,540)
Net unrealized gain on other securities (561) - (6,030)
Other (410) (422) (4,407)
Total deferred tax liabilities (2,696) (2,081) (28,977)
Net deferred tax assets ¥13,050 ¥14,894 $140,262

16
9. Retirement Benefit Plans
The Company and its domestic consolidated subsidiaries have defined contribution plans as
well as defined benefit plans, that are corporate pension plans, welfare pension fund plans
(“WPFP”), and lump-sum payment plans, covering substantially all employees who are
entitled to lump-sum or annuity payments, the amounts of which are determined by
reference to their basic rates of pay, length of service, and the conditions under which
termination occurs.
The following table sets forth the funded and accrued status of the plans, and the amounts
recognized in the consolidated balance sheets as of March 31, 2010 and 2009 for the
Company’s and the consolidated subsidiaries’ defined benefit plans:
2010 2009 2010
(Millions of yen) (Thousands of U.S. dollars)
Retirement benefit obligation ¥(51,393) ¥(51,163) $(552,375) Plan assets at fair value 20,534 20,251 220,700
Unfunded retirement benefit obligation (30,859) (30,912) (331,675) Unrecognized actuarial loss 13,555 13,917 145,690 Unrecognized prior service cost (8,779) (9,808) (94,357)
Net retirement benefit obligation (26,083) (26,803) (280,342) Prepaid pension expense (15) (16) (161)
Accrued retirement benefits ¥(26,098) ¥(26,819) $(280,503)
The components of retirement benefit expenses for the years ended March 31, 2010 and
2009 are outlined as follows:
2010 2009 2010
(Millions of yen) (Thousands of U.S. dollars)
Service cost ¥ 2,451 ¥ 2,575 $ 26,343 Interest cost 1,136 1,172 12,210 Expected return on plan assets (566) (697) (6,083) Amortization of actuarial loss 1,520 1,244 16,337 Amortization of prior service cost (1,029) (1,029) (11,059)
Subtotal 3,512 3,265 37,748 Contributions made to defined contribution plans
366
367
3,933
Total ¥ 3,878 ¥ 3,632 $41,681
In addition to the above retirement benefit expenses, additional retirement allowances of
¥101 million ($1,085 thousand) and ¥236 million were paid for the years ended March 31,
2010 and 2009, respectively.
The assumptions used in the accounting for the above plans are as follows:
2010 2009
Discount rate 2.00% 2.50% Expected rate of return on plan assets 3.50% 3.50%

17
10. Research and Development Costs
Research and development costs included in cost of sales and selling, general and
administrative expenses for the years ended March 31, 2010 and 2009 amounted to ¥269
million ($2,891 thousand) and ¥275 million, respectively.
11. Amounts per Share
2010 2009 2010
(Yen) (U.S. dollars)
Net income ¥ 55.12 ¥ 12.07 $0.59 Cash dividends 12.00 10.00 0.13 Net assets 1,202.57 1,148.17 12.92
Net income per share is computed based on the net income available for distribution to
shareholders of common stock and the weighted average number of shares of common
stock outstanding during the year, and amounts per share of net assets are computed based
on the net assets excluding minority interests and the number of shares of common stock
outstanding at the year end.
Cash dividends per share represent the cash dividends declared as applicable to the
respective years, together with the interim cash dividends paid.
12. Leases
(Lessors’ accounting)
a) Finance leases
Lease investment assets at March 31, 2010 and 2009 consist of follows:
2010 2009 2010
(Millions of yen)
(Millions of yen)
(Thousands of U.S. dollars)
Minimum lease payments receivable ¥14,738 ¥15,792 $158,405 Estimated residual value 680 669 7,308 Future interest income (3,403) (3,750) (36,575)
Total ¥12,015 ¥12,711 $129,138
18
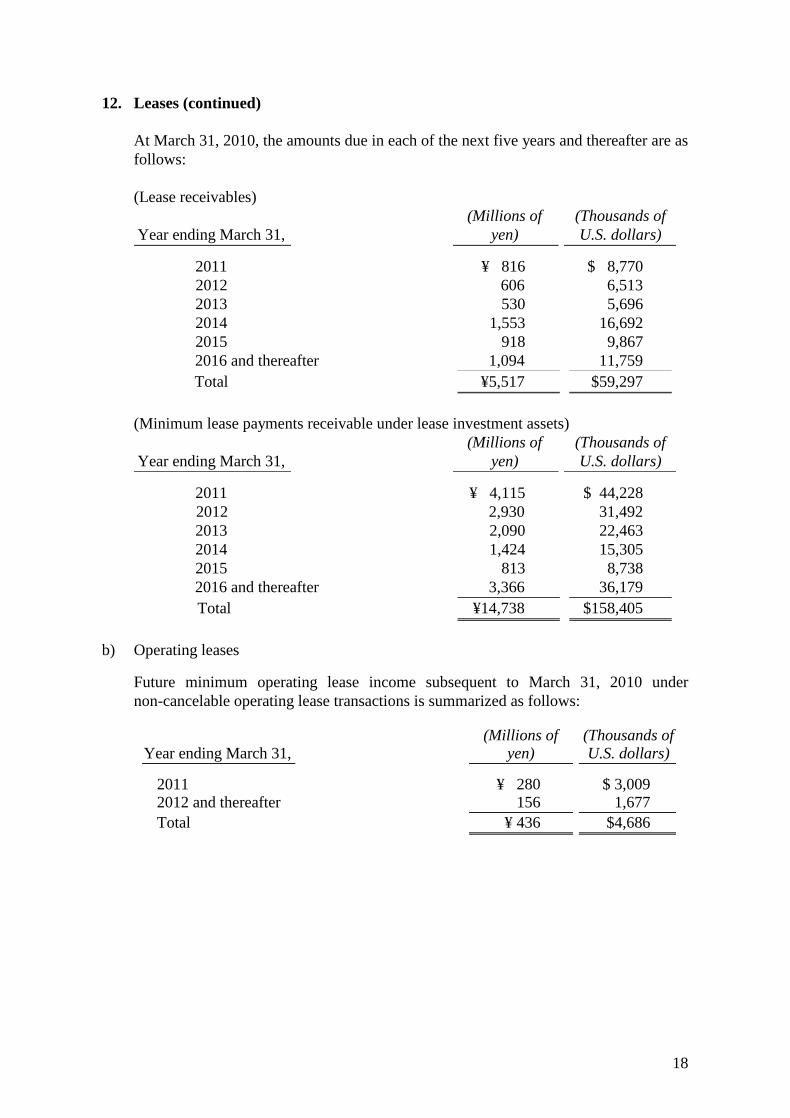
12. Leases (continued)
At March 31, 2010, the amounts due in each of the next five years and thereafter are as
follows:
(Lease receivables)
Year ending March 31,
(Millions of
yen)
(Thousands of
U.S. dollars)
2011 ¥ 816 $ 8,770
2012 606 6,513
2013 530 5,696
2014 1,553 16,692
2015 918 9,867
2016 and thereafter 1,094 11,759
Total ¥5,517 $59,297
(Minimum lease payments receivable under lease investment assets)
Year ending March 31,
(Millions of
yen)
(Thousands of
U.S. dollars)
2011 ¥ 4,115 $ 44,228
2012 2,930 31,492
2013 2,090 22,463
2014 1,424 15,305
2015 813 8,738
2016 and thereafter 3,366 36,179
Total ¥14,738 $158,405
b) Operating leases Future minimum operating lease income subsequent to March 31, 2010 under
non-cancelable operating lease transactions is summarized as follows:
Year ending March 31,
(Millions of yen)
(Thousands of U.S. dollars)
2011 ¥ 280 $ 3,009 2012 and thereafter 156 1,677
Total ¥ 436 $4,686
19
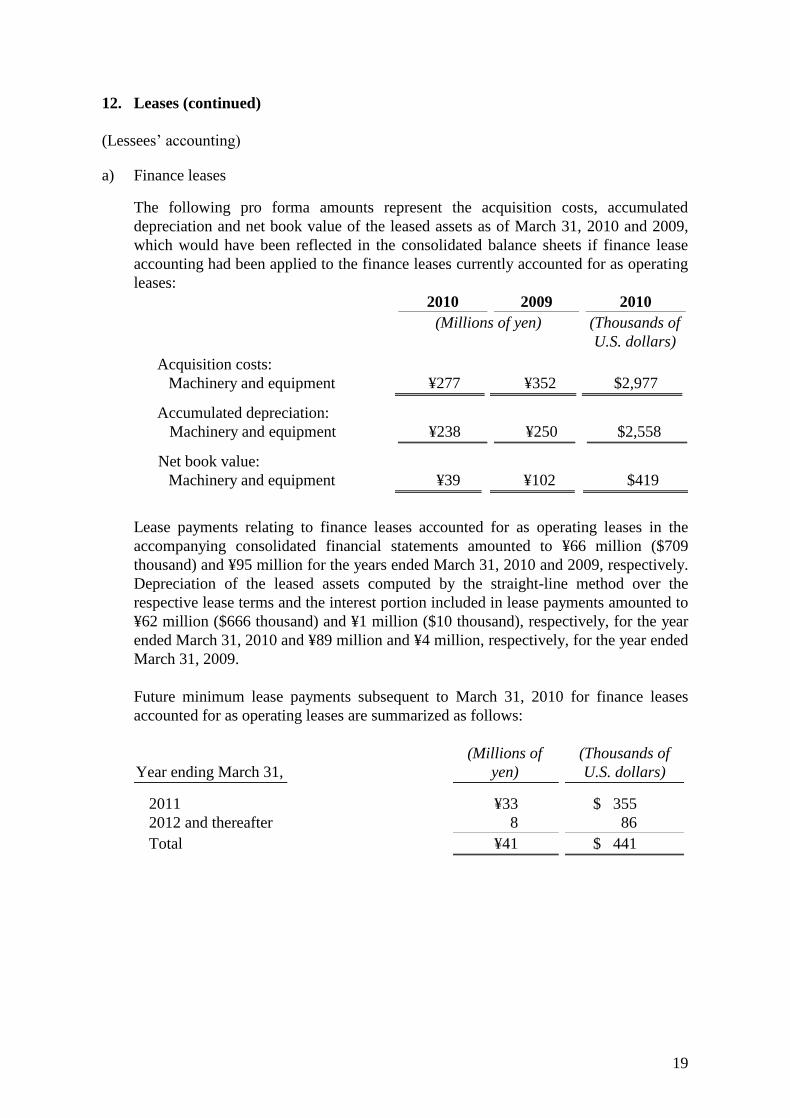
12. Leases (continued)
(Lessees’ accounting)
a) Finance leases The following pro forma amounts represent the acquisition costs, accumulated
depreciation and net book value of the leased assets as of March 31, 2010 and 2009,
which would have been reflected in the consolidated balance sheets if finance lease
accounting had been applied to the finance leases currently accounted for as operating
leases:
2010 2009 2010
(Millions of yen) (Thousands of
U.S. dollars)
Acquisition costs:
Machinery and equipment ¥277 ¥352 $2,977
Accumulated depreciation:
Machinery and equipment ¥238 ¥250 $2,558
Net book value:
Machinery and equipment ¥39 ¥102 $419
Lease payments relating to finance leases accounted for as operating leases in the
accompanying consolidated financial statements amounted to ¥66 million ($709
thousand) and ¥95 million for the years ended March 31, 2010 and 2009, respectively.
Depreciation of the leased assets computed by the straight-line method over the
respective lease terms and the interest portion included in lease payments amounted to
¥62 million ($666 thousand) and ¥1 million ($10 thousand), respectively, for the year
ended March 31, 2010 and ¥89 million and ¥4 million, respectively, for the year ended
March 31, 2009.
Future minimum lease payments subsequent to March 31, 2010 for finance leases
accounted for as operating leases are summarized as follows:
Year ending March 31,
(Millions of
yen)
(Thousands of
U.S. dollars)
2011 ¥33 $ 355
2012 and thereafter 8 86
Total ¥41 $ 441

20
13. Contingent Liabilities
The Company and its consolidated subsidiaries had the following contingent liabilities at
March 31, 2010:
(Millions of
yen)
(Thousands of
U.S. dollars)
Trade notes receivable endorsed and
discounted with banks
¥ 27
$ 290
Guarantees of indebtedness 1,602 17,218
21
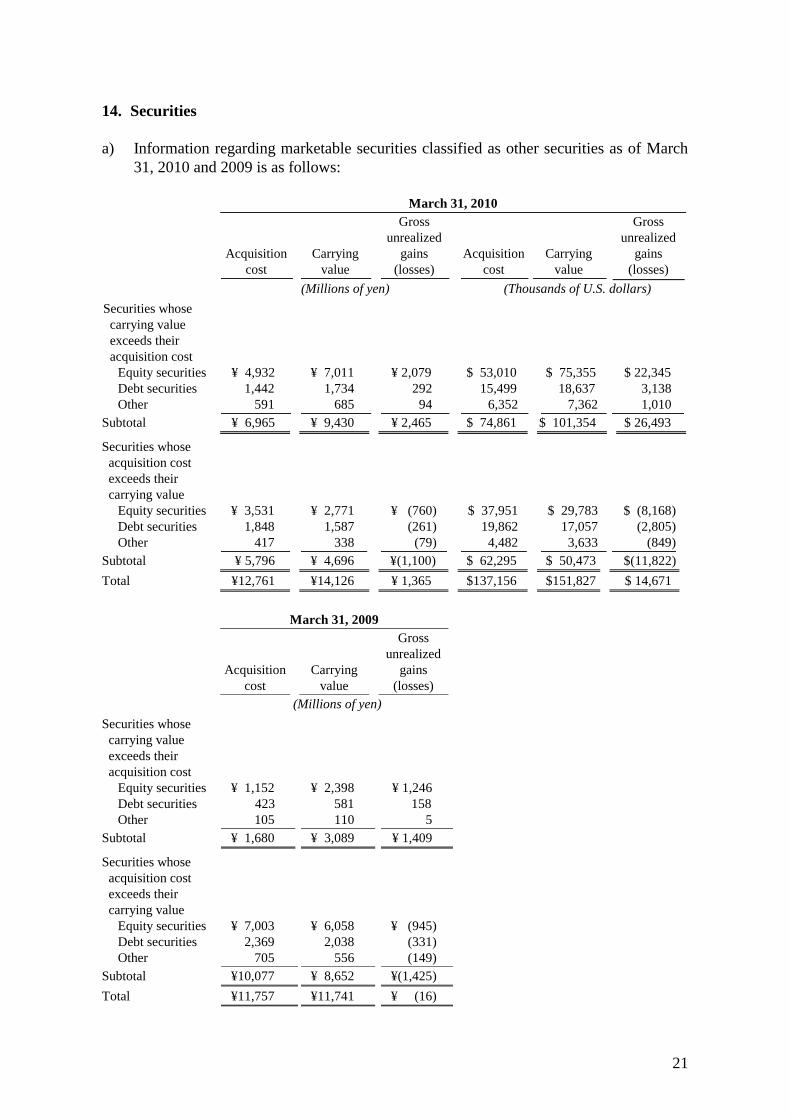
14. Securities
a) Information regarding marketable securities classified as other securities as of March
31, 2010 and 2009 is as follows:
March 31, 2010
Acquisition
cost
Carrying
value
Gross
unrealized
gains
(losses)
Acquisition
cost
Carrying
value
Gross
unrealized
gains
(losses)
(Millions of yen) (Thousands of U.S. dollars)
Securities whose
carrying value
exceeds their
acquisition cost
Equity securities ¥ 4,932 ¥ 7,011 ¥ 2,079 $ 53,010 $ 75,355 $ 22,345
Debt securities 1,442 1,734 292 15,499 18,637 3,138
Other 591 685 94 6,352 7,362 1,010
Subtotal ¥ 6,965 ¥ 9,430 ¥ 2,465 $ 74,861 $ 101,354 $ 26,493
Securities whose
acquisition cost
exceeds their
carrying value
Equity securities ¥ 3,531 ¥ 2,771 ¥ (760) $ 37,951 $ 29,783 $ (8,168)
Debt securities 1,848 1,587 (261) 19,862 17,057 (2,805)
Other 417 338 (79) 4,482 3,633 (849)
Subtotal ¥ 5,796 ¥ 4,696 ¥(1,100) $ 62,295 $ 50,473 $(11,822)
Total ¥12,761 ¥14,126 ¥ 1,365 $137,156 $151,827 $ 14,671
March 31, 2009
Acquisition
cost
Carrying
value
Gross
unrealized
gains
(losses)
(Millions of yen)
Securities whose
carrying value
exceeds their
acquisition cost
Equity securities ¥ 1,152 ¥ 2,398 ¥ 1,246
Debt securities 423 581 158
Other 105 110 5
Subtotal ¥ 1,680 ¥ 3,089 ¥ 1,409
Securities whose
acquisition cost
exceeds their
carrying value
Equity securities ¥ 7,003 ¥ 6,058 ¥ (945)
Debt securities 2,369 2,038 (331)
Other 705 556 (149)
Subtotal ¥10,077 ¥ 8,652 ¥(1,425)
Total ¥11,757 ¥11,741 ¥ (16)

22
14. Securities (continued)
b) Information regarding sales of securities classified as other securities for the years
ended March 31, 2010 and 2009 is as follows:
2010 2009 2010
(Millions of yen) (Thousands of
U.S. dollars)
Proceeds from sales ¥ 400 ¥1,192 $4,299
Gains on sales 72 25 774
Losses on sales 9 56 97
15. Financial Instrument
Effective from the fiscal year ended March 31, 2010, the Company has adopted the
“Accounting Standard for Financial Instruments” (ASBJ Statement No. 10, issued on
March 10, 2008) and the “Guidance on Disclosure about Fair Value of Financial
Instruments” (ASBJ Guidance No.19, issued on March 10, 2008).
a) Policy for financial instruments
The Company and its consolidated subsidiaries utilize short-term deposits for surplus fund.
In addition, it raises funds through borrowing from financial institutions. Derivative
transactions are only used to reduce risks, except highly secure embedded derivative in a
compound financial instrument for surplus fund.
b) Detail of financial instruments, related risk and risk management system
Trade receivables, such as trade notes, accounts receivable, lease receivables and lease
investment assets, are exposed to credit risk. The Company and its consolidated
subsidiaries monitor the due dates and manage credit risk under the credit management
rules to mitigate the risk.
Investment securities mainly consist of equity securities and are exposed to market risk.
The Company and its consolidated subsidiaries review the fair values of listed equity
securities quarterly and the financial condition of the issuing entities.
Trade payable such as trade notes and accounts payable have payment due dates mainly
within 1 year.
Short-term loan and long term debt is taken out mainly for the purpose of making capital
investments for leasing business segment.
The Company and its consolidated subsidiaries execute and manage derivative transactions
within the limits of established internal rules and regulations, and reduce credit risk by
limiting counterparties to highly creditworthy financial institutions.
23
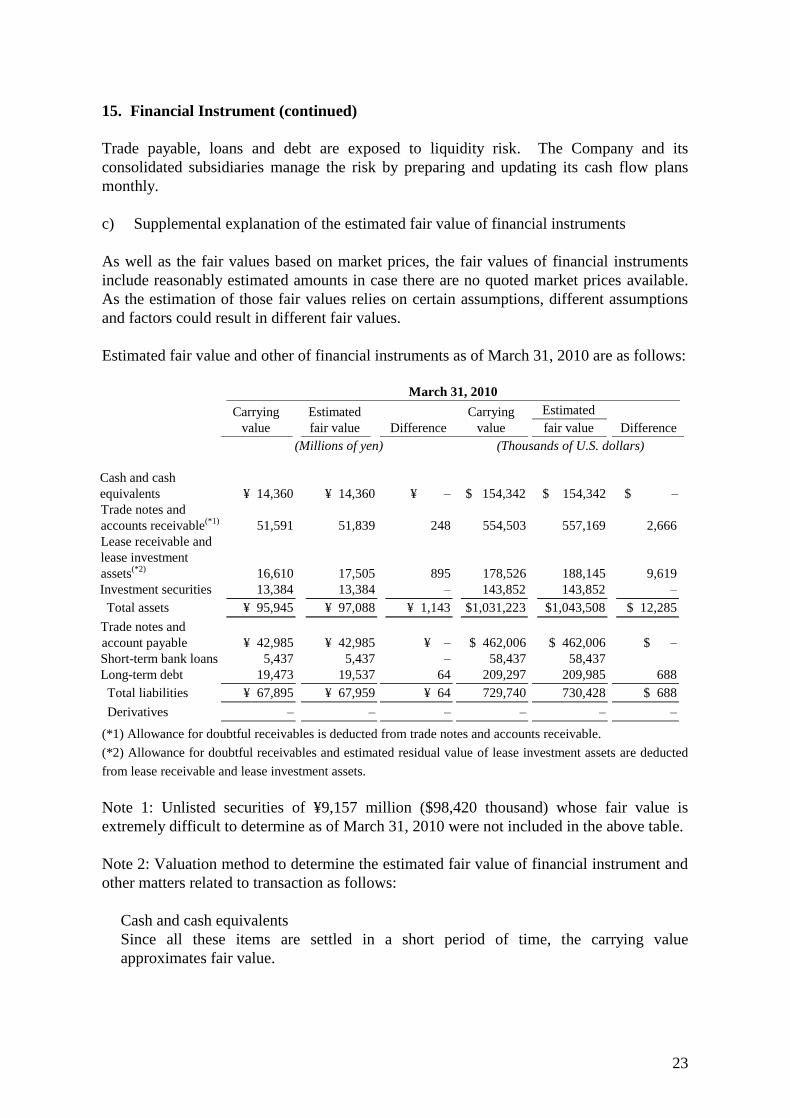
15. Financial Instrument (continued)
Trade payable, loans and debt are exposed to liquidity risk. The Company and its
consolidated subsidiaries manage the risk by preparing and updating its cash flow plans
monthly.
c) Supplemental explanation of the estimated fair value of financial instruments
As well as the fair values based on market prices, the fair values of financial instruments
include reasonably estimated amounts in case there are no quoted market prices available.
As the estimation of those fair values relies on certain assumptions, different assumptions
and factors could result in different fair values.
Estimated fair value and other of financial instruments as of March 31, 2010 are as follows:
March 31, 2010
Carrying
value
Estimated
fair value Difference
Carrying
value
Estimated
fair value Difference
(Millions of yen)
(Thousands of U.S. dollars)
Cash and cash
equivalents ¥ 14,360 ¥ 14,360 ¥ – $ 154,342 $ 154,342 $ –
Trade notes and
accounts receivable(*1)
51,591 51,839 248 554,503 557,169 2,666
Lease receivable and
lease investment
assets(*2)
16,610 17,505 895 178,526 188,145 9,619
Investment securities 13,384 13,384 – 143,852 143,852 –
Total assets ¥ 95,945 ¥ 97,088 ¥ 1,143 $1,031,223 $1,043,508 $ 12,285
Trade notes and
account payable ¥ 42,985 ¥ 42,985 ¥ – $ 462,006 $ 462,006 $ –
Short-term bank loans 5,437 5,437 – 58,437 58,437
Long-term debt 19,473 19,537 64 209,297 209,985 688
Total liabilities ¥ 67,895 ¥ 67,959 ¥ 64 729,740 730,428 $ 688
Derivatives – – – – – –
(*1) Allowance for doubtful receivables is deducted from trade notes and accounts receivable.
(*2) Allowance for doubtful receivables and estimated residual value of lease investment assets are deducted
from lease receivable and lease investment assets.
Note 1: Unlisted securities of ¥9,157 million ($98,420 thousand) whose fair value is
extremely difficult to determine as of March 31, 2010 were not included in the above table.
Note 2: Valuation method to determine the estimated fair value of financial instrument and
other matters related to transaction as follows:
Cash and cash equivalents
Since all these items are settled in a short period of time, the carrying value
approximates fair value.

24
15. Financial Instrument (continued)
Trade notes and accounts receivable
If these items are settled in a short period of time, the carrying value approximates fair
value. The fair value of loans receivable generated in leasing business segment is
based on the present value of the future cash flow discounted by the interest rate to be
applied if similar new loans were entered into.
Lease receivable and lease investment assets
The fair value of these items is based on the present value of the future cash flow
discounted by the interest rate to be applied if similar new lease contract were entered
into.
Investment securities
The fair value of stocks is based on quoted market prices. The fair value of debt
securities is based on either quoted market prices or prices provided by the financial
institutions making markets in these securities. The fair value of investment trusts is
based on constant value. In cases where an embedded derivative in a compound
financial instrument is unable to be separately measured, the entire compound financial
instrument is measured at fair value. For information on securities classified by
holding purpose, please refer to Note14.
Trade notes and account payable and short-term bank loans
Since all these items are settled in a short period of time, the carrying value
approximates fair value.
Long-term debt
The fair value of these items is based on the present value of the total of principal and
interest discounted by the interest rate to be applied if similar new borrowing were
entered into.
d) Redemption schedule for receivables and marketable securities with maturities at
March 31, 2010
March 31, 2010
Due in
one year
or less
Due after
one year
through
five years
Due after
five years
through
ten years
Due after
ten years
(Millions of yen)
Deposits ¥ 14,409 ¥ – ¥ – ¥ –
Trade notes and accounts
receivable 48,028 2,793 735 278
Lease receivable and lease
investment assets 4,330 9,582 2,120 820
Investment securities
Other securities with
maturities (debt securities) 650 675 379 1,993
Other securities with
maturities (Other) 262 261 310 50
Total ¥ 67,679 ¥ 13,311 ¥ 3,544 ¥ 3,141

25
15. Financial Instrument (continued)
March 31, 2010
Due in
one year
or less
Due after
one year
through
five years
Due after
five years
through
ten years
Due after
ten years
(Thousands of U.S. dollars)
Deposits $ 154,869 $ – $ – $ –
Trade notes and accounts
receivable 516,208 30,019 7,900 2,988
Lease receivable and lease
investment assets 46,539 102,988 22,786 8,814
Investment securities
Other securities with
maturities (debt securities) 6,986 7,255 4,073 21,421
Other securities with
maturities (Other) 2,816 2,805 3,332 537
Total $ 727,418 $ 143,067 $ 38,091 $ 33,760
e) The redemption schedule for long-term debt is disclosed in Note 6.
16. Related Party Transactions
Consolidated net sales included those to Kyushu Electric Power Co., Inc. who has an
approximately 30% ownership interest in the Company, in the amounts of ¥54,079 million
($581,245 thousand) and ¥56,071 million for the years ended March 31, 2010 and 2009,
respectively. The related receivables at March 31, 2010 and 2009 amounted to ¥8,478
million ($91,122 thousand) and ¥7,929 million, respectively.
The terms of the transactions referred to above were negotiated and determined on an
arm’s-length basis.

26
17. Segment Information
The Company and its consolidated subsidiaries are primarily engaged in the equipment
construction business in Japan. The business segment information of the Company and its
consolidated subsidiaries for the years ended March 31, 2010 and 2009 is as follows:
Year ended March 31, 2010
Equipment
construction
work Leasing Other Total Eliminations Consolidated
(Millions of yen)
I. Sales and operating income
Sales to third parties ¥212,354 ¥ 7,224 ¥ 6,313 ¥225,891 ¥ – ¥225,891
Intersegment sales and
transfers
1,189
2,742
15,147
19,078
(19,078)
–
Total sales 213,543 9,966 21,460 244,969 (19,078) 225,891
Operating expenses 208,903 9,314 21,203 239,420 (18,972) 220,448
Operating income ¥ 4,640 ¥ 652 ¥ 257 ¥ 5,549 ¥ (106) ¥ 5,443
II. Assets, depreciation and
capital expenditures
Total assets ¥181,689 ¥31,089 ¥16,645 ¥229,423 ¥(16,861) ¥212,562
Depreciation and
amortization 2,249 132 504 2,885 (34) 2,851
Capital expenditures 3,282 194 1,362 4,838 (89) 4,749
Year ended March 31, 2010
Equipment
construction
work Leasing Other Total Eliminations Consolidated
(Thousands of U.S. dollars)
I. Sales and operating income
Sales to third parties $2,282,395 $ 77,644 $ 67,852 $2,427,891 $ – $2,427,891
Intersegment sales and
transfers
12,779
29,471
162,802
205,052
(205,052)
–
Total sales 2,295,174 107,115 230,654 2,632,943 (205,052) 2,427,891
Operating expenses 2,245,303 100,107 227,892 2,573,302 (203,913) 2,369,389
Operating income $ 49,871 $ 7,008 $ 2,762 $ 59,641 $ (1,139) $ 58,502
II. Assets, depreciation and
capital expenditures
Total assets $1,952,805 $334,147 $178,901 $2,465,853 $(181,223) $2,284,630
Depreciation and
amortization 24,172 1,419 5,417 31,008 (365) 30,643
Capital expenditures 35,275 2,085 14,639 51,999 (957) 51,042

27
17. Segment Information (continued)
Year ended March 31, 2009
Equipment
construction
work Leasing Other Total Eliminations Consolidated
(Millions of yen)
I. Sales and operating income
Sales to third parties ¥231,696 ¥ 7,513 ¥ 6,179 ¥245,388 ¥ – ¥245,388
Intersegment sales and
transfers
466
2,735
18,495
21,696
(21,696)
–
Total sales 232,162 10,248 24,674 267,084 (21,696) 245,388
Operating expenses 225,874 9,677 24,444 259,995 (21,622) 238,373
Operating income ¥ 6,288 ¥ 571 ¥ 230 ¥ 7,089 ¥ (74) ¥ 7,015
II. Assets, depreciation and
capital expenditures
Total assets ¥191,140 ¥32,318 ¥17,034 ¥240,492 ¥(16,617) ¥223,875
Depreciation and
amortization 2,084 114 314 2,512 (33) 2,479
Capital expenditures 2,578 196 1,530 4,304 (46) 4,258
(Change in valuation method for inventories)
As described in Note 2(f), effective the year ended March 31, 2009, the Company and its
domestic consolidated subsidiaries adopted the “Accounting Standard for Measurement of
Inventories” (ASBJ Statement No.9 issued on July 5, 2006). The effect of the change on
operating income of each segment was negligible.
(Changes in accounting for lease transactions)
As described in Note 2(l), effective the year ended March 31, 2009, the Company and its
domestic consolidated subsidiaries adopted the “Accounting Standard for Lease
Transactions” (ASBJ Statement No.13, issued on March 30, 2007, revising the original
standard issued by the Standards Committee of the Business Accounting Council on June
17, 1993), and the “Implementation Guidance on Accounting Standard for Lease
Transactions” (ASBJ Guidance No.16, issued on March 30, 2007, revising the Practical
Guidance issued by the Accounting Practice Committee of the Japanese Institute of
Certified Public Accountants on January 18, 1994). The effect of the change on operating
income of each segment was negligible.
(Unification of accounting policies applied to foreign subsidiaries for the consolidated
financial statements)
As described in Note 2(n), effective the year ended March 31, 2009, the Company adopted
the “Practical Solution on Unification of Accounting Policies Applied to Foreign
Subsidiaries for the Consolidated Financial Statements” (ASBJ Practical Issues Task Force
No.18, issued on May 17, 2006). There was no effect on segment operating income as a
result of this change.
28
17. Segment Information (continued)
(Changes in accounting for construction contracts)
As described in Note 2(k), effective the year ended March 31, 2010, the Company and its
domestic consolidated subsidiaries adopted the “Accounting Standard for construction
contracts” (ASBJ Statement No.15, issued on December 27, 2007) and the
“Implementation Guidance on Accounting Standard for construction contracts” (ASBJ
Guidance No.18, issued on December 27, 2007).
As a result, net sales increased by ¥5,250 million ($56,427 thousand) and operating income
increased by ¥93 million ($1,000 thousand) on the equipment construction work segment
for the year ended March 31, 2010 from the corresponding amounts which would have been
reported under the previous method.
(Change in estimation of retirement benefit obligation)
As described in Note 2(j), effective the year ended March 31, 2010, the Company and its
domestic consolidated subsidiaries adopted the “Partial Amendments to Accounting
Standard for Retirement Benefits (Part 3)” (ASBJ Statement No.19, issued on July 31,
2008). There was no effect on segment operating income as a result of this change.
The disclosure of geographical segment information has been omitted as net sales and total
assets of the foreign operations constituted less than 10% of the consolidated totals for both
years ended March 31, 2010 and 2009.
Overseas sales of the Company and its consolidated subsidiaries constituted less than 10%
of the consolidated net sales for both years ended March 31, 2010 and 2009.
18. Subsequent Events
33 domestic subsidiaries have participated in the Kyudenko Group Pension Fund, which is
a multi-employer contributory welfare pension plan (a defined benefit pension plan under
the Japanese Welfare Pension Insurance Low) administrated by Kyudenko group
companies.
On May 31, 2010, the Kyudenko Group Pension Fund offered an exemption to the Minister
of Health, Labor and Welfare for relieving the benefit obligation of substitutional portion of
the plan related to future employee services in accordance with the Law Concerning
Defined Benefit Corporate Pension Plans.
If this offering is granted, the Kyudenko Group Pension Fund intends to be granted an
exemption for a return of the benefit obligation of substitutional portion of the plan related
to past employee service in the fiscal year starting from April 1, 2010. The detail schedule
and the impact on operating results has not been determined yet.