consolidated financial results for the first quarter ended march 31, 2011 · 2017. 11. 21. · 2...
TRANSCRIPT

1

2
AgendaAgenda
■ Outline of Consolidated Financial Results for the First Quarter Ended March 31, 2011
■ Consolidated Financial Results for the First QuarterEnded March 31, 2011 by Business Segment
● Notice regarding the forecast consolidated results: Forecast consolidated results stated herein are based on the management’s assumptions and beliefs in light of the information currently available, and involve risks and uncertainties. Please be advised that actual results may differ significantly from those discussed in the forecast consolidated results.Potential risks and uncertainties include, but are not limited to, general economic conditions in Yamaha Motor’s major markets, changing consumer preferences, and currency exchange rate fluctuations.

3
Outline of Consolidated Financial Results for the First Quarter
Ended March 31, 2011
Outline of Consolidated Financial Results for the First Quarter
Ended March 31, 2011
Kozo ShinozakiDirector
Kozo ShinozakiDirector
4
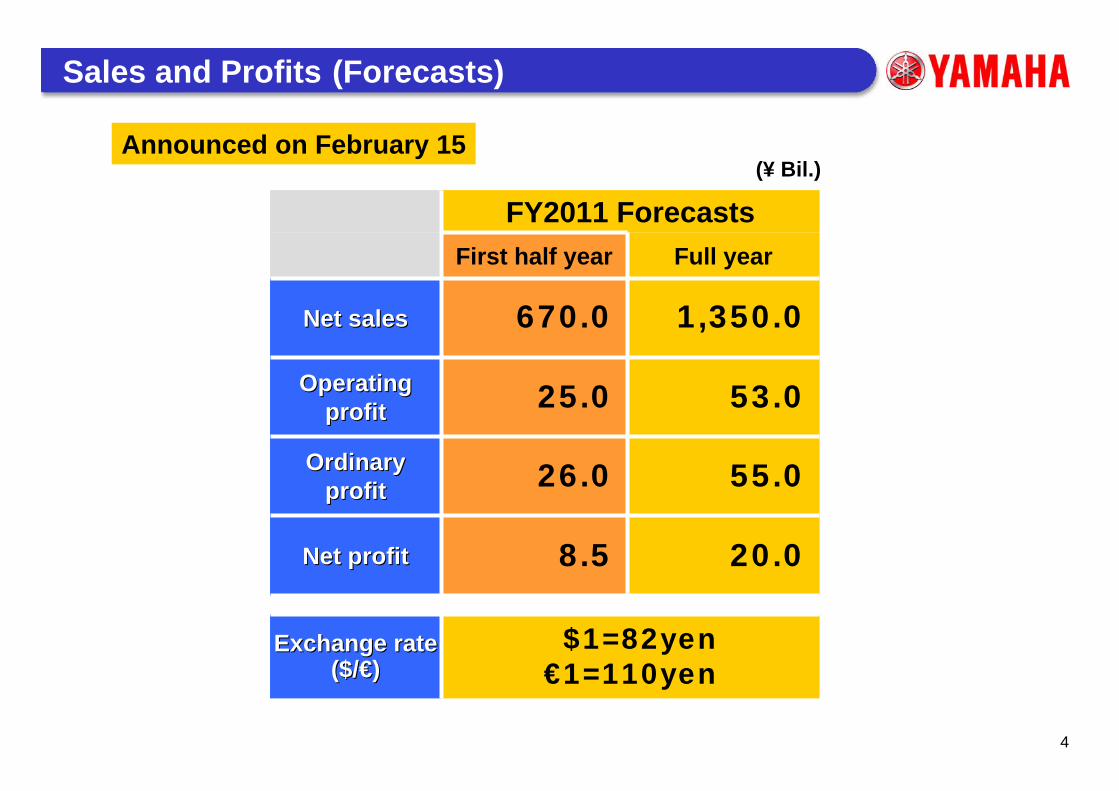
FY2011 Forecasts
$1=82yen€1=110yen
20.0
55.0
53.0
1,350.0
Full year
8.5
26.0
25.0
670.0
First half year
Exchange rateExchange rate($/($/€€))
0
Net profitNet profit
OrdinaryOrdinaryprofitprofit
Operating Operating profitprofit
Net salesNet sales
Sales and Profits (Forecasts)
Announced on February 15(¥ Bil.)

5
換算R($/€) ($/€) (91/125) (82/113)
309.9
9.6
318.6
20.6+114.6%
+2.8%
Operating profit
Net sales
FY11 1Q resultsFY10 1Q results
Sales and Operating profit (1Q:Consolidated Basis )
Sales and Operating profit (1Q )
Operating profit + 11.0 from FY2010(¥ Bil.)

6
Businesses in developed markets +4.0Motorcycle business in emerging markets +3.9
FY10 1Q results($/€:91/125)
Developedmarkets
FY11 1Q results($/€:82/113)
+4.0
20.6
9.6+3.9
+3.1Others
Motorcycle inemerging markets
(¥ Bil.)
Changes in Operating Profit vs. FY2010 1Q (FY2011 1Q)
* Developed markets : Motorcycles in Japan, U.S. and Europe; and All-Terrain Vehicles, Outboard Motor, Personal Watercraft and Snowmobile** Others : Except Developed markets and Motorcycles in Emerging markets

7
($/€)
318.620.6
(82/113)(91/125)
309.9
9.6
14.5
-6.5
1.6
56.0
171.5
82.4
177.9
57.5
83.2
4.8
18.4
-2.6
Net Sales
Operating profit
FY10 1Q results FY11 1Q results
Others
Sales and Profit in motorcycle business in emerging markets increased, operating loss in developed markets reduced
(¥ Bil.)
Sales and Operating profit (1Q )
Motorcycle in emerging markets(Asia, Latin America)
Developed markets(Europe, U.S.)
Others
Developed markets(Europe, U.S.)
Motorcycle in emerging markets(Asia, Latin America)
* Developed markets : Motorcycles in Japan, U.S. and Europe; and All-Terrain Vehicles, Outboard Motor, Personal Watercraft and Snowmobile** Others : Except Developed markets and Motorcycles in Emerging markets
*** Figures for net sales and operating profit for "intermediate parts for products" will be incorporated into the "Motorcycles" section from the "Other Products"section.

8
Consolidated Financial Results for the First Quarter
Ended March 31, 2011by Business Segment
Consolidated Financial Results for the First Quarter
Ended March 31, 2011by Business Segment
Takeo IshiiGeneral Manager of
Finance and Accounting Division
Takeo IshiiGeneral Manager of
Finance and Accounting Division

9
$1= ¥82€1= ¥113
13.4
26.3
20.6
318.6
FY11 1Qresults
FY10 1Qresults
$1=¥91€1=¥125
Exchange rateExchange rate($/($/€€))
0
7.5Net profitNet profit
15.5Ordinary profitOrdinary profit
9.6Operating profitOperating profit
309.9Net salesNet sales
Sales and Profits (1Q)
(¥ Bil.)

10
($/€) (91/125) (82/110)(82/113)
318.6
26.5
309.9
20.3
43.0
220.1 230.0
45.0
20.0
25.0
320.0
26.5
21.7
50.6
219.7
-0.2%
+2.8%
+7.1%
+17.9%
-0.2%
Motorcycles
Marine products
Power products
Other products
FY10 1Qresults
FY11 1Qresults
FY11 1Q forecasts
Sales by Business Segment (1Q)
(¥ Bil.)
* Figures for net sales and operating profit for "intermediate parts for products" will be incorporated into the "Motorcycles" section from the "Other Products"section.

11
1,6891,853
219.72,050
96
1,605
1,414
5424
25.7
220.1
145.7
29.4
11.97.322
1545
1,651
120
8.09.023.0
160.0
30.0
230.0
129
1,475
441626 8.9
10.022.9
147.3
30.6
+5.3%
+33.8%
+4.3%
-6.5%+7.7%
-18.0%
+19.1%
+1.1%
-16.0%+21.9%
-22.3%
-0.2%
17
Motorcycle Sales (1Q)
FY10 1Qresults
FY11 1Qresults
FY11 1Qforecasts
FY10 1Qresults
FY11 1Qresults
FY11 1Qforecasts
Asia(Excluding Japan)
Europe
NorthAmericaJapan
Otherareas
Sales AmountUnit Sales(¥ Bil.)(K Units)
* Figures for net sales and operating profit for "intermediate parts for products" will be incorporated into the "Motorcycles" section from the "Other Products"section.

12
50.6
21.7
1.43.1
20.3
4.0
9.6
2.2
7.9
43.0
2.1
10.4
17.2
5.3
8.2
2.5
11.1
23.6
5.2
1.33.0
4.2
11.0
2.2
+36.8%
+6.4%
+17.9%
+21.9%
+7.1%
+14.0%
+6.1%
Marine/Power Product Sales (1Q)
Marine products Power products
FY10 1Qresults
FY11 1Qresults
FY10 1Qresults
FY11 1Qresults
Asia(Excluding Japan)
Europe
NorthAmerica
Japan
Otherareas
(¥ Bil.)

13
(-19%)(-13%)(+2%)
(-16%)
(-13%)(-19%)57 60 61
50 48
3830
2532
1823
554941 42
16
60
263223 20
26
58 52
32 30 2824 25 28
22 22
33
1216
292325 24
20 17 2024 21 20
29
11 14
1917
31
1912 12 11
7 6 5 7
2217
11 11 10 9 5 816 18
2717
25
4 5 6 7 8 9 10 11 12
(+10%)
(+13%)(-11%)
(-19%)(-15%)
(-10%)
(+10%)(-3%)
-16%
+11%
(-16%)(-20%)
(-20%)
+7%
(-27%)(-22%)(-22%)
(-14%)(-22%)(-28%)
(-10%)
(-11%)(-6%)
(+6%)(-11%)(-12%)
(+36%)(-13%)(-8%) (+4%) (+48%)
(+62%)
(+15%)
Monthly Total Demand for Major U.S. Products
Motorcycles
Outboard motors
FY09 FY10 FY11
ATV*s
* ATV: All-terrain vehicle, Data) Motorcycle and ATV: MIC, Outboard motor: NMMA
Jan.-Mar.:
Jan.-Mar.:
Jan.-Mar.:
(K Units)
1 2 3

14
13 13 125 8 7
1417
14
13 14131615 16
9 8 9
36
88
9
59
12
60
1434 33
-45%+15%
+23%
+47%
Motorcycles ATV*s Outboard motors
*ATV: All-terrain vehicle
FY10Results
FY11Results
FY11Forecasts
FY10Results
FY11Results
FY11Forecasts
FY10Results
FY11Results
FY11Forecasts
(K units)
U.S. Business Condition (1Q)
** Inventory: Motorcycles and ATVs include wholesales and dealer inventory, Outboard motors includes wholesale inventory only.
Retail
Wholesale
Inventory**
15
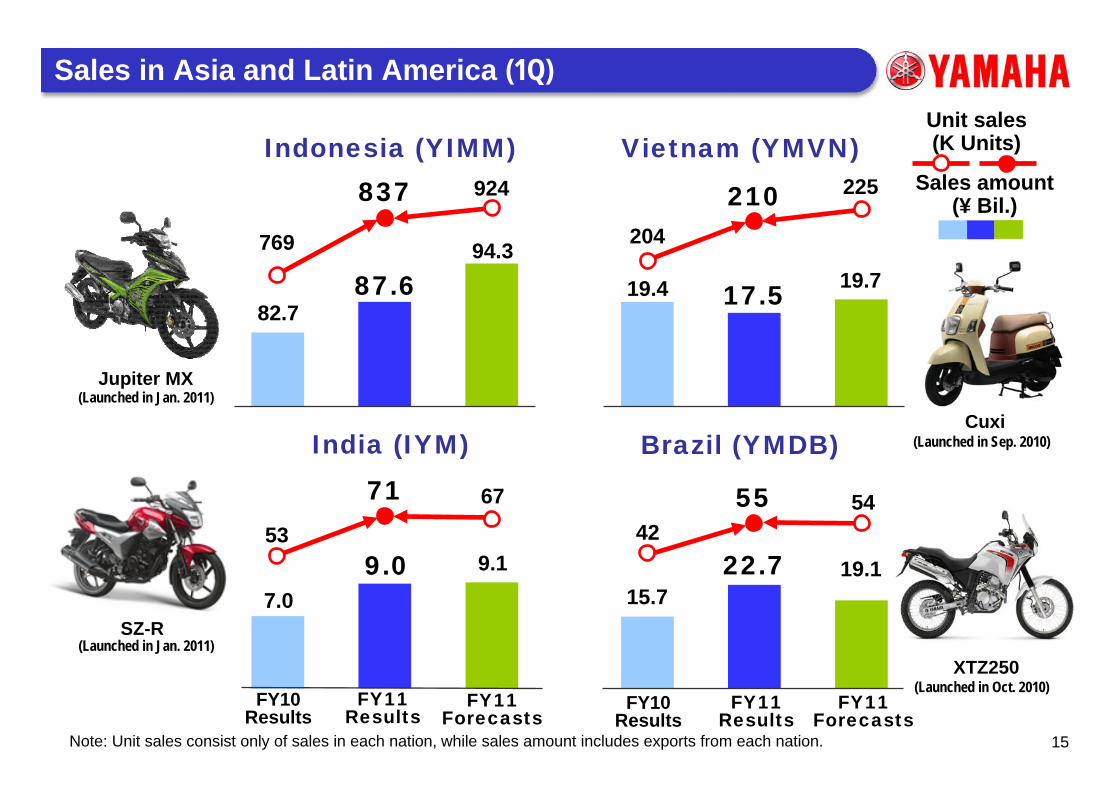
87.682.7
94.3769
924837+43%
17.5 19.719.4
210 225
204+32%
9.07.0
9.153
6771+10%
22.7 19.115.7
55 5442
-8%
Jupiter MX
SZ-R
XTZ250
Cuxi
Sales in Asia and Latin America (1Q)
Note: Unit sales consist only of sales in each nation, while sales amount includes exports from each nation.
Unit sales (K Units)
Sales amount(¥ Bil.)
Indonesia (YIMM) Vietnam (YMVN)
India (IYM) Brazil (YMDB)
FY10Results
FY11Results
FY11Forecasts
FY10Results
FY11Results
FY11Forecasts
(Launched in Sep. 2010)
(Launched in Jan. 2011)
(Launched in Jan. 2011)
(Launched in Oct. 2010)

16
9.1 9.3
11.710.2
8.7 8.6 8.3
5.5
2.8
4.95.8
9.38.1
3.04.5
580 600800
660510 500 495
125
325 325
620505
210270 300
1Q 2Q 3Q 4Q
FY071Q 2Q 3Q 4Q
FY081Q 2Q 3Q 4Q
FY09
1Q 2Q
FY10
3Q
9.6
710
4Q
6.5
400
1Q
8.0
515
FY11
Unit sales of surface mounters**
Sales amount of IM* Business(incl. industrial robots, wheelchairs)
Net sales(¥ Bil.)
Unit sales(Units)
1QForecasts
* Intelligent Machinery: Industrial robots (including surface mounters)** Unit sales of surface mounters includes peripheral equipment such as printers.
Sales in IM* Business
17
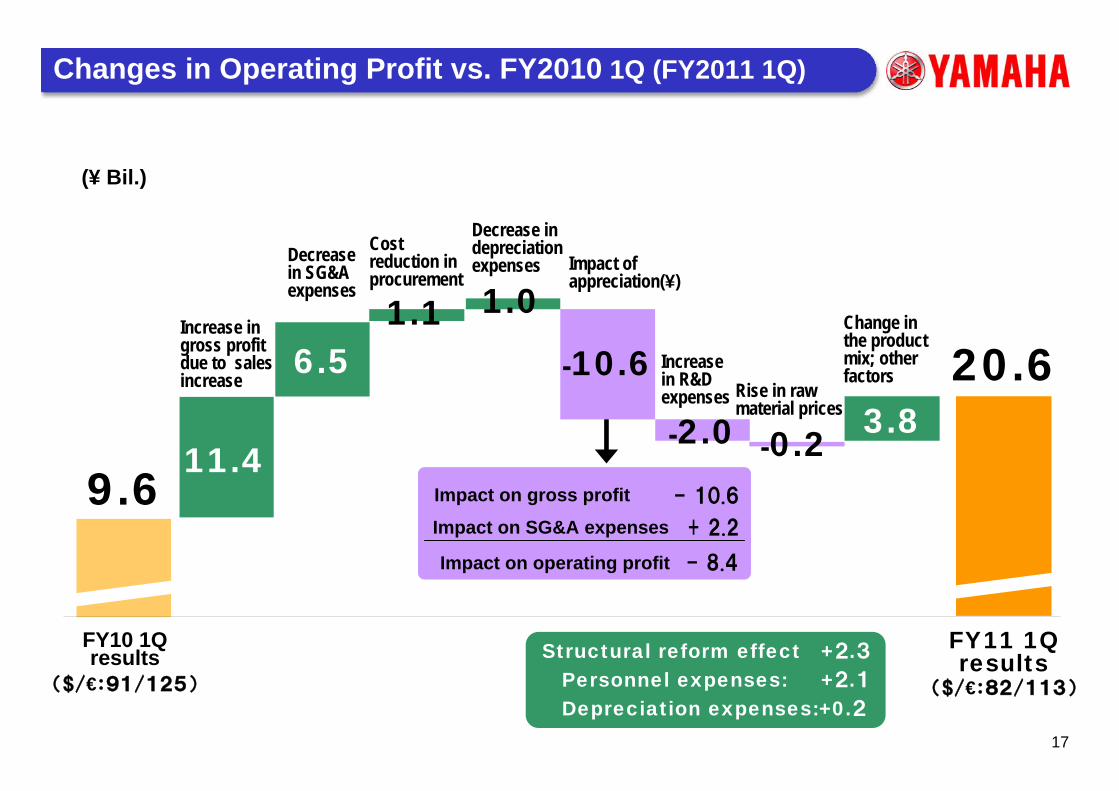
Structural reform effect +2.3Personnel expenses: +2.1Depreciation expenses:+0.2
9.611.4
6.51.1 1.0
-10.6
-2.0 -0.2 3.820.6
FY10 1Qresults
($/€:91/125)
FY11 1Qresults
($/€:82/113)
Change in the product mix; other factors
Decrease in SG&A expenses
Decrease in depreciation expenses
Cost reduction in procurement
Increase in R&D expenses
Increase in gross profit due to sales increase
- 10.6
- 8.4
+ 2.2
Impact on gross profit
Impact on SG&A expenses
Impact on operating profit
(¥ Bil.)
Changes in Operating Profit vs. FY2010 1Q (FY2011 1Q)
Impact of appreciation(¥)
Rise in raw material prices

18
318.6 20.6
26.5
309.9
20.3
43.0
220.1230.0
45.0
20.0
25.0
320.0
1.2
9.61.7
11.9
-5.2
0.5
11.02.0
12.5
-4.0
21.7
26.5
219.7
50.6
2.5
4.2
13.3
0.6
Sales and Operating profit by Business Segment (1Q)
Sales Amount Operating profit
Motorcycles
Marine products
Power products
Other products
FY10 1Qresults
FY11 1Qresults
FY11 1Qforecasts FY10 1Q
resultsFY11 1Qresults
FY11 1Qforecasts
(¥ Bil.)
Figures for net sales and operating profit for "intermediate parts for products" will be incorporated into the "Motorcycles" section from the "Other Products"section.

19

20
Sales and Operating profit by Business Segment (1Q) Sales and Operating profit by Business Segment
(10 Results/11 Forecasts) Market Stocks of Major Products in the U.S. and Europe Exchange Rate Impacts (FY10 1Q vs. FY 11 1Q)
Reference InformationReference Information

21
Net sales FY10 1Qresults
FY11 1Qforecasts
FY11 1Qresults vs. FY10 vs.
forecasts
Motorcycles 220.1 230.0 219.7 -0.2% -4.5%
Marine Products 43.0 45.0 50.6 17.9% 12.5%
Power Products 20.3 20.0 21.7 7.1% 8.7%
Other Products 26.5 25.0 26.5 -0.2% 6.0%
Total 309.9 320.0 318.6 2.8% -0.4%
Operating profitMotorcycles 11.9 12.5 13.3 11.9% 6.3%
Marine Products 1.2 0.5 4.2 248.1% 740.4%Power Products -5.2 -4.0 0.6 - -Other Products 1.7 2.0 2.5 50.0% 27.1%
Total 9.6 11.0 20.6 114.6% 87.5%
Operating profit marginMotorcycles 5.4% 5.4% 6.0% 0.7% 0.6%
Marine Products 2.8% 1.1% 8.3% 5.5% 7.2%
Power Products -25.5% -20.0% 2.7% 28.2% 22.7%
Other Products 6.4% 8.0% 9.6% 3.2% 1.6%
Total 3.1% 3.4% 6.5% 3.4% 3.0%
(Reference) Motorcycles + ATVsSales 229.0 239.0 230.2 0.5% -3.7%
Operating profit 7.4 8.5 13.8 85.6% 62.2%Operating profit Margin 3.2% 3.6% 6.0% 2.7% 2.4%
Sales and Operating profit by Business Segment (1Q)
*ATV: All-terrain vehicle
(¥ Bil.)
(¥ Bil.)
(¥ Bil.)
** Figures for net sales and operating profit for "intermediate parts for products" will be incorporated into the "Motorcycles" section from the "Other Products"section.

22
Net sales
FY10 1Qresults
FY10 2Qresults
FY10 3Qresults
FY10 4Qresults
FY10results
FY11 1Hforecasts
FY11forecasts
Motorcycles 220.1 260.4 214.0 219.8 914.2 485.0 975.0Marine Products 43.0 52.9 37.7 33.6 167.1 95.0 170.0Power Products 20.3 24.1 30.7 27.9 103.0 40.0 100.0Other Products 26.5 28.9 28.9 25.5 109.8 50.0 105.0
Total 309.9 366.3 311.2 306.7 1,294.1 670.0 1,350.0
Operating profitMotorcycles 11.9 16.2 13.2 5.8 48.5 27.5 55.0
Marine Products 1.2 3.0 -0.5 -3.0 0.7 1.0 1.0Power Products -5.2 1.0 -3.0 -4.1 -11.3 -8.0 -11.5Other Products 1.7 3.8 4.0 3.8 13.3 4.5 8.5
Total 9.6 24.0 13.7 2.5 51.3 25.0 53.0
Operating profit marginMotorcycles 5.4% 6.2% 6.2% 2.6% 5.3% 5.7% 5.6%
Marine Products 2.8% 5.6% -1.2% -8.8% 0.4% 1.1% 0.6%Power Products -25.5% 4.2% -9.8% -14.6% -10.9% -20.0% -11.5%Other Products 6.4% 13.1% 13.8% 14.8% 12.1% 9.0% 8.1%
Total 3.1% 6.5% 4.4% 0.8% 4.0% 3.7% 3.9%(Reference) Motorcycles + ATVs
Sales 229.0 271.8 227.9 230.7 959.5 504.0 1,021.0Operating profit 7.4 15.9 9.9 2.7 37.5 19.5 43.0
Operating profit Margin 3.2% 5.9% 4.4% 1.2% 3.9% 3.9% 4.2%*ATV: All-terrain vehicle
(¥ Bil.)
(¥ Bil.)
(¥ Bil.)
Sales and Operating Profit by Business Segment (10 Results/11 Forecasts)
** Figures for net sales and operating profit for "intermediate parts for products" will be incorporated into the "Motorcycles" section from the "Other Products"section.
23
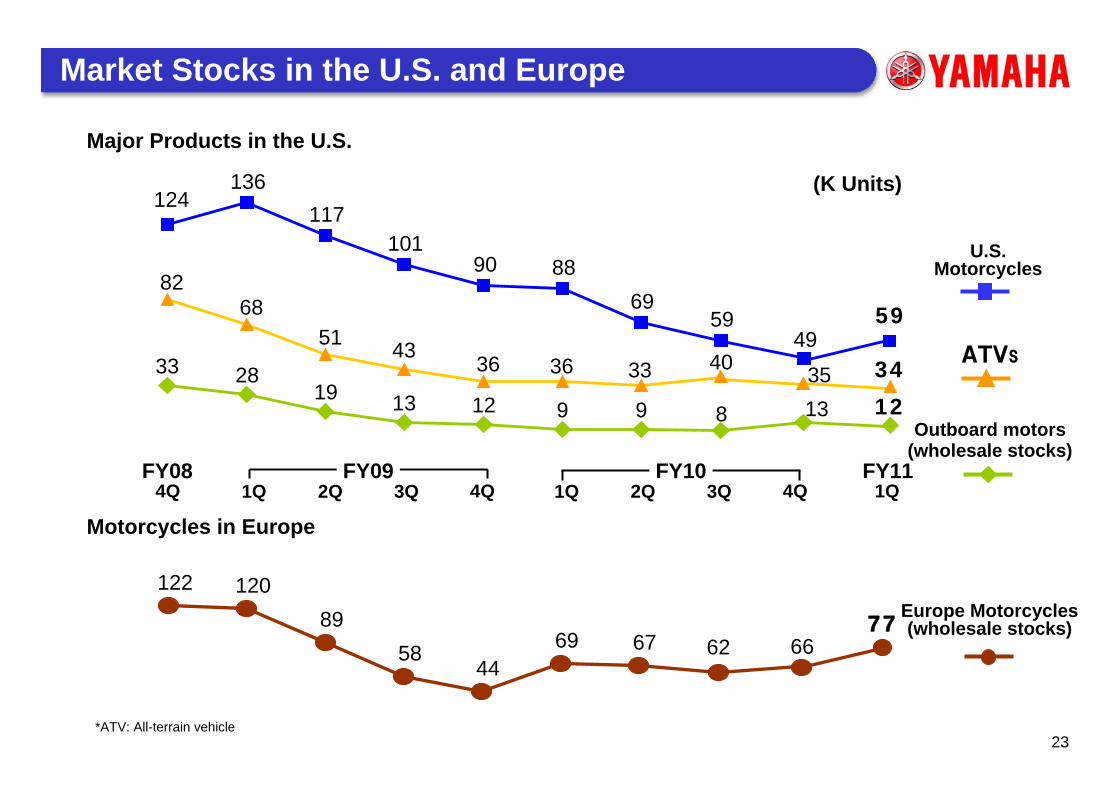
FY084Q 1Q 2Q 3Q 4Q
FY09 FY111Q1Q 2Q 3Q 4Q
FY10
5969
8890101
117136
124
40333636435168
82
8991213192833
493513
49
676944
5889
120122
62 6677
59
3412
Major Products in the U.S.
Motorcycles in Europe
ATVs
U.S. Motorcycles
Outboard motors(wholesale stocks)
Europe Motorcycles(wholesale stocks)
*ATV: All-terrain vehicle
(K Units)
Market Stocks in the U.S. and Europe

24
Exchange Rate Impacts (FY10 1Q vs. FY 11 1Q)
Notes: ① Impact on gross profit due to the difference between the exchange rate used in the year to translate foreign currency-denominated sales into Japanese yen, versus the translation exchange rate applied in the previous year.
② Impact on gross profit due to the difference between the exchange rate used in the year to consolidate foreign currency-denominated items posted in non-consolidated financial statements into Japanese yen, versus the consolidation exchange rate applied in the previous year.
※: Impact on non-operating profits or losses due to the difference between the exchange rate used in the year to translate foreign currency-denominated sales into Japanese yen and purchasing rate of foreign currencies in the same year, versus that difference applied in the previous year.
Impact of Fluctuation (per 1 yen change)
US$0.6
EURO0.2
(¥ Bil.) US$ EURO Other TotalExchange rate (sales)
-4.8 -2.2 -0.2 -7.1
2.1 0.4 -0.1 2.4
-2.7 -1.8 -0.2 -4.7
Exchange rate of profits/losses
91 125 - -
82 113 - -
-0.6 -0.8 -2.1 -3.5
-5.4 -3.0 -2.2 -10.6
Impact on SG&A expenses 2.2 Impact on operating profit -8.4
Impact on ordinary profit -6.0
①Impact on gross profit due to the difference ofexchange rates used to translate sales※Difference between exchange rate andpurchasing rate (non-operating profits or losses)
FY10 1Q rate(results: yen)
FY11 1Q rate(results: yen)
Substantial impact (purchasing rate)
①+② Total impact on gross profit
②Impact on gross profit due to the difference ofexchange rates used to translate profits/losses

25
Information
http://www.yamaha-motor.co.jp/global/Yamaha Motor website(Global site: English)
You are also welcome to review the IR information on Yamaha Motor’s website.
http://www.yamaha-motor.co.jp/global/ir/For investorsInvestor meeting presentationIR materials
http://www.yamaha-motor.co.jp/global/ir/explanation/http://www.yamaha-motor.co.jp/global/ir/material/