consolidated financial results fiscal year 2003...
TRANSCRIPT
Consolidated Financial Results Fiscal Year 2003
EURO DISNEY S.C.A.
Consolidated Financial Results Fiscal Year 2003
EURO DISNEY S.C.A.
November 17, 2003

André Lacroix
Chairman and CEO
Euro Disney
André Lacroix
Chairman and CEO
Euro Disney

2003 Situation
Strategic analysis and new management methodology
New 2004 actions

Disneyland Resort Paris / Theme Park LeaderLeading European Theme Parks (2002*)
2 5002 9003 0303 0003 1003 2003 800
12 403
0
2 000
4 000
6 000
8 000
10 000
12 000
14 000
DLRP Park 1 Park 2 Park 3 Park 4 Park 5 Park 6 Park 7
Attendance('000 guests)
* FY’03 figures
Source: Revenue Development and Consumer Knowledge, FY’03 except for type of Park ticket (October FY’04)

High Guest Satisfaction
Intent to recommend / revisit has also reached high rates
Probably yes9 %
Definitely yes90 %
No1 % Probably
yes27 %
No6 %
Definitely yes67%
Intention to recommend
Intention to revisit
Source : Consumer Knowledge, FY’02 and FY’03 Guest Satisfaction Barometer

2003 Situation
Strategic analysis and new management methodology
New 2004 actions

Jeffrey R. SPEED
Senior Vice Presidentand
Chief Financial Officer
Euro Disney S.C.A.
Jeffrey R. SPEED
Senior Vice Presidentand
Chief Financial Officer
Euro Disney S.C.A.

Business Context
Fiscal Year 2003 Financial Results
Liquidity Outlook

Business Context: GeneralBusiness Context: General
Challenging macro-economic and geo-political environment
Difficult year for the entire travel and tourism industry
Visibility with respect to bookings remains somewhat clouded
Price discounting across the industry

Business Context: Euro Disney First SemesterBusiness Context: Euro Disney First Semester
Increase in top line revenues, primarily in first quarter
=> Revenues increase 8%
Increased costs and expenses linked to the new two-park Resort
=> Decreased EBITDA Margin*As % of revenues: 12% vs 19% in FY’02
*Before royalties and management fees

Business Context: Euro Disney Second SemesterBusiness Context: Euro Disney Second Semester
Decline in volume during second semester
=> Revenues down 9%
Prudent yield management to preserve pricing
Management implemented proactive cost control measures
=> Stable EBITDA Margin*As % of revenues: 29% vs 30% in FY’02
*Before royalties and management fees

Business Context
Fiscal Year 2003 Financial Results
Liquidity Outlook
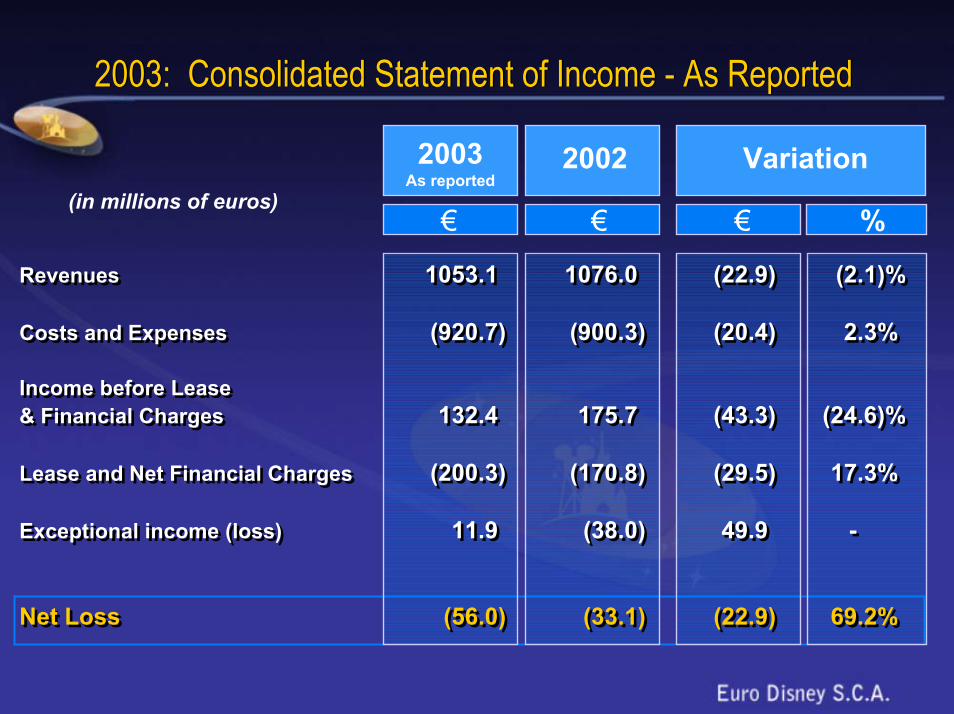
2003: Consolidated Statement of Income - As Reported2003: Consolidated Statement of Income - As Reported
2003As reported
2002 Variation(in millions of euros)
%
Revenues 1053.1 1076.0 (22.9) (2.1)%
Costs and Expenses (920.7) (900.3) (20.4) 2.3%
Income before Lease& Financial Charges 132.4 175.7 (43.3) (24.6)%
Lease and Net Financial Charges (200.3) (170.8) (29.5) 17.3%
Exceptional income (loss) 11.9 (38.0) 49.9 -
Net Loss (56.0) (33.1) (22.9) 69.2%
Revenues 1053.1 1076.0 (22.9) (2.1)%
Costs and Expenses (920.7) (900.3) (20.4) 2.3%
Income before Lease& Financial Charges 132.4 175.7 (43.3) (24.6)%
Lease and Net Financial Charges (200.3) (170.8) (29.5) 17.3%
Exceptional income (loss) 11.9 (38.0) 49.9 -
Net Loss (56.0) (33.1) (22.9) 69.2%
€€€

Fiscal Year 2003 Results: Basis of PresentationFiscal Year 2003 Results: Basis of Presentation
As-reported results reflect adoption of required change in accounting principle
Impact of accounting change is a decrease of €11 million in NetIncome (€20 million decrease in EBITDA offset by €9 million decrease in Depreciation and Amortisation)
In addition, due to the waiver on Royalties and Management Feesfor the last three quarters of FY’03 (a reduction of €27 million), we will focus our discussion on EBITDA before Royalties and Management Fees
To enhance comparability between fiscal periods, we will presentFY’03 before taking into account the accounting change

2003: Key Financial Results2003: Key Financial Results
2003*
€ €
2002 Variation
%€(in millions of euros)
Revenues 1053.1 1076.0 (22.9) (2.1)%
EBITDA before Royaltiesand Management Fees 226.1 275.3 (49.2) (17.9)%
As % of revenues 22% 26% (4) ppt
Revenues 1053.1 1076.0 (22.9) (2.1)%
EBITDA before Royaltiesand Management Fees 226.1 275.3 (49.2) (17.9)%
As % of revenues 22% 26% (4) ppt
*Before accounting change

The Resort SegmentThe Resort Segment
2002
%€ € €Revenues 1029.5 1048.7 (19.2) (1.8)%
EBITDA Before Royaltiesand Management Fees 215.5 262.9 (47.4) (18.0)%
As % of revenues 21% 25% (4) ppt
Revenues 1029.5 1048.7 (19.2) (1.8)%
EBITDA Before Royaltiesand Management Fees 215.5 262.9 (47.4) (18.0)%
As % of revenues 21% 25% (4) ppt
2003* Variation(in millions of euros)
*Before accounting change

The Resort Segment: Focus on Theme ParksThe Resort Segment: Focus on Theme Parks
2003 Variation2002
Revenues (in millions of euros) 508.5 526.0 (17.5) (3.3)%
Attendance (in millions) 12.4 13.1 (0.7) (5.3)%
Average guest spending 40.7 40.1 0.6 +1.5%(in euros, excluding V.A.T)
Revenues (in millions of euros) 508.5 526.0 (17.5) (3.3)%
Attendance (in millions) 12.4 13.1 (0.7) (5.3)%
Average guest spending 40.7 40.1 0.6 +1.5%(in euros, excluding V.A.T)
€ € €
Theme ParksTheme Parks
%

The Resort Segment: Focus on HotelsThe Resort Segment: Focus on Hotels
2003 Variation2002
€ € €
Revenues (in millions of euros) 416.7 411.7 +5.0 +1.2%
Occupancy 85.1% 88.2% (3.1)ppt
Average spending per room 183.5 175.1 +8.4 +4.8%(in euros, excluding V.A.T)
Revenues (in millions of euros) 416.7 411.7 +5.0 +1.2%
Occupancy 85.1% 88.2% (3.1)ppt
Average spending per room 183.5 175.1 +8.4 +4.8%(in euros, excluding V.A.T)
Hotels and Disney VillageHotels and Disney Village
%

Real Estate Development SegmentReal Estate Development Segment
2003 Variation
%
2002
Revenues 23.6 27.3 (3.7) (13.6)%
EBITDA before Royaltiesand Management Fees 10.6 12.4 (1.8) (14.5)%
As % of revenues 45% 45% -
Revenues 23.6 27.3 (3.7) (13.6)%
EBITDA before Royaltiesand Management Fees 10.6 12.4 (1.8) (14.5)%
As % of revenues 45% 45% -
€ € €(in millions of euros)

Operating Costs EvolutionOperating Costs Evolution
2003* 2002 Variation(in millions of euros)
Direct operating costs 625.8 613.3 +12.5 +2.0%
Marketing and Sales costs 105.2 95.4 +9.8 +10.3%
General and Administrative costs 96.0 92.0 +4.0 +4.3%
Sub Total Operating Costs 827.0 800.7 +26.3 +3.3%
Royalties and Management fees 8.1 35.5 (27.4) (77.2)%
Depreciation and amortisation 75.0 64.1 +10.9 +17.0%
Operating Costs 910.1 900.3 +9.8 +1.0%
€ € %€
*Before accounting change

Increase in Lease and Financial Charges in Line with ExpectationsIncrease in Lease and Financial Charges in Line with Expectations
20022003 Variation
Lease and Financial Charges 200.3 170.8 +29.5 17.3 %
Increase mainly due to:- Increase in principal reimbursement by the
financing companies (incl. in lease) +18.2
- Increased interest charges +9.5- Other +1.8
Lease and Financial Charges 200.3 170.8 +29.5 17.3 %
Increase mainly due to:- Increase in principal reimbursement by the
financing companies (incl. in lease) +18.2
- Increased interest charges +9.5- Other +1.8
%€€ €(in millions of euros)

Exceptional ItemsExceptional Items
2002
Income (Loss)before Exceptional Items (57.3) 4.9 (62.2) -
Exceptional income (loss) 11.9 (38.0) 49.9 131.3%
Net Loss (45.4) (33.1) (12.3) 37.2%
Income (Loss)before Exceptional Items (57.3) 4.9 (62.2) -
Exceptional income (loss) 11.9 (38.0) 49.9 131.3%
Net Loss (45.4) (33.1) (12.3) 37.2%
€ € €
2003* Variation(in millions of euros)
%
*Before accounting change

Cash BalancesCash Balances
2003 2002 Variation(in millions of euros)
€€ €Beginning Cash Equivalent Balance 21.3 548.4 (527.1)
Cash flow from Operating Activities 88.1 48.7 +39.4
Proceeds from Fixed Assets Sales 45.4 1.4 +44.0
Capital Expenditures and Other (74.2) (271.1) +196.9
Cash flow used in Investing Activities (28.8) (269.7) +240.9
Cash Flow used in Financing Activities (34.6) (306.1) +271.5
Ending Cash Equivalent Balance 46.0 21.3 +24.7
Beginning Cash Equivalent Balance 21.3 548.4 (527.1)
Cash flow from Operating Activities 88.1 48.7 +39.4
Proceeds from Fixed Assets Sales 45.4 1.4 +44.0
Capital Expenditures and Other (74.2) (271.1) +196.9
Cash flow used in Investing Activities (28.8) (269.7) +240.9
Cash Flow used in Financing Activities (34.6) (306.1) +271.5
Ending Cash Equivalent Balance 46.0 21.3 +24.7

Business Context
Fiscal Year 2003 Financial Results
Liquidity Outlook

Modification of Royalties and Management Fee Payments on March 28, 2003
Royalties and Management Fees for the last three quarters of fiscal year 2003 were waived
Modification of payment terms for fiscal year 2004 (fiscal year-end payment rather than quarterly)
The waived amounts relating to fiscal year 2003, may become due to the extent that EBITDA exceeds €450 million in any fiscal year from2004 to 2008

Additional Liquidity Efforts
Limited programme of asset sales with gross proceeds of €45 million
Debt Security Deposit reduction until March 31, 2004
€45 million subordinated credit line from The Walt Disney Company

Conclusion: First Semester FY’04 Outlook
Our current forecasts do not assume a recovery until second semester FY’04.
Barring any unforeseen events, sufficient liquidity until March 31, 2004.
Between now and March 31, 2004, we will work with our various stakeholders to find a long-term resolution to our financial challenges.
At the same time, we will remain focused on managing and relaunching the business.

2003 Situation
Strategic analysis and new management methodology
New 2004 actions

Opportunity for Growth Linked to Penetration Rates
Total European Population* DLRP European Core Target **
16 %
Total Population: 329 M
Visitors
Non visitors
(52M) 25 %
Total Core Target: 122 M
Non visitors
(30M)
Visitors
* Includes France, UK, Germany, Benelux, Italy and Spain** Core target: families with children (3 to 15) + young adults (20 to 35) - rejecters + kids core target + income qualifier-
Source: Advancy Consulting, LabLB May 2001

Growth Opportunity for Parks Attendance
0123456789
101112
FY'98FY'99FY'00FY'01FY'02FY'03FY'04FY'05FY'06FY'07
EMEA
U.S.
CAGR ‘03-‘07
U.S. 3.4%EMEA 4.1%
In Mil Guests
*Includes the Middle East nd Africa**based Population of 14 European Union countries (not including Greece and Switzerland) Source: PricewaterhouseCoopers
N.B.: data related to leisure and theme parks and taking into account the free-entrance Parks in which the rides are not free.

2003 Situation
Strategic analysis and new management methodology
New 2004 actions

2003 Situation
Strategic analysis and new management methodology
New 2004 actions

2003 Situation
Strategic analysis and new management methodology
New 2004 actions

New 2004 actions
A new marketing strategy
A new management team
A new capital structure


New 2004 actions
A new marketing strategy
A new management team
A new capital structure

New 2004 actions
A new marketing strategy
A new management team
A new capital structure
New 2004 actions
A new marketing strategy
A new management team
A new capital structure

Our Four Strategic Assets
The Disney brand
A complete tourist destination in the heart of Europe
Unique know-how to bring legends and fantasy to life and provide unforgettable memories
Cast Members who are devoted to their work

Consolidated Financial Results Fiscal Year 2003
EURO DISNEY S.C.A.
Consolidated Financial Results Fiscal Year 2003
EURO DISNEY S.C.A.
November 17, 2003