consolidated financial highlights - fujitec amounts of total assets and net assets in 2008 in the...
TRANSCRIPT

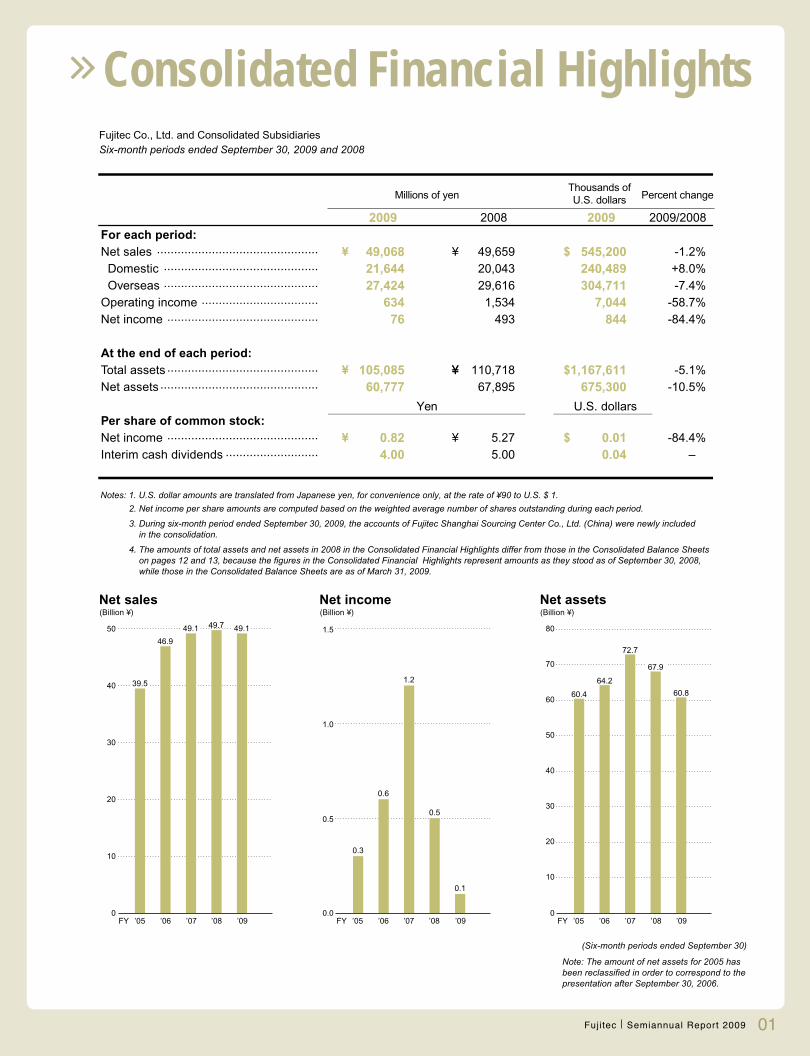
Consolidated Financial Highlights
2009/20082008
-1.2+8.0-7.4
-58.7-84.4
%%%%%
49,068 21,644 27,424
634 76
545,200 240,489 304,711
7,044 844
20092009
Notes: 1. U.S. dollar amounts are translated from Japanese yen, for convenience only, at the rate of ¥90 to U.S. $ 1.
2. Net income per share amounts are computed based on the weighted average number of shares outstanding during each period.
3. During six-month period ended September 30, 2009, the accounts of Fujitec Shanghai Sourcing Center Co., Ltd. (China) were newly included in the consolidation.
4. The amounts of total assets and net assets in 2008 in the Consolidated Financial Highlights differ from those in the Consolidated Balance Sheets on pages 12 and 13, because the figures in the Consolidated Financial Highlights represent amounts as they stood as of September 30, 2008, while those in the Consolidated Balance Sheets are as of March 31, 2009.
For each period:Net sales Domestic OverseasOperating incomeNet income
.........................................................................................................................................
..............................................................................
-5.1-10.5
%%
%
105,085 60,777
1,167,611 675,300
At the end of each period:Total assetsNet assets
..........................................................................................
-84.4–
0.82 4.00
49,659 20,043 29,616 1,534
493
110,718 67,895
5.27 5.00
0.01 0.04
Per share of common stock:Net incomeInterim cash dividends
.......................................................................
Fujitec Co., Ltd. and Consolidated SubsidiariesSix-month periods ended September 30, 2009 and 2008
0
10
20
30
40
50
46.9
0
10
20
30
40
50
60
70
0.0
0.5
1.0
1.5
0.5
0.1
0.3
0.6
1.2
60.4
64.2
72.7
(Six-month periods ended September 30)
8049.1 49.149.7
Note: The amount of net assets for 2005 has been reclassified in order to correspond to the presentation after September 30, 2006.
67.9
60.839.5
01Fujitec Semiannual Report 2009
To Our ShareholdersWe are pleased to report the following on the consolidated operating results of the Group for the
six-month period from April 1 to September 30, 2009 (cumulative figures for the second quarter of
our 63rd year).
The global economy in the term under review has left the worst behind, although business
conditions in Europe and the U.S. remained weak. In China, thanks to economic stimulus
measures, there has been a recovery centered on domestic demand. Also, elsewhere across
Asia, signs of recovery were apparent as governments in the region implemented economic
stimulus measures and exports to China rebounded. In the Japanese economy, production
started to pick up again supported by public stimulus measures and rising exports to Asia, but
conditions remain strained by worsened employment and plunging capital expenditure.
As for the elevator and escalator industry, demand remained firm in the Chinese market thanks to
recovering investment in real estate development. However, in other regions including North
America, equipment demand for apartment buildings and commercial real estate applications was
impacted by weak real estate markets. In Japan, too, demand related to condominium buildings
and commercial facilities continued to decline.
In this climate, the Company made efforts to increase sales of core products and to expand
income and earnings from modernization operations. However, due to the decline in domestic
and global demand as well as foreign currency exchange effects, the total amount of orders
received in the period under review fell to ´48,326 million (-22.5%), while net sales slipped 1.2%
to ´49,068 million.
With earnings in Japan significantly lower, operating income posted ´634 million, reflecting a
58.7% decline compared to the previous year. While other income/expenses increased ´179
million to ´376 million and special items improved by ´668 million compared to last year due to
reduced loss from revaluation of inventories, tax expenses and minority interests increased by
´198 million and ´166 million, respectively. As a result, net income for the period was ´76 million,
or 84.4% lower compared to the previous year.
02Fujitec Semiannual Report 2009
To Our Shareholders
Takakazu UchiyamaPresident and Chief Executive Officer
The Company will pay an interim cash dividend of ´4.0 per share of common stock, consistent
with the financial results for the period under review.
The outlook for the global economy calls for a rapid recovery in China due to that countryÕs
economic stimulus measures, but only a gradual recovery supported by the respective
governmentsÕ economic policies is expected in other regions. Despite prospects for rebounding
demand in the elevator and escalator market in China thanks to rising investment in real estate
development, overall demand is foreseen to continue at a low level and the management
environment of the Fujitec Group is likely to remain stern.
With the current fiscal year marking the end of the CompanyÕs mid-term business plan entitled
ÒRegeneration for Quality,Ó the Fujitec Group will take concerted action to increase sales and
spare no effort to achieve an early recovery in earnings. Moreover, the Group will work to increase
earnings by expanding and enhancing operations, such as through the escalator production and
field engineering bases slated for completion in Japan in the coming spring and the start of full-
scale operations at the Shanghai Sourcing Center in China.
We sincerely request our shareholdersÕ continued support.
November, 2009
03Fujitec Semiannual Report 2009
Outline of Major Activities
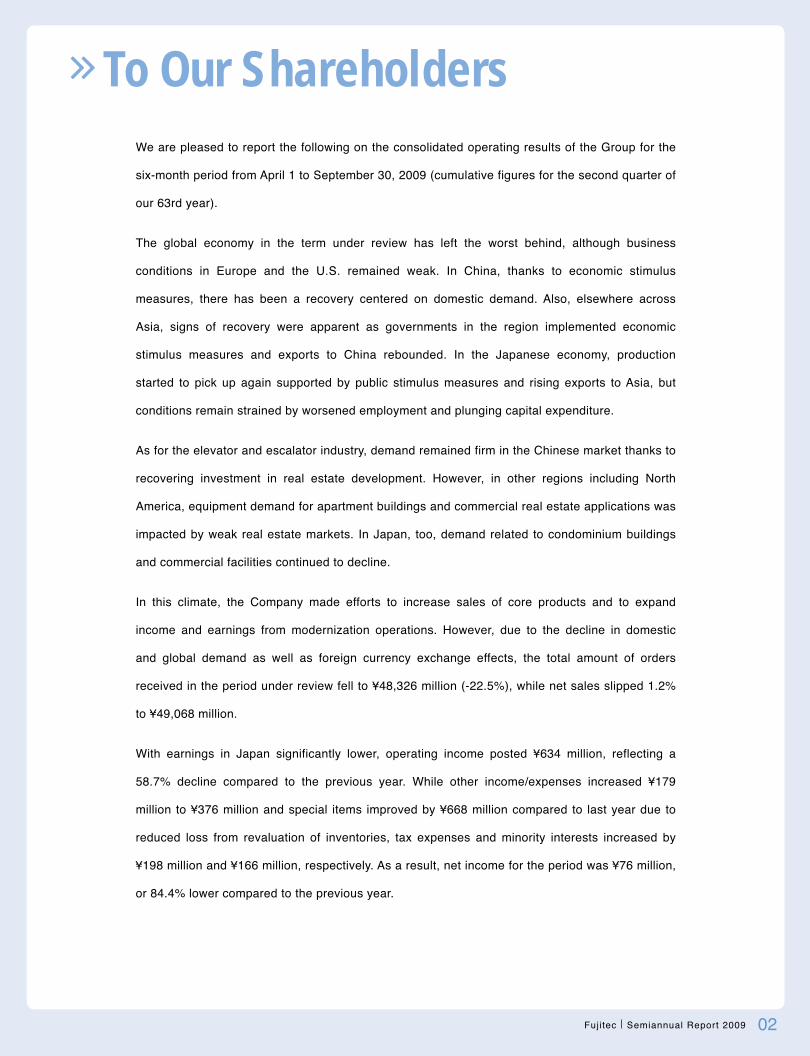
In the U.S., Fujitec received an order for 15 elevators
for Nationwide ChildrenÕs Hospital in Columbus,
Ohio, which is recognized as one of the best medical
institutions in the United States. In addition, Fujitec
supplied 16 elevators for the Spectrum Center, a
cutting-edge office building in Addison, Texas.
In Canada, Fujitec delivered 13 elevators in Vancouver including
high-speed models for a complex building scheduled to be completed
soon. This building will house the world-class Shangri-La Hotel and a
luxury condominium facility.
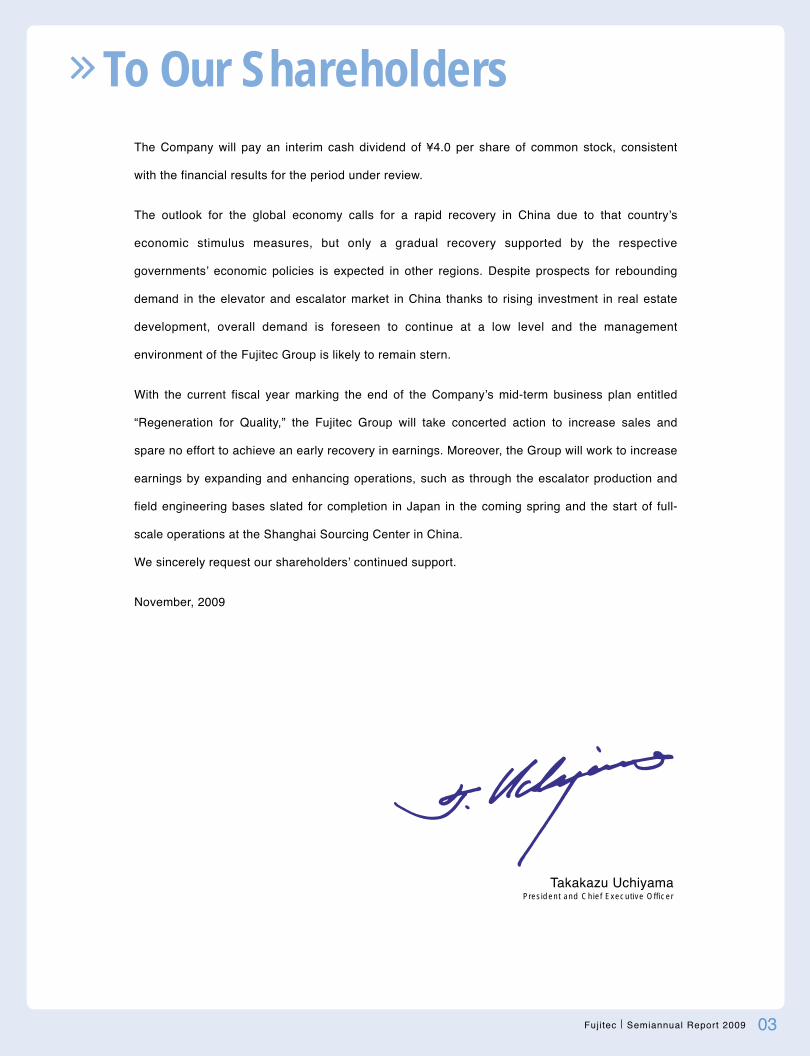
In Argentina, Fujitec supplied a large number of elevators and
escalators for the Buenos Aires Metro and for the Torre Repsol YPF,
a luxury office building in Buenos Aires designed by the well-
renowned architect Cesar Pelli.
North & South America
15
10
FY ’05 ’06
5
0
(Billion ¥)Sales in North America
7.7
10.6
’07 ’08
11.1
9.1
Nationwide ChildrenÕs Hospital (rendering)
Torre Repsol YPF
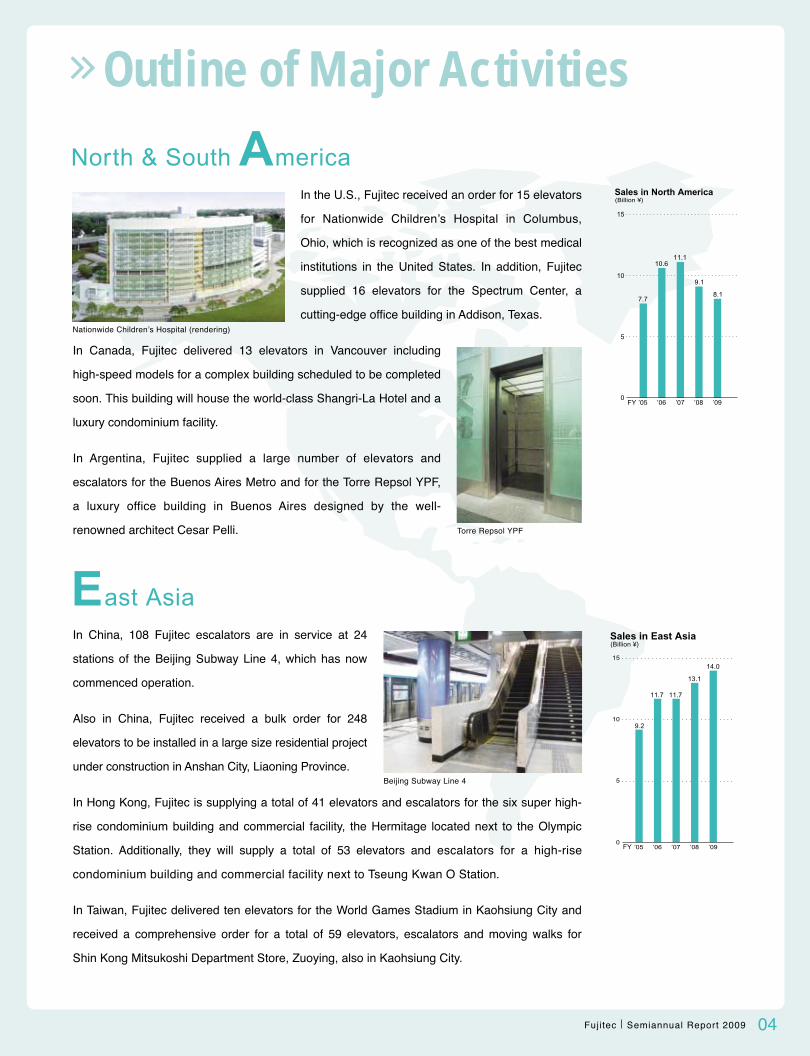
In China, 108 Fujitec escalators are in service at 24
stations of the Beijing Subway Line 4, which has now
commenced operation.
Also in China, Fujitec received a bulk order for 248
elevators to be installed in a large size residential project
under construction in Anshan City, Liaoning Province.
In Hong Kong, Fujitec is supplying a total of 41 elevators and escalators for the six super high-
rise condominium building and commercial facility, the Hermitage located next to the Olympic
Station. Additionally, they will supply a total of 53 elevators and escalators for a high-rise
condominium building and commercial facility next to Tseung Kwan O Station.
In Taiwan, Fujitec delivered ten elevators for the World Games Stadium in Kaohsiung City and
received a comprehensive order for a total of 59 elevators, escalators and moving walks for
Shin Kong Mitsukoshi Department Store, Zuoying, also in Kaohsiung City.
East Asia
Beijing Subway Line 4
10
15
FY ’05 ’06
5
0
(Billion ¥)Sales in East Asia
9.2
11.7
’07 ’08
’09
’09
11.7
13.1
8.1
14.0
04Fujitec Semiannual Report 2009
Outline of Major Activities
3
4
5
6
2
1
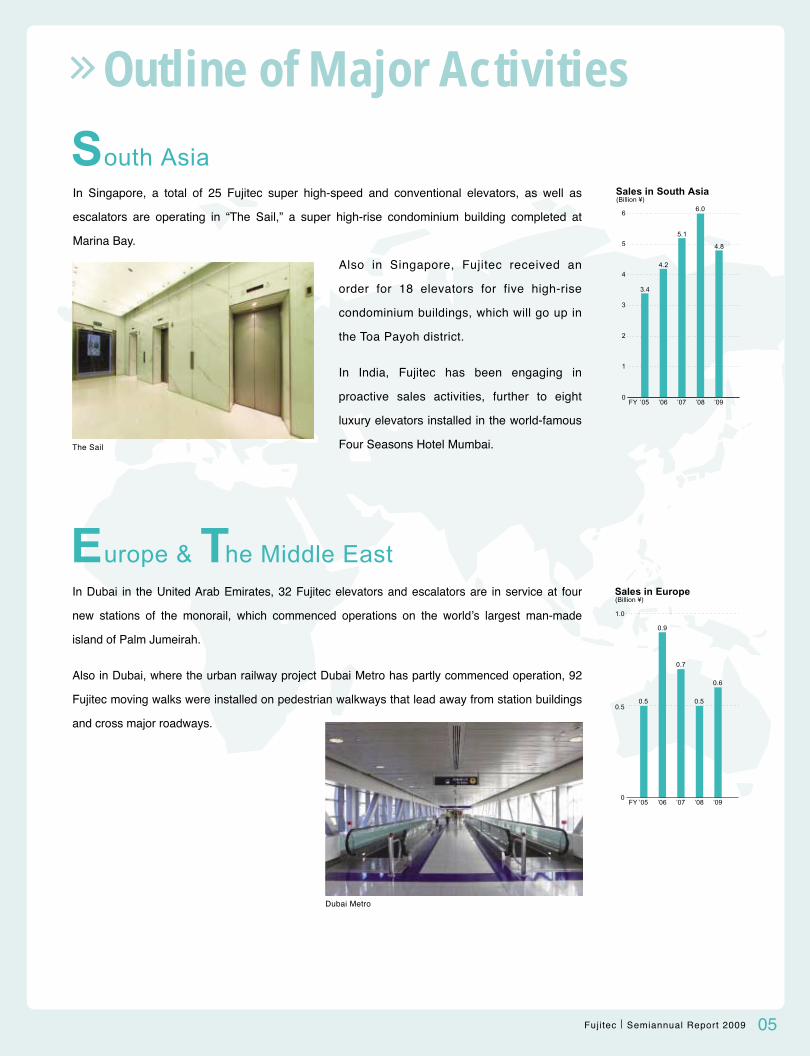
In Singapore, a total of 25 Fujitec super high-speed and conventional elevators, as well as
escalators are operating in ÒThe Sail,Ó a super high-rise condominium building completed at
Marina Bay.
Also in Singapore, Fujitec received an
order for 18 elevators for five high-rise
condominium buildings, which will go up in
the Toa Payoh district.
In India, Fujitec has been engaging in
proactive sales activities, further to eight
luxury elevators installed in the world-famous
Four Seasons Hotel Mumbai.
South Asia
FY ’05 ’060
(Billion ¥)Sales in South Asia
3.4
4.2
’07
5.1
6.0
The Sail
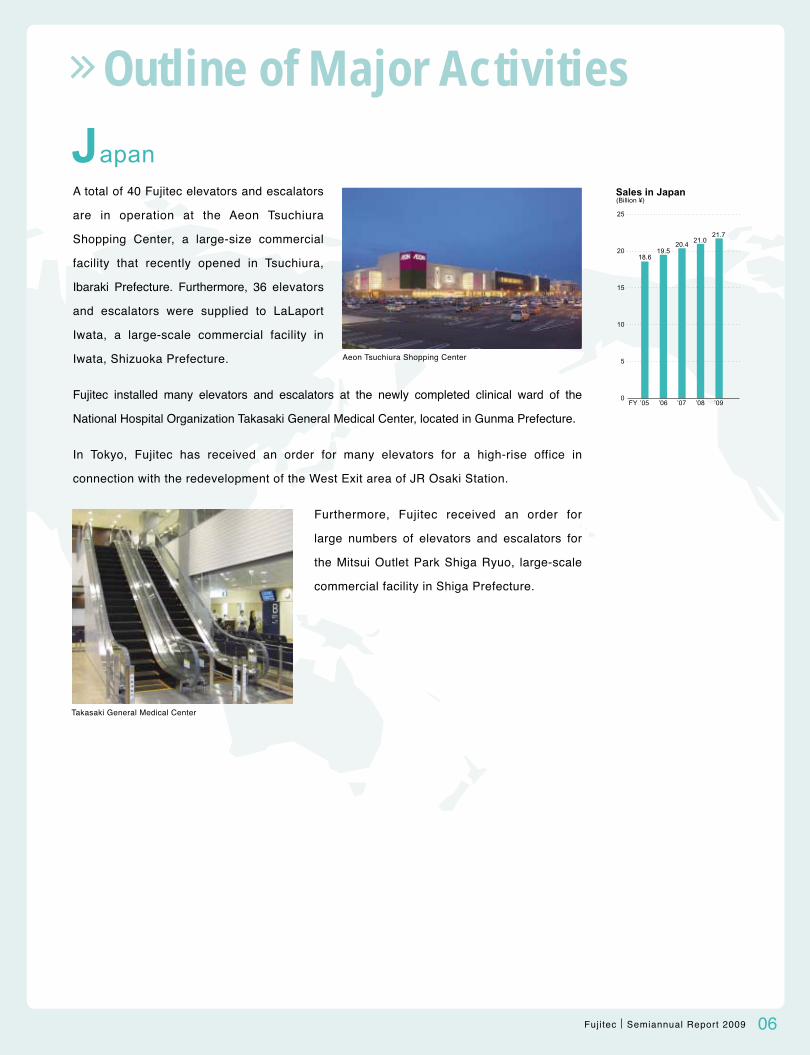
In Dubai in the United Arab Emirates, 32 Fujitec elevators and escalators are in service at four
new stations of the monorail, which commenced operations on the worldÕs largest man-made
island of Palm Jumeirah.
Also in Dubai, where the urban railway project Dubai Metro has partly commenced operation, 92
Fujitec moving walks were installed on pedestrian walkways that lead away from station buildings
and cross major roadways.
Europe & The Middle East
Dubai Metro
’08
1.0
FY ’05 ’06
0.5
0
(Billion ¥)Sales in Europe
0.5 0.5
0.9
’07
0.6
0.7
’08
’09
’09
4.8
05Fujitec Semiannual Report 2009
Outline of Major Activities
A total of 40 Fujitec elevators and escalators
are in operation at the Aeon Tsuchiura
Shopping Center, a large-size commercial
facility that recently opened in Tsuchiura,
Ibaraki Prefecture. Furthermore, 36 elevators
and escalators were supplied to LaLaport
Iwata, a large-scale commercial facility in
Iwata, Shizuoka Prefecture.
Fujitec installed many elevators and escalators at the newly completed clinical ward of the
National Hospital Organization Takasaki General Medical Center, located in Gunma Prefecture.
In Tokyo, Fujitec has received an order for many elevators for a high-rise office in
connection with the redevelopment of the West Exit area of JR Osaki Station.
Furthermore, Fujitec received an order for
large numbers of elevators and escalators for
the Mitsui Outlet Park Shiga Ryuo, large-scale
commercial facility in Shiga Prefecture.
FY ’05 ’06
(Billion ¥)Sales in Japan
0
5
10
15
20
25
21.0
18.6
’07 ’08 ’09
20.421.7
Japan
Takasaki General Medical Center
Aeon Tsuchiura Shopping Center
19.5
06Fujitec Semiannual Report 2009
Topics
“Big Step” and “Big Fit” — Soon to be completed
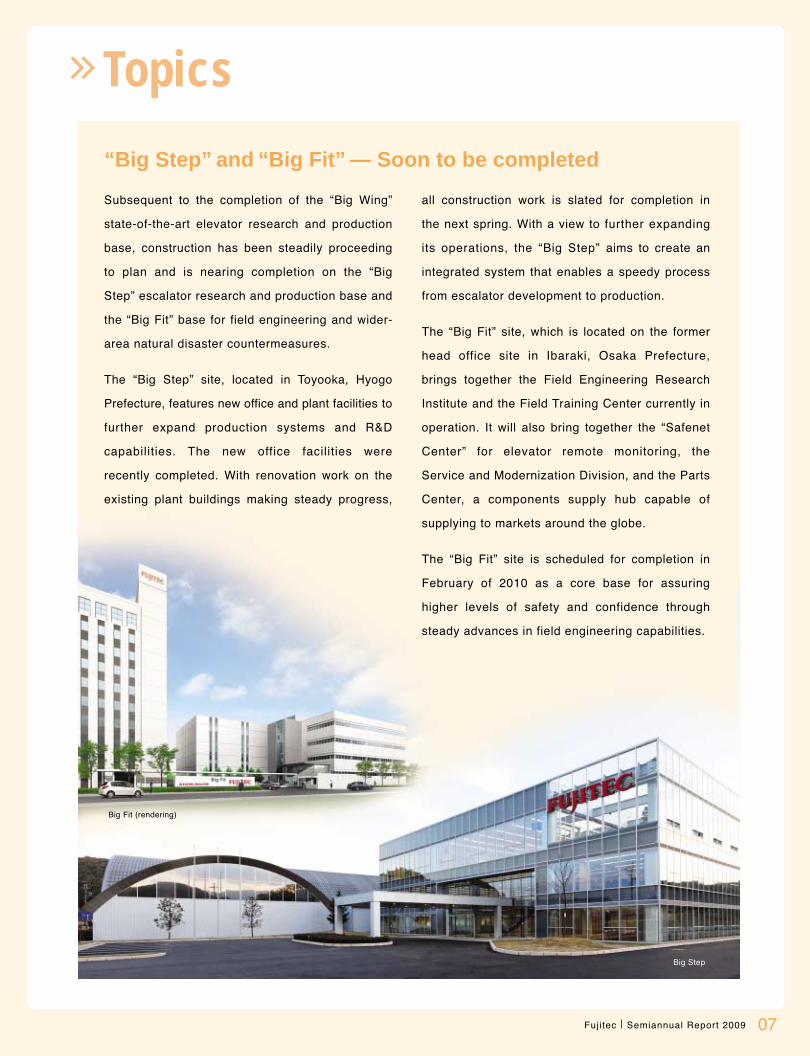
Big Fit (rendering)
Big Step
Subsequent to the completion of the ÒBig WingÓ
state-of-the-art elevator research and production
base, construction has been steadily proceeding
to plan and is nearing completion on the ÒBig
StepÓ escalator research and production base and
the ÒBig FitÓ base for field engineering and wider-
area natural disaster countermeasures.
The ÒBig StepÓ site, located in Toyooka, Hyogo
Prefecture, features new office and plant facilities to
further expand production systems and R&D
capabilities. The new office facilities were
recently completed. With renovation work on the
existing plant buildings making steady progress,
all construction work is slated for completion in
the next spring. With a view to further expanding
its operations, the ÒBig StepÓ aims to create an
integrated system that enables a speedy process
from escalator development to production.
The ÒBig FitÓ site, which is located on the former
head office site in Ibaraki, Osaka Prefecture,
brings together the Field Engineering Research
Institute and the Field Training Center currently in
operation. It will also bring together the ÒSafenet
CenterÓ for elevator remote monitoring, the
Service and Modernization Division, and the Parts
Center, a components supply hub capable of
supplying to markets around the globe.
The ÒBig FitÓ site is scheduled for completion in
February of 2010 as a core base for assuring
higher levels of safety and confidence through
steady advances in field engineering capabilities.
07Fujitec Semiannual Report 2009

New Products
Standard model escalator GS-NX SeriesFurther enhanced safety, energy conservation and design sense
April of last year marked the sales launch of
FujitecÕs GS-NX Series standard escalator product
range. In addition to the numerous products that
Fujitec has been supplying throughout Japan and
centered on commercial and public facilities, recent
research and development efforts have given birth
to a variety of devices that further enhance safety,
energy conservation and design sense.
One of them is the Foot Safety Sensor (optional
spec with charge), which is designed to prevent
items such as shoes or clothing from getting
caught in the gap between the escalator step and
skirt guard. A sensor installed in the skirt guard
identifies usersÕ foot position and alerts users
through voice and light signals.
Moreover, Fujitec is the
first in the industry to
employ LED skirt guard
lighting (optional spec with
charge). Compared with
conventional fluorescent
lights, LEDs have a longer
life, use less energy, and
operate at significantly
lower running cost. The
device illuminates usersÕ
footing area and offers a
stylish design.
Also newly launched is the Energy Conservation
Operation Device (optional spec with charge). With
this, both landings of the escalator are fitted with
reflective beam sensors so that after a certain set time
when no users are present, the escalator reduces its
speed and moves at a stand-by velocity resulting in
lower energy consumption.
The use of reflective beam sensors further extends
the range within which sensors can detect users
and full control over the timing of an escalatorÕs
acceleration is also ensured. Enabling smooth
boarding by users is just one of the safety
improvements offered by these sensors.
Foot Safety Sensor
Reflective Beam Sensor
08Fujitec Semiannual Report 2009
New Products
Elevator Earthquake Safety Functions for super-high rise buildings up to 300 meters high
Regarding technologies for ensuring elevator
earthquake safety in super-high rise office and
condominium buildings, Fujitec has developed the
Long-period Seismic Motion Operation Mode and
the Automatic Diagnosis and Provisional Operation
Restoration Service. Fujitec started offering them to
customers this October.
Long-period seismic ground motion, unlike usual
short-period seismic motion, shakes buildings
slowly over periods from several seconds to
several tens of seconds long and can travel many
hundreds of kilometers.
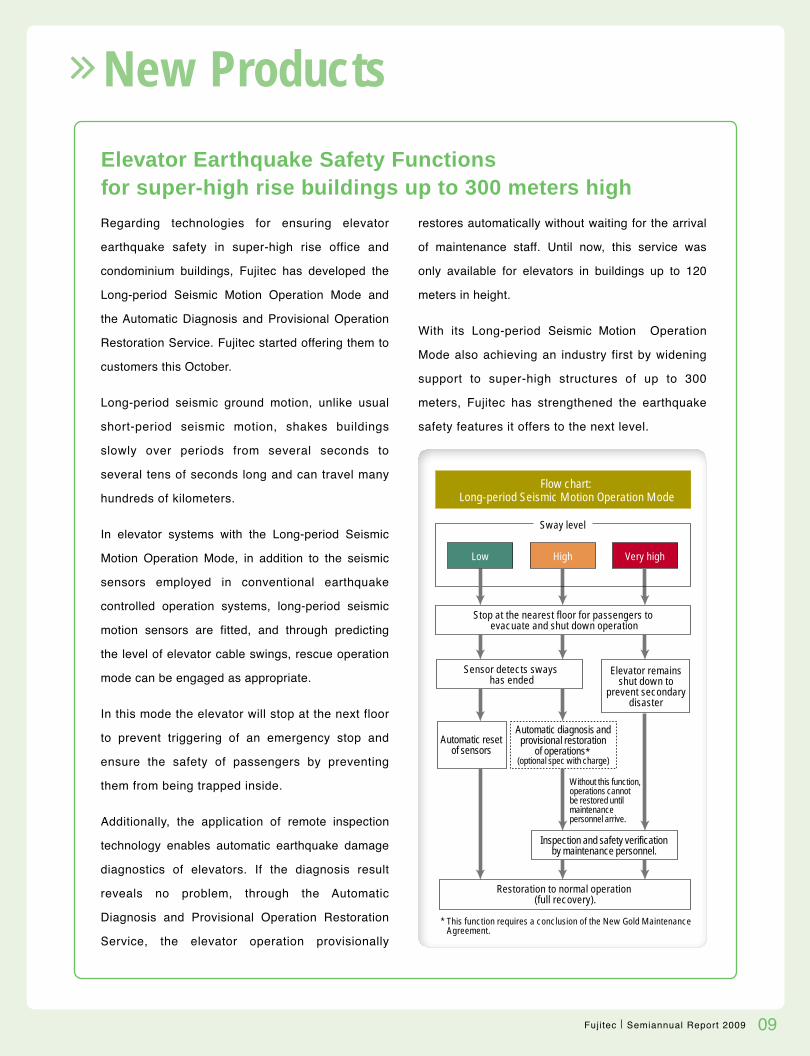
In elevator systems with the Long-period Seismic
Motion Operation Mode, in addition to the seismic
sensors employed in conventional earthquake
controlled operation systems, long-period seismic
motion sensors are fitted, and through predicting
the level of elevator cable swings, rescue operation
mode can be engaged as appropriate.
In this mode the elevator will stop at the next floor
to prevent triggering of an emergency stop and
ensure the safety of passengers by preventing
them from being trapped inside.
Additionally, the application of remote inspection
technology enables automatic earthquake damage
diagnostics of elevators. If the diagnosis result
reveals no problem, through the Automatic
Diagnosis and Provisional Operation Restoration
Service, the elevator operation provisionally
restores automatically without waiting for the arrival
of maintenance staff. Until now, this service was
only available for elevators in buildings up to 120
meters in height.
With its Long-period Seismic Motion Operation
Mode also achieving an industry first by widening
support to super-high structures of up to 300
meters, Fujitec has strengthened the earthquake
safety features it offers to the next level.
09Fujitec Semiannual Report 2009
Without this function, operations cannot be restored until maintenance personnel arrive.
Automatic diagnosis and provisional restoration
of operations* (optional spec with charge)
* This function requires a conclusion of the New Gold Maintenance Agreement.
Flow chart: Long-period Seismic Motion Operation Mode
High Very high
Sway level
Stop at the nearest floor for passengers to evacuate and shut down operation
Restoration to normal operation (full recovery).
Sensor detects sways has ended
Inspection and safety verificationby maintenance personnel.
Automatic resetof sensors
Elevator remains shut down to
prevent secondary disaster
Low
Financial SectionConsolidated Financial Review(Amounts in Japanese yen have been translated into U.S. dollars at the rate of ¥90 / U.S.$1.00.)
10Fujitec Semiannual Report 2009
Operating Results
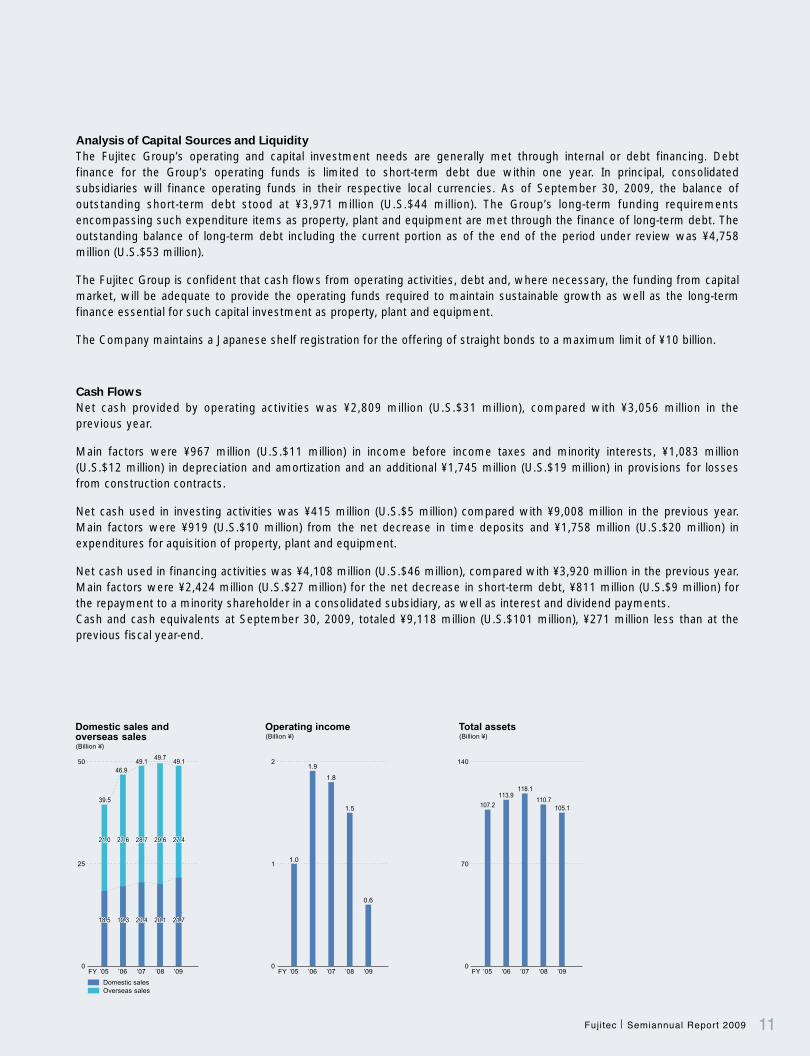
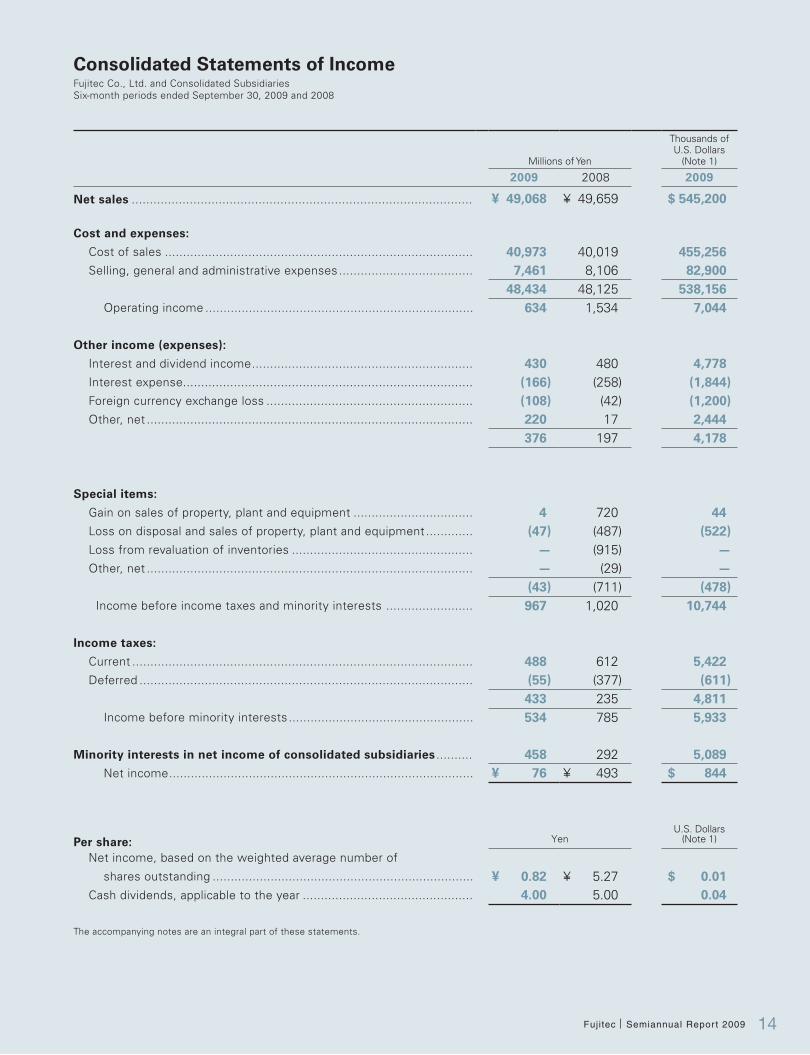
During the six-month period ended September 30, 2009, consolidated net sales decreased 1.2% compared with the year-earlier period to ¥49,068 million (U.S.$545 million). This result reflects an 8.0% increase in domestic sales, a 7.4% decline in overseas sales, due to effects from the appreciation of the Japanese yen.
New orders received during the period under review declined 22.5% compared to the previous year to ¥48,326 million (U.S.$537 million). This was due to a 13.6% drop in domestic orders to ¥22,853 million caused by plunging new construction starts for condominiums combined with a downturn in the real estate market, while overseas orders declined 29.1% to ¥25,473 million amid a fall in global demand and the impact of yen appreciation. Notably, overseas orders at the same exchange rates as the previous year decreased 18.2%.
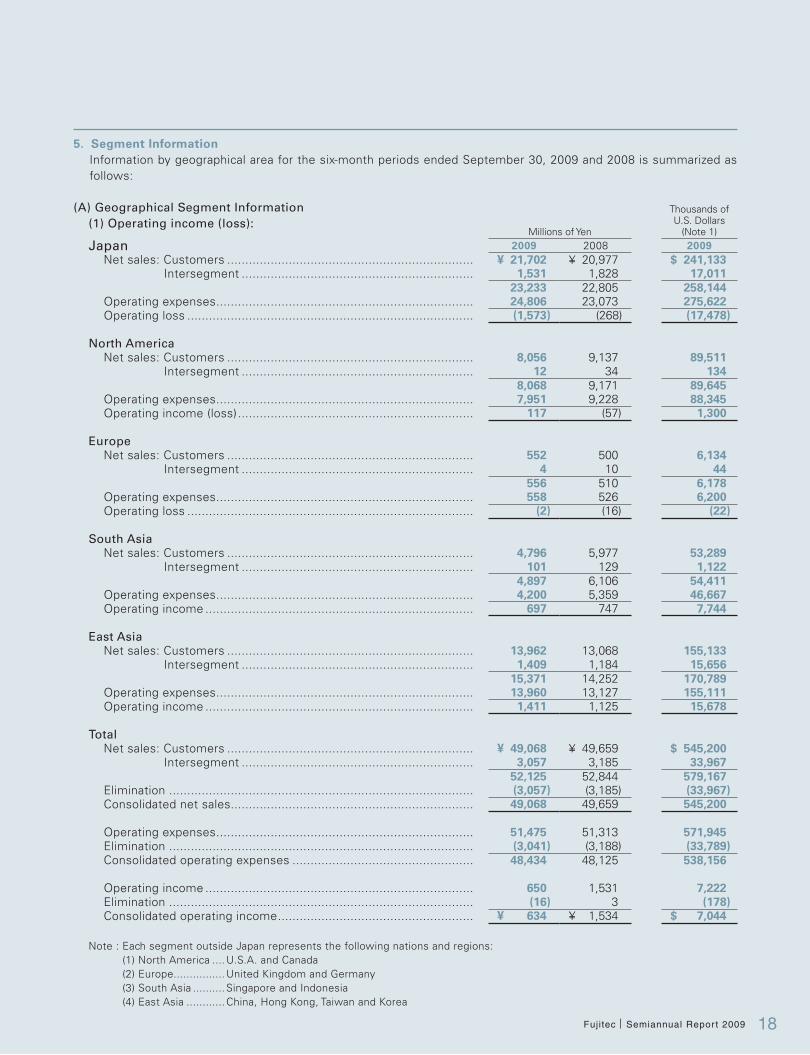
By geographical segment, net sales in Japan increased 1.9% to ¥23,233 million (U.S.$258 million), reflecting lower exports but higher revenue from modernization work. In North America, the appreciation of the Japanese yen lowered net sales 12.0% to ¥8,068 million (U.S.$90 million). Net sales in Europe increased ¥46 million, centered on maintenance work and sales of escalators, to ¥556 million (U.S.$6 million). In South Asia, net sales fell 19.8% to ¥4,897 million (U.S.$54 million) under the impact of yen appreciation. Meanwhile, East Asia saw net sales climb 7.9% to ¥15,371 million (U.S.$171 million). This was attributable to higher sales of GLVF-II standard model elevators and high-speed model elevators in China. At the same time, domestic and foreign sales of GS-NX series escalators were firm. Notably, sales at the same exchange rates as the previous year gained 21.6% year on year. The ratio of overseas sales to consolidated net sales fell 3.7% to 55.9% from 59.6%.
As to earnings, operating income declined 58.7% year on year to ¥634 million (U.S.$7 million). Viewed by region, in Japan the Company posted an operating loss of ¥1,573 million (U.S.$17 million), widened from an operating loss of ¥268 million in the year-earlier period. This was mostly due to provisioning for losses from construction contracts, overriding positive effects from reduced cost of sales for XIOR standard model elevators and fixed-cost reductions. In North America, operating income rebounded to ¥117 (U.S.$1 million) million from an operating loss of ¥57 million in the previous year, partly due to enhanced profitability of new construction contracts and fixed-cost reductions. In Europe, despite higher income from maintenance work, an operating loss of ¥2 million resulted, albeit narrowed from a ¥15 million operating loss in the previous year. In South Asia, operating income decreased 6.7% to ¥697 million (U.S.$8 million) under the impact of 15.9% yen appreciation compared to the previous year. In East Asia, increased sales and cost reductions lifted operating income 25.5% to ¥1,411 million (U.S.$16 million). Notably, operating income excluding foreign exchange effects gained 42.3% from the year before.
Non-operating income (net) increased ¥179 million on the year to ¥376 million (U.S.$4 million). Major components were interest and dividend income, which declined ¥50 million to ¥430 million (U.S.$5 million), interest expenses, which contracted ¥92 million to ¥166 million (U.S.$2 million) and foreign currency exchange losses, which widened ¥66 million to ¥108 million (U.S.$1 million), marking the continuing appreciation in the value of the Japanese yen.Special items (net) improved ¥668 million to ¥43 million (net) (U.S.$0.5 million), compared with ¥711 million the year before, due to reduced inventory valuation losses.
As a result of the foregoing, income before income taxes and minority interests decreased ¥53 million compared to the previous year to ¥967 million (U.S.$11 million).In the six-month period under review, income tax expenses increased ¥198 million to ¥433 million (U.S.$5 million) while minority interests in net income of consolidated subsidiaries climbed ¥166 million to ¥458 million (U.S.$5 million).Net income for the period totaled ¥76 million (U.S.$0.8 million), marking a decline of 84.4% compared to the previous year.
Financial Position
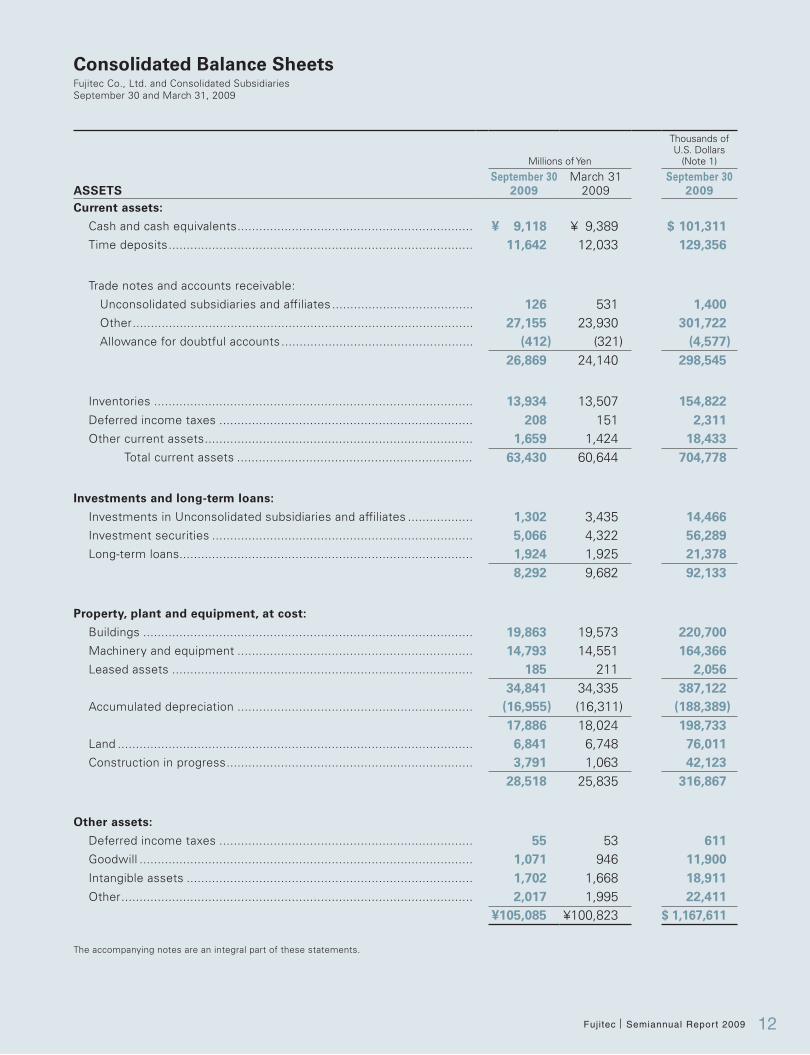
Total assets as of September 30, 2009, stood at ¥105,085 million (U.S.$1,168 million), an increase of ¥4,262 million compared with the previous fiscal year-end. This was mainly due to ¥2,729 million higher trade notes and accounts receivable and a ¥2,728 million increase in construction in progress, while investments declined ¥1,389 million.
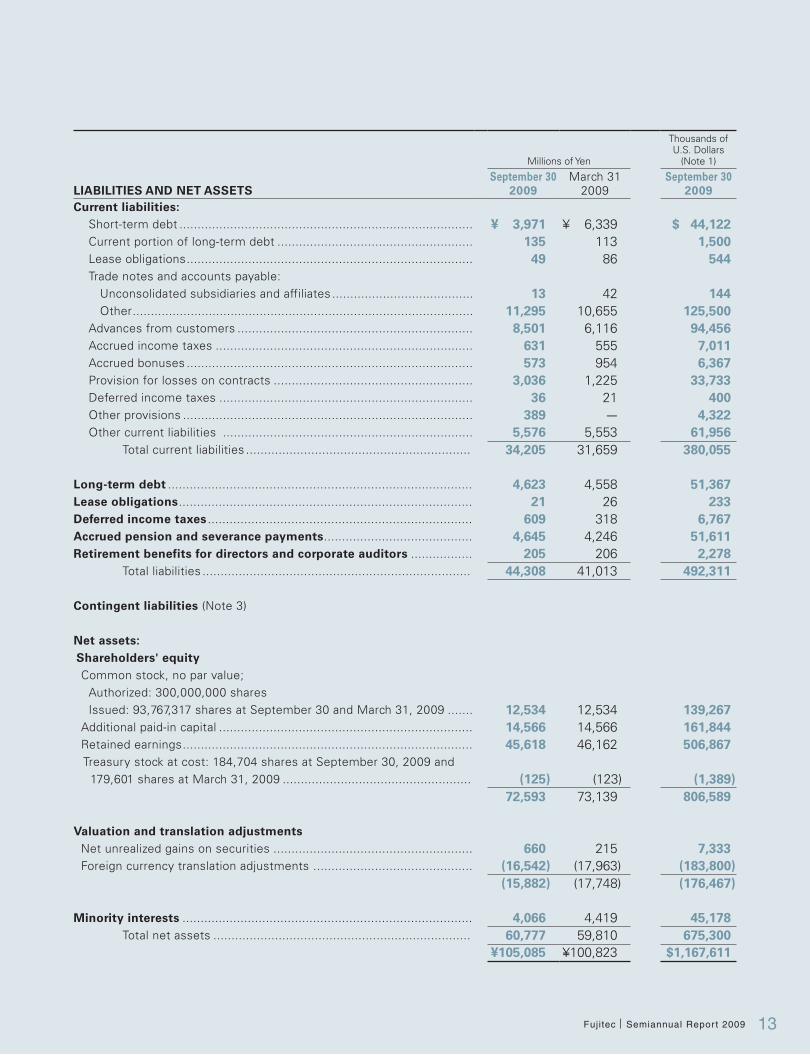
Total liabilities increased ¥3,295 million compared with the previous fiscal year-end to ¥44,308 million (U.S.$492 million). This was mainly due to higher provision for losses on contracts and higher advances from customers, combined with reduced short-term debt.
Net assets including minority interests increased ¥967 million compared with the previous fiscal year-end to ¥60,777 million (U.S.$675 million). Main factors were a ¥544 million decline in retained earnings due to payment of the fiscal year-end dividends and a ¥1,421 million improvement in foreign currency translation adjustments.
The consolidated equity ratio contracted 0.9% compared with the previous fiscal year-end to 54.0 %. Net assets per share at September 30, 2009, was ¥606.00, an increase of ¥14.3 from the previous fiscal year-end.
25
50
0FY ’07’06 ’08
(Billion ¥)
Domestic sales andoverseas sales
46.9
Domestic salesOverseas sales
27.627.627.6
19.319.319.3
’05
28.728.728.7
20.420.420.418.518.5
21.021.021.0
18.5
2
1
FY ’070
(Billion ¥)Operating income
’05
1.0
’06
1.9
1.8
1.5
0.6
140
70
FY ’070
(Billion ¥)Total assets
113.9
’05
118.1
107.2
’06’08 ’08’09 ’09 ’09
49.1 49.1
29.629.629.6
20.120.120.1
49.7
27.427.427.4
21.721.721.7
110.7105.1
39.5
11Fujitec Semiannual Report 2009
Analysis of Capital Sources and Liquidity
The Fujitec Group’s operating and capital investment needs are generally met through internal or debt financing. Debt finance for the Group’s operating funds is limited to short-term debt due within one year. In principal, consolidated subsidiaries will finance operating funds in their respective local currencies. As of September 30, 2009, the balance of outstanding short-term debt stood at ¥3,971 million (U.S.$44 million). The Group’s long-term funding requirements encompassing such expenditure items as property, plant and equipment are met through the finance of long-term debt. The outstanding balance of long-term debt including the current portion as of the end of the period under review was ¥4,758 million (U.S.$53 million).
The Fujitec Group is confident that cash flows from operating activities, debt and, where necessary, the funding from capital market, will be adequate to provide the operating funds required to maintain sustainable growth as well as the long-term finance essential for such capital investment as property, plant and equipment.
The Company maintains a Japanese shelf registration for the offering of straight bonds to a maximum limit of ¥10 billion.
Cash Flows
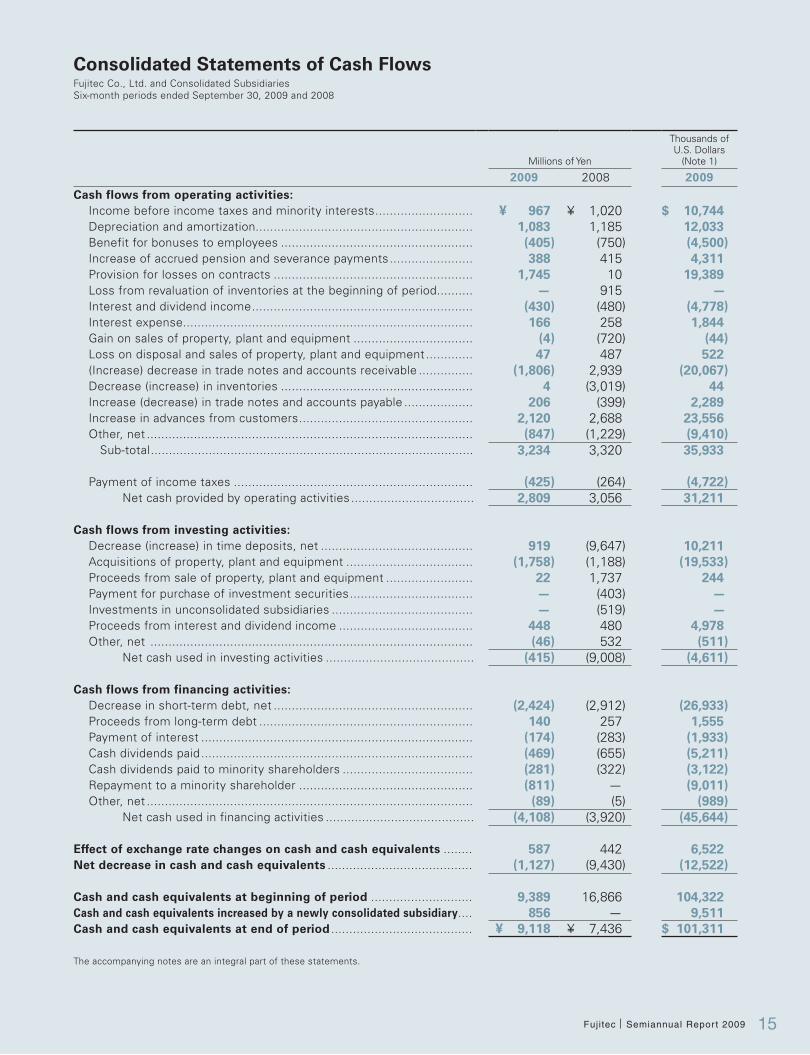
Net cash provided by operating activities was ¥2,809 million (U.S.$31 million), compared with ¥3,056 million in the previous year.
Main factors were ¥967 million (U.S.$11 million) in income before income taxes and minority interests, ¥1,083 million (U.S.$12 million) in depreciation and amortization and an additional ¥1,745 million (U.S.$19 million) in provisions for losses from construction contracts.
Net cash used in investing activities was ¥415 million (U.S.$5 million) compared with ¥9,008 million in the previous year. Main factors were ¥919 (U.S.$10 million) from the net decrease in time deposits and ¥1,758 million (U.S.$20 million) in expenditures for aquisition of property, plant and equipment.
Net cash used in financing activities was ¥4,108 million (U.S.$46 million), compared with ¥3,920 million in the previous year. Main factors were ¥2,424 million (U.S.$27 million) for the net decrease in short-term debt, ¥811 million (U.S.$9 million) for the repayment to a minority shareholder in a consolidated subsidiary, as well as interest and dividend payments.Cash and cash equivalents at September 30, 2009, totaled ¥9,118 million (U.S.$101 million), ¥271 million less than at the previous fiscal year-end.
12
Consolidated Balance SheetsFujitec Co., Ltd. and Consolidated SubsidiariesSeptember 30 and March 31, 2009
Millions of Yen
Thousands ofU.S. Dollars
(Note 1)
September 30 March 31 September 30ASSETS 2009 2009 2009Current assets:
Cash and cash equivalents ................................................................. ¥ 9,118 ¥ 9,389 $ 101,311 Time deposits .................................................................................... 11,642 12,033 129,356
Trade notes and accounts receivable: Unconsolidated subsidiaries and affiliates ....................................... 126 531 1,400 Other .............................................................................................. 27,155 23,930 301,722 Allowance for doubtful accounts ..................................................... (412) (321) (4,577)
26,869 24,140 298,545
Inventories ........................................................................................ 13,934 13,507 154,822 Deferred income taxes ...................................................................... 208 151 2,311 Other current assets .......................................................................... 1,659 1,424 18,433
Total current assets ................................................................. 63,430 60,644 704,778
Investments and long-term loans:
Investments in Unconsolidated subsidiaries and affiliates .................. 1,302 3,435 14,466Investment securities ........................................................................ 5,066 4,322 56,289Long-term loans................................................................................. 1,924 1,925 21,378
8,292 9,682 92,133
Property, plant and equipment, at cost: Buildings ........................................................................................... 19,863 19,573 220,700Machinery and equipment ................................................................. 14,793 14,551 164,366Leased assets ................................................................................... 185 211 2,056
34,841 34,335 387,122Accumulated depreciation ................................................................. (16,955) (16,311) (188,389)
17,886 18,024 198,733Land .................................................................................................. 6,841 6,748 76,011Construction in progress .................................................................... 3,791 1,063 42,123
28,518 25,835 316,867
Other assets:
Deferred income taxes ...................................................................... 55 53 611 Goodwill ............................................................................................ 1,071 946 11,900Intangible assets ............................................................................... 1,702 1,668 18,911Other ................................................................................................. 2,017 1,995 22,411
¥105,085 ¥100,823 $ 1,167,611
The accompanying notes are an integral part of these statements.
13
Millions of Yen
Thousands ofU.S. Dollars
(Note 1)
September 30 March 31 September 30LIABILITIES AND NET ASSETS 2009 2009 2009Current liabilities:
Short-term debt ................................................................................. ¥ 3,971 ¥ 6,339 $ 44,122 Current portion of long-term debt ...................................................... 135 113 1,500 Lease obligations ............................................................................... 49 86 544Trade notes and accounts payable:
Unconsolidated subsidiaries and affiliates ....................................... 13 42 144Other .............................................................................................. 11,295 10,655 125,500
Advances from customers ................................................................. 8,501 6,116 94,456Accrued income taxes ....................................................................... 631 555 7,011Accrued bonuses ............................................................................... 573 954 6,367Provision for losses on contracts ....................................................... 3,036 1,225 33,733Deferred income taxes ...................................................................... 36 21 400Other provisions ................................................................................ 389 - 4,322Other current liabilities ..................................................................... 5,576 5,553 61,956
Total current liabilities .............................................................. 34,205 31,659 380,055
Long-term debt .................................................................................... 4,623 4,558 51,367Lease obligations ................................................................................. 21 26 233Deferred income taxes ......................................................................... 609 318 6,767Accrued pension and severance payments ......................................... 4,645 4,246 51,611Retirement benefits for directors and corporate auditors ................. 205 206 2,278
Total liabilities .......................................................................... 44,308 41,013 492,311
Contingent liabilities (Note 3)
Net assets: Shareholders' equity Common stock, no par value;
Authorized: 300,000,000 shares Issued: 93,767,317 shares at September 30 and March 31, 2009 ....... 12,534 12,534 139,267
Additional paid-in capital ...................................................................... 14,566 14,566 161,844Retained earnings ................................................................................ 45,618 46,162 506,867 Treasury stock at cost: 184,704 shares at September 30, 2009 and 179,601 shares at March 31, 2009 .................................................... (125) (123) (1,389)
72,593 73,139 806,589
Valuation and translation adjustmentsNet unrealized gains on securities ....................................................... 660 215 7,333Foreign currency translation adjustments ............................................ (16,542) (17,963) (183,800)
(15,882) (17,748) (176,467)
Minority interests ................................................................................ 4,066 4,419 45,178 Total net assets ....................................................................... 60,777 59,810 675,300
¥105,085 ¥100,823 $1,167,611
14
Millions of Yen
Thousands ofU.S. Dollars
(Note 1)
2009 2008 2009
Net sales .............................................................................................. ¥ 49,068 ¥ 49,659 $ 545,200 Cost and expenses:
Cost of sales ..................................................................................... 40,973 40,019 455,256Selling, general and administrative expenses ..................................... 7,461 8,106 82,900
48,434 48,125 538,156Operating income .......................................................................... 634 1,534 7,044
Other income (expenses):
Interest and dividend income ............................................................. 430 480 4,778 Interest expense................................................................................ (166) (258) (1,844)Foreign currency exchange loss ......................................................... (108) (42) (1,200)Other, net .......................................................................................... 220 17 2,444
376 197 4,178
Special items: Gain on sales of property, plant and equipment ................................. 4 720 44Loss on disposal and sales of property, plant and equipment ............. (47) (487) (522)Loss from revaluation of inventories .................................................. - (915) -Other, net .......................................................................................... - (29) -
(43) (711) (478) Income before income taxes and minority interests ........................ 967 1,020 10,744
Income taxes:
Current .............................................................................................. 488 612 5,422Deferred ............................................................................................ (55) (377) (611)
433 235 4,811Income before minority interests ................................................... 534 785 5,933
Minority interests in net income of consolidated subsidiaries .......... 458 292 5,089Net income .................................................................................... ¥ 76 ¥ 493 $ 844
Per share: YenU.S. Dollars
(Note 1)
Net income, based on the weighted average number of
shares outstanding ........................................................................ ¥ 0.82 ¥ 5.27 $ 0.01 Cash dividends, applicable to the year ............................................... 4.00 5.00 0.04
The accompanying notes are an integral part of these statements.
Consolidated Statements of IncomeFujitec Co., Ltd. and Consolidated SubsidiariesSix-month periods ended September 30, 2009 and 2008
15
Millions of Yen
Thousands ofU.S. Dollars
(Note 1)
2009 2008 2009Cash flows from operating activities:
Income before income taxes and minority interests ........................... ¥ 967 ¥ 1,020 $ 10,744Depreciation and amortization............................................................ 1,083 1,185 12,033Benefit for bonuses to employees ..................................................... (405) (750) (4,500)Increase of accrued pension and severance payments ....................... 388 415 4,311Provision for losses on contracts ....................................................... 1,745 10 19,389Loss from revaluation of inventories at the beginning of period.......... - 915 -Interest and dividend income ............................................................. (430) (480) (4,778)Interest expense................................................................................ 166 258 1,844Gain on sales of property, plant and equipment ................................. (4) (720) (44)Loss on disposal and sales of property, plant and equipment ............. 47 487 522(Increase) decrease in trade notes and accounts receivable ............... (1,806) 2,939 (20,067)Decrease (increase) in inventories ..................................................... 4 (3,019) 44Increase (decrease) in trade notes and accounts payable ................... 206 (399) 2,289Increase in advances from customers ................................................ 2,120 2,688 23,556Other, net .......................................................................................... (847) (1,229) (9,410)
Sub-total ......................................................................................... 3,234 3,320 35,933
Payment of income taxes .................................................................. (425) (264) (4,722)Net cash provided by operating activities .................................. 2,809 3,056 31,211
Cash flows from investing activities:
Decrease (increase) in time deposits, net .......................................... 919 (9,647) 10,211Acquisitions of property, plant and equipment ................................... (1,758) (1,188) (19,533)Proceeds from sale of property, plant and equipment ........................ 22 1,737 244Payment for purchase of investment securities .................................. - (403) -Investments in unconsolidated subsidiaries ....................................... - (519) -Proceeds from interest and dividend income ..................................... 448 480 4,978Other, net ......................................................................................... (46) 532 (511)
Net cash used in investing activities ......................................... (415) (9,008) (4,611)
Cash flows from financing activities:Decrease in short-term debt, net ....................................................... (2,424) (2,912) (26,933)Proceeds from long-term debt ........................................................... 140 257 1,555Payment of interest ........................................................................... (174) (283) (1,933)Cash dividends paid ........................................................................... (469) (655) (5,211)Cash dividends paid to minority shareholders .................................... (281) (322) (3,122)Repayment to a minority shareholder ................................................ (811) - (9,011)Other, net .......................................................................................... (89) (5) (989)
Net cash used in financing activities ......................................... (4,108) (3,920) (45,644)
Effect of exchange rate changes on cash and cash equivalents ........ 587 442 6,522Net decrease in cash and cash equivalents ........................................ (1,127) (9,430) (12,522)
Cash and cash equivalents at beginning of period ............................ 9,389 16,866 104,322Cash and cash equivalents increased by a newly consolidated subsidiary.... 856 - 9,511Cash and cash equivalents at end of period ....................................... ¥ 9,118 ¥ 7,436 $ 101,311
The accompanying notes are an integral part of these statements.
Consolidated Statements of Cash FlowsFujitec Co., Ltd. and Consolidated SubsidiariesSix-month periods ended September 30, 2009 and 2008
16
Notes to Consolidated Financial StatementsFujitec Co., Ltd. and Consolidated SubsidiariesSix-month periods ended September 30, 2009 and 2008
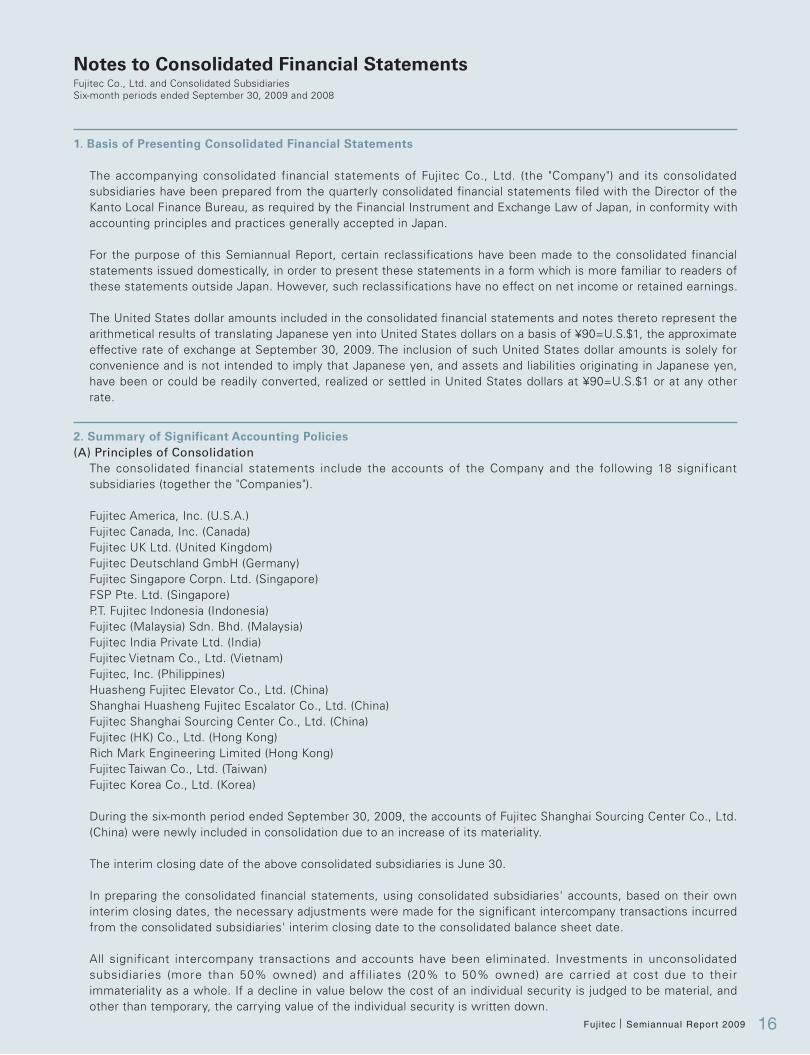
1. Basis of Presenting Consolidated Financial Statements
The accompanying consolidated financial statements of Fujitec Co., Ltd. (the "Company") and its consolidated subsidiaries have been prepared from the quarterly consolidated financial statements filed with the Director of the Kanto Local Finance Bureau, as required by the Financial Instrument and Exchange Law of Japan, in conformity with accounting principles and practices generally accepted in Japan.
For the purpose of this Semiannual Report, certain reclassifications have been made to the consolidated financial statements issued domestically, in order to present these statements in a form which is more familiar to readers of these statements outside Japan. However, such reclassifications have no effect on net income or retained earnings.
The United States dollar amounts included in the consolidated financial statements and notes thereto represent the arithmetical results of translating Japanese yen into United States dollars on a basis of ¥90=U.S.$1, the approximate effective rate of exchange at September 30, 2009. The inclusion of such United States dollar amounts is solely for convenience and is not intended to imply that Japanese yen, and assets and liabilities originating in Japanese yen, have been or could be readily converted, realized or settled in United States dollars at ¥90=U.S.$1 or at any other rate.
2. Summary of Significant Accounting Policies(A) Principles of Consolidation The consolidated financial statements include the accounts of the Company and the following 18 significant
subsidiaries (together the "Companies").
Fujitec America, Inc. (U.S.A.) Fujitec Canada, Inc. (Canada) Fujitec UK Ltd. (United Kingdom) Fujitec Deutschland GmbH (Germany) Fujitec Singapore Corpn. Ltd. (Singapore) FSP Pte. Ltd. (Singapore) P.T. Fujitec Indonesia (Indonesia) Fujitec (Malaysia) Sdn. Bhd. (Malaysia) Fujitec India Private Ltd. (India) Fujitec Vietnam Co., Ltd. (Vietnam) Fujitec, Inc. (Philippines) Huasheng Fujitec Elevator Co., Ltd. (China) Shanghai Huasheng Fujitec Escalator Co., Ltd. (China) Fujitec Shanghai Sourcing Center Co., Ltd. (China) Fujitec (HK) Co., Ltd. (Hong Kong) Rich Mark Engineering Limited (Hong Kong) Fujitec Taiwan Co., Ltd. (Taiwan) Fujitec Korea Co., Ltd. (Korea)
During the six-month period ended September 30, 2009, the accounts of Fujitec Shanghai Sourcing Center Co., Ltd. (China) were newly included in consolidation due to an increase of its materiality.
The interim closing date of the above consolidated subsidiaries is June 30.
In preparing the consolidated financial statements, using consolidated subsidiaries' accounts, based on their own interim closing dates, the necessary adjustments were made for the significant intercompany transactions incurred from the consolidated subsidiaries' interim closing date to the consolidated balance sheet date.
All significant intercompany transactions and accounts have been eliminated. Investments in unconsolidated subsidiaries (more than 50% owned) and affiliates (20% to 50% owned) are carried at cost due to their immateriality as a whole. If a decline in value below the cost of an individual security is judged to be material, and other than temporary, the carrying value of the individual security is written down.
17
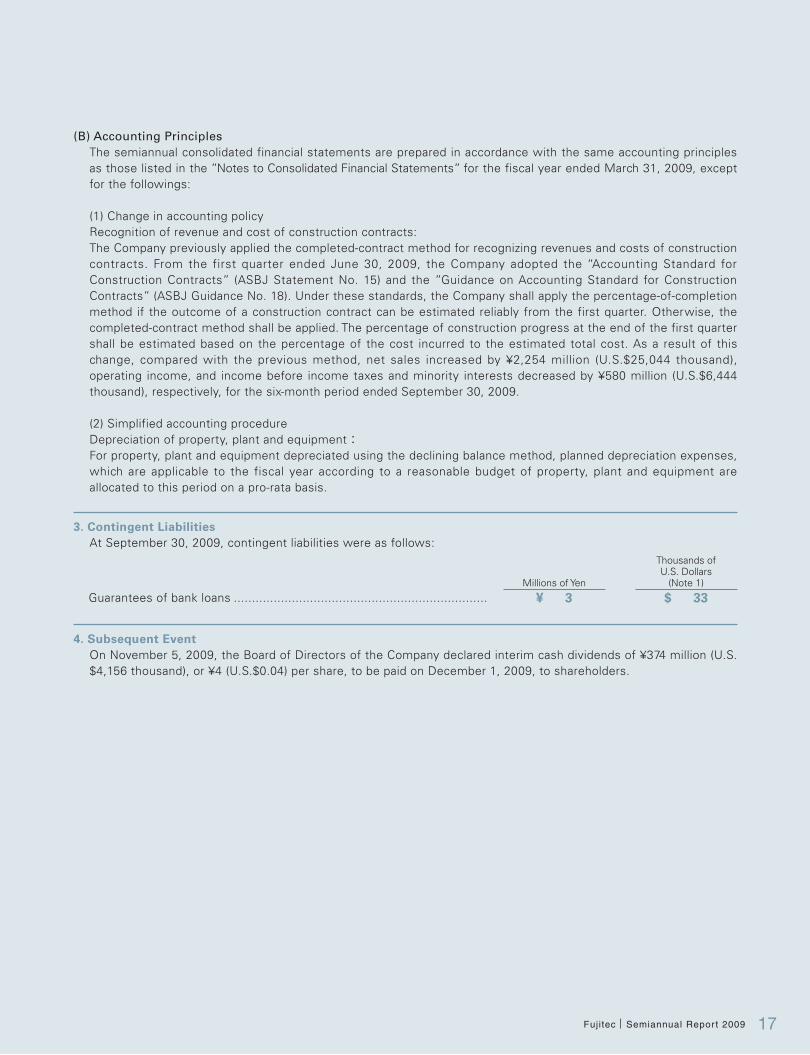
(B) Accounting Principles The semiannual consolidated financial statements are prepared in accordance with the same accounting principles
as those listed in the ”Notes to Consolidated Financial Statements” for the fiscal year ended March 31, 2009, except for the followings:
(1) Change in accounting policyRecognition of revenue and cost of construction contracts:The Company previously applied the completed-contract method for recognizing revenues and costs of construction contracts. From the first quarter ended June 30, 2009, the Company adopted the “Accounting Standard for Construction Contracts” (ASBJ Statement No. 15) and the ”Guidance on Accounting Standard for Construction Contracts” (ASBJ Guidance No. 18). Under these standards, the Company shall apply the percentage-of-completion method if the outcome of a construction contract can be estimated reliably from the first quarter. Otherwise, the completed-contract method shall be applied. The percentage of construction progress at the end of the first quarter shall be estimated based on the percentage of the cost incurred to the estimated total cost. As a result of this change, compared with the previous method, net sales increased by ¥2,254 million (U.S.$25,044 thousand), operating income, and income before income taxes and minority interests decreased by ¥580 million (U.S.$6,444 thousand), respectively, for the six-month period ended September 30, 2009.
(2) Simplified accounting procedure Depreciation of property, plant and equipment:For property, plant and equipment depreciated using the declining balance method, planned depreciation expenses, which are applicable to the fiscal year according to a reasonable budget of property, plant and equipment are allocated to this period on a pro-rata basis.
3. Contingent Liabilities At September 30, 2009, contingent liabilities were as follows:
Millions of Yen
Thousands ofU.S. Dollars
(Note 1)
Guarantees of bank loans ...................................................................... ¥ 3 $ 33
4. Subsequent Event On November 5, 2009, the Board of Directors of the Company declared interim cash dividends of ¥374 million (U.S.
$4,156 thousand), or ¥4 (U.S.$0.04) per share, to be paid on December 1, 2009, to shareholders.
18
5. Segment Information Information by geographical area for the six-month periods ended September 30, 2009 and 2008 is summarized as
follows:
(A) Geographical Segment Information(1) Operating income (loss):
Millions of Yen
Thousands ofU.S. Dollars
(Note 1)Japan 2009 2008 2009
Net sales: Customers .................................................................... ¥ 21,702 ¥ 20,977 $ 241,133 Intersegment ................................................................ 1,531 1,828 17,011
23,233 22,805 258,144Operating expenses ....................................................................... 24,806 23,073 275,622 Operating loss ............................................................................... (1,573) (268) (17,478)
North AmericaNet sales: Customers .................................................................... 8,056 9,137 89,511 Intersegment ................................................................ 12 34 134
8,068 9,171 89,645Operating expenses ....................................................................... 7,951 9,228 88,345Operating income (loss) ................................................................. 117 (57) 1,300
EuropeNet sales: Customers .................................................................... 552 500 6,134 Intersegment ................................................................ 4 10 44
556 510 6,178Operating expenses ....................................................................... 558 526 6,200Operating loss ............................................................................... (2) (16) (22)
South AsiaNet sales: Customers .................................................................... 4,796 5,977 53,289 Intersegment ................................................................ 101 129 1,122
4,897 6,106 54,411Operating expenses ....................................................................... 4,200 5,359 46,667Operating income .......................................................................... 697 747 7,744
East AsiaNet sales: Customers .................................................................... 13,962 13,068 155,133 Intersegment ................................................................ 1,409 1,184 15,656
15,371 14,252 170,789Operating expenses ....................................................................... 13,960 13,127 155,111Operating income .......................................................................... 1,411 1,125 15,678
TotalNet sales: Customers .................................................................... ¥ 49,068 ¥ 49,659 $ 545,200 Intersegment ................................................................ 3,057 3,185 33,967
52,125 52,844 579,167Elimination .................................................................................... (3,057) (3,185) (33,967)Consolidated net sales................................................................... 49,068 49,659 545,200
Operating expenses ....................................................................... 51,475 51,313 571,945Elimination .................................................................................... (3,041) (3,188) (33,789)Consolidated operating expenses .................................................. 48,434 48,125 538,156
Operating income .......................................................................... 650 1,531 7,222Elimination .................................................................................... (16) 3 (178)Consolidated operating income ...................................................... ¥ 634 ¥ 1,534 $ 7,044
Note : Each segment outside Japan represents the following nations and regions: (1) North America ....U.S.A. and Canada (2) Europe................United Kingdom and Germany (3) South Asia .......... Singapore and Indonesia (4) East Asia ............China, Hong Kong, Taiwan and Korea

19
(B) Overseas Sales
Millions of Yen
Thousands ofU.S. Dollars
(Note 1)2009 2008 2009
The Americas................................................................................. ¥ 8,137 ¥ 9,375 $ 90,411South Asia ..................................................................................... 4,797 5,977 53,300East Asia ....................................................................................... 13,218 12,283 146,867Other areas ................................................................................... 1,272 1,981 14,133Total .............................................................................................. ¥ 27,424 ¥ 29,616 $304,711Percentage of overseas sales to net sales ..................................... 55.9% 59.6%
Notes:1. Overseas sales are the sum of export sales of the Company and net sales of consolidated subsidiaries to each segment after
elimination of all intercompany transactions.
2. Each segment outside Japan represents the following nations and regions: (1) The Americas ......U.S.A., Canada, Argentina and Venezuela (2) South Asia ...........Singapore, Philippines and Malaysia (3) East Asia .............China , Hong Kong, Taiwan and Korea (4) Other areas .........Europe and Middle East
20
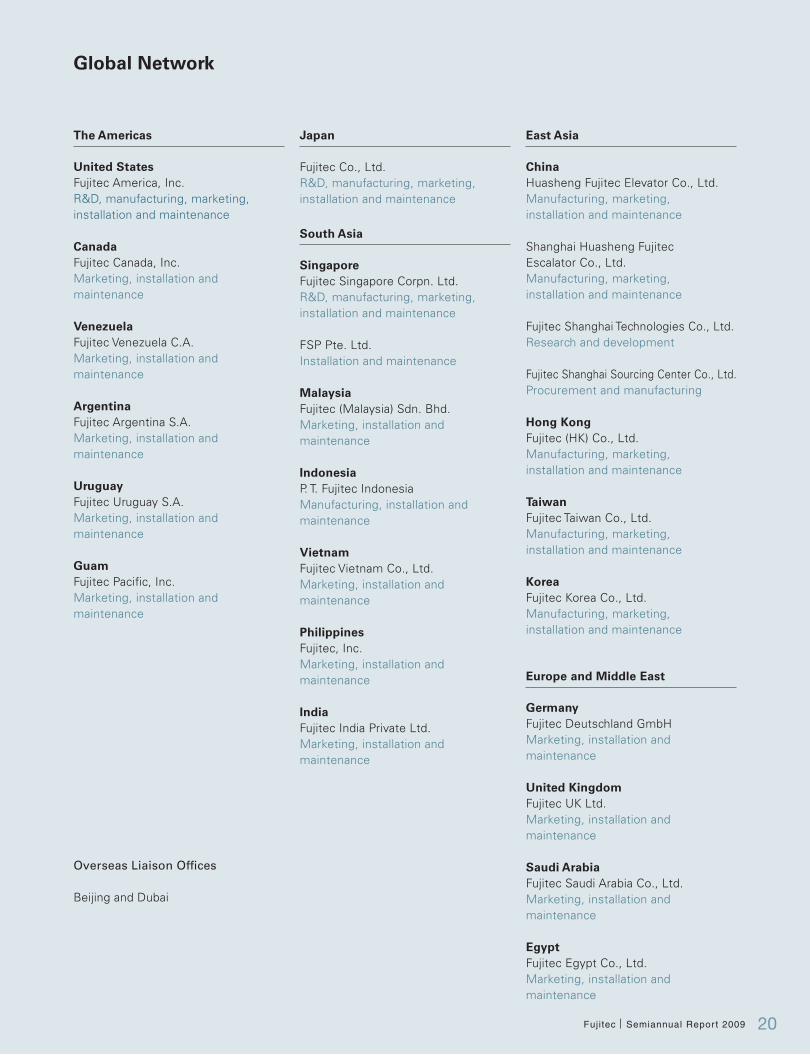
Global Network
The Americas East AsiaJapan
United StatesFujitec America, Inc.R&D, manufacturing, marketing,installation and maintenance
CanadaFujitec Canada, Inc.Marketing, installation andmaintenance
VenezuelaFujitec Venezuela C.A.Marketing, installation andmaintenance
ArgentinaFujitec Argentina S.A.Marketing, installation andmaintenance
UruguayFujitec Uruguay S.A.Marketing, installation andmaintenance
GuamFujitec Pacific, Inc.Marketing, installation andmaintenance
Overseas Liaison Offices
Beijing and Dubai
Fujitec Co., Ltd.R&D, manufacturing, marketing,installation and maintenance
South Asia
SingaporeFujitec Singapore Corpn. Ltd.R&D, manufacturing, marketing,installation and maintenance
FSP Pte. Ltd.Installation and maintenance
MalaysiaFujitec (Malaysia) Sdn. Bhd.Marketing, installation andmaintenance
IndonesiaP. T. Fujitec IndonesiaManufacturing, installation andmaintenance
VietnamFujitec Vietnam Co., Ltd.Marketing, installation andmaintenance
PhilippinesFujitec, Inc.Marketing, installation andmaintenance
IndiaFujitec India Private Ltd.Marketing, installation andmaintenance
ChinaHuasheng Fujitec Elevator Co., Ltd.Manufacturing, marketing,installation and maintenance
Shanghai Huasheng FujitecEscalator Co., Ltd.Manufacturing, marketing,installation and maintenance
Fujitec Shanghai Technologies Co., Ltd.Research and development
Fujitec Shanghai Sourcing Center Co., Ltd.Procurement and manufacturing
Hong KongFujitec (HK) Co., Ltd.Manufacturing, marketing,installation and maintenance
TaiwanFujitec Taiwan Co., Ltd.Manufacturing, marketing,installation and maintenance
KoreaFujitec Korea Co., Ltd.Manufacturing, marketing,installation and maintenance
Europe and Middle East
GermanyFujitec Deutschland GmbHMarketing, installation andmaintenance
United KingdomFujitec UK Ltd.Marketing, installation andmaintenance
Saudi ArabiaFujitec Saudi Arabia Co., Ltd.Marketing, installation andmaintenance
EgyptFujitec Egypt Co., Ltd.Marketing, installation andmaintenance
21
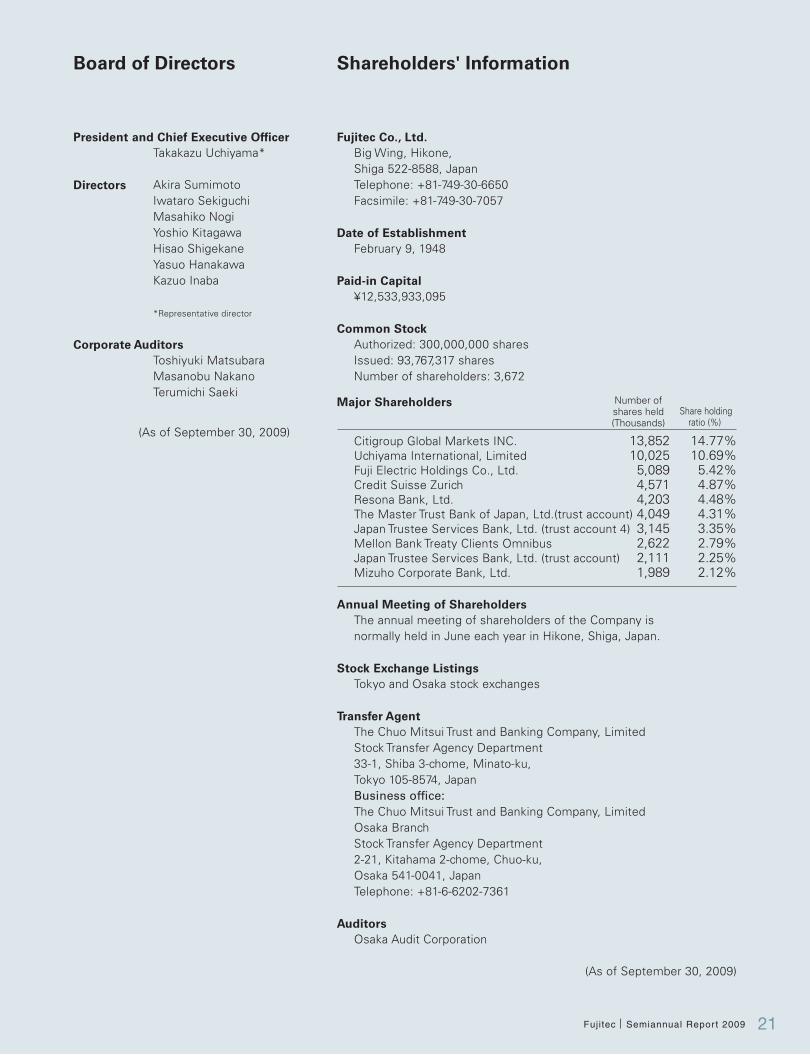
Board of Directors Shareholders' Information
Takakazu Uchiyama*
Akira SumimotoIwataro Sekiguchi Masahiko NogiYoshio KitagawaHisao ShigekaneYasuo HanakawaKazuo Inaba
*Representative director
Toshiyuki MatsubaraMasanobu NakanoTerumichi Saeki
Big Wing, Hikone, Shiga 522-8588, JapanTelephone: +81-749-30-6650Facsimile: +81-749-30-7057
February 9, 1948
¥12,533,933,095
Authorized: 300,000,000 sharesIssued: 93,767,317 sharesNumber of shareholders: 3,672
Fujitec Co., Ltd.
Date of Establishment
Paid-in Capital
Common Stock
The annual meeting of shareholders of the Company isnormally held in June each year in Hikone, Shiga, Japan.
Tokyo and Osaka stock exchanges
The Chuo Mitsui Trust and Banking Company, LimitedStock Transfer Agency Department33-1, Shiba 3-chome, Minato-ku,Tokyo 105-8574, JapanBusiness office:The Chuo Mitsui Trust and Banking Company, LimitedOsaka BranchStock Transfer Agency Department2-21, Kitahama 2-chome, Chuo-ku,Osaka 541-0041, JapanTelephone: +81-6-6202-7361
Osaka Audit Corporation
(As of September 30, 2009)
Annual Meeting of Shareholders
Stock Exchange Listings
Transfer Agent
Auditors
Major Shareholders
President and Chief Executive Officer
Directors
Corporate Auditors
13,85210,0255,0894,5714,2034,0493,1452,6222,1111,989
Number ofshares held(Thousands)
14.77%10.69%5.42%4.87%4.48%4.31%3.35%2.79%2.25%2.12%
Share holdingratio (%)
Citigroup Global Markets INC.Uchiyama International, LimitedFuji Electric Holdings Co., Ltd.Credit Suisse ZurichResona Bank, Ltd.The Master Trust Bank of Japan, Ltd.(trust account)Japan Trustee Services Bank, Ltd. (trust account 4)Mellon Bank Treaty Clients OmnibusJapan Trustee Services Bank, Ltd. (trust account)Mizuho Corporate Bank, Ltd.
(As of September 30, 2009)