consolidated analysis of soil contaminants
TRANSCRIPT

APPLICATION NOTE 10731
Consolidated analysis of soil contaminantsFour-fold increase in the sample throughput with GC-Orbitrap
IntroductionPolychlorinated biphenyls (PCBs) and polyaromatic hydrocarbons (PAHs) are toxic organic compounds that can contaminate soils, air, sediments, and water as a result of natural and anthropogenic processes. PCBs and PAHs are resistant to environmental degradation and can be transported over long distances. Moreover, due to their lipophilicity these chemicals can undergo biomagnification and accumulation in the food chain and can pose significant health risks to humans. Their toxicity even at very low concentrations means that their presence in the environment needs to be monitored so that the risk of uptake of these compounds into to the food chain and subsequently into human populations is minimized.
Authors: Aaron Lamb, Dominic Roberts, and Cristian Cojocariu Thermo Fisher Scientific, Runcorn, UK
Keywords: Analytical environmental testing, polychlorinated biphenyls (PCBs), polyaromatic hydrocarbons (PAHs), persistent organic pollutants (POPs), QuEChERS, targeted quantification, screening, unknowns, gas chromatography, high resolution mass spectrometry, full scan (FS), sensitivity, Orbitrap Exploris GC, electron ionization (EI), chemical ionization (CI), Chromeleon, Compound Discoverer
GoalThe purpose of this study was to assess the quantitative performance and advantages of PAHs and PCBs using the Thermo Scientific™ Orbitrap Exploris™ GC in addition to screening of unknown soil contaminants.
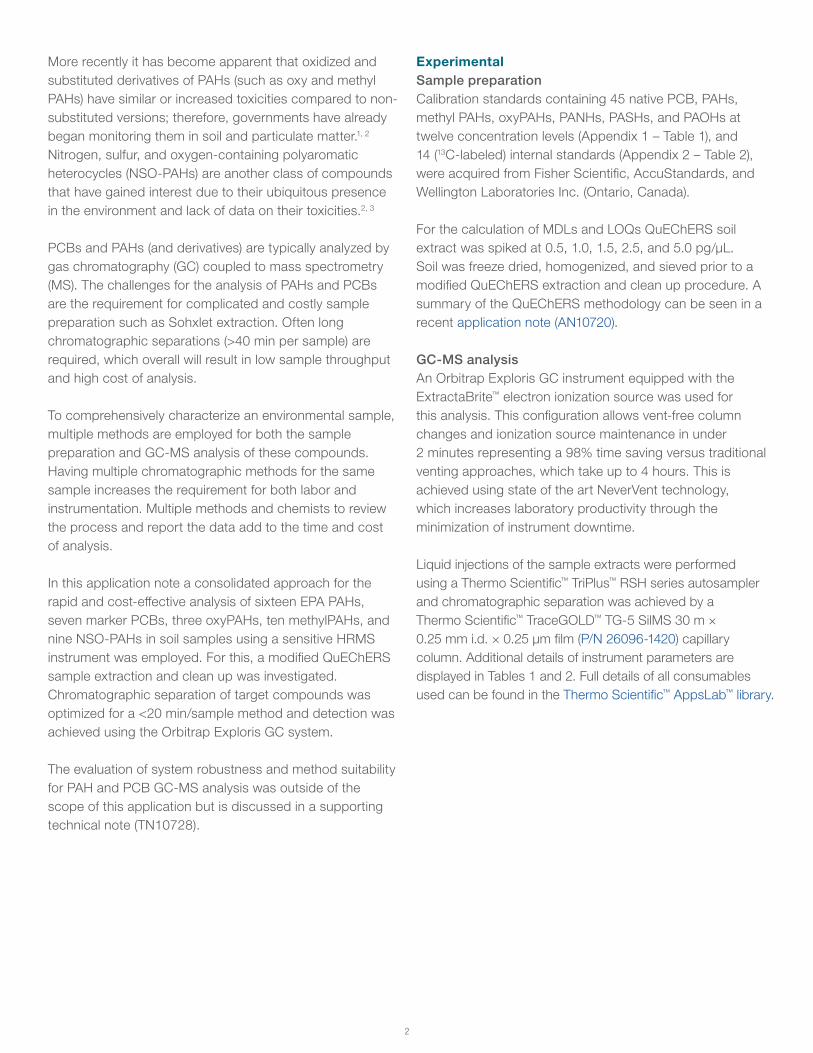
More recently it has become apparent that oxidized and substituted derivatives of PAHs (such as oxy and methyl PAHs) have similar or increased toxicities compared to non-substituted versions; therefore, governments have already began monitoring them in soil and particulate matter.1, 2
Nitrogen, sulfur, and oxygen-containing polyaromatic heterocycles (NSO-PAHs) are another class of compounds that have gained interest due to their ubiquitous presence in the environment and lack of data on their toxicities.2, 3
PCBs and PAHs (and derivatives) are typically analyzed by gas chromatography (GC) coupled to mass spectrometry (MS). The challenges for the analysis of PAHs and PCBs are the requirement for complicated and costly sample preparation such as Sohxlet extraction. Often long chromatographic separations (>40 min per sample) are required, which overall will result in low sample throughput and high cost of analysis.
To comprehensively characterize an environmental sample, multiple methods are employed for both the sample preparation and GC-MS analysis of these compounds. Having multiple chromatographic methods for the same sample increases the requirement for both labor and instrumentation. Multiple methods and chemists to review the process and report the data add to the time and cost of analysis.
In this application note a consolidated approach for the rapid and cost-effective analysis of sixteen EPA PAHs, seven marker PCBs, three oxyPAHs, ten methylPAHs, and nine NSO-PAHs in soil samples using a sensitive HRMS instrument was employed. For this, a modified QuEChERS sample extraction and clean up was investigated. Chromatographic separation of target compounds was optimized for a <20 min/sample method and detection was achieved using the Orbitrap Exploris GC system.
The evaluation of system robustness and method suitability for PAH and PCB GC-MS analysis was outside of the scope of this application but is discussed in a supporting technical note (TN10728).
ExperimentalSample preparationCalibration standards containing 45 native PCB, PAHs, methyl PAHs, oxyPAHs, PANHs, PASHs, and PAOHs at twelve concentration levels (Appendix 1 – Table 1), and 14 (13C-labeled) internal standards (Appendix 2 – Table 2), were acquired from Fisher Scientific, AccuStandards, and Wellington Laboratories Inc. (Ontario, Canada).
For the calculation of MDLs and LOQs QuEChERS soil extract was spiked at 0.5, 1.0, 1.5, 2.5, and 5.0 pg/µL. Soil was freeze dried, homogenized, and sieved prior to a modified QuEChERS extraction and clean up procedure. A summary of the QuEChERS methodology can be seen in a recent application note (AN10720).
GC-MS analysisAn Orbitrap Exploris GC instrument equipped with the ExtractaBrite™ electron ionization source was used for this analysis. This configuration allows vent-free column changes and ionization source maintenance in under 2 minutes representing a 98% time saving versus traditional venting approaches, which take up to 4 hours. This is achieved using state of the art NeverVent technology, which increases laboratory productivity through the minimization of instrument downtime.
Liquid injections of the sample extracts were performed using a Thermo Scientific™ TriPlus™ RSH series autosampler and chromatographic separation was achieved by a Thermo Scientific™ TraceGOLD™ TG-5 SilMS 30 m × 0.25 mm i.d. × 0.25 μm film (P/N 26096-1420) capillary column. Additional details of instrument parameters are displayed in Tables 1 and 2. Full details of all consumables used can be found in the Thermo Scientific™ AppsLab™ library.
2
Data processingData were acquired using full scan (FS) mode, processed, and reported using Thermo Scientific™ Chromeleon™ 7.3 chromatography data system (CDS). Additional screening of unknowns was performed using Compound Discover software. Thermo Scientific™ Compound Discoverer™ software, version 3.2, was also used for spectral deconvolution, NIST library searching, and compound identification using the EI and CI nodes.
Results and discussionChromatography, selectivity, and linearity were evaluated using solvent based standards. Assessment of sensitivity (as matrix detection limits and limits of quantitation), recovery, and selectivity were performed in soil using a modified QuEChERS extraction method, which is described in the experimental section.
Chromatography All compounds were analyzed in <20 min and excellent separation of the critical pairs was obtained for the 16 EPA PAH standard (i) phenanthrene/anthracene, (ii) benzo(a)anthracene/chrysene, (iii) benzo(b)fluoranthene/benzo(k)fluoranthene (Figure 1, A-D). As expected, with fast multiresidue methods of this nature, some coelution did occur in which case the data was reported as a sum of the combined area (ex: included (i) 1-ethylnapthanalene/ 2-ethylnapthalene, (ii) 1,3-dimethylnapthalene/ 1,6-dimethylnapthalene). Due to the superior inertness of the TraceGOLD silphenylene GC columns, excellent peak shape was observed for all compounds including the strongly basic compound quinoline which had a European Pharmacopeia (EP) asymmetry value of 1.03.
3
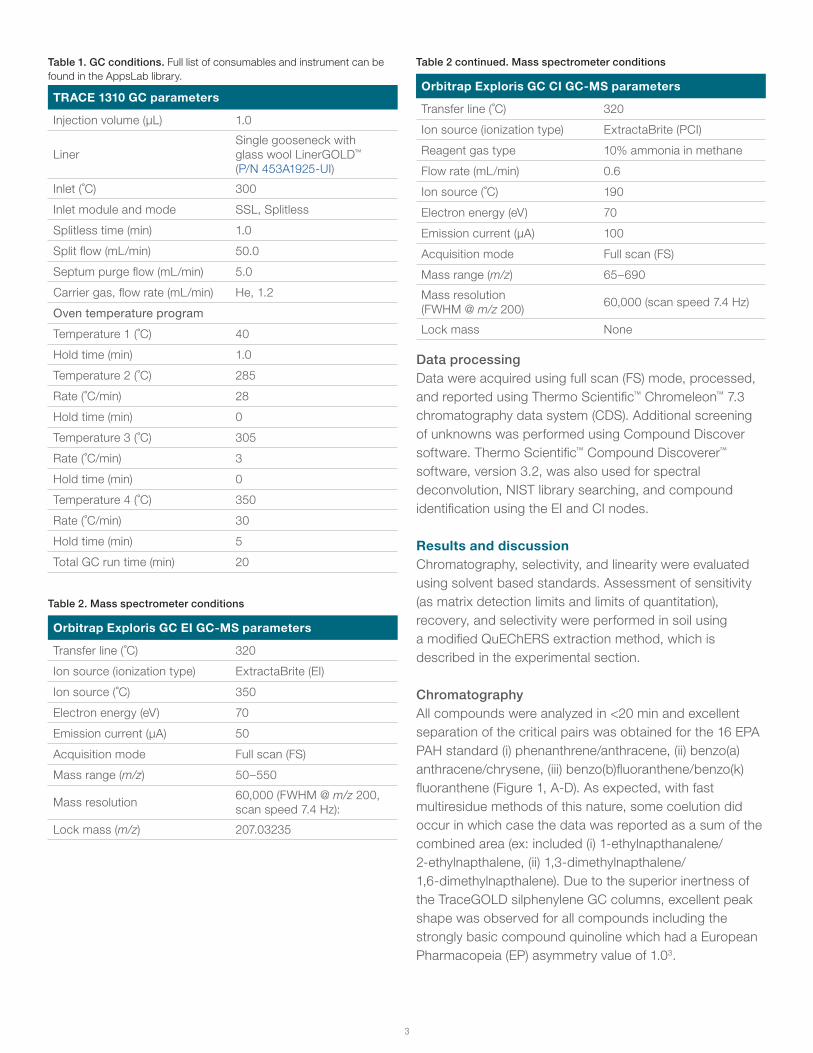
Table 1. GC conditions. Full list of consumables and instrument can be found in the AppsLab library.
TRACE 1310 GC parameters
Injection volume (µL) 1.0
LinerSingle gooseneck with glass wool LinerGOLD™ (P/N 453A1925-UI)
Inlet (˚C) 300
Inlet module and mode SSL, Splitless
Splitless time (min) 1.0
Split flow (mL/min) 50.0
Septum purge flow (mL/min) 5.0
Carrier gas, flow rate (mL/min) He, 1.2
Oven temperature program
Temperature 1 (˚C) 40
Hold time (min) 1.0
Temperature 2 (˚C) 285
Rate (˚C/min) 28
Hold time (min) 0
Temperature 3 (˚C) 305
Rate (˚C/min) 3
Hold time (min) 0
Temperature 4 (˚C) 350
Rate (˚C/min) 30
Hold time (min) 5
Total GC run time (min) 20
Table 2. Mass spectrometer conditions
Orbitrap Exploris GC EI GC-MS parameters
Transfer line (˚C) 320
Ion source (ionization type) ExtractaBrite (EI)
Ion source (˚C) 350
Electron energy (eV) 70
Emission current (µA) 50
Acquisition mode Full scan (FS)
Mass range (m/z) 50–550
Mass resolution 60,000 (FWHM @ m/z 200, scan speed 7.4 Hz):
Lock mass (m/z) 207.03235
Table 2 continued. Mass spectrometer conditions
Orbitrap Exploris GC CI GC-MS parameters
Transfer line (˚C) 320
Ion source (ionization type) ExtractaBrite (PCI)
Reagent gas type 10% ammonia in methane
Flow rate (mL/min) 0.6
Ion source (˚C) 190
Electron energy (eV) 70
Emission current (µA) 100
Acquisition mode Full scan (FS)
Mass range (m/z) 65–690
Mass resolution (FWHM @ m/z 200) 60,000 (scan speed 7.4 Hz)
Lock mass None

Due to the diversity of sample matrices with various degrees of complexity, selectivity can be challenging in GC-MS analysis of soils. An example of sample complexity is shown in Figure 1, E-F as an overlay of the TIC EI full
Figure 1. Example chromatograms showing overlaid native PAHs and PCBs FS XICs for a 50 pg/µL (50 pg on column (OC)) solvent standard in n-hexane with excellent chromatographic peak shapes for all compounds in <20 min. A) Peak shape for nitrogen containing polyaromatic heterocycle quinoline with peak asymmetry of 1.0; (B) Resolution of critical components phenanthrene and anthracene with EP resolution of 1.5; (C) Resolution of critical components benzo(a)anthracene and chrysene with chromatographic resolution of 1.3; (D) Resolution of critical components benzo(b)fluoranthene and benzo(k)fluoranthene with EP resolution of 1.0. (E) QuEChERS soil extract unspiked, FS, m/z=50–550; (F) QuEChERS soil extract unspiked, native incurred residue XICs; Compounds: 1= Quinoline, 2=Fluorene, 3=Dibenzothiophene, 4, 5=Phenanthrene/Anthracene 6=Fluoranthene, 7=Pyrene, 8, 9=Benzo[a]anthracene,Chrysene, 10=5,12-Napthacenequinone, 11, 12=Benzo[b/k]fluoranthene, 13=Benzo[a]pyrene, 14=Indeno[1,2,3-cd]pyrene, 15=Dibenzo[a,h]anthracene, 16=Benzo[ghi]perylene. C13-labeled internal standards were not displayed to show native peak shapes clearly.
scan of a sonicated unspiked QuEChERS soil extract (top chromatogram) and of a FS XIC (bottom chromatogram) showing the incurred residues.
4
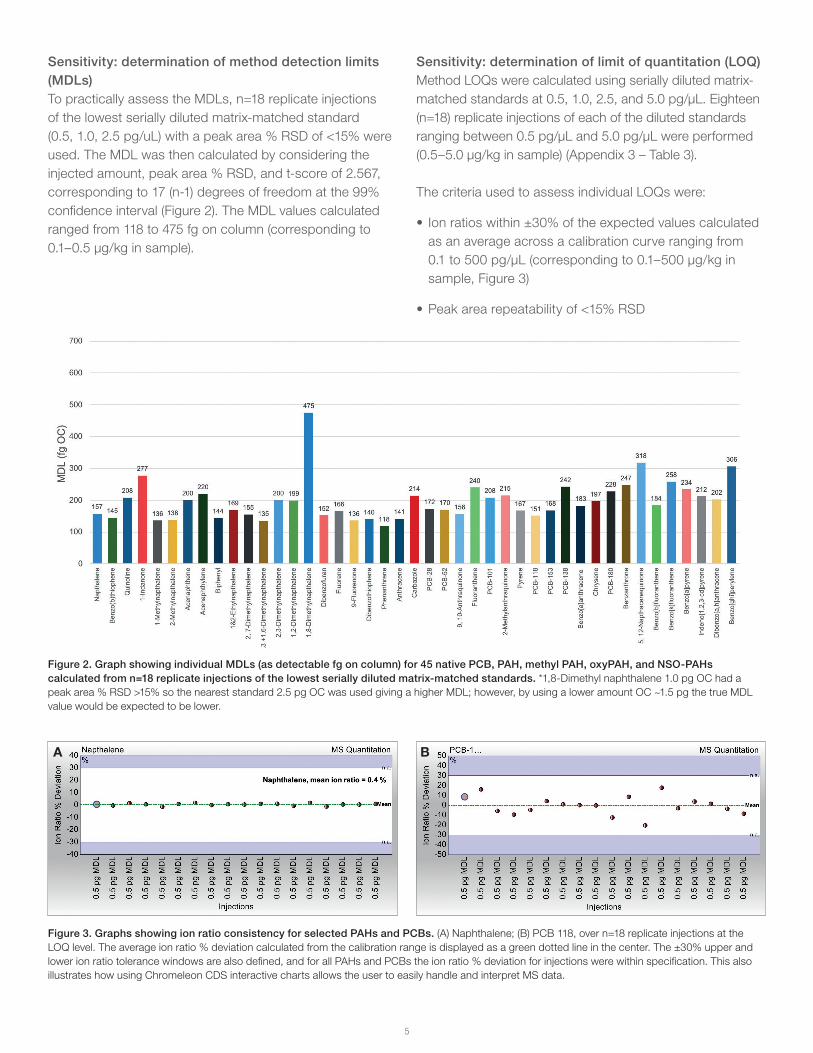
Sensitivity: determination of method detection limits (MDLs)To practically assess the MDLs, n=18 replicate injections of the lowest serially diluted matrix-matched standard (0.5, 1.0, 2.5 pg/uL) with a peak area % RSD of <15% were used. The MDL was then calculated by considering the injected amount, peak area % RSD, and t-score of 2.567, corresponding to 17 (n-1) degrees of freedom at the 99% confidence interval (Figure 2). The MDL values calculated ranged from 118 to 475 fg on column (corresponding to 0.1–0.5 µg/kg in sample).
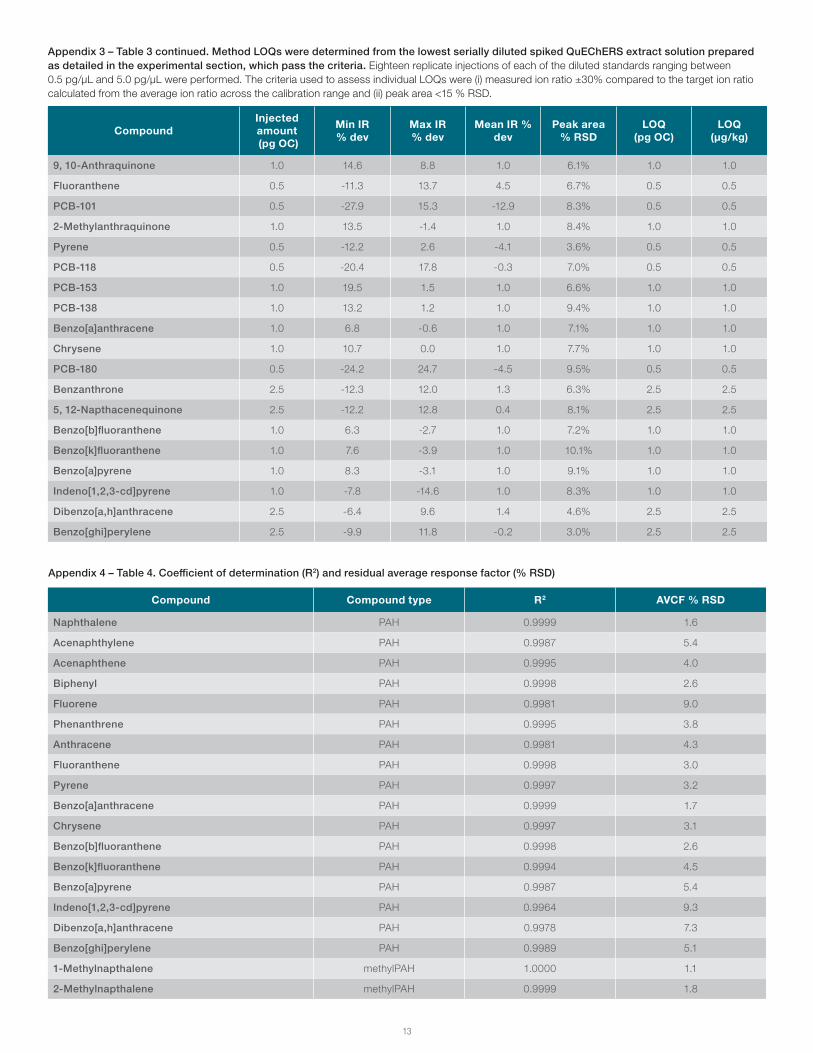
Sensitivity: determination of limit of quantitation (LOQ)Method LOQs were calculated using serially diluted matrix-matched standards at 0.5, 1.0, 2.5, and 5.0 pg/μL. Eighteen (n=18) replicate injections of each of the diluted standards ranging between 0.5 pg/µL and 5.0 pg/µL were performed (0.5–5.0 µg/kg in sample) (Appendix 3 – Table 3).
The criteria used to assess individual LOQs were:
• Ion ratios within ±30% of the expected values calculated as an average across a calibration curve ranging from 0.1 to 500 pg/µL (corresponding to 0.1–500 µg/kg in sample, Figure 3)
• Peak area repeatability of <15% RSD
Figure 3. Graphs showing ion ratio consistency for selected PAHs and PCBs. (A) Naphthalene; (B) PCB 118, over n=18 replicate injections at the LOQ level. The average ion ratio % deviation calculated from the calibration range is displayed as a green dotted line in the center. The ±30% upper and lower ion ratio tolerance windows are also defined, and for all PAHs and PCBs the ion ratio % deviation for injections were within specification. This also illustrates how using Chromeleon CDS interactive charts allows the user to easily handle and interpret MS data.
Figure 2. Graph showing individual MDLs (as detectable fg on column) for 45 native PCB, PAH, methyl PAH, oxyPAH, and NSO-PAHs calculated from n=18 replicate injections of the lowest serially diluted matrix-matched standards. *1,8-Dimethyl naphthalene 1.0 pg OC had a peak area % RSD >15% so the nearest standard 2.5 pg OC was used giving a higher MDL; however, by using a lower amount OC ~1.5 pg the true MDL value would be expected to be lower.
A B
5
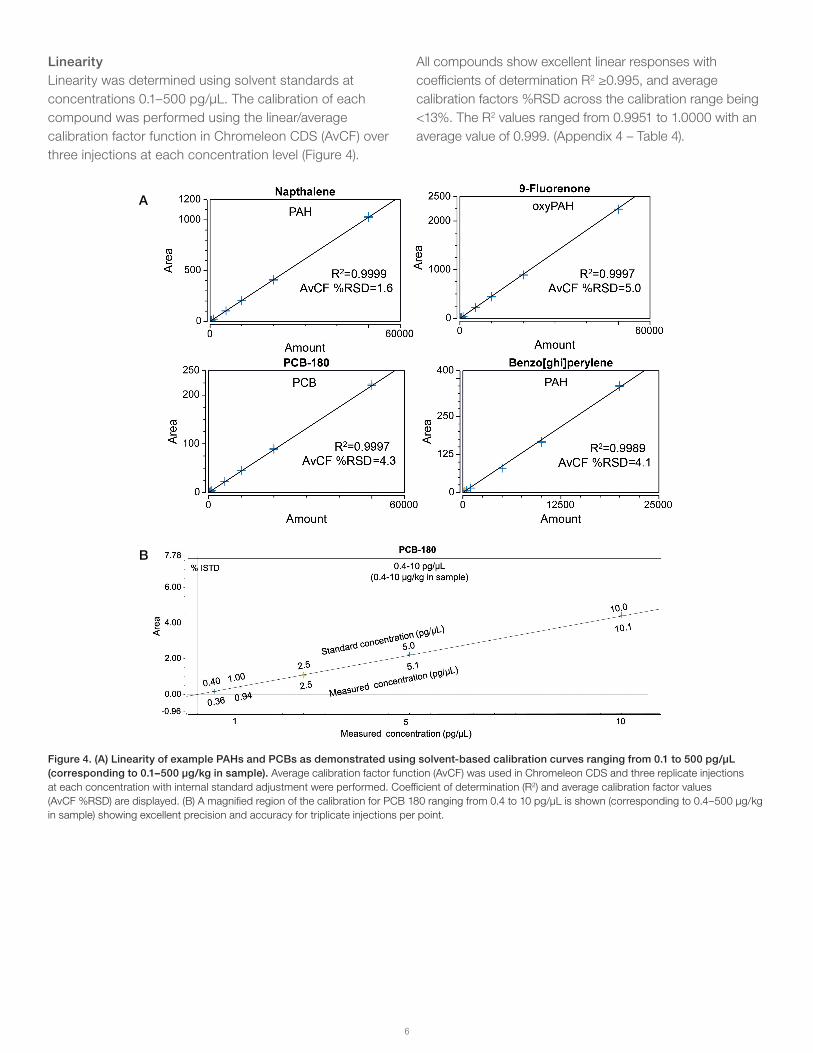
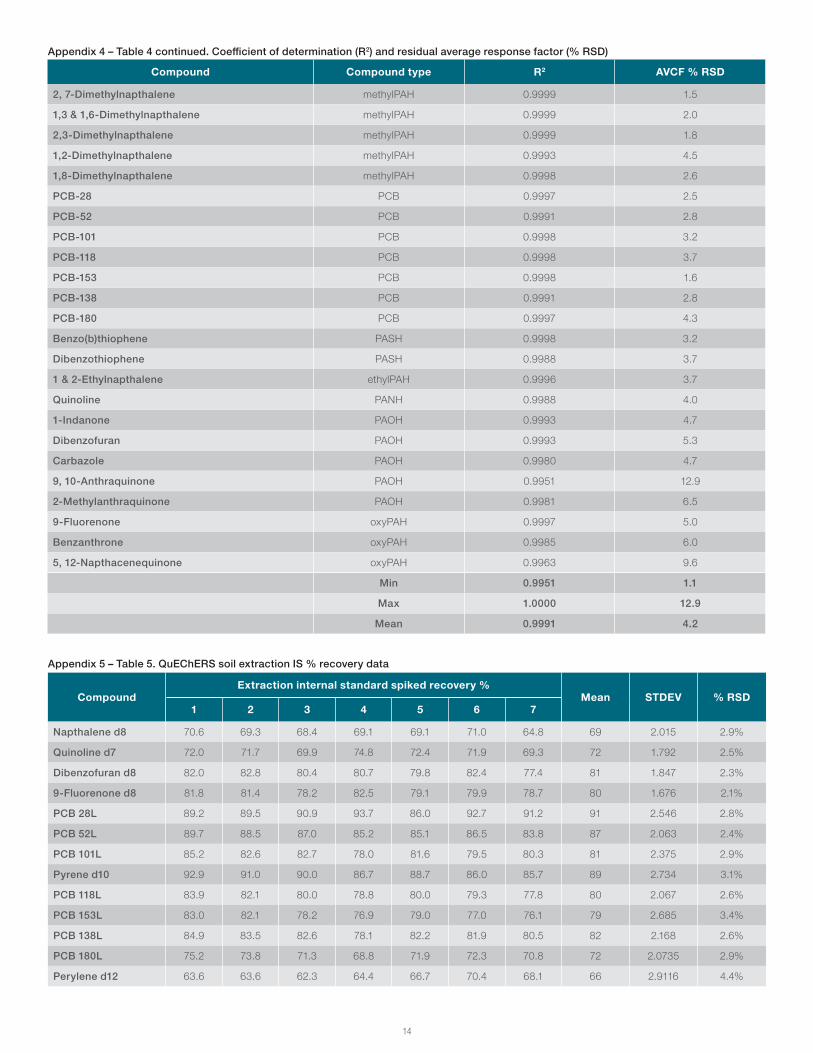
LinearityLinearity was determined using solvent standards at concentrations 0.1–500 pg/µL. The calibration of each compound was performed using the linear/average calibration factor function in Chromeleon CDS (AvCF) over three injections at each concentration level (Figure 4).
Figure 4. (A) Linearity of example PAHs and PCBs as demonstrated using solvent-based calibration curves ranging from 0.1 to 500 pg/µL (corresponding to 0.1–500 µg/kg in sample). Average calibration factor function (AvCF) was used in Chromeleon CDS and three replicate injections at each concentration with internal standard adjustment were performed. Coefficient of determination (R2) and average calibration factor values (AvCF %RSD) are displayed. (B) A magnified region of the calibration for PCB 180 ranging from 0.4 to 10 pg/µL is shown (corresponding to 0.4–500 µg/kg in sample) showing excellent precision and accuracy for triplicate injections per point.
All compounds show excellent linear responses with coefficients of determination R2 ≥0.995, and average calibration factors %RSD across the calibration range being <13%. The R2 values ranged from 0.9951 to 1.0000 with an average value of 0.999. (Appendix 4 – Table 4).
A
B
6
RecoveriesSeven replicate QuEChERS extractions, performed on soil spiked with deuterated internal standards at 50 ng/g added prior to extraction, were used to assess the compound recovery (details of sample preparation given in a recent application note (AN10720). Triphenyl phosphate at 100 ng/g was added post extraction and used as internal standard to adjust for potential injection variability (Appendix 5 – Table 5). All compounds show good recoveries with the average values of 79% (Appendix 5 – Table 5). Lower boiling point compounds, such as naphthalene-d8, had lower recoveries that could be explained by losses during the solvent evaporation phase. Although the recovery of such compounds is low, precision of measurement over n=7 replicate extractions was
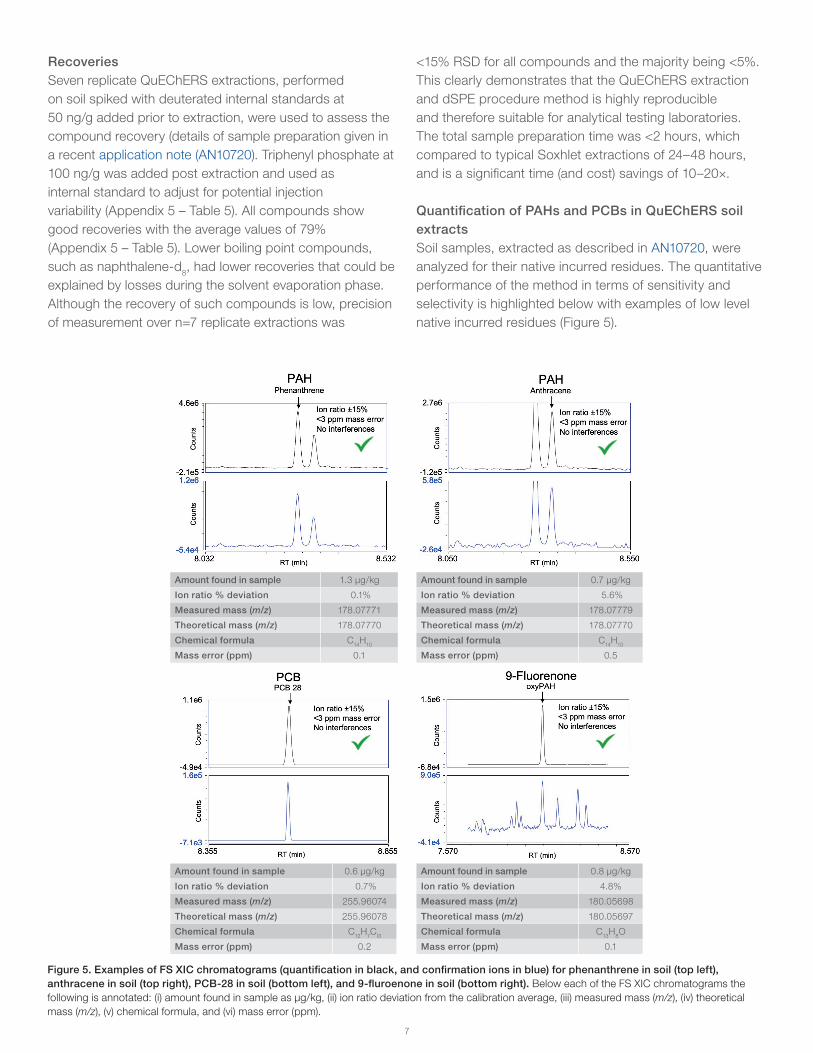
Figure 5. Examples of FS XIC chromatograms (quantification in black, and confirmation ions in blue) for phenanthrene in soil (top left), anthracene in soil (top right), PCB-28 in soil (bottom left), and 9-fluroenone in soil (bottom right). Below each of the FS XIC chromatograms the following is annotated: (i) amount found in sample as µg/kg, (ii) ion ratio deviation from the calibration average, (iii) measured mass (m/z), (iv) theoretical mass (m/z), (v) chemical formula, and (vi) mass error (ppm).
Amount found in sample 1.3 µg/kg
Ion ratio % deviation 0.1%
Measured mass (m/z) 178.07771
Theoretical mass (m/z) 178.07770
Chemical formula C14H10
Mass error (ppm) 0.1
Amount found in sample 0.6 µg/kg
Ion ratio % deviation 0.7%
Measured mass (m/z) 255.96074
Theoretical mass (m/z) 255.96078
Chemical formula C12H7Cl3
Mass error (ppm) 0.2
Amount found in sample 0.7 µg/kg
Ion ratio % deviation 5.6%
Measured mass (m/z) 178.07779
Theoretical mass (m/z) 178.07770
Chemical formula C14H10
Mass error (ppm) 0.5
Amount found in sample 0.8 µg/kg
Ion ratio % deviation 4.8%
Measured mass (m/z) 180.05698
Theoretical mass (m/z) 180.05697
Chemical formula C13H8O
Mass error (ppm) 0.1
<15% RSD for all compounds and the majority being <5%. This clearly demonstrates that the QuEChERS extraction and dSPE procedure method is highly reproducible and therefore suitable for analytical testing laboratories. The total sample preparation time was <2 hours, which compared to typical Soxhlet extractions of 24–48 hours, and is a significant time (and cost) savings of 10–20×.
Quantification of PAHs and PCBs in QuEChERS soil extracts Soil samples, extracted as described in AN10720, were analyzed for their native incurred residues. The quantitative performance of the method in terms of sensitivity and selectivity is highlighted below with examples of low level native incurred residues (Figure 5).
7

In summary, the results obtained in these experiments demonstrate that a consolidated compound class method using a modified QuEChERS sample preparation can be used to quantify PAHs and PCBs in soils. In the case of PCB-28, low levels of incurred residues of 0.6 µg/kg were detected and quantified within an ion ratio deviation from the calibration of only 0.7% and a mass error of the theoretical exact mass of 0.2 ppm with minimal matrix interferences all while in FS.
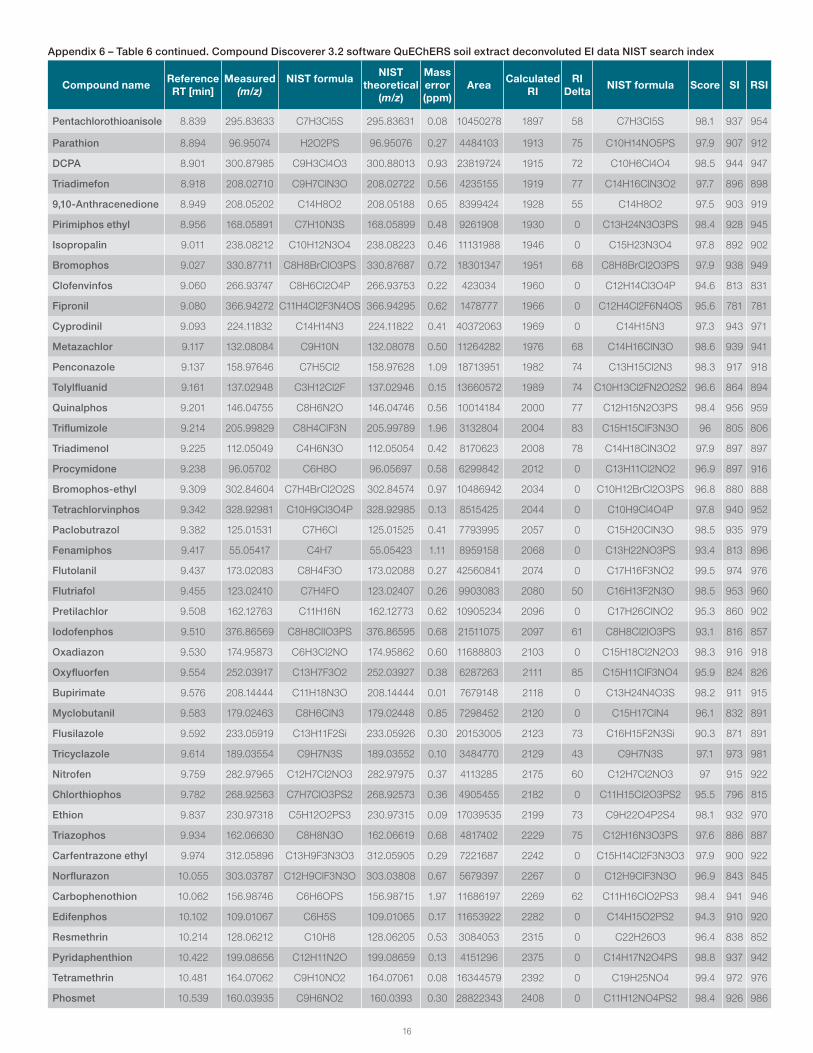
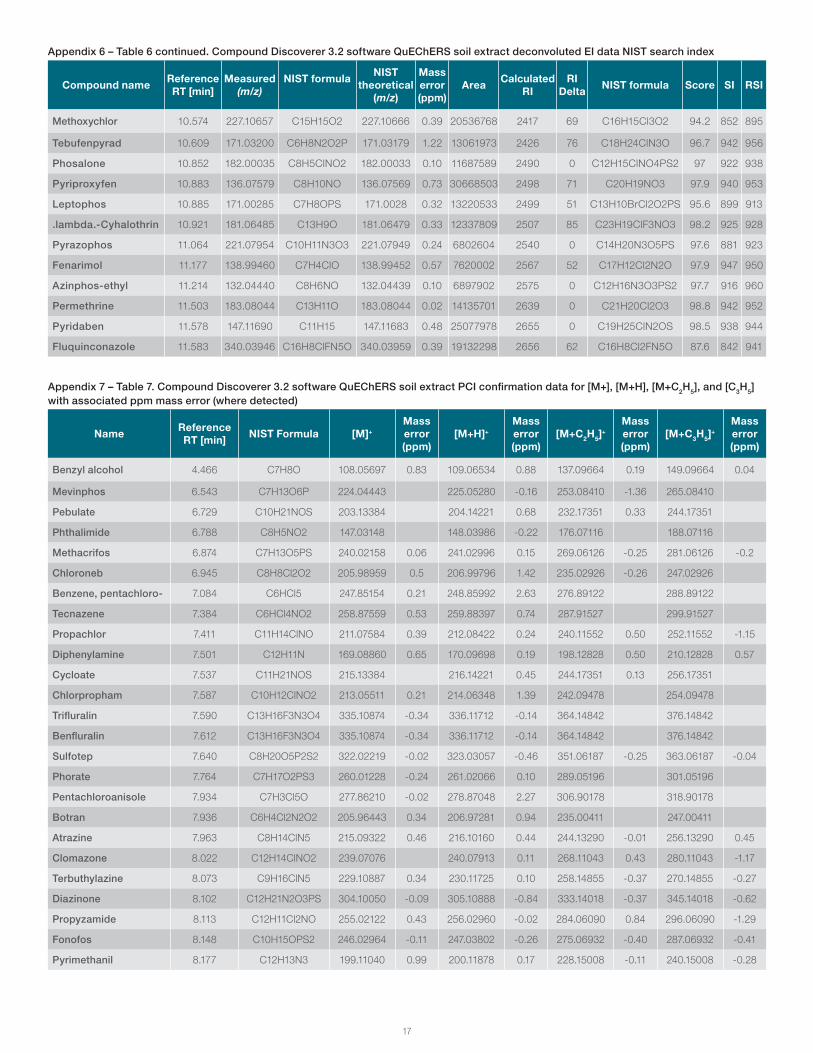
Screening for additional soil contaminantsThe advantages of acquiring data in FS with high resolution and accurate mass were leveraged through retrospective analysis of samples and additional screening of unknown contaminants with confirmation by chemical ionization (CI). The Compound Discoverer platform includes a streamlined workflow for GC EI data allowing for extraction, deconvolution, and putative identification of the unknowns based on mass spectral library matching (NIST 2017). The software first performed spectral deconvolution above a customizable signal to noise (S/N) followed by compounds detection and grouping to consider compounds that
Figure 6. (A) Example NIST SI match scores for compounds detected in the deconvoluted EI spectra QuEChERS soil extract spiked at 100 pg/μL. (B) Compound Discoverer software EI spectrum of a spiked QuEChERS soil extract – deconvoluted versus NIST library of the peak eluting at 10.95 min (m/z 136.07579), with the structure of the top SI match pyriproxyfen from the result table.
elute at the same retention time (within ±6 s window). The deconvoluted spectra were then searched against mass spectral libraries (such as NIST), and the hits were scored based on the total score derived from a combination of library search index (SI) score and presence/absence of the molecular ions as well as percentage of fragment ions that can be explained from the NIST elemental composition. The use of a retention index acquired under the same conditions used for sample analysis helped to increase the confidence in compound identification. Compounds detected with NIST SI scores >750 can be seen in (Figure 6A). With the Compound Discoverer browser an overlaid XIC of the peak eluting at 10.95 min (m/z 136.07579) was identified as the top hit versus NIST library (Figure 6B). The peak was putatively identified as pyriproxyfen with a SI score of 953; however, the molecular ion of m/z 321.135945 was not observed, which demonstrates the requirement for additional chemical ionization and mass accuracy confirmation of molecular ions. Full results of the EI NIST matches for the deconvoluted data can be found in the (Appendix 6 – Table 6).
8

Full-scan data for blank and spiked QuEChERS soil extracts (100 pg/μL) were analyzed with Compound Discoverer 3.2 software for putative identification of peaks. A complete workflow was used to identify compounds with a high degree of confidence using deconvoluted EI spectra based on search index scores (SI) and confirmation of the corresponding molecular ion and or adducts using positive chemical ionization. FS data was acquired using Chromeleon 7.3 in EI and PCI modes at 60,000 FWHM resolution and then imported in Compound Discoverer 3.2 software. The software was used to deconvolute, align, and filter the peaks to putatively identify the compounds using mass spectral library match (NIST 17). The power of the deconvolution algorithms become clear when overlaying both the FS TIC and deconvoluted spectra for analytes eluting in a crowded area of the chromatogram (Figure 7).
Confirmation of suspect contaminants using positive chemical ionizationFurther confirmation used in the identification of compounds was achieved by assessing the PCI spectra to identify the elemental composition of the parent ion by looking at common adducts. In PCI experiments using methane as the reagent gas, three adducts are typically observed: [M+H]+, [M+C2H5]
+, and [M+C3H5]+. An example was shown for a
peak at 9.44 min, which was identified as flutolanil versus the NIST library; however, the molecular ion m/z 323.11276 was not giving a significant response (Figure 8 A). When looking at the PCI data for this compound a significant boost in the molecular ion was observed with minimal mass error of 0.09 ppm (Figure 13B). Two additional adducts [M+H]+ and [M+C2H5]
+ were also observed with ppm mass errors of -0.1 and -0.03 ppm respectively. Full results of the PCI confirmation can be found in Appendix 7 – Table 7.
Figure 8. (A) Compound Discoverer software EI spectrum of a spiked QuEChERS soil extract – deconvoluted versus NIST library of the peak eluting at 9.437 min (m/z 323.11243), with the structure from the top SI match flutolanil from the result table. (B) PCI mass spectrum for flutolanil displaying adducts [M+H]+ and [M+C2H5]
+ used for confirmation of this compound in conjunction with the EI data.
Figure 7. (A) Overlaid FS (m/z = 50–550) TIC for a soil QuEChERS extract spiked with pesticides at 100 pg/μL. (B) Compound Discoverer 3.2 software deconvoluted EI spectrum showing closely eluting compounds extracted from the complex TIC FS data.
9

ConclusionsThe results of the experiments presented demonstrate that modified QuEChERS methods and the TriPlus RSH autosampler in combination with the Orbitrap Exploris GC provides an ideal solution for analytical testing laboratories looking to improve productivity and deliver confident results.
• Comprehensive method consolidation with chromatographic separation and overall analytical performance was achieved for the analysis of PAHs and PCBs in soil in <20 min.
• Increased throughput of up to 20× can be realized by using a modified QuEChERS method compared to tradition Sohxlet extraction methods, saving cost and time.
• Femtogram level sensitivity was achieved using the Orbitrap Exploris GC, with the MDLs values calculated for 45 native compounds ranging from 115 to 475 fg OC (corresponding to 0.1–0.5 µg/kg in sample).
• LOQs ranged from 0.5 to 5.0 µg/kg in soil as determined from n=18 repeat injections of the lowest serially diluted matrix-matched standard that satisfied the acceptance criteria defined below:
– Ion ratios within ±30% of the expected values calculated as an average across a calibration curve ranging from 0.1 to 500 pg/µL (equivalent to 0.4–5.0 µg/kg in sample)
– Peak area repeatability of <15% RSD
• Linearity was achieved across a calibration range of 0.1–500 pg/µL (corresponding to 0.1–500 µg/kg in soil) showed coefficient of determination values of R2 ≥0.995, and residuals <13%.
• All compounds show good recovery overall with the average internal standard recovery being 79%, and precision of the seven technical replicate extractions <5% RSD.
• Quantitative performance with soil samples was excellent as demonstrated by the closeness of the ion ratios and mass error compared to expected values when used for confirmation of low-level incurred residues in soil such as PAHs, PCBs, and oxyPAHs.
• Rapid change-over from EI (for spectral library search) to softer ionization such as PCI (for molecular ion confirmation using adduct information) is possible.
• The streamlined GC-EI data processing workflow with Compound Discoverer software allows for quick extraction, deconvolution, and identification of unknown compounds.
References1. S.R. CEN/TR 16998:2016 ambient air –report on nitro-and oxy-PAHs - origin, toxicity,
concentrations and measurement methods.
2. Sun, Z.; Zhu. Y.; Zhuo, S.; Liu, W, Z.; Zheng, E.Y.; Wang, X.; Xing. B.; Tao. S Occurrence of nitro- and oxy-PAHs in agricultural soils in eastern China and excess lifetime cancer risks from human exposure through soil ingestion. Environ Int. 2017, 108, 261-270.
3. Anderson, J.T.; Achten, C. Time to say Goodbye to the 16 EPA PAHs? Toward an up-to-date use of PACs for environmental purposes. Polycyclic Aromatic Compounds 2015, 35, 330–354.
4. Thermo Fisher Scientific (2017) Application note 21736: Ultra-inert low bleed GC columns with advanced silphenylene polymer technology. https://assets.thermofisher.com/TFS-Assets/CMD/Application-Notes/an-21735-gc-ms-ultra-inert-columns-an21735-en.pdf
5. Hites, R.A. Polybrominated diphenyl ethers in the environment and in people: a meta-analysis of concentrations. Environ. Sci. Technology 2004, 38, 945.
6. Guidance for the inventory of polybrominated diphenyl ethers (PBDEs) listed under the Stockholm Convention on POPs. [Online] http://chm.pops.int/Implementation/NationalImplementationPlans/Guidance/GuidancefortheinventoryofPBDEs/tabid/3171/Default.aspx (accessed May 8, 2018).
7. Fernandes, A.; White, S.; D’Silva, K.; Rose, M. Simultaneous determination of PCDDs, PCDFs, PCBs and PBDEs in food. Talanta 2004, 63, 1147–1155.
8. Thermo Fisher Scientific (2009) Technical note 51797: Timed SRM: improved capabilities for multi-target compound analysis. https://tools.thermofisher.com/content/sfs/brochures/AN51797-TimedSRM-Multitarget-Compound-Analysis.pdf
10

Native standard Compound type CAS Number Calibration range (ng/mL)
Napthalene PAH 91-20-3
0.1–500
Benzo(b)thiophene PASH 95-15-8
Quinoline PANH 91-22-5
1-Indanone PAOH 83-33-0
2-Methylnapthalene methylPAH 91-57-6
1-Methylnapthalene methylPAH 90-12-0
Biphenyl aromatic 92-52-4
Acenaphthylene PAH 208-96-8
1-Ethylnapthalene methylPAH 1127-76-0
2-Ethylnapthalene methylPAH 939-27-5
Acenaphthene PAH 83-32-9
2,7-Dimethylnapthalene methylPAH 582-16-1
1,3-Dimethylnapthalene methylPAH 575-41-7
1,6-Dimethylnapthalene methylPAH 575-43-9
2,3-Dimethylnapthalene methylPAH 581-40-8
1,2-Dimethylnapthalene methylPAH 573-98-8
1,8-Dimethylnapthalene methylPAH 569-41-5
Dibenzofuran PAOH 132-64-9
Fluorene PAH 86-73-7
9-Fluorenone oxyPAH 486-25-9
Dibenzothiophene PASH 132-65-0
Phenanthrene PAH 85-01-8
Anthracene PAH 120-12-7
Carbazole PAOH 86-74-8
PCB-28 PCB 7012-37-5
PCB-52 PCB 35693-99-3
9,10-Anthraquinone PAOH 84-65-1
Fluoranthene PAH 206-44-0
PCB-101 PCB 37680-73-2
2-Methylanthraquinone PAOH 84-54-8
Pyrene PAH 129-00-0
PCB-118 PCB 31508-00-6
PCB-153 PCB 35065-27-1
PCB-138 PCB 35065-28-2
Benzo[a]anthracene PAH 56-55-3
Chrysene PAH 218-01-9
PCB-180 PCB 35065-29-3
Benzanthrone oxyPAH 82-05-3
5,12-Napthacenequinone oxyPAH 1090-13-7
Benzo[b]fluoranthene PAH 205-99-2
Benzo[k]fluoranthene PAH 207-08-9
Benzo[a]pyrene PAH 50-32-8
Indeno[1,2,3-cd]pyrene PAH 193-39-5
Dibenzo[a,h]anthracene PAH 53-70-3
Benzo[ghi]perylene PAH 191-24-2
Appendix 1 – Table 1. Details of 45 native compounds analyzed, including compound type, CAS number, and calibration range
11

Internal standard Compound type CAS Number Concentration (ng/mL)
Napthalene-d-8 PAH 1146-65-2
100
Dibenzofuran-d8 PAOH 93952-04-6
9-Fluorenone-d8 oxyPAH 137219-34-2
Pyrene-d-10 PAH 1718-52-1
PCB-28L PCB 7012-37-5
PCB-52L PCB 35693-99-3
PCB-101L PCB 37680-73-2
PCB-118L PCB 31508-00-6
PCB-153L PCB 35065-27-1
PCB-138L PCB 35065-28-2
PCB-180L PCB 35065-29-3
Quinoline-d7 PANH 34071-94-8
o-Terphenyl aromatic 84-15-1
Perylene-d-12 PAH 1520-96-3
Appendix 2 – Table 2. Details of the 14 internal standards, including compound type, CAS number, and concentration (suffix “L” indicates mass-labeled)
CompoundInjected amount (pg OC)
Min IR % dev
Max IR % dev
Mean IR % dev
Peak area % RSD
LOQ (pg OC)
LOQ (μg/kg)
Napthalene 0.5 -1.4 1.7 0.4 4.5% 0.5 0.5
Benzo(b)thiophene 1.0 -0.8 -13.3 1.0 5.7% 1.0 1.0
Quinoline 1.0 10.9 -0.7 1.0 8.1% 1.0 1.0
1-Indanone 2.5 -10.9 13.0 2.6 6.2% 2.5 2.5
1-Methylnapthalene 0.5 6.9 10.3 8.8 2.2% 0.5 0.5
2-Methylnapthalene 0.5 4.6 7.3 6.0 2.2% 0.5 0.5
Acenaphthene 0.5 -5.8 13.5 4.4 5.6% 0.5 0.5
Acenaphthylene 0.5 -10.2 14.7 2.8 6.6% 0.5 0.5
Biphenyl 0.5 -12.0 1.6 -5.2 3.6% 0.5 0.5
1 & 2-Ethylnapthalene 0.5 -9.1 9.9 3.0 2.9% 0.5 0.5
2, 7-Dimethylnapthalene 0.5 5.6 14.7 10.0 2.2% 0.5 0.5
1,3 & 1,6-Dimethylnapthalene 0.5 10.4 17.5 13.7 3.3% 0.5 0.5
2,3-Dimethylnapthalene 0.5 -13.3 13.2 0.3 10.2% 0.5 0.5
1,2-Dimethylnapthalene 0.5 -24.2 16.1 -12.1 5.8% 0.5 0.5
1,8-Dimethylnapthalene 2.5 -12.5 11.3 -3.1 3.2% 2.5 2.5
Dibenzofuran 0.5 -13.9 2.1 -5.4 2.0% 0.5 0.5
Fluorene 1.0 11.1 5.4 1.0 6.5% 1.0 1.0
9-Fluorenone 1.0 9.1 -2.3 1.0 5.3% 1.0 1.0
Dibenzothiophene 1.0 9.7 -4.4 1.0 5.4% 1.0 1.0
Phenanthrene 0.5 -13.3 2.9 -5.6 2.6% 0.5 0.5
Anthracene 1.0 11.5 0.8 1.0 5.5% 1.0 1.0
Carbazole 1.0 11.3 -1.0 1.0 8.3% 1.0 1.0
PCB-28 2.5 -11.7 9.5 -3.6 3.7% 2.5 2.5
PCB-52 1.0 12.1 0.4 1.0 6.6% 1.0 1.0
Appendix 3 – Table 3. Method LOQs were determined from the lowest serially diluted spiked QuEChERS extract solution prepared as detailed in the experimental section, which pass the criteria. Eighteen replicate injections of each of the diluted standards ranging between 0.5 pg/µL and 5.0 pg/µL were performed. The criteria used to assess individual LOQs were (i) measured ion ratio (IR) ±30% compared to the target ion ratio calculated from the average ion ratio across the calibration range and (ii) peak area <15 % RSD.
12
CompoundInjected amount (pg OC)
Min IR % dev
Max IR % dev
Mean IR % dev
Peak area % RSD
LOQ (pg OC)
LOQ (μg/kg)
9, 10-Anthraquinone 1.0 14.6 8.8 1.0 6.1% 1.0 1.0
Fluoranthene 0.5 -11.3 13.7 4.5 6.7% 0.5 0.5
PCB-101 0.5 -27.9 15.3 -12.9 8.3% 0.5 0.5
2-Methylanthraquinone 1.0 13.5 -1.4 1.0 8.4% 1.0 1.0
Pyrene 0.5 -12.2 2.6 -4.1 3.6% 0.5 0.5
PCB-118 0.5 -20.4 17.8 -0.3 7.0% 0.5 0.5
PCB-153 1.0 19.5 1.5 1.0 6.6% 1.0 1.0
PCB-138 1.0 13.2 1.2 1.0 9.4% 1.0 1.0
Benzo[a]anthracene 1.0 6.8 -0.6 1.0 7.1% 1.0 1.0
Chrysene 1.0 10.7 0.0 1.0 7.7% 1.0 1.0
PCB-180 0.5 -24.2 24.7 -4.5 9.5% 0.5 0.5
Benzanthrone 2.5 -12.3 12.0 1.3 6.3% 2.5 2.5
5, 12-Napthacenequinone 2.5 -12.2 12.8 0.4 8.1% 2.5 2.5
Benzo[b]fluoranthene 1.0 6.3 -2.7 1.0 7.2% 1.0 1.0
Benzo[k]fluoranthene 1.0 7.6 -3.9 1.0 10.1% 1.0 1.0
Benzo[a]pyrene 1.0 8.3 -3.1 1.0 9.1% 1.0 1.0
Indeno[1,2,3-cd]pyrene 1.0 -7.8 -14.6 1.0 8.3% 1.0 1.0
Dibenzo[a,h]anthracene 2.5 -6.4 9.6 1.4 4.6% 2.5 2.5
Benzo[ghi]perylene 2.5 -9.9 11.8 -0.2 3.0% 2.5 2.5
Appendix 3 – Table 3 continued. Method LOQs were determined from the lowest serially diluted spiked QuEChERS extract solution prepared as detailed in the experimental section, which pass the criteria. Eighteen replicate injections of each of the diluted standards ranging between 0.5 pg/µL and 5.0 pg/µL were performed. The criteria used to assess individual LOQs were (i) measured ion ratio ±30% compared to the target ion ratio calculated from the average ion ratio across the calibration range and (ii) peak area <15 % RSD.
Compound Compound type R2 AVCF % RSD
Naphthalene PAH 0.9999 1.6
Acenaphthylene PAH 0.9987 5.4
Acenaphthene PAH 0.9995 4.0
Biphenyl PAH 0.9998 2.6
Fluorene PAH 0.9981 9.0
Phenanthrene PAH 0.9995 3.8
Anthracene PAH 0.9981 4.3
Fluoranthene PAH 0.9998 3.0
Pyrene PAH 0.9997 3.2
Benzo[a]anthracene PAH 0.9999 1.7
Chrysene PAH 0.9997 3.1
Benzo[b]fluoranthene PAH 0.9998 2.6
Benzo[k]fluoranthene PAH 0.9994 4.5
Benzo[a]pyrene PAH 0.9987 5.4
Indeno[1,2,3-cd]pyrene PAH 0.9964 9.3
Dibenzo[a,h]anthracene PAH 0.9978 7.3
Benzo[ghi]perylene PAH 0.9989 5.1
1-Methylnapthalene methylPAH 1.0000 1.1
2-Methylnapthalene methylPAH 0.9999 1.8
Appendix 4 – Table 4. Coefficient of determination (R2) and residual average response factor (% RSD)
13
Compound Compound type R2 AVCF % RSD
2, 7-Dimethylnapthalene methylPAH 0.9999 1.5
1,3 & 1,6-Dimethylnapthalene methylPAH 0.9999 2.0
2,3-Dimethylnapthalene methylPAH 0.9999 1.8
1,2-Dimethylnapthalene methylPAH 0.9993 4.5
1,8-Dimethylnapthalene methylPAH 0.9998 2.6
PCB-28 PCB 0.9997 2.5
PCB-52 PCB 0.9991 2.8
PCB-101 PCB 0.9998 3.2
PCB-118 PCB 0.9998 3.7
PCB-153 PCB 0.9998 1.6
PCB-138 PCB 0.9991 2.8
PCB-180 PCB 0.9997 4.3
Benzo(b)thiophene PASH 0.9998 3.2
Dibenzothiophene PASH 0.9988 3.7
1 & 2-Ethylnapthalene ethylPAH 0.9996 3.7
Quinoline PANH 0.9988 4.0
1-Indanone PAOH 0.9993 4.7
Dibenzofuran PAOH 0.9993 5.3
Carbazole PAOH 0.9980 4.7
9, 10-Anthraquinone PAOH 0.9951 12.9
2-Methylanthraquinone PAOH 0.9981 6.5
9-Fluorenone oxyPAH 0.9997 5.0
Benzanthrone oxyPAH 0.9985 6.0
5, 12-Napthacenequinone oxyPAH 0.9963 9.6
Min 0.9951 1.1
Max 1.0000 12.9
Mean 0.9991 4.2
Appendix 4 – Table 4 continued. Coefficient of determination (R2) and residual average response factor (% RSD)
CompoundExtraction internal standard spiked recovery %
Mean STDEV % RSD1 2 3 4 5 6 7
Napthalene d8 70.6 69.3 68.4 69.1 69.1 71.0 64.8 69 2.015 2.9%
Quinoline d7 72.0 71.7 69.9 74.8 72.4 71.9 69.3 72 1.792 2.5%
Dibenzofuran d8 82.0 82.8 80.4 80.7 79.8 82.4 77.4 81 1.847 2.3%
9-Fluorenone d8 81.8 81.4 78.2 82.5 79.1 79.9 78.7 80 1.676 2.1%
PCB 28L 89.2 89.5 90.9 93.7 86.0 92.7 91.2 91 2.546 2.8%
PCB 52L 89.7 88.5 87.0 85.2 85.1 86.5 83.8 87 2.063 2.4%
PCB 101L 85.2 82.6 82.7 78.0 81.6 79.5 80.3 81 2.375 2.9%
Pyrene d10 92.9 91.0 90.0 86.7 88.7 86.0 85.7 89 2.734 3.1%
PCB 118L 83.9 82.1 80.0 78.8 80.0 79.3 77.8 80 2.067 2.6%
PCB 153L 83.0 82.1 78.2 76.9 79.0 77.0 76.1 79 2.685 3.4%
PCB 138L 84.9 83.5 82.6 78.1 82.2 81.9 80.5 82 2.168 2.6%
PCB 180L 75.2 73.8 71.3 68.8 71.9 72.3 70.8 72 2.0735 2.9%
Perylene d12 63.6 63.6 62.3 64.4 66.7 70.4 68.1 66 2.9116 4.4%
Appendix 5 – Table 5. QuEChERS soil extraction IS % recovery data
14

Compound name Reference RT [min]
Measured (m/z)
NIST formula NIST theoretical
(m/z)
Mass error (ppm)
Area Calculated RI
RI Delta NIST formula Score SI RSI
Benzyl alcohol 4.466 79.05409 C6H7 79.05423 1.78 16069986 1039 5 C7H8O 95.7 937 987
Mevinphos 6.543 127.01549 C2H8O4P 127.01547 0.13 17076195 1429 16 C7H13O6P 99 960 962
Pebulate 6.729 128.10695 C7H14NO 128.10699 0.32 8595860 1469 0 C10H21NOS 95.2 895 936
Phthalimide 6.788 147.03149 C8H5NO2 147.03148 0.10 1242332 1482 0 C8H5NO2 99.4 968 968
Methacrifos 6.874 180.00058 C5H9O3PS 180.00045 0.71 6569371 1501 6 C7H13O5PS 98.5 931 932
Chloroneb 6.945 190.96625 C7H5Cl2O2 190.96611 0.72 17004439 1517 0 C8H8Cl2O2 98.2 960 981
Benzene,
pentachloro-7.084 249.84847 C6HCl5 249.84859 0.50 24762934 1549 0 C6HCl5 94.2 943 973
Tecnazene 7.384 202.87970 C5HCl4 202.87974 0.18 4337238 1609 0 C6HCl4NO2 94.3 975 988
Propachlor 7.411 120.08082 C8H10N 120.08078 0.36 9254651 1612 0 C11H14ClNO 97.2 938 964
Diphenylamine 7.501 169.08841 C12H11N 169.0886 1.13 24878507 1624 2 C12H11N 95.6 954 983
Cycloate 7.537 83.08540 C6H11 83.08553 1.48 12902977 1628 8 C11H21NOS 96.4 859 874
Chlorpropham 7.587 127.01830 C6H6ClN 127.01833 0.20 9390559 1634 0 C10H12ClNO2 97.9 953 976
Trifluralin 7.590 264.02240 C8H5F3N3O4 264.02267 1.01 10518127 1635 0 C13H16F3N3O4 96.9 855 860
Benfluralin 7.612 292.05356 C10H9F3N3O4 292.05397 1.40 11572988 1637 0 C13H16F3N3O4 98.3 915 924
Sulfotep 7.640 293.99060 C6H16O5P2S2 293.99089 0.98 5705056 1641 0 C8H20O5P2S2 98.9 945 948
Phorate 7.764 75.02623 C3H7S 75.0263 0.89 9945770 1656 0 C7H17O2PS3 93.4 858 914
Pentachloroanisole 7.934 264.83575 C6Cl5O 264.83568 0.28 10759890 1677 0 C7H3Cl5O 98.6 950 954
Botran 7.936 123.99490 C6H3ClN 123.99485 0.35 2725458 1677 0 C6H4Cl2N2O2 96 886 907
Atrazine 7.963 200.06975 C7H11ClN5 200.06975 0.00 8074011 1681 67 C8H14ClN5 97.5 947 948
Clomazone 8.022 125.01531 C7H6Cl 125.01525 0.41 24300346 1688 0 C12H14ClNO2 95.9 884 907
Terbuthylazine 8.073 214.08533 C8H13ClN5 214.0854 0.34 9737849 1694 82 C9H16ClN5 98.5 969 969
Diazinone 8.102 137.07097 C7H9N2O 137.07094 0.22 13998989 1698 90 C12H21N2O3PS 98.5 924 926
Propyzamide 8.113 172.95569 C7H3Cl2O 172.95555 0.82 17602860 1699 85 C12H11Cl2NO 98.2 942 944
Fonofos 8.148 108.98717 C2H6OPS 108.98715 0.17 23490821 1708 73 C10H15OPS2 98.3 950 956
Pyrimethanil 8.177 198.10248 C12H12N3 198.10257 0.48 45520948 1715 0 C12H13N3 94.9 918 978
Isazophos 8.203 118.98820 C2H2ClN3O 118.98809 0.90 9010911 1722 0 C9H17ClN3O3PS 98.1 905 915
Disulfoton 8.221 88.03407 C4H8S 88.03412 0.56 8860789 1727 0 C8H19O2PS3 97.2 921 951
Chlorothalonil 8.239 265.87787 C8Cl4N2 265.87806 0.72 19236284 1732 0 C8Cl4N2 97.1 966 971
Anthracene 8.252 178.07787 C14H10 178.0777 0.93 764555 1736 70 C14H10 97.8 909 914
Triallate 8.287 268.03238 C10H16Cl2NOS 268.03242 0.14 6379150 1745 80 C10H16Cl3NOS 97.4 896 897
Dibutyl phthalate 8.386 149.02332 C8H5O3 149.02332 0.03 5881147 1772 181 C16H22O4 98.1 915 916
Propanil 8.464 160.97940 C6H5Cl2N 160.97936 0.28 19471408 1793 0 C9H9Cl2NO 98.7 955 960
Chloropyriphos-
methyl8.514 285.92539 C7H7Cl2NO3PS 285.92558 0.69 20128971 1807 72 C7H7Cl3NO3PS 97.9 940 941
Transfluthrin 8.523 163.01637 C7H3F4 163.01654 1.02 11807916 1809 0 C15H12Cl2F4O2 97.3 897 927
Vinclozoline 8.526 212.00269 C10H8Cl2N 212.00283 0.68 3926786 1810 0 C12H9Cl2NO3 97.6 921 942
Alachlor 8.561 160.11224 C11H14N 160.11208 1.05 8630775 1820 74 C14H20ClNO2 92.8 849 907
Tolclofos-methyl 8.570 264.98505 C9H11ClO3PS 264.98496 0.34 30985887 1822 74 C9H11Cl2O3PS 97 848 848
Fenchlorphos 8.643 284.93015 C8H8Cl2O3PS 284.93033 0.66 22859648 1843 0 C8H8Cl3O3PS 97.4 887 973
Pirimiphos methyl 8.682 290.07211 C10H17N3O3PS 290.07228 0.56 12041239 1853 79 C11H20N3O3PS 98.1 913 914
Fenitrothion 8.726 260.01404 C9H11NO4PS 260.01409 0.20 6776685 1866 0 C9H12NO5PS 97.7 911 918
Malathion 8.755 124.98213 C2H6O2PS 124.98206 0.55 9227531 1874 0 C10H19O6PS2 99 953 954
Linuron 8.786 61.05217 C2H7NO 61.05222 0.67 996941 1882 0 C9H10Cl2N2O2 93.7 754 767
Dichlofluanid 8.801 123.01375 C6H5NS 123.01372 0.22 10765859 1886 71 C9H11Cl2FN2O2S2 98.3 923 924
Appendix 6 – Table 6. Compound Discoverer 3.2 software QuEChERS soil extract deconvoluted EI data NIST search index
15
Compound name Reference RT [min]
Measured (m/z)
NIST formula NIST theoretical
(m/z)
Mass error (ppm)
Area Calculated RI
RI Delta NIST formula Score SI RSI
Pentachlorothioanisole 8.839 295.83633 C7H3Cl5S 295.83631 0.08 10450278 1897 58 C7H3Cl5S 98.1 937 954
Parathion 8.894 96.95074 H2O2PS 96.95076 0.27 4484103 1913 75 C10H14NO5PS 97.9 907 912
DCPA 8.901 300.87985 C9H3Cl4O3 300.88013 0.93 23819724 1915 72 C10H6Cl4O4 98.5 944 947
Triadimefon 8.918 208.02710 C9H7ClN3O 208.02722 0.56 4235155 1919 77 C14H16ClN3O2 97.7 896 898
9,10-Anthracenedione 8.949 208.05202 C14H8O2 208.05188 0.65 8399424 1928 55 C14H8O2 97.5 903 919
Pirimiphos ethyl 8.956 168.05891 C7H10N3S 168.05899 0.48 9261908 1930 0 C13H24N3O3PS 98.4 928 945
Isopropalin 9.011 238.08212 C10H12N3O4 238.08223 0.46 11131988 1946 0 C15H23N3O4 97.8 892 902
Bromophos 9.027 330.87711 C8H8BrClO3PS 330.87687 0.72 18301347 1951 68 C8H8BrCl2O3PS 97.9 938 949
Clofenvinfos 9.060 266.93747 C8H6Cl2O4P 266.93753 0.22 423034 1960 0 C12H14Cl3O4P 94.6 813 831
Fipronil 9.080 366.94272 C11H4Cl2F3N4OS 366.94295 0.62 1478777 1966 0 C12H4Cl2F6N4OS 95.6 781 781
Cyprodinil 9.093 224.11832 C14H14N3 224.11822 0.41 40372063 1969 0 C14H15N3 97.3 943 971
Metazachlor 9.117 132.08084 C9H10N 132.08078 0.50 11264282 1976 68 C14H16ClN3O 98.6 939 941
Penconazole 9.137 158.97646 C7H5Cl2 158.97628 1.09 18713951 1982 74 C13H15Cl2N3 98.3 917 918
Tolylfluanid 9.161 137.02948 C3H12Cl2F 137.02946 0.15 13660572 1989 74 C10H13Cl2FN2O2S2 96.6 864 894
Quinalphos 9.201 146.04755 C8H6N2O 146.04746 0.56 10014184 2000 77 C12H15N2O3PS 98.4 956 959
Triflumizole 9.214 205.99829 C8H4ClF3N 205.99789 1.96 3132804 2004 83 C15H15ClF3N3O 96 805 806
Triadimenol 9.225 112.05049 C4H6N3O 112.05054 0.42 8170623 2008 78 C14H18ClN3O2 97.9 897 897
Procymidone 9.238 96.05702 C6H8O 96.05697 0.58 6299842 2012 0 C13H11Cl2NO2 96.9 897 916
Bromophos-ethyl 9.309 302.84604 C7H4BrCl2O2S 302.84574 0.97 10486942 2034 0 C10H12BrCl2O3PS 96.8 880 888
Tetrachlorvinphos 9.342 328.92981 C10H9Cl3O4P 328.92985 0.13 8515425 2044 0 C10H9Cl4O4P 97.8 940 952
Paclobutrazol 9.382 125.01531 C7H6Cl 125.01525 0.41 7793995 2057 0 C15H20ClN3O 98.5 935 979
Fenamiphos 9.417 55.05417 C4H7 55.05423 1.11 8959158 2068 0 C13H22NO3PS 93.4 813 896
Flutolanil 9.437 173.02083 C8H4F3O 173.02088 0.27 42560841 2074 0 C17H16F3NO2 99.5 974 976
Flutriafol 9.455 123.02410 C7H4FO 123.02407 0.26 9903083 2080 50 C16H13F2N3O 98.5 953 960
Pretilachlor 9.508 162.12763 C11H16N 162.12773 0.62 10905234 2096 0 C17H26ClNO2 95.3 860 902
Iodofenphos 9.510 376.86569 C8H8ClIO3PS 376.86595 0.68 21511075 2097 61 C8H8Cl2IO3PS 93.1 816 857
Oxadiazon 9.530 174.95873 C6H3Cl2NO 174.95862 0.60 11688803 2103 0 C15H18Cl2N2O3 98.3 916 918
Oxyfluorfen 9.554 252.03917 C13H7F3O2 252.03927 0.38 6287263 2111 85 C15H11ClF3NO4 95.9 824 826
Bupirimate 9.576 208.14444 C11H18N3O 208.14444 0.01 7679148 2118 0 C13H24N4O3S 98.2 911 915
Myclobutanil 9.583 179.02463 C8H6ClN3 179.02448 0.85 7298452 2120 0 C15H17ClN4 96.1 832 891
Flusilazole 9.592 233.05919 C13H11F2Si 233.05926 0.30 20153005 2123 73 C16H15F2N3Si 90.3 871 891
Tricyclazole 9.614 189.03554 C9H7N3S 189.03552 0.10 3484770 2129 43 C9H7N3S 97.1 973 981
Nitrofen 9.759 282.97965 C12H7Cl2NO3 282.97975 0.37 4113285 2175 60 C12H7Cl2NO3 97 915 922
Chlorthiophos 9.782 268.92563 C7H7ClO3PS2 268.92573 0.36 4905455 2182 0 C11H15Cl2O3PS2 95.5 796 815
Ethion 9.837 230.97318 C5H12O2PS3 230.97315 0.09 17039535 2199 73 C9H22O4P2S4 98.1 932 970
Triazophos 9.934 162.06630 C8H8N3O 162.06619 0.68 4817402 2229 75 C12H16N3O3PS 97.6 886 887
Carfentrazone ethyl 9.974 312.05896 C13H9F3N3O3 312.05905 0.29 7221687 2242 0 C15H14Cl2F3N3O3 97.9 900 922
Norflurazon 10.055 303.03787 C12H9ClF3N3O 303.03808 0.67 5679397 2267 0 C12H9ClF3N3O 96.9 843 845
Carbophenothion 10.062 156.98746 C6H6OPS 156.98715 1.97 11686197 2269 62 C11H16ClO2PS3 98.4 941 946
Edifenphos 10.102 109.01067 C6H5S 109.01065 0.17 11653922 2282 0 C14H15O2PS2 94.3 910 920
Resmethrin 10.214 128.06212 C10H8 128.06205 0.53 3084053 2315 0 C22H26O3 96.4 838 852
Pyridaphenthion 10.422 199.08656 C12H11N2O 199.08659 0.13 4151296 2375 0 C14H17N2O4PS 98.8 937 942
Tetramethrin 10.481 164.07062 C9H10NO2 164.07061 0.08 16344579 2392 0 C19H25NO4 99.4 972 976
Phosmet 10.539 160.03935 C9H6NO2 160.0393 0.30 28822343 2408 0 C11H12NO4PS2 98.4 926 986
Appendix 6 – Table 6 continued. Compound Discoverer 3.2 software QuEChERS soil extract deconvoluted EI data NIST search index
16
Compound name Reference RT [min]
Measured (m/z)
NIST formula NIST theoretical
(m/z)
Mass error (ppm)
Area Calculated RI
RI Delta NIST formula Score SI RSI
Methoxychlor 10.574 227.10657 C15H15O2 227.10666 0.39 20536768 2417 69 C16H15Cl3O2 94.2 852 895
Tebufenpyrad 10.609 171.03200 C6H8N2O2P 171.03179 1.22 13061973 2426 76 C18H24ClN3O 96.7 942 956
Phosalone 10.852 182.00035 C8H5ClNO2 182.00033 0.10 11687589 2490 0 C12H15ClNO4PS2 97 922 938
Pyriproxyfen 10.883 136.07579 C8H10NO 136.07569 0.73 30668503 2498 71 C20H19NO3 97.9 940 953
Leptophos 10.885 171.00285 C7H8OPS 171.0028 0.32 13220533 2499 51 C13H10BrCl2O2PS 95.6 899 913
.lambda.-Cyhalothrin 10.921 181.06485 C13H9O 181.06479 0.33 12337809 2507 85 C23H19ClF3NO3 98.2 925 928
Pyrazophos 11.064 221.07954 C10H11N3O3 221.07949 0.24 6802604 2540 0 C14H20N3O5PS 97.6 881 923
Fenarimol 11.177 138.99460 C7H4ClO 138.99452 0.57 7620002 2567 52 C17H12Cl2N2O 97.9 947 950
Azinphos-ethyl 11.214 132.04440 C8H6NO 132.04439 0.10 6897902 2575 0 C12H16N3O3PS2 97.7 916 960
Permethrine 11.503 183.08044 C13H11O 183.08044 0.02 14135701 2639 0 C21H20Cl2O3 98.8 942 952
Pyridaben 11.578 147.11690 C11H15 147.11683 0.48 25077978 2655 0 C19H25ClN2OS 98.5 938 944
Fluquinconazole 11.583 340.03946 C16H8ClFN5O 340.03959 0.39 19132298 2656 62 C16H8Cl2FN5O 87.6 842 941
Appendix 6 – Table 6 continued. Compound Discoverer 3.2 software QuEChERS soil extract deconvoluted EI data NIST search index
Name Reference RT [min] NIST Formula [M]+
Mass error (ppm)
[M+H]+Mass error (ppm)
[M+C2H5]+
Mass error (ppm)
[M+C3H5]+
Mass error (ppm)
Benzyl alcohol 4.466 C7H8O 108.05697 0.83 109.06534 0.88 137.09664 0.19 149.09664 0.04
Mevinphos 6.543 C7H13O6P 224.04443 225.05280 -0.16 253.08410 -1.36 265.08410
Pebulate 6.729 C10H21NOS 203.13384 204.14221 0.68 232.17351 0.33 244.17351
Phthalimide 6.788 C8H5NO2 147.03148 148.03986 -0.22 176.07116 188.07116
Methacrifos 6.874 C7H13O5PS 240.02158 0.06 241.02996 0.15 269.06126 -0.25 281.06126 -0.2
Chloroneb 6.945 C8H8Cl2O2 205.98959 0.5 206.99796 1.42 235.02926 -0.26 247.02926
Benzene, pentachloro- 7.084 C6HCl5 247.85154 0.21 248.85992 2.63 276.89122 288.89122
Tecnazene 7.384 C6HCl4NO2 258.87559 0.53 259.88397 0.74 287.91527 299.91527
Propachlor 7.411 C11H14ClNO 211.07584 0.39 212.08422 0.24 240.11552 0.50 252.11552 -1.15
Diphenylamine 7.501 C12H11N 169.08860 0.65 170.09698 0.19 198.12828 0.50 210.12828 0.57
Cycloate 7.537 C11H21NOS 215.13384 216.14221 0.45 244.17351 0.13 256.17351
Chlorpropham 7.587 C10H12ClNO2 213.05511 0.21 214.06348 1.39 242.09478 254.09478
Trifluralin 7.590 C13H16F3N3O4 335.10874 -0.34 336.11712 -0.14 364.14842 376.14842
Benfluralin 7.612 C13H16F3N3O4 335.10874 -0.34 336.11712 -0.14 364.14842 376.14842
Sulfotep 7.640 C8H20O5P2S2 322.02219 -0.02 323.03057 -0.46 351.06187 -0.25 363.06187 -0.04
Phorate 7.764 C7H17O2PS3 260.01228 -0.24 261.02066 0.10 289.05196 301.05196
Pentachloroanisole 7.934 C7H3Cl5O 277.86210 -0.02 278.87048 2.27 306.90178 318.90178
Botran 7.936 C6H4Cl2N2O2 205.96443 0.34 206.97281 0.94 235.00411 247.00411
Atrazine 7.963 C8H14ClN5 215.09322 0.46 216.10160 0.44 244.13290 -0.01 256.13290 0.45
Clomazone 8.022 C12H14ClNO2 239.07076 240.07913 0.11 268.11043 0.43 280.11043 -1.17
Terbuthylazine 8.073 C9H16ClN5 229.10887 0.34 230.11725 0.10 258.14855 -0.37 270.14855 -0.27
Diazinone 8.102 C12H21N2O3PS 304.10050 -0.09 305.10888 -0.84 333.14018 -0.37 345.14018 -0.62
Propyzamide 8.113 C12H11Cl2NO 255.02122 0.43 256.02960 -0.02 284.06090 0.84 296.06090 -1.29
Fonofos 8.148 C10H15OPS2 246.02964 -0.11 247.03802 -0.26 275.06932 -0.40 287.06932 -0.41
Pyrimethanil 8.177 C12H13N3 199.11040 0.99 200.11878 0.17 228.15008 -0.11 240.15008 -0.28
Appendix 7 – Table 7. Compound Discoverer 3.2 software QuEChERS soil extract PCI confirmation data for [M+], [M+H], [M+C2H5], and [C3H5] with associated ppm mass error (where detected)
17

Appendix 7 – Table 7 continued. Compound Discoverer 3.2 software QuEChERS soil extract PCI confirmation data for [M+], [M+H], [M+C2H5], and [C3H5] with associated ppm mass error (where detected)
Name Reference RT [min] NIST Formula [M]+
Mass error (ppm)
[M+H]+Mass error (ppm)
[M+C2H5]+
Mass error (ppm)
[M+C3H5]+
Mass error (ppm)
Isazophos 8.203 C9H17ClN3O3PS 313.04113 -0.09 314.04950 -0.37 342.08080 -0.17 354.08080 -0.17
Disulfoton 8.221 C8H19O2PS3 274.02793 -0.74 275.03631 -0.28 303.06761 315.06761
Chlorothalonil 8.239 C8Cl4N2 263.88101 -0.22 264.88939 1.09 292.92069 -0.58 304.92069
Anthracene 8.252 C14H10 178.07770 0.03 179.08608 -0.18 207.11738 219.11738
Triallate 8.287 C10H16Cl3NOS 303.00127 304.00965 -0.33 332.04095 -0.07 344.04095
Dibutyl phthalate 8.386 C16H22O4 278.15126 279.15964 -0.06 307.19094 319.19094
Propanil 8.464 C9H9Cl2NO 217.00557 0.06 218.01395 0.21 246.04525 -0.82 258.04525
Chloropyriphos-methyl 8.514 C7H7Cl3NO3PS 320.89443 0.46 321.90281 -0.29 349.93411 -0.20 361.93411 0.03
Transfluthrin 8.523 C15H12Cl2F4O2 370.01450 -0.04 371.02288 -0.40 399.05418 0.74 411.05418
Vinclozoline 8.526 C12H9Cl2NO3 284.99540 -0.55 286.00378 1.29 314.03508 -0.34 326.03508
Alachlor 8.561 C14H20ClNO2 269.11771 0.16 270.12608 0.20 298.15738 0.21 310.15738
Tolclofos-methyl 8.570 C9H11Cl2O3PS 299.95381 300.96218 -0.21 328.99349 -0.28 340.99349 -0.27
Fenchlorphos 8.643 C8H8Cl3O3PS 319.89919 320.90756 0.10 348.93886 -0.27 360.93886 0.08
Pirimiphos methyl 8.682 C11H20N3O3PS 305.09575 0.41 306.10413 -0.16 334.13543 0.22 346.13543 0.32
Fenitrothion 8.726 C9H12NO5PS 277.01683 0.42 278.02521 0.25 306.05651 0.30 318.05651
Malathion 8.755 C10H19O6PS2 330.03552 331.04389 0.02 359.07519 -0.50 371.07519
Linuron 8.786 C9H10Cl2N2O2 248.01138 0.08 249.01976 0.48 277.05106 289.05106
Dichlofluanid 8.801 C9H11Cl2FN2O2S2 331.96175 -0.08 332.97013 0.39 361.00143 373.00143
Pentachlorothioanisole 8.839 C7H3Cl5S 293.83926 0.23 294.84764 1.63 322.87894 0.30 334.87894 -0.4
Parathion 8.894 C10H14NO5PS 291.03248 0.27 292.04086 0.35 320.07216 332.07216
DCPA 8.901 C10H6Cl4O4 329.90147 0.33 330.90985 0.37 358.94115 -0.89 370.94115
Triadimefon 8.918 C14H16ClN3O2 293.09256 294.10093 -0.06 322.13223 2.74 334.13223
9,10-Anthracenedione 8.949 C14H8O2 208.05188 0.71 209.06026 0.86 237.09156 0.33 249.09156
Pirimiphos ethyl 8.956 C13H24N3O3PS 333.12705 0.24 334.13543 -0.34 362.16673 0.27 374.16673 -0.1
Isopropalin 9.011 C15H23N3O4 309.16831 310.17668 0.45 338.20798 350.20798
Bromophos 9.027 C8H8BrCl2O3PS 363.84867 364.85705 0.54 392.88835 0.33 404.88835 0.92
Clofenvinfos 9.060 C12H14Cl3O4P 357.96898 358.97736 -0.11 387.00866 399.00866
Fipronil 9.080 C12H4Cl2F6N4OS 435.93816 436.94653 -0.10 464.97783 476.97783
Cyprodinil 9.093 C14H15N3 225.12605 1.74 226.13443 0.40 254.16573 -0.07 266.16573 0.2
Metazachlor 9.117 C14H16ClN3O 277.09764 0.86 278.10602 -0.23 306.13732 318.13732
Penconazole 9.137 C13H15Cl2N3 283.06375 284.07213 -0.10 312.10343 324.10343
Tolylfluanid 9.161 C10H13Cl2FN2O2S2 345.97740 -1.96 346.98578 -0.07 375.01708 387.01708
Quinalphos 9.201 C12H15N2O3PS 298.05355 -0.05 299.06193 -0.10 327.09323 -0.16 339.09323 -0.31
Triflumizole 9.214 C15H15ClF3N3O 345.08503 346.09340 -0.31 374.12470 386.12470
Triadimenol 9.225 C14H18ClN3O2 295.10821 296.11658 -0.77 324.14788 336.14788
Procymidone 9.238 C13H11Cl2NO2 283.01614 -0.08 284.02451 -0.17 312.05581 -0.39 324.05581 -0.16
Bromophos-ethyl 9.309 C10H12BrCl2O3PS 391.87997 392.88835 0.04 420.91965 0.36 432.91965 1.75
Tetrachlorvinphos 9.342 C10H9Cl4O4P 363.89871 364.90708 -0.21 392.93838 404.93838
Paclobutrazol 9.382 C15H20ClN3O 293.12894 294.13732 -0.13 322.16862 334.16862
Fenamiphos 9.417 C13H22NO3PS 303.10525 -0.3 304.11363 1.41 332.14493 1.84 344.14493
Flutolanil 9.437 C17H16F3NO2 323.11276 0.09 324.12114 -0.09 352.15244 0.03 364.15244
Flutriafol 9.455 C16H13F2N3O 301.10212 302.11050 -0.37 330.14180 342.14180
18

For Research Use Only. Not for use in diagnostic procedures. © 2020 Thermo Fisher Scientific Inc. All rights reserved. All trademarks are the property of Thermo Fisher Scientific and its subsidiaries. This information is presented as an example of the capabilities of Thermo Fisher Scientific products. It is not intended to encourage use of these products in any manners that might infringe the intellectual property rights of others. Specifications, terms and pricing are subject to change. Not all products are available in all countries. Please consult your local sales representatives for details. Not all products are available in all countries. Please consult your local sales representatives for details. AN10727-EN 0720C
Find out more at thermofisher.com
Appendix 7 – Table 7 continued. Compound Discoverer 3.2 software QuEChERS soil extract PCI confirmation data for [M+], [M+H], [M+C2H5], and [C3H5] with associated ppm mass error (where detected)
Name Reference RT [min] NIST Formula [M]+
Mass error (ppm)
[M+H]+Mass error (ppm)
[M+C2H5]+
Mass error (ppm)
[M+C3H5]+
Mass error (ppm)
Pretilachlor 9.508 C17H26ClNO2 311.16466 -0.66 312.17303 -0.06 340.20434 0.50 352.20434 0.62
Iodofenphos 9.510 C8H8Cl2IO3PS 411.83480 412.84318 -0.04 440.87448 -0.26 452.87448 -0.01
Oxadiazon 9.530 C15H18Cl2N2O3 344.06890 0.02 345.07728 -0.12 373.10858 1.81 385.10858
Oxyfluorfen 9.554 C15H11ClF3NO4 361.03232 -1.34 362.04070 -0.02 390.07200 402.07200
Bupirimate 9.576 C13H24N4O3S 316.15636 0.13 317.16474 -0.03 345.19604 -0.51 357.19604 -0.47
Myclobutanil 9.583 C15H17ClN4 288.11363 289.12200 -0.26 317.15330 329.15330
Flusilazole 9.592 C16H15F2N3Si 315.09978 0.35 316.10816 0.20 344.13946 1.59 356.13946
Tricyclazole 9.614 C9H7N3S 189.03552 0.96 190.04390 0.70 218.07520 230.07520
Nitrofen 9.759 C12H7Cl2NO3 282.97975 -0.57 283.98813 -1.32 312.01943 324.01943
Chlorthiophos 9.782 C11H15Cl2O3PS2 359.95718 0.17 360.96556 0.28 388.99686 0.22 400.99686 -0.33
Ethion 9.837 C9H22O4P2S4 383.98707 0.19 384.99544 0.29 413.02674 425.02674
Triazophos 9.934 C12H16N3O3PS 313.06445 -1.35 314.07283 0.18 342.10413 0.02 354.10413
Carfentrazone ethyl 9.974 C15H14Cl2F3N3O3 411.03588 0.16 412.04426 0.15 440.07556 2.15 452.07556
Norflurazon 10.055 C12H9ClF3N3O 303.03808 0.52 304.04645 0.41 332.07775 -0.37 344.07775
Edifenphos 10.102 C14H15O2PS2 310.02456 -0.21 311.03294 0.33 339.06424 351.06424
Resmethrin 10.214 C22H26O3 338.18765 0.5 339.19602 0.40 367.22732 379.22732
Resmethrin 10.258 C22H26O3 338.18765 0.5 339.19602 0.40 367.22732 379.22732
Pyridaphenthion 10.422 C14H17N2O4PS 340.06412 -0.63 341.07249 -0.09 369.10379 -0.99 381.10379
Tetramethrin 10.481 C19H25NO4 331.17781 332.18619 -0.34 360.21749 372.21749
Phosmet 10.539 C11H12NO4PS2 316.99399 318.00236 -0.14 346.03366 358.03366
Methoxychlor 10.574 C16H15Cl3O2 344.01321 345.02159 0.14 373.05289 0.86 385.05289 0.23
Tebufenpyrad 10.609 C18H24ClN3O 333.16024 0.15 334.16862 0.22 362.19992 -0.37 374.19992
Phosalone 10.852 C12H15ClNO4PS2 366.98632 -0.29 367.99469 0.32 396.02599 408.02599
Pyriproxyfen 10.883 C20H19NO3 321.13595 322.14432 -0.09 350.17562 362.17562
Leptophos 10.885 C13H10BrCl2O2PS 409.86941 410.87778 0.22 438.90908 0.15 450.90908
.lambda.-Cyhalothrin 10.921 C23H19ClF3NO3 449.10001 450.10838 -0.05 478.13968 490.13968
Pyrazophos 11.064 C14H20N3O5PS 373.08558 -1.03 374.09396 0.10 402.12526 0.09 414.12526
Fenarimol 11.177 C17H12Cl2N2O 330.03212 -1.22 331.04050 -0.52 359.07180 371.07180
Azinphos-ethyl 11.214 C12H16N3O3PS2 345.03652 346.04490 -0.31 374.07620 386.07620
Permethrine 11.503 C21H20Cl2O3 390.07840 391.08678 0.07 419.11808 431.11808
Coumaphos 11.563 C14H16ClO5PS 362.01391 0.55 363.02229 0.56 391.05359 -0.88 403.05359
Pyridaben 11.578 C19H25ClN2OS 364.13706 -1.4 365.14544 0.55 393.17674 405.17674
Fluquinconazole 11.583 C16H8Cl2FN5O 375.00845 376.01682 0.86 404.04812 -0.67 416.04812