consist direction ttax 76878 - uic · statistical data for car fleets. ... table 2: test log – ns...
TRANSCRIPT

Use of Railway Instrumented Wheelsets to Characterize the Service Performance of Freight Vehicles
Philip Marsh1 and Robert Caldwell1, Jon R. Jeambey2
1National Research Council Canada, CSTT, Ottawa, Canada; 2TTX Company, Chicago, USA
Introduction Railway instrumented wheelsets (IWS) are used in a number of ways: to assess the effects of new car and truck designs and design changes on wheel/rail forces, to monitor the performance of trucks in service, and to assess track condition – especially to determine unsafe geometry anomalies. In North America, vehicle performance information (based on wheel/rail forces) is obtained principally from vehicle acceptance tests undertaken on test track at the Federal Railroad Administration’s Transportation Technology Centre (TTC) in Pueblo, Colorado, and from measurements obtained from instrumented rails (often referred to as truck-performance detectors, or TPD) distributed throughout the North American rail network. The acceptance tests are designed to excite carbody resonance and generally provide severe track negotiation conditions. TPD, however, are typically installed in revenue service track, and the data they provide for individual cars is less extensive. However, they provide good statistical data for car fleets. Objective of Study The objective was to gain a better understanding of the similarities and differences between the two main sources of car and truck-performance information ( i.e. IWS and TPD). Controlled track tests and field tests over a TPD site were performed using a typical North American freight car equipped with IWS. This paper describes the testing undertaken and compares the wheel/rail force data gathered using the IWS with measurements taken simultaneously at the TPD. Railway Instrumented Wheelsets (IWS) Railway Instrumented Wheelsets (IWS) enable continuous measurement of vertical, lateral and longitudinal wheel/rail forces and thus supply detailed information on the performance of the rail car on which they are installed. IWS were used for these tests to measure the wheel/rail forces at the lead truck. TTX Company’s instrumented wheelsets, WS07 and WS14, were placed on the leading truck of the A-unit of the spine car (Figure 1 and Photograph 1).
Figure 1 – Test Consist
B C D E F A
TTX
Unit A Unit D Unit E Unit C Unit B
TTAX 76878
IWS 07
IWS 14
Consist Direction

Photograph 1 – Test Consist on WRM Track Truck-Performance Detectors Truck-performance detectors (TPD) consist of track instrumentation (usually strain gauges applied to the rail) which determines lateral and vertical forces as each axle passes over the detector site. TPD in North America typically have 3 strain gauges sections in reverse curves and in the intervening tangent. The data obtained from the TPD is typically in the form of a table containing the values for lateral loads (L), vertical loads (V) and L/V ratios for all wheels. Testing Performed Data from two separate tests are discussed in this paper. The first series of tests were performed at TTC to obtain track worthiness data on the car tested. The second series of tests were performed on Norfolk Southern (NS) track in Loudon, Tennessee, where NS has a TPD site. For all testing, a five-unit articulated spine car (TTAX 76878), equipped with 70-ton constant-damped trucks, was used. Lightweight cars such as this often provide poor performance when monitored over TPD sites. The lack of vertical wheel load increases the likelihood of recording high L/V ratios. The car was tested in the empty condition since it has generated repeated alerts by TPD in that condition. Testing at TTC Testing was performed at the Transportation Technology Center in January 2006 to obtain data from the instrumented spine car as it traveled over the Wheel Rail Mechanism (WRM) test track. Data was collected with the test consist running in the test loop at various test speeds. Table 1 describes the test runs analysed for this paper. Figure 2 shows a schematic of the WRM test track to illustrate the curvatures.
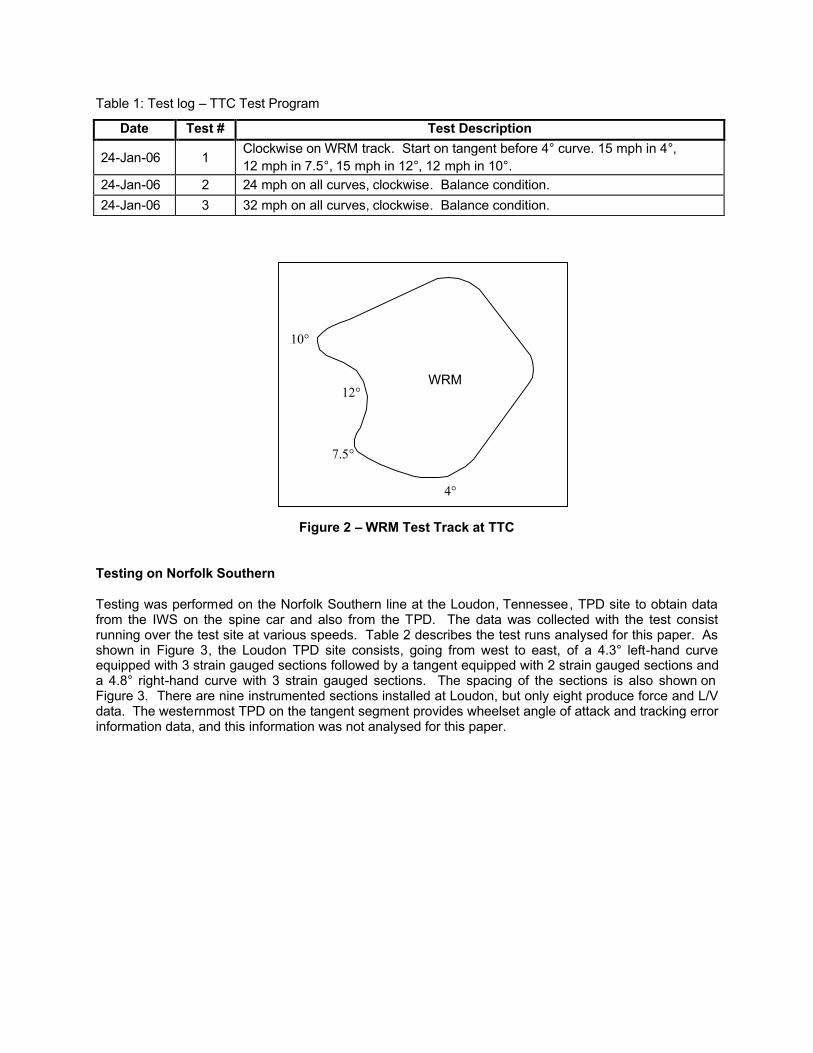
Table 1: Test log – TTC Test Program
Date Test # Test Description
24-Jan-06 1 Clockwise on WRM track. Start on tangent before 4° curve. 15 mph in 4°, 12 mph in 7.5°, 15 mph in 12°, 12 mph in 10°.
24-Jan-06 2 24 mph on all curves, clockwise. Balance condition. 24-Jan-06 3 32 mph on all curves, clockwise. Balance condition.
Figure 2 – WRM Test Track at TTC Testing on Norfolk Southern Testing was performed on the Norfolk Southern line at the Loudon, Tennessee, TPD site to obtain data from the IWS on the spine car and also from the TPD. The data was collected with the test consist running over the test site at various speeds. Table 2 describes the test runs analysed for this paper. As shown in Figure 3, the Loudon TPD site consists, going from west to east, of a 4.3° left-hand curve equipped with 3 strain gauged sections followed by a tangent equipped with 2 strain gauged sections and a 4.8° right-hand curve with 3 strain gauged sections. The spacing of the sections is also shown on Figure 3. There are nine instrumented sections installed at Loudon, but only eight produce force and L/V data. The westernmost TPD on the tangent segment provides wheelset angle of attack and tracking error information data, and this information was not analysed for this paper.
WRM
4°
7.5°
12°
10°

Figure 3 – TPD Detector Layout at NS Loudon Site Table 2: Test Log – NS Test Program
Case Date Test # Test Description 1 28-Feb-06 20 Locomotive pulling east at 30mph over detectors. 2 28-Feb-06 22 Locomotive pulling east at 33mph over detectors. 3 28-Feb-06 25 Locomotive pulling east at 40mph over detectors. 4 28-Feb-06 26 Locomotive pulling east at 35mph over detectors. 5 28-Feb-06 32 Locomotive pulling east at 15mph over detectors.
Analysis Approach and Description The Association of American Railroads (AAR) has the following acceptance criteria for field service: • Wheel L/V Ratio < 1.0 • Axle L/V Ratio < 1.5 • Truck side L/V Ratio < 0.6 • Percent Vertical Wheel Load > 10% of static
o These limits cannot be exceeded for more than 50 milliseconds. The data obtained from the TTC tests was analysed to obtain information on the vehicle performance when evaluated for safety compliance in curving, in accordance with the above-stated AAR requirements for car acceptance.
N
E
W
S 794”
72” 108”
798”
798”
783” Strain-gauged rail
4.8°°
4.3°° Laser/optical system
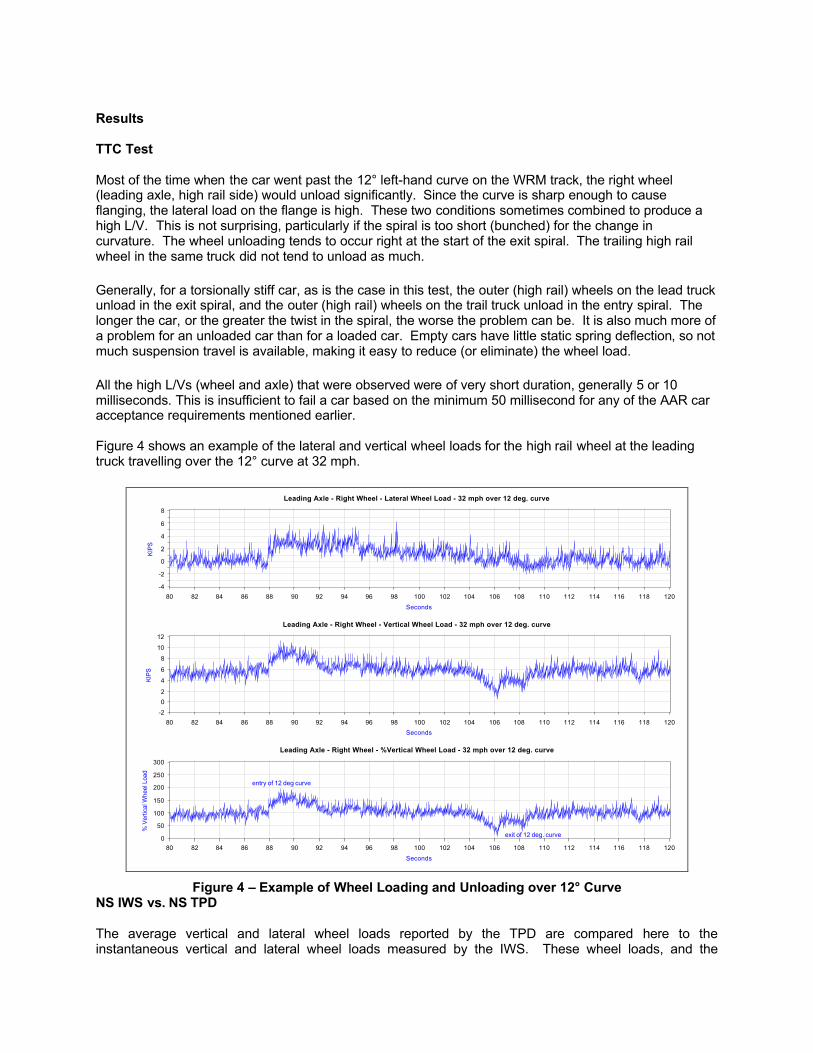
Results TTC Test Most of the time when the car went past the 12° left-hand curve on the WRM track, the right wheel (leading axle, high rail side) would unload significantly. Since the curve is sharp enough to cause flanging, the lateral load on the flange is high. These two conditions sometimes combined to produce a high L/V. This is not surprising, particularly if the spiral is too short (bunched) for the change in curvature. The wheel unloading tends to occur right at the start of the exit spiral. The trailing high rail wheel in the same truck did not tend to unload as much. Generally, for a torsionally stiff car, as is the case in this test, the outer (high rail) wheels on the lead truck unload in the exit spiral, and the outer (high rail) wheels on the trail truck unload in the entry spiral. The longer the car, or the greater the twist in the spiral, the worse the problem can be. It is also much more of a problem for an unloaded car than for a loaded car. Empty cars have little static spring deflection, so not much suspension travel is available, making it easy to reduce (or eliminate) the wheel load. All the high L/Vs (wheel and axle) that were observed were of very short duration, generally 5 or 10 milliseconds. This is insufficient to fail a car based on the minimum 50 millisecond for any of the AAR car acceptance requirements mentioned earlier. Figure 4 shows an example of the lateral and vertical wheel loads for the high rail wheel at the leading truck travelling over the 12° curve at 32 mph.
80 82 84 86 88 90 92 94 96 98 100 102 104 106 108 110 112 114 116 118 120Seconds
-4
-2
0
2
4
6
8
KIPS
Leading Axle - Right Wheel - Lateral Wheel Load - 32 mph over 12 deg. curve
80 82 84 86 88 90 92 94 96 98 100 102 104 106 108 110 112 114 116 118 120Seconds
-202
4
6
8
10
12
KIPS
Leading Axle - Right Wheel - Vertical Wheel Load - 32 mph over 12 deg. curve
80 82 84 86 88 90 92 94 96 98 100 102 104 106 108 110 112 114 116 118 120Seconds
0
50
100
150
200
250
300
% V
ertic
al W
heel
Loa
d
exit of 12 deg. curve
entry of 12 deg curve
Leading Axle - Right Wheel - %Vertical Wheel Load - 32 mph over 12 deg. curve
Figure 4 – Example of Wheel Loading and Unloading over 12° Curve
NS IWS vs. NS TPD The average vertical and lateral wheel loads reported by the TPD are compared here to the instantaneous vertical and lateral wheel loads measured by the IWS. These wheel loads, and the

differences between them are shown in Tables 3 to 7 for each case in Table 2. Only the leading axle has been shown, as it is generally of greater interest due to the higher lateral loads which act upon it. Table 3: Comparison of TPD and IWS vertical and lateral loads for Case 1.
TPD # TPD IWS Difference TPD IWS Difference TPD IWS Difference1 4.91 4.75 0.16 6.57 6.43 0.14 1.98 1.85 0.132 5.51 5.08 0.43 6.23 5.97 0.26 0.85 0.97 -0.123 6 5.76 0.24 5.2 5.00 0.20 1.61 1.94 -0.335 5.54 5.43 0.11 5.79 6.21 -0.42 -0.7 -0.30 -0.406 5.91 5.67 0.24 6.03 5.86 0.17 -0.3 -0.33 0.037 7.67 7.44 0.23 3.93 3.37 0.56 1.52 1.40 0.128 6.55 6.05 0.50 4.44 4.43 0.01 1.82 1.91 -0.099 6.58 7.71 -1.13 4.87 3.50 1.37 1.75 1.43 0.32
North Rail South Rail South RailVertical Load, kips Vertical Load, kips Lateral Load, kips
Table 4: Comparison of TPD and IWS vertical and lateral loads for Case 2.
TPD # TPD IWS Difference TPD IWS Difference TPD IWS Difference1 4.57 5.07 -0.50 6.41 6.24 0.17 2.41 2.09 0.322 5.17 5.03 0.14 5.95 5.87 0.08 1.13 1.57 -0.443 5.69 5.73 -0.04 5.37 5.17 0.20 2.1 2.17 -0.075 5.63 5.53 0.10 5.53 5.93 -0.40 -0.68 -0.34 -0.346 5.88 5.44 0.44 6.08 5.79 0.29 -0.27 -0.24 -0.037 7.75 7.64 0.11 3.81 3.64 0.17 1.98 1.67 0.318 6.05 6.33 -0.28 4.57 4.47 0.10 2.47 2.29 0.189 6.55 7.67 -1.12 5 3.75 1.25 2.2 1.99 0.21
North Rail South Rail South RailVertical Load, kips Vertical Load, kips Lateral Load, kips
Table 5: Comparison of TPD and IWS vertical and lateral loads for Case 3.
TPD # TPD IWS Difference TPD IWS Difference TPD IWS Difference1 4.33 4.68 -0.35 6.9 6.72 0.18 3.72 3.02 0.702 5.73 5.27 0.46 6.37 6.29 0.08 1.76 1.82 -0.063 5.4 5.89 -0.49 5.15 5.15 0.00 2.45 2.51 -0.065 5.73 5.25 0.48 5.45 6.08 -0.63 -0.59 -0.23 -0.366 5.88 5.62 0.26 5.79 5.94 -0.15 -0.32 -0.37 0.057 7.98 8.03 -0.05 4.16 3.17 0.99 2.66 1.60 1.068 6.95 6.79 0.16 3.56 4.10 -0.54 2.12 2.29 -0.179 7.15 7.11 0.04 4.76 3.73 1.03 2.39 2.03 0.36
North Rail South Rail South RailVertical Load, kips Vertical Load, kips Lateral Load, kips
Table 6: Comparison of TPD and IWS vertical and lateral loads for Case 4.

TPD # TPD IWS Difference TPD IWS Difference TPD IWS Difference1 4.41 4.77 -0.36 6.94 6.63 0.31 3.37 2.95 0.422 5.54 5.20 0.34 5.62 5.70 -0.08 1.57 1.65 -0.083 5.49 6.17 -0.68 5.08 5.19 -0.11 2.54 2.47 0.075 6.16 5.09 1.07 5.95 5.43 0.52 -0.55 -0.36 -0.196 5.53 5.36 0.17 5.71 5.79 -0.08 -0.39 -0.31 -0.087 8.3 8.10 0.20 3.35 3.42 -0.07 2.02 1.71 0.318 6.62 6.92 -0.30 4.38 4.47 -0.09 2.56 2.29 0.279 7.32 7.79 -0.47 4.62 3.36 1.26 2.31 1.89 0.42
North Rail South Rail South RailVertical Load, kips Vertical Load, kips Lateral Load, kips
Table 7: Comparison of TPD and IWS vertical and lateral loads for Case 5.
TPD # TPD IWS Difference TPD IWS Difference TPD IWS Difference1 5.51 4.94 0.57 6.2 5.65 0.55 2.75 2.59 0.162 5.5 5.31 0.19 5.38 5.55 -0.17 0.93 1.20 -0.273 6.5 6.66 -0.16 4.57 4.59 -0.02 1.94 1.93 0.015 5.49 5.27 0.22 5.53 5.40 0.13 -0.54 -0.25 -0.296 5.45 4.97 0.48 5.91 5.73 0.18 -0.23 -0.25 0.027 7.7 7.57 0.13 3.64 3.41 0.23 2.18 1.80 0.388 6.08 6.24 -0.16 5.55 4.99 0.56 2.97 2.52 0.459 7.49 7.18 0.31 4.36 4.18 0.18 2.1 2.14 -0.04
North Rail South Rail South RailVertical Load, kips Vertical Load, kips Lateral Load, kips
* North rail lateral IWS data not available. The axle sum and truckside L/V values reported by the TPD were also compared to the values produced by the IWS. These values and the differences between them are shown below for the first three cases in Table 2. Good agreement is seen. Data for the other two cases also showed good agreement and is omitted here only for brevity. Table 8: Comparison of TPD and IWS L/V values for Case 1.
TPD # TPD IWS Difference TPD IWS Difference TPD IWS Difference1 0.73 0.70 0.03 0.44 0.50 -0.06 0.38 0.38 0.002 0.49 0.55 -0.06 0.39 0.49 -0.10 0.23 0.32 -0.093 0.82 0.85 -0.03 0.53 0.54 -0.01 0.42 0.49 -0.075 0.26 0.08 0.18 0.09 0.06 0.03 -0.04 0.03 -0.076 0.16 0.09 0.07 0.03 0.07 -0.04 0 0.02 -0.027 0.8 0.83 -0.03 0.27 0.32 -0.05 0.46 0.50 -0.048 0.84 0.93 -0.09 0.36 0.53 -0.17 0.45 0.49 -0.049 0.64 0.91 -0.27 0.3 0.34 -0.04 0.4 0.48 -0.08
Axle Sum L/V, Leading Axle Truckside L/V, North Rail Truckside L/V, South Rail

Table 9: Comparison of TPD and IWS L/V values for Case 2.
TPD # TPD IWS Difference TPD IWS Difference TPD IWS Difference1 0.93 0.80 0.13 0.57 0.58 -0.01 0.46 0.48 -0.022 0.65 0.73 -0.08 0.49 0.56 -0.07 0.27 0.42 -0.153 0.96 0.96 0.00 0.58 0.60 -0.02 0.5 0.53 -0.035 0.31 0.10 0.21 0.14 0.07 0.07 -0.01 0.02 -0.036 0.17 0.07 0.10 0.03 0.08 -0.05 0 0.03 -0.037 1.02 0.91 0.11 0.32 0.35 -0.03 0.51 0.53 -0.028 1.02 1.13 -0.11 0.38 0.60 -0.22 0.52 0.52 0.009 0.76 1.04 -0.28 0.34 0.41 -0.07 0.46 0.55 -0.09
Axle Sum L/V, Leading Axle Truckside L/V, North Rail Truckside L/V, South Rail
Table 10: Comparison of TPD and IWS L/V values for Case 3.
TPD # TPD IWS Difference TPD IWS Difference TPD IWS Difference1 1.15 1.03 0.12 0.62 0.63 -0.01 0.55 0.55 0.002 0.82 0.81 0.01 0.53 0.55 -0.02 0.33 0.39 -0.063 1.14 1.09 0.05 0.61 0.58 0.03 0.49 0.53 -0.045 0.26 0.05 0.21 0.14 0.03 0.11 -0.02 0.04 -0.066 0.17 0.10 0.07 0.03 0.08 -0.05 0 0.01 -0.017 1.13 1.03 0.10 0.34 0.40 -0.06 0.56 0.55 0.018 1.21 1.19 0.02 0.5 0.65 -0.15 0.54 0.53 0.019 0.88 1.11 -0.23 0.39 0.48 -0.09 0.51 0.56 -0.05
Axle Sum L/V, Leading Axle Truckside L/V, North Rail Truckside L/V, South Rail
Discussion/Interpretation It is important to note that all of the testing was done using an empty car equipped with instrumented wheelsets and that the observations and conclusions that follow are applicable to this test condition. In comparing the average vertical and lateral wheel loads from the TPD to the equivalent instantaneous loads from the IWS (see Tables 3 – 7), it is evident that they are in strong agreement. In nearly all cases, the difference between the TPD and IWS reported loads is less than 0.5 kips. The situation between the TPD and the IWS for the lateral load (south rail only reported) is the same. Measuring one system with the other serves as a useful calibration check of both, and provides reassurance that both are functioning as intended. While the TPD can report on wheel loads for every axle that passes its location, it only captures a snapshot of the performance of each axle. Its ability to report a poorly-performing truck is dependent on the truck’s behaviour being at or beyond the TPD’s reporting threshold at the moment the truck passes the TPD. Due to the dynamic nature of rail car behaviour, it is possible for a TPD to miss such a -truck. Having multiple strain-gauged rails in relatively close proximity in a curve helps to reduce, but does not eliminate, this possibility. The IWS measures data continuously and can therefore capture all aspects of the behaviour of the wheelset, truck or car (depending on the number of IWS installed). The IWS can reveal the location of the highest lateral load acting on a wheel in a curve. Because of dynamic effects, this lateral load may be significantly different from what a nearby strain-gauged rail reports. This is illustrated in Figure 5, which compares measured IWS with TPD lateral force around a curve. It can be seen that, because of dynamic effects, lateral force varies appreciably through the curve. (Other work by CSTT shows that this variation is highly repeatable). The centre strain-gauged section in the 4.3° curve reports a lateral wheel load of 1.57 kips, similar to the IWS value of 1.65 kips. But on either side of the section, the IWS lateral load is higher (3.62 kips 70 inches past the section). Corresponding behaviour can be observed for vertical wheel load about the centre TPD in the same curve, shown in Figure 6. Note that the lateral and vertical wheel loads in the figures are roughly in-phase, which keeps the L/V ratio from varying dramatically.

Eastbound, 4.3 DOC
V = 36.39 mph (Vbal = 34.1 mph)
0
0.5
1
1.5
2
2.5
3
3.5
4
200 400 600 800 1000 1200 1400 1600 1800 2000 2200
Distance [inch]
Forc
e [k
ips]
Lat Load, High Rail
IWS = 2.95TPD = 3.37
IWS = 1.65TPD = 1.57
IWS = 2.47TPD = 2.54
Figure 5 – Lateral Wheel Load
Eastbound, 4.3 DOCV = 36.39 mph (Vbal = 34.1 mph)
4
4.5
5
5.5
6
6.5
7
7.5
200 400 600 800 1000 1200 1400 1600 1800 2000 2200
Distance [inch]
Forc
e [k
ips]
Vert Load, High Rail
IWS = 6.63TPD = 6.94
IWS = 5.70TPD = 5.62
IWS = 5.19TPD = 5.08
Figure 6 - Vertical Wheel Load
The axle sum and truckside L/V values measured by the TPD and IWS are also very similar (see Tables 8 – 1 0). For cases 3, 4 and 5, the TPD flagged the test truck twice, twice and once, respectively, for truckside L/V values that exceeded the AAR’s car acceptance limit. These all occurred on the north (low) rail of the 4.3° curve. The IWS also reported high truckside L/V values for the same cases, but not always at the same TPD location. Truckside L/V values that exceed 0.6 are highlighted in the Tables for easy comparison. As with vertical and lateral loads, the IWS produces L/V values continuously, whereas the TPD takes a snapshot. The L/V values as reported by the TPD may or may not be the highest values that the axles or the trucksides produce in a curve, it depends on the behaviour of the truck as it passes the TPD. The IWS will reveal the L/V values throughout the curve, and can be used to pinpoint potential

trouble areas on the curve. Such trouble areas may be specific to the car type in which the IWS are installed. In order to obtain a more complete understanding of the similarities and differences between TPD and IWS results, the authors hope to repeat the tests described here using fully loaded rail cars in the near future. The results from such tests are expected to underscore the importance of knowing the variation in forces and L/V values throughout an entire curve, or through many or all curves in a territory. Loaded cars will produce much higher forces, and track geometry anomalies could lead to dangerously high peak forces. IWS could be used to identify these locations, so that they could be further investigated and/or corrected. As well, IWS could be used to pre-select locations where truck performance is expected to be acceptable for various car types. TPD could then be installed at these locations. Any cars which are flagged by the TPD as poor performers would be less likely to be “false positives”. Conclusions
(1) The testing performed at TTC confirmed that the spine car would perform suitably in field service. No AAR limits were exceeded during these tests.
(2) The values obtained during the testing perform on NS in Loudon Tennessee show that the
average vertical and lateral wheel loads from the TPD are comparable to the equivalent instantaneous values obtained from the IWS. The IWS will provide the real-time values of the wheel/rail forces and L/V values. The critical forces may not necessarily occur at the location where the TPD are installed. This highlights the differences between the systems.
(3) A TPD installation is an effective way to monitor fleet performance, in that snapshot data is
available for all axles of every car type that passes over the site. After sufficient car passes, the performance of different car types can be analysed statistically to check fleets for undesirable performance characteristics. These characteristics may or may not be specific to the track geometry speed at the site. If the characteristics are determined to be specific to the site, adjustments could be to the geometry or speed in order to improve fleet performance. If the characteristics are not site-specific, modifications to the fleet may be required to improve performance.
(4) The continuous data from IWS depicts the constant changing axle, truck or vehicle
performance throughout entire tangents and curves. This data can be used to pinpoint potential track trouble spots, or it could be used to determine where TPD should be installed so as to reliably capture poor performing trucks while reducing the number of “false positives”.
(5) An IWS installation is an effective way to monitor the state of the track, and the effect of track
geometry and speed on a given car type. Since IWS can be swapped from one car to another with minor effort (or multiple IWS can be run in several cars), investigations can be undertaken to determine how known track conditions affect the performance of cars having new, typical-worn and heavily worn trucks. As well, rail cars in captive-fleet service (such as coal gondolas) could be run with IWS to monitor the degradation in truck performance versus accumulated mileage. This could result in just-in-time truck maintenance practices.
Acknowledgement The authors would like to thank Scott Keegan, Mike Allran and Sean Woody of Norfolk Southern Railway, Kerry Hopkins and Jim Claflin of TTX Company and Erik Oxelgren of CSTT for their help in the successful testing and preparation of this paper.