considerations for raid-6 availability and format/rebuild ... · considerations for raid-6...
TRANSCRIPT

Redpaper
Considerations for RAID-6 Availability and Format/Rebuild Performance on the DS5000
Introduction/overview
This IBM® Redpaper publication documents considerations for RAID-6 availability and format/rebuild performance on the DS5000. It was created by Siebo Friesenborg of Storage ATS for Americas Group using data provided by Michael Roll of Modular Systems Development. The DS5000 implementation of RAID-6 was used to generate materials in this paper. Other implementations may be similar (and they may not). No attempt was made to cover a breadth of products.
Topics covered in this paper include:
� Basic information about how the DS5000 handles write operations. The first part of this subject deals with the handling of write requests in cache write storage. It is the same regardless of the RAID level or the type of physical/logical drive.
� When a certain amount of cache write storage is used, programming is initiated that frees up cache write storage by writing data to the high density drives (HDDs). The number of operations required to physically write data to disk depends on the RAID used. This is explained for RAID-5, RAID-6, and RAID-10.
The next section of this paper discusses a method of estimating what the additional load on HDDs would be if RAID-6 were used instead of the current RAID. It is based on actual data gathered from a production DS3000, DS4000®, or DS5000 through the Performance Monitor.
A third topic is measurements taken of the time to initially format arrays and the time to recover from a failed disk. For these measurements we used 300 Gigabyte, 15 K RPM, FC drive. No servers were used for this. Rather, selecting an HDD on the GUI and using the fail drive button of the Advanced Recovery window was used to cause rebuild.
Alex OsunaSiebo Friesenborg
Michael D. Roll
© Copyright IBM Corp. 2009. All rights reserved. ibm.com/redbooks 1
Cache write storage management
This section covers different applications of storage management.
Application writes data to cache
When an application writes data, it normally does not go to HDDs for a while. Rather, it is sent to the cache write storage of the preferred control unit and is optionally (when write mirroring is enabled) sent from there to cache write storage in the other control unit. When data is resident in both control units, the application receives a signal saying that the data is safely stored and the application can proceed. Naturally, if synchronous mirroring to a remote site is used, the signal is not given until the data is also at the remote site.
Notice that, up to this point, HDDs are not involved. That is, we could use any RAID and any device type to this point and performance would not be changed. The speed of the fiber and remote attachment count, but not the HDDs. There could be floppy disks back there. This lasts until a percentage of write cache storage (80% default) contains dirty data (that is, data that is different from what is on the HDDs). This percentage, or high water mark, causes routines to be invoked that write data to the HDDs. After the dirty segments are written, the cache write storage can be freed for reuse.
Cache writes data to HDDs
The request that went over the high water mark and any subsequent request will be processed the same way. However, while applications might be requesting more data be written, the least recently used dirty data is being written to disk. If the write data is submitted to the DS5000 faster than old data can be written to HDDs, applications will have to wait until the storage that they need is made free. If the DS5000 can write dirty data faster than applications can request writes, more and more cache write storage will be made available until we hit the low water mark. The low water mark has a default of 80%, which is the same as the high water mark.
If the low water mark were set to a much lower value, the controllers would have relatively long periods building up from the low water mark to the high water mark. Then there would be a burst of activity while the dirty data was destaged, followed by another relatively long idle period. 80-80 results in a fairly consistent level of activity (and therefore, more consistent levels of contention with read operations).
Optimizing writes
There was a slight omission under “Application writes data to cache” on page 2. There is an algorithm in the Storage Manager that detects instances when there is a write operation that replaces an entire stride (a stride is all of the data blocks associated with a set of RAID-5 or RAID-6 parity). In that case, the data is written to disk before the application is signaled that the operation is complete. This is a great performance enhancement for installations that write truly large amounts of data (films, surveillance data, seismic data, and so on).
Writing data to HDDs
This section covers the various methods of writing data to HDDs.
2 Considerations for RAID-6 Availability and Format/Rebuild Performance on the DS5000
Writing one strip
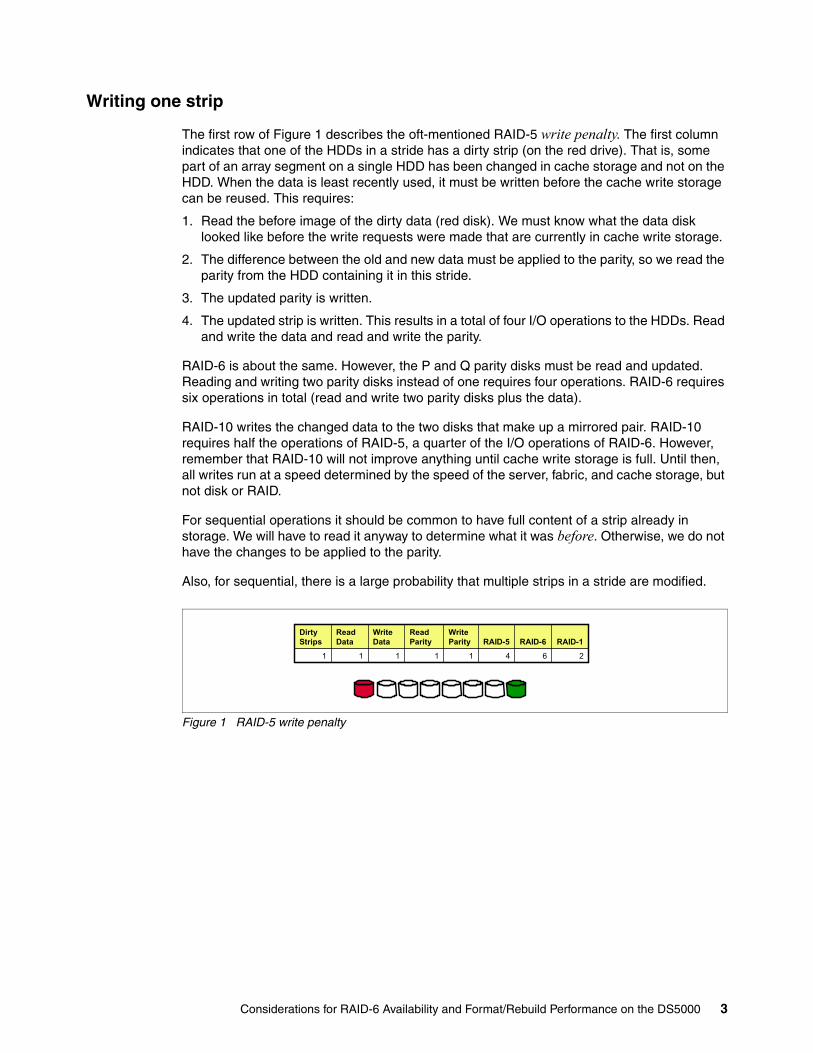
The first row of Figure 1 describes the oft-mentioned RAID-5 write penalty. The first column indicates that one of the HDDs in a stride has a dirty strip (on the red drive). That is, some part of an array segment on a single HDD has been changed in cache storage and not on the HDD. When the data is least recently used, it must be written before the cache write storage can be reused. This requires:
1. Read the before image of the dirty data (red disk). We must know what the data disk looked like before the write requests were made that are currently in cache write storage.
2. The difference between the old and new data must be applied to the parity, so we read the parity from the HDD containing it in this stride.
3. The updated parity is written.
4. The updated strip is written. This results in a total of four I/O operations to the HDDs. Read and write the data and read and write the parity.
RAID-6 is about the same. However, the P and Q parity disks must be read and updated. Reading and writing two parity disks instead of one requires four operations. RAID-6 requires six operations in total (read and write two parity disks plus the data).
RAID-10 writes the changed data to the two disks that make up a mirrored pair. RAID-10 requires half the operations of RAID-5, a quarter of the I/O operations of RAID-6. However, remember that RAID-10 will not improve anything until cache write storage is full. Until then, all writes run at a speed determined by the speed of the server, fabric, and cache storage, but not disk or RAID.
For sequential operations it should be common to have full content of a strip already in storage. We will have to read it anyway to determine what it was before. Otherwise, we do not have the changes to be applied to the parity.
Also, for sequential, there is a large probability that multiple strips in a stride are modified.
Figure 1 RAID-5 write penalty
26411111
RAID-1RAID-6RAID-5Write Parity
Read Parity
Write Data
Read Data
Dirty Strips
Considerations for RAID-6 Availability and Format/Rebuild Performance on the DS5000 3

If there are two strips containing modified data in the stride (Figure 2). We must read both strips, but one read will suffice for the parity strip. After the merging and updating is done, two data strips and the parity are written. That is a total of six operations. RAID-6 would take eight operations to read two dirty strips, read two parity strips, then write the data and parity. RAID-10 will write each of the two dirty strips twice, for a total of four operations. Now RAID-10 takes 67% (rather than 50%) of what RAID-5 requires (and 50% of what RAID-6 requires).
Figure 2 Two stripes being modified
If there are three modified strips in the stride, RAID-10 will take six operations, compared to the eight operations required by RAID-5 (Figure 3).
RAID-6 will read the three clean strips (one of the four white disks in Figure 3 is parity) and generate the correct parity from them and the three dirty strips already in cache write storage. The three reads, writing the three dirty strips, and writing two parity strips total eight operations, the same as RAID-5.
Figure 3 RAID-6 and RAID-5 comparison
If there are four completely rewritten strips, we can read the three unmodified RAID-5 strips and generate new parity (Figure 4). Then we write the four totally changed strips and the updated parity. That is eight operations, the same as RAID-10 and RAID-6.
Figure 4 Four stripes
After that, it is just a matter of how much RAID-10 write penalty you care to see. A RAID-10 array allocated across 14 HDDs will require 14 operations to write seven changed strips.
26411111
RAID-1RAID-6RAID-5Write Parity
Read Parity
Write Data
Read Data
Dirty Strips
48611222
26411111
RAID-1RAID-6RAID-5Write Parity
Read Parity
Write Data
Read Data
Dirty Strips
48611222
68811333
26411111
RAID-1RAID-6RAID-5Write Parity
Read Parity
Write Data
Read Data
Dirty Strips
48611222
68811333
88810434
4 Considerations for RAID-6 Availability and Format/Rebuild Performance on the DS5000

Seven changed data strips require eight operations across eight HDDs for RAID-5 or nine operations across nine HDDs for RAID-6 (Table 1).
RAID-10 is an inferior design for handling sequential write operations.
It is quite probable that multiple strides are associated with a sequential stream and only the most recently used stride is partially full. One would expect to see mostly full stride sequential writes.
For random writes to large logical drives we would expect that it is highly probable that a single strip in a stride is dirty. As indicated in the first data line in the table in Table 1, four RAID-5 operations rather than two RAID-10 operations will be required. However, while it is easy to describe the situation in which all activity is sequential writes, it is not so easy to think of the situation in which there are 100% random writes. There are checkpoints, but that usually happens on very small data sets where misses are rare.
Table 1 RAID comparisons
Best practice and database logs
There is an often-quoted best practice to use RAID-10 for database logs. Since we have found that RAID-5 should require fewer operations to write the same amount of sequential data as RAID-10, we must assume that the recommendation is made because RAID-10 has better availability characteristics than RAID-5 (and RAID-6 was not available when the recommendation was made). Figure 5 shows the databases, the primary log, and the secondary log (another best practice).
Figure 5 Primary and secondary log locations
Dirty strips
Read data Write data Read parity
Write parity
RAID 5 RAID 6 RAID 1
1 1 1 1 1 4 6 2
2 2 2 1 1 6 8 4
3 3 3 1 1 8 8 6
4 3 4 0 1 8 8 8
5 2 5 0 1 8 8 10
6 1 6 0 1 8 8 12
7 0 7 0 1 8 N/A 14
Data Base
Secondary Log
Primary Log
Considerations for RAID-6 Availability and Format/Rebuild Performance on the DS5000 5

Assume that we are following best practices all the way, separating HDDs and fabric, using the proper number of HDDs for an array, and so on. Then we see that RAID-1 everywhere will cause a large increase in the number of drives and overall cost. Despite all the warnings, we use RAID-5.
In Figure 5 on page 5 we get performance on the primary and secondary logs. Databases require fewer HDDs. That is good.
Single drive failure
Let us further assume that a disk belonging to the log fails to function properly (the red disk in Figure 6). We are still in pretty good shape with RAID-5. Data from the seven good drives in the array will be used to rebuild the failed HDD on a spare disk. If there is no spare disk, you can put a new disk into the slot that formerly contained the failed HDD and the rebuild process will begin. This is good because you will not have to move the data back to the slot where the drive failed.
Figure 6 Single drive failure
Applications continue normally. If there is a read miss to data on the failed drive, the other seven disks are used to recreate data. When data is destaged, it will be done by processing data and parity so that later read misses will work.
Rebuild for RAID-10 arrays would just use the survivor of the mirrored pair to handle the read/write requests. It would also copy data to the other part of a mirrored pair reading data from the survivor and writing to the spare (or the drive inserted into the failed slot).
Data Base
Secondary Log
Primary Log
6 Considerations for RAID-6 Availability and Format/Rebuild Performance on the DS5000

A second HDD is lost in the primary log array
Another disk failed (see the two red disks in Figure 7). It failed on the same RAID-5 array as the first failed disk. We can no longer access the log. Of course, since we have an alternate log, we have not lost any data. In fact, the application might run with a little bit better performance since prior to the second failure rebuild load was competing with the primary log function for the HDDs. After the second failure, the DBMS gets an I/O error and stops trying to access the primary log. Database changes are still written to the alternate log.
Figure 7 Multiple disk failure
The DBMS should be waiting for you to state where the new primary log is. Once the new primary is found, it is time to switch the secondary and get back to two log files.
Two more HDDs fail
We just lost two more drives, one after another, in the array that has the alternate log (the red disks in Figure 8). We might still run read requests, but I would not expect a DBMS to allow writes if there is not a log available. What do we do?
The database is still good. You can do an image copy of the databases so that the current logs are no longer needed. Create a fresh set of logs and bring up the applications. This is not ideal, but is better than losing data.
Figure 8 Four disk failure
If one of the HDDs on a database fails, it just makes the image copy run a bit slower.
Data Base
Primary Log
Secondary Log
Data Base
Secondary Log
Primary Log
Considerations for RAID-6 Availability and Format/Rebuild Performance on the DS5000 7

We have had five HDDs fail in exactly the wrong places in a very short time period and have not lost data (red disks in Figure 9). It might make sense to use RAID-10 for something other than a DBMS log. RAID-10 has nice availability characteristics, but maybe the money for additional drives should be spent for an application like Microsoft® Exchange, which does a lot of small block random operations and will benefit from RAID-10 performance. Also, MS® Exchange is a quite visible product.
Figure 9 Five-disk failure
In review
Salient points so far are:
� For RAID-10, things are pretty simple. An even number of disks are linked together as mirrored pairs. A write to a disk results in another write to the mirrored pair. The content of one disk is always the same as its mirror. It takes 14 drives to hold seven drives’ worth of data. What we get for the extra disk space requirements is better random read and write performance and less probability of data loss when compared to RAID-5. If there is a disk failure, rebuild is a matter of copying data from the survivor of the pair to a spare disk.
� RAID-5 is the most efficient way to store and protect data. Eight disks are required in order to store seven disks’ worth of data. RAID-5 sequential performance is better than RAID-10, random performance worse (as we approach saturation). If any two drives in an array fail, data is lost. Rebuilding a failed drive is a matter of merging data from all of the surviving devices onto a spare disk.
� RAID-6 has near-RAID-5 performance for random and sequential operations. It is near-RAID-5 in terms of space efficiency (RAID-6 requires nine drives to store seven drives of data). A random write workload will reach saturation at a lower level than RAID-5 or RAID-1 and sequential writes are slightly inferior to RAID-5 (and superior to RAID-1). Availability is outstanding since three disks in the same array must fail in order to have data loss.
Probability of data loss
While we could use the logic in Figure 1 on page 3 to estimate the performance impact of the different RAID organizations, selecting the proper RAID should also include some quantification of the change in availability characteristics. This is not easy. There are many variables involved, the formulae are complex, and the accuracy of vendor availability claims is always questioned.
Data Base
Secondary Log
Primary Log
8 Considerations for RAID-6 Availability and Format/Rebuild Performance on the DS5000
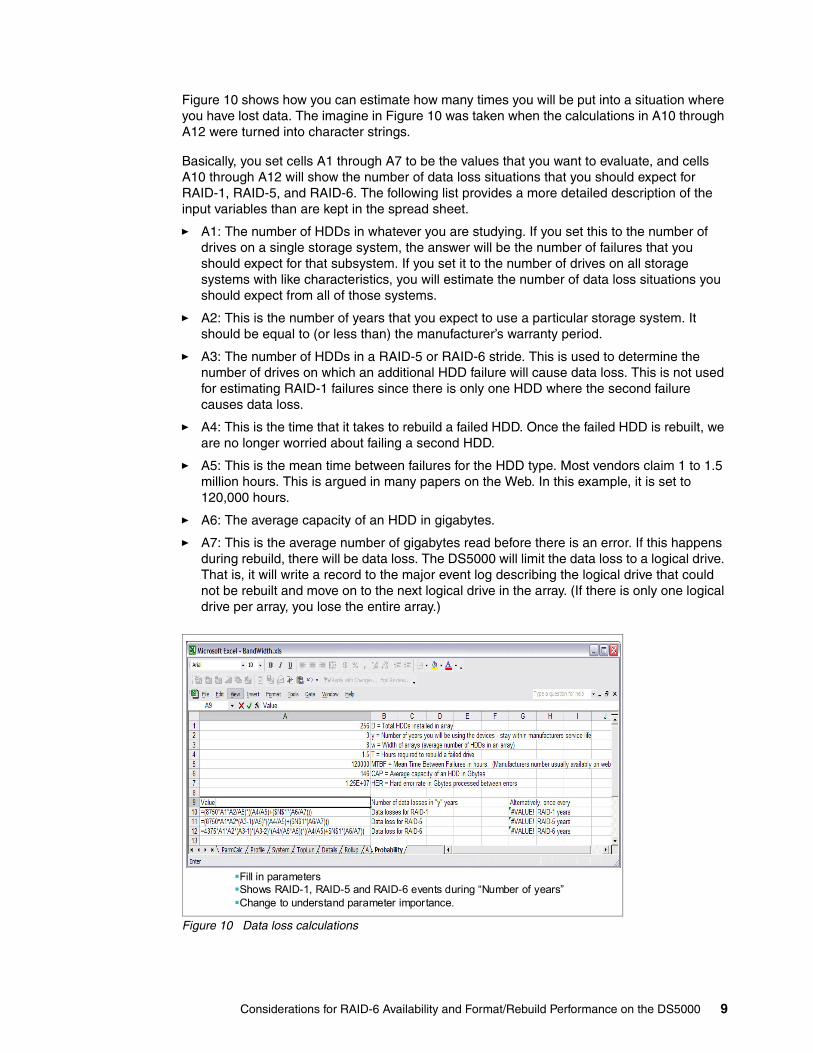
Figure 10 shows how you can estimate how many times you will be put into a situation where you have lost data. The imagine in Figure 10 was taken when the calculations in A10 through A12 were turned into character strings.
Basically, you set cells A1 through A7 to be the values that you want to evaluate, and cells A10 through A12 will show the number of data loss situations that you should expect for RAID-1, RAID-5, and RAID-6. The following list provides a more detailed description of the input variables than are kept in the spread sheet.
� A1: The number of HDDs in whatever you are studying. If you set this to the number of drives on a single storage system, the answer will be the number of failures that you should expect for that subsystem. If you set it to the number of drives on all storage systems with like characteristics, you will estimate the number of data loss situations you should expect from all of those systems.
� A2: This is the number of years that you expect to use a particular storage system. It should be equal to (or less than) the manufacturer’s warranty period.
� A3: The number of HDDs in a RAID-5 or RAID-6 stride. This is used to determine the number of drives on which an additional HDD failure will cause data loss. This is not used for estimating RAID-1 failures since there is only one HDD where the second failure causes data loss.
� A4: This is the time that it takes to rebuild a failed HDD. Once the failed HDD is rebuilt, we are no longer worried about failing a second HDD.
� A5: This is the mean time between failures for the HDD type. Most vendors claim 1 to 1.5 million hours. This is argued in many papers on the Web. In this example, it is set to 120,000 hours.
� A6: The average capacity of an HDD in gigabytes.
� A7: This is the average number of gigabytes read before there is an error. If this happens during rebuild, there will be data loss. The DS5000 will limit the data loss to a logical drive. That is, it will write a record to the major event log describing the logical drive that could not be rebuilt and move on to the next logical drive in the array. (If there is only one logical drive per array, you lose the entire array.)
Figure 10 Data loss calculations
System Storage Technical Users Group Conference
Fill in parameters Shows RAID-1, RAID-5 and RAID-6 events during “Number of years”Change to understand parameter importance.
Considerations for RAID-6 Availability and Format/Rebuild Performance on the DS5000 9
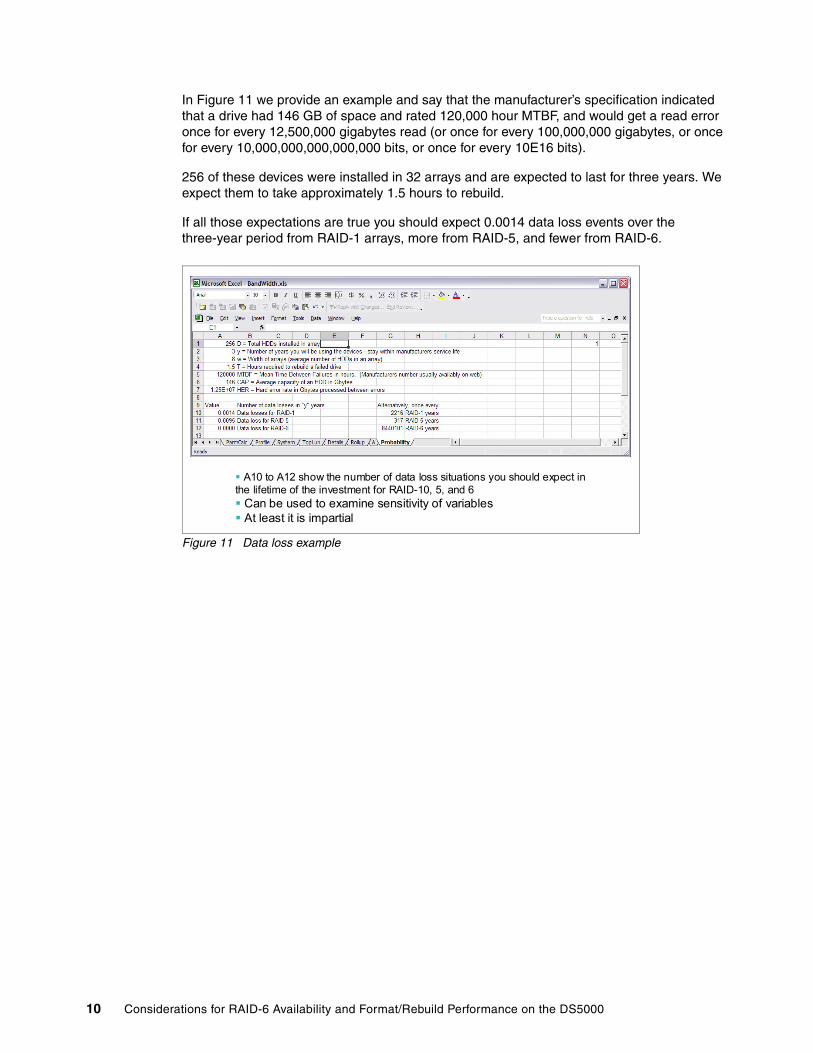
In Figure 11 we provide an example and say that the manufacturer’s specification indicated that a drive had 146 GB of space and rated 120,000 hour MTBF, and would get a read error once for every 12,500,000 gigabytes read (or once for every 100,000,000 gigabytes, or once for every 10,000,000,000,000,000 bits, or once for every 10E16 bits).
256 of these devices were installed in 32 arrays and are expected to last for three years. We expect them to take approximately 1.5 hours to rebuild.
If all those expectations are true you should expect 0.0014 data loss events over the three-year period from RAID-1 arrays, more from RAID-5, and fewer from RAID-6.
Figure 11 Data loss example
A10 to A12 show the number of data loss situations you should expect in the lifetime of the investment for RAID-10, 5, and 6 Can be used to examine sensitivity of variables At least it is impartial
10 Considerations for RAID-6 Availability and Format/Rebuild Performance on the DS5000

Estimating RAID-6 performance
It is possible to estimate the additional operations required if you change from the current use of RAID to RAID-6. Figure 12 shows information from the DS4000 Performance Monitor moved to a spreadsheet. Read misses for LUN2 were calculated as follows.
There were 174.1 reads and writes per second (cell f3). 56.9% of them were reads (cell c3). That works out to 99.06 reads per second. 24.7% of the read operations were found in cache storage (cell d3), and there was no need to read from the HDDs. This means that for 75.3% of the reads (74.6 operations per second) a single operation would be executed to read from one of the HDDs in the array.
Figure 12 Changing to RAID 6
If 56.9% of the operations are reads, 43.1% must be writes. If 75.3% of them will end up written to the HDDs, we must do 56.5 write operations per second to the HDDs.
No matter what the RAID, we will read from HDDs 74.6 times per second. RAID-5 is currently used, so each of the 56.5 write operations will take four operations (or less) for a total of 226.0 operations for writes. Reads and writes should cause 300.6 HDD operations per second. If we use RAID 6 for LUN2, there will be an additional two operations per write miss, 113.0 additional operations per second. We would require 413.6 RAID-6 operations per second rather than 300.6.
Cell S2 calculates the sum or current HDD operations for all logical drives at 9:30 in the morning (sum(L2:L8)). Cell T2 gives the RAID-6 estimate (sum(m2:m8)). Since the data is sorted by logical drive within the time of day, we can copy cells S2:T8 and paste them over S9:TLLL (where LLL is the last row) and calculate an estimate of total HDD operations for each time interval.
To finish, copy columns S and T. Paste special values to the same locations. Sort everything on column S in descending order. All blank rows will sort to the last rows of the work sheet. Delete them. Sort back to time ascending and you have the data needed for a chart.
Columns A-F from DS4000 Performance Monitor On line 3…
– ReadMiss = IO/Sec* (Read%*(100-ReadHit%)/10000 = 174.1*56.9*(100-23.7)/10000 = 74.6
– WriteMiss = IO/Sec* ((100-Read%)*(100-ReadHit))/10000 = 174.1*(100-56.9)*(100-23.7)/10000 = 56.5
– Column K based on Excel LOOKUP of profile data
– HDD IO = ReadMiss + (1, 2, 4, 6) * WriteMiss (if RAID-0, 10, 5, or 6) = 74.6 + (4 * 56.5) = 300.6
– R6 Ops = ReadMiss + 6*WriteMiss = 74.6 + (6 * 56.5) = 413.6
Sum interval measurement for all logical drives in an interval
Considerations for RAID-6 Availability and Format/Rebuild Performance on the DS5000 11

In Figure 13 the blue line estimates the number of operations currently taking place on all HDDs. The red line indicates the expected HDD operations if RAID-6 was used. Remember, as long as there is enough HDD performance to stay ahead of demand, applications find that write operations perform like they were going to solid state devices. Reads will see contention on the HDDs and take slightly longer at high levels, but write operations are data moved from memory on the server to memory on the storage system.
Figure 13 Additional I/O results
A quick evaluation would be to divide the HDD operations per second and compare that to the HDD rotations per second. The example above indicated that there were 15 HDDs in the configuration used for data. That is a total capability of 3,750 rotations per second. The estimate assumed that all writes were random (six operations on RAID-6) and that we could not come up with more than 1,200 HDD operations per second. I think RAID-6 would not have much of a performance penalty.
Lab rebuild measurements
The system that we used to measure rebuild times contained a DS5300. For marketing, it makes sense to work on the big machine first. Our DS5300 had a 16 GB cache and 16 ports rated at 4 GBit each. Our configuration had no server, so there was 0 activity on the 16 ports. When doing formats and rebuilds, try to write data on the HDDs rather than keeping things in storage. Some cache storage is used to support stride writes, but it is well below the minimum storage sold on a DS5000. There is a limit of 30 HDDs for a RAID-5 or RAID-6 array, so we used two EXP5000s with 32 HDDs containing 300 GB each and spinning 15,000 times per second.
Additional I/O for RAID-6 (assumed 100% random)
0100200300400500600700800900
100011001200130014001500160017001800
9:0
0
10
:05
11
:10
12
:15
13
:20
14
:25
15
:30
16
:35
17
:40
18
:45
19
:50
20
:55
22
:00
23
:05
0:1
0
1:1
5
2:2
0
3:2
5
4:3
0
5:3
5
6:4
0
7:4
5
8:5
0
Time
Op
era
tio
ns
/Sec
on
d
Sum HDD
Sum R-6
V
•15K RPM is 250 RPSecond, 15 HDDs handle 3750 RPS
12 Considerations for RAID-6 Availability and Format/Rebuild Performance on the DS5000

There were no servers, there was no application activity to slow down the rebuilds and formats. We struggled for some time thinking about how we would define workload types and quantify levels of activity so that our measurements could be compared to actual installation activity. Some the factors in our decision were:
� The amount of data and documentation to describe environments would be excessive
� The DS5000 allows the priority of format, rebuild, and volume copy to be changed to one of 5 levels. If there is contention, priority can be adjusted through the GUI so that applications (or the copy functions) can run faster.
� Five times an excessive amount of data is a really excessive amount of data.
We decided to limit our efforts to environments without servers.
Configuration
Our configuration is:
� DS5300 – 16 GB cache – 16 channels
� 2 x EXP8100: 32 x 300 GB, 15K RPM HDDs
Format array on 300 GB drives
Figure 14 shows the measurements of elapsed time required to format full volume arrays on 300 GB HDDs. The minimum RAID-10 array is two drives. We see that the blue line is at about 1.9 hours when the number of HDDs is 2. The minimum RAID-5 HDDs is 3 and for RAID-6 it is 5. Basically, Figure 14 shows that there is not much difference in the time required to format arrays caused by the type of RAID chosen or the number of HDDs.
Figure 14 Format measurement
0
0.25
0.5
0.75
1
1.25
1.5
1.75
2
2.25
2.5
2.75
3
0 1 2 3 4 5 6 7 8 9 10 11 12 13 14 15 16 17 18 19 20 21 22 23 24 25
Number of HDDs
Ela
pse
d H
ours
RAID-1RAID-5RAID-6
Considerations for RAID-6 Availability and Format/Rebuild Performance on the DS5000 13

Formatting application megabytes
Figure 15, however, shows that the amount of storage formatted is sensitive to RAID. If there are D drives in an array, RAID-10 uses .5*D for data. RAID-5 uses D-1 and RAID-6 uses D-2. The effective data rate shows a large difference in performance.
Figure 15 Sensitivity of formatting
Rebuild array on 300 GB drives
Figure 16 shows more examples of rebuild times. It shows the time required from a minimum configuration (two RAID-10 disks, three RAID-5 disks, or five RAID-6 disks) to 24 drives.
Figure 16 Rebuild time examples
The black line is RAID-6 handling two failed drives. While the comparison to the single failure rebuild is impressive, it makes the other lines appear closer in terms of rebuild time due to scaling. Figure 17 is the same chart without the double failure RAID-6 data.
0
100
200
300
400
500
600
700
800
0 1 2 3 4 5 6 7 8 9 10 11 12 13 14 15 16 17 18 19 20 21 22 23 24 25
Number of HDDs
Me
gab
yte
s/S
ec
on
d
RAID-1RAID-5
RAID-6
© 2008 IBM C ti
0
0.5
1
1.5
2
2.5
3
3.5
4
4.5
5
5.5
6
0 1 2 3 4 5 6 7 8 9 10 11 12 13 14 15 16 17 18 19 20 21 22 23 24 25
Number of HDDs
Ela
ps
ed
Ho
urs
RAID-1RAID-5RAID-6RAID-6(2)
RAID-6(2) = RAID-6 with 2 failures
14 Considerations for RAID-6 Availability and Format/Rebuild Performance on the DS5000

Rebuild array on 300 GB drives (rescaled)
All RAIDs took about the same amount of time for a minimum configuration. RAID-5 and RAID-6 increase from the 1.4 hours required for a minimum rebuild. Since the number of operations to format a 300 GB drive is fixed, the elongation is not because of increased HDD contention. RAID-5 or RAID-6 rebuild times increase due to contention in the fabric between the controllers and the HDDs.
With the rescaled graph (Figure 17) we can see that it takes about 1.8 hours to do 16 drives and 2.6 hours to do 24. These are modest increases. During the 1.4, 1.8, or 2.6 hours applications are running with the correct data and the amount of contention is what the priority setting for the logical drive allows.
Figure 17 Rescaling
RAID-10 has a nearly constant rebuild time from two HDDs to 24. This makes sense. No matter how many HDDs there are in a RAID-10 array, rebuild always means copying the surviving HDD of a pair to a fresh disk. The fresh disk can be a global spare, a spare assigned to the volume group, or a new drive placed into the slot where the failed drive was. The time to rebuild 300 GB drives is modest. Most of the data we see when analyzing account data is on arrays containing about eight HDDs. It is hard to get excited about the difference in rebuild times at that level. We do not remember seeing any arrays that used more than a drawer of drives and it is hard to argue the 22% difference in 1.8 versus 1.4 hours. With 4 GBit DS5000 technology there is much less increase in the time to rebuild a large array. It is much more palatable to configure large arrays and let the system worry about balancing.
Other lab measurements
A while after the rebuild measurements were completed, we had a server installed and ran AIX® measurements of RAID-6 (and RAID-10 and RAID-5). This section presents those measurements.
0
0.2
0.4
0.6
0.8
1
1.2
1.4
1.6
1.8
2
2.2
2.4
2.6
2.8
3
0 1 2 3 4 5 6 7 8 9 10 11 12 13 14 15 16 17 18 19 20 21 22 23 24 25
Number of HDDs
Ela
ps
ed
Ho
urs
RAID-1
RAID-5
RAID-6
Considerations for RAID-6 Availability and Format/Rebuild Performance on the DS5000 15

Random read misses on 256 HDDs (15 K RPM)
There is not much difference for RAID performance when doing reads. The little bit of difference at the very high end of the curve is most likely because RAID-1 can find the data in two places (Figure 18). The licensed internal code reads from the high density or single density drive that is not busy, but this only pays off at high levels of activity (where one of the two HDDs is busy with another request). If you do not want operations that take more than 20 milliseconds to complete, this is a tie.
Figure 18 Random read misses
Random write misses on 256 HDDs (15 K RPM)
Graphs of random write performance invariably cause questions. All write operations go directly to write cache storage. As long as the HDDs can keep up with the destaging activity, write operates at the speed of cache and server fabric and memory. At about 10,000 operations per second, we are doing 60,000 operations per second to the RAID-6 HDDs. I/O operations take longer and we cannot free cache write storage as quickly (Figure 19 on page 17). This means that cache write storage is being used for operations in progress. Additional write operations cannot find cache write storage to do the write operation. We could attempt to do more and more work, but the HDDs are already fully utilized. Any additional work just means higher service time. RAID-10 does not do read-write sequences like RAID-5 and RAID-6 do. The measurement looks more like the classic knee-shaped curve.
0
4
8
12
16
20
24
28
32
36
40
0 10000 20000 30000 40000 50000 60000 70000 80000
Operations per second
Mill
isec
ond
per
Op
erat
ion
RAID-6
RAID-5
RAID-10
Little difference until 60,000 operations/Second Read from either primary or alternate
16 Considerations for RAID-6 Availability and Format/Rebuild Performance on the DS5000
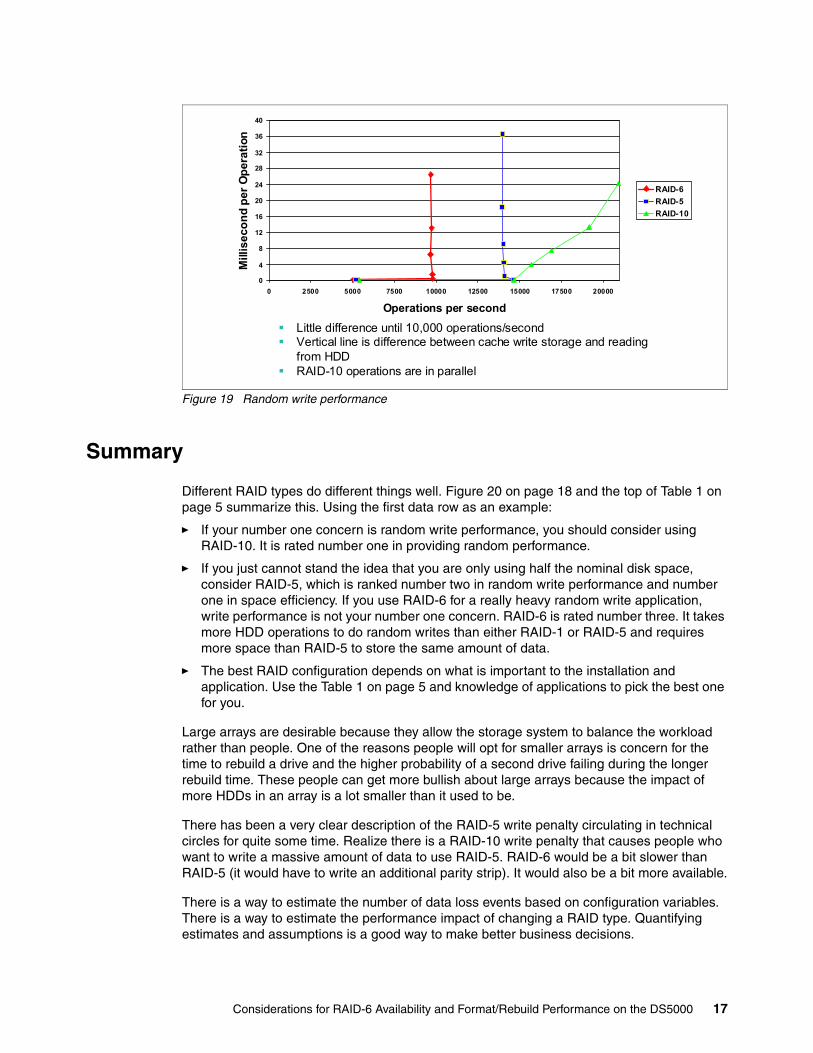
Figure 19 Random write performance
Summary
Different RAID types do different things well. Figure 20 on page 18 and the top of Table 1 on page 5 summarize this. Using the first data row as an example:
� If your number one concern is random write performance, you should consider using RAID-10. It is rated number one in providing random performance.
� If you just cannot stand the idea that you are only using half the nominal disk space, consider RAID-5, which is ranked number two in random write performance and number one in space efficiency. If you use RAID-6 for a really heavy random write application, write performance is not your number one concern. RAID-6 is rated number three. It takes more HDD operations to do random writes than either RAID-1 or RAID-5 and requires more space than RAID-5 to store the same amount of data.
� The best RAID configuration depends on what is important to the installation and application. Use the Table 1 on page 5 and knowledge of applications to pick the best one for you.
Large arrays are desirable because they allow the storage system to balance the workload rather than people. One of the reasons people will opt for smaller arrays is concern for the time to rebuild a drive and the higher probability of a second drive failing during the longer rebuild time. These people can get more bullish about large arrays because the impact of more HDDs in an array is a lot smaller than it used to be.
There has been a very clear description of the RAID-5 write penalty circulating in technical circles for quite some time. Realize there is a RAID-10 write penalty that causes people who want to write a massive amount of data to use RAID-5. RAID-6 would be a bit slower than RAID-5 (it would have to write an additional parity strip). It would also be a bit more available.
There is a way to estimate the number of data loss events based on configuration variables. There is a way to estimate the performance impact of changing a RAID type. Quantifying estimates and assumptions is a good way to make better business decisions.
0
4
8
12
16
20
24
28
32
36
40
0 2500 5000 7500 10000 12500 15000 17500 20000
Operations per second
Mill
isec
on
d p
er O
per
atio
n
RAID-6
RAID-5
RAID-10
Little difference until 10,000 operations/second Vertical line is difference between cache write storage and reading
from HDD RAID-10 operations are in parallel
Considerations for RAID-6 Availability and Format/Rebuild Performance on the DS5000 17

Figure 20 Summary
Reminder
The information in this redpaper is provided by IBM on an "AS IS" basis. IBM makes no warranties or representations with respect to the content hereof and specifically disclaims any implied warranties of merchantability or fitness for any particular purpose. IBM assumes no responsibility for any errors that may appear in this document. The information contained in this document is subject to change without any notice. IBM reserves the right to make any such changes without obligation to notify any person of such revision or changes. IBM makes no commitment to keep the information contained herein up to date.
The team that wrote this IBM Redpaper publication
This paper was produced by a team of specialists working at the International Technical Support Organization, Tucson Center:
Alex Osuna is a Project Leader at the International Technical Support Organization, Tucson Center. He writes extensively and teaches IBM classes worldwide on all areas of storage. Before joining the ITSO three years ago, Alex worked as a Principal Systems Engineer for the Tivoli® Western Region. Alex has over 30 years of experience in the IT industry, focused mainly on hardware and software storage. He holds certifications from IBM, Microsoft, RedHat, and the Open Systems Group.
Siebo Friesenborg is an Advanced Technical Support (ATS) representative for Storage in America’s Group. Siebo has been writing technical bulletins, white papers, and IBM product manuals about disk performance for more than 25 years. He holds a degree in Mechanical Engineering from the University of Delaware (class of 1965) and has been with IBM since then. His career with IBM has taken him from the Wilmington, Delaware, sales office to Philadelphia, Gaithersburg, Belgium, Dallas, and Tucson.
Mike Roll is a Storage Performance Engineer from Tucson, Arizona. As a member of the Modular Performance Organization, Mike is currently an Engineer doing performance evaluation for IBM DS4000, DS5000, GAM, and DR550 products. Mike has published many
4 GBit fabric is very fast. For HDD intensive workloads, there is not much increase in time due to more load on the fabric.
For sequential write workloads, RAID-5 and RAID-6 require fewer HDD operations than RAID-10 when doing stride writes.
An expected number of failures can be estimated for differences in configuration values (RAID, array size, HDD characteristics, etc.)
Increase in loading caused by more RAID-6 operations for random writes can be estimated.
321Space efficiency
213Availability
321Sequential write performance
132Random write performance
RAID-10RAID-6RAID-5Factor
18 Considerations for RAID-6 Availability and Format/Rebuild Performance on the DS5000

storage performance presentations and white papers along with the IBM Storage Performance Primer. Prior to working for IBM, he had over 20 years of IT data management experience, having served as the Data Architect at Motorola for 10 years, and has held data management positions at several other Fortune 100 companies.
Thanks to the following people for their contributions to this project:
Bruce AllworthIBM Advanced Technical Support (ATS)
Al WatsonIBM Advanced Technical Support (ATS)
Gene CullumIBM Advanced Technical Support (ATS)
Dan RiedelIBM Americas Advanced Technical Support (ATS)
Kevin CummingsIBM Americas Advanced Technical Support (ATS)
Dr. Olga YiparakiIBM Systems and Technology Group, Integrated Systems Development Storage Performance Modeling, Mathematical Modeling Infrastructure Architect
Considerations for RAID-6 Availability and Format/Rebuild Performance on the DS5000 19

20 Considerations for RAID-6 Availability and Format/Rebuild Performance on the DS5000
Notices
This information was developed for products and services offered in the U.S.A.
IBM may not offer the products, services, or features discussed in this document in other countries. Consult your local IBM representative for information on the products and services currently available in your area. Any reference to an IBM product, program, or service is not intended to state or imply that only that IBM product, program, or service may be used. Any functionally equivalent product, program, or service that does not infringe any IBM intellectual property right may be used instead. However, it is the user's responsibility to evaluate and verify the operation of any non-IBM product, program, or service.
IBM may have patents or pending patent applications covering subject matter described in this document. The furnishing of this document does not give you any license to these patents. You can send license inquiries, in writing, to: IBM Director of Licensing, IBM Corporation, North Castle Drive, Armonk, NY 10504-1785 U.S.A.
The following paragraph does not apply to the United Kingdom or any other country where such provisions are inconsistent with local law: INTERNATIONAL BUSINESS MACHINES CORPORATION PROVIDES THIS PUBLICATION "AS IS" WITHOUT WARRANTY OF ANY KIND, EITHER EXPRESS OR IMPLIED, INCLUDING, BUT NOT LIMITED TO, THE IMPLIED WARRANTIES OF NON-INFRINGEMENT, MERCHANTABILITY OR FITNESS FOR A PARTICULAR PURPOSE. Some states do not allow disclaimer of express or implied warranties in certain transactions, therefore, this statement may not apply to you.
This information could include technical inaccuracies or typographical errors. Changes are periodically made to the information herein; these changes will be incorporated in new editions of the publication. IBM may make improvements and/or changes in the product(s) and/or the program(s) described in this publication at any time without notice.
Any references in this information to non-IBM Web sites are provided for convenience only and do not in any manner serve as an endorsement of those Web sites. The materials at those Web sites are not part of the materials for this IBM product and use of those Web sites is at your own risk.
IBM may use or distribute any of the information you supply in any way it believes appropriate without incurring any obligation to you.
Information concerning non-IBM products was obtained from the suppliers of those products, their published announcements or other publicly available sources. IBM has not tested those products and cannot confirm the accuracy of performance, compatibility or any other claims related to non-IBM products. Questions on the capabilities of non-IBM products should be addressed to the suppliers of those products.
This information contains examples of data and reports used in daily business operations. To illustrate them as completely as possible, the examples include the names of individuals, companies, brands, and products. All of these names are fictitious and any similarity to the names and addresses used by an actual business enterprise is entirely coincidental.
COPYRIGHT LICENSE:
This information contains sample application programs in source language, which illustrate programming techniques on various operating platforms. You may copy, modify, and distribute these sample programs in any form without payment to IBM, for the purposes of developing, using, marketing or distributing application programs conforming to the application programming interface for the operating platform for which the sample programs are written. These examples have not been thoroughly tested under all conditions. IBM, therefore, cannot guarantee or imply reliability, serviceability, or function of these programs.
© Copyright International Business Machines Corporation 2009. All rights reserved.Note to U.S. Government Users Restricted Rights -- Use, duplication or disclosure restricted by GSA ADP Schedule Contract with IBM Corp. 21

®
Redpaper™
This document REDP-4484-00 was created or updated on March 30, 2010.
Send us your comments in one of the following ways:� Use the online Contact us review Redbooks form found at:
ibm.com/redbooks� Send your comments in an email to:
[email protected]� Mail your comments to:
IBM Corporation, International Technical Support OrganizationDept. HYTD Mail Station P0992455 South RoadPoughkeepsie, NY 12601-5400 U.S.A.
Trademarks
IBM, the IBM logo, and ibm.com are trademarks or registered trademarks of International Business Machines Corporation in the United States, other countries, or both. These and other IBM trademarked terms are marked on their first occurrence in this information with the appropriate symbol (® or ™), indicating US registered or common law trademarks owned by IBM at the time this information was published. Such trademarks may also be registered or common law trademarks in other countries. A current list of IBM trademarks is available on the Web at http://www.ibm.com/legal/copytrade.shtml
The following terms are trademarks of the International Business Machines Corporation in the United States, other countries, or both:
The following terms are trademarks of other companies:
Microsoft, MS, and the Windows logo are trademarks of Microsoft Corporation in the United States, other countries, or both.
AIX®DS4000®
IBM®Redbooks (logo) ®
Other company, product, or service names may be trademarks or service marks of others.
22 Considerations for RAID-6 Availability and Format/Rebuild Performance on the DS5000