considerations about the “ict price data methodology”
TRANSCRIPT
Considerationsaboutthe“ICT
pricedatamethodology”

Special Report
2015
PRODUCED BY Technical
Advisory to the board
(ATC), International
Advisory (AIN),
Superintendency of
Competition (SCP) and
Superintendency of
Planning and Regulation
(SPR)
Considerations about the “ICT
pricedatamethodology”, input of
the “MeasuringtheInformation
SocietyReport”
National Agency of Telecommunications
SAUS Quadra 06 Blocos C, E, F e H
CEP 70070-940
Brasília/DF
Phone:(061) 2312-2000
Teams: ATC, AIN, SCP e SPR
TECHNICAL ADVISORY TO THE BOARD (ATC)
INTERNATIONAL ADVISORY (AIN)
SUPERINTENDENCY OF COMPETITION (SCP)
SUPERINTENDENCY OF PLANNING AND REGULATION (SPR)
This document aims to summarize proposals for the improvement
of the “ICT price data methodology”, input of the “Measuring the
Information Society Report”, published annually by the
International Telecommunication Union (ITU).

Summary
Introduction ...................................................................................................................................................... 3
ICT Price Data Methodology ....................................................................................................................... 4
Considerations about the mobile cellular sub basket ................................................................. 4
About the rules applied on collecting mobile cellular prices .....................................................12
About the tax burden disclosure ............................................................................................................16

2
Co
nsi
de
rati
on
s a
bo
ut
the
“IC
T p
rice
da
ta m
eth
od
olo
gy
”
Charts
Chart 1 – ITU mobile-cellular sub-basket ............................................................................................. 5
Chart 2 - Average Gross Domestic Product .......................................................................................... 6
Chart 3 - Mobile access and GDP per capita ........................................................................................ 8
Chart 4 - Competition and mobile affordability ............................................................................... 10
Figures
Figure 1 - Set of plans that fit the methodology ............................................................................... 12
Figure 2 - Set of plans that a user would subscribe ........................................................................ 12
Figure 3 - No intersection between methodology and call distribution ................................ 13
Figure 4 - Intersection between methodology and distribution ............................................... 13
Figure 5 - Best plans are not in the intersection .............................................................................. 14
Figure 6 - Best plan for the methodology in the intersection .................................................... 14
Figure 7 - Best plan for the user is in the intersection. ................................................................. 15

INTRODUCTION
This document aims to summarize proposals for the improvement of the “ICT
price data methodology”, input of the “Measuring the Information Society Report”,
published annually by the International Telecommunication Union (ITU).
According to the mentioned report, the ICT Price Basket (IPB) is a composite
basket that includes three price sets, referred to as sub-baskets: the fixed-telephone,
mobile-cellular and fixed-broadband sub-baskets. In brief summary, the IPB is the
value calculated from the sum of the price of each sub-basket (in USD) as a percentage
of a country´s monthly GNI per capita, divided by three.
This document outlines suggestions for the improvement of IPB basket
methodology, particularly the mobile-cellular sub-basket and the rules applied in
collecting mobile-cellular prices.
Thus, the collection of price data from ITU Member States is object of
considerations as also the tax burden disclosure.

4
Co
nsi
de
rati
on
s a
bo
ut
the
“IC
T p
rice
da
ta m
eth
od
olo
gy
”
ICT PRICE DATA METHODOLOGY
Considerations about the mobile cellular sub basket
Measuring and comparing prices from different countries is a complex task.
Different manners of offering and billing services for distinct user’s profiles, as well as
the social and economic characteristics of each region impose great challenges to the
comparison of the level of economic accessibility to telecommunications services in the
countries.
The “Measuring the Information Society Report”, annually released by ITU,
currently in its 6th edition, has consolidated itself as the global reference for
assessment and indexation of countries in terms of infrastructure and use of ICTs
development.
For the collection and processing of data, ITU adopts methodologies discussed
and agreed upon internationally. As with any method, the choice of unique standards is
critical aspect for the comparability and the conception of credible and representative
results of the reality.
However, the chosen baskets used to measure the prices of telephone services,
present aspects that deserve some consideration by the Brazilian government,
especially the mobile-cellular phone sub-basket.
Admittedly, the chosen sub-basket for the pricing of mobile access is strongly
inspired, with some few adjustments, in the methodology provided by the
Organization for Economic Cooperation and Development (OECD), revised in
2009.
The mobile-cellular sub-basket refers to the price of a standard basket of
mobile monthly usage for 30 outgoing calls per month (on-net, off-net to a fixed line
and for peak and off-peak times) in predetermined ratios, plus 100 SMS messages. It is
calculated as a percentage of a country´s average monthly GNI per capita, and also
presented in USD and PPP$.
The chart bellow summarizes the mobile-cellular phone sub-basket.

Chart 1 – ITU mobile-cellular sub-basket
Indeed, as is clear from the explanatory document on the method, the OECD
developed a set of metrics for comparing the retail prices of services, in order to
evaluate spending on telecommunications consumers and companies of OECD member
states.
A point of concern already emerge. The method of the OECD, developed in
conjunction with the Teligen advice and the support of operators and regulators,
created baskets with patterns of consumption of different users, but naturally with a
restricted view to the reality of 34 members of the Organization.
In absolute terms, the number of OECD countries (34) is not representative of
the global context. The ITU, for example, has a membership of 193 countries, besides
from having hundreds of representatives from the private sector and academic
institutions.
Additionally, and an even more sensitive, the socioeconomic status of the OECD
countries is somewhat peculiar, given the global average. Briefly, taking the wealth
degree as a reference, it is observed that the simple average of the gross domestic
product of OECD member countries is well above the global average, as illustrated in
the chart below.

6
Co
nsi
de
rati
on
s a
bo
ut
the
“IC
T p
rice
da
ta m
eth
od
olo
gy
”
Chart 2 - Average Gross Domestic Product
Taking as a basis for comparison of different developing economies combined,
the difference becomes even more evident, the average GDP of the OECD countries is
higher in these cases in the proportion of 3,5 or even 20 times.
Therefore, it is intuitive to recognize that any methodology inspired by the
socio-economic reality of the OECD, once extended to the global comparability may
produce distorted results if not properly adapted.
Resuming the issue of baskets, ITU adopts the first package of the OECD sub-
baskets range, arguing that this is the entry level and of lower utilization:
“The mobile-cellular sub-basket is largely based on, but does not entirely
follow, the 2009 methodology of the OECD low-user basket, which is the entry-
level basket with the smallest number of calls included (OECD, 2010b). […].
The basket gives the price of a standard basket of mobile monthly usage in
USD determined by OECD for 30 outgoing calls per month in predetermined
ratios plus 100 SMS messages”.
[Measuring the Information Society Report 2014]
Even if the OECD mobile sub-baskets methodology provides coverage of a
representative bundled price, so as to allow the lower cost package is selected for each
operator, this does not imply that the package range defined for the OECD members is
necessarily representative of the rest of the world. And as for the economic data
mentioned here, they actually tend to be quite different.
It is worth mentioning that the OECD standard mobile basket methodology,
referenced by the ITU in its 2009 version of the report, had not suspended its
development.
As can be observed in the Organization's website1, the baskets are routinely
updated as the dynamic change of use of telecommunications patterns. Even the OECD
1 http://www.oecd.org/sti/broadband/price-baskets.htm

mobile sub-baskets, according to available data of 2012, have been modified to
encompass multimedia messages and a specific prepaid sub-basket profile, which is
different from the sub-basket considered by the ITU as appropriate to the prepaid offer.
Still, it is mentioned in the OECD website that more information on the baskets
are provided by Teligen company, today part of Strategy Analytics consultancy. The
company keeps updating and quarterly disclosures the results of comparisons, though,
with access available only to their clients.
In short, on the issue of mobile-cellular sub-basket inspired by the 2009
OECD method and still used as standard by the ITU comparability, Anatel believes
that it is not the most updated, nor representative of the global context. Anatel
also believes that ITU, legitimized by the representation of 193 member states and
supported by technical expertise (academia, policy makers, operators and regulators)
meets the necessary and sufficient conditions to define a more appropriate standard of
comparison, updated and representative of the global reality.
Besides, having set the consumption pattern sub-basket, ITU sub-basket
methodology defines what will be considered pre-paid billing plans, based upon the
premise that the pre-paid offering conditions are the only options to low-income users:
“Prepaid prices were chosen because they are often the only payment method
available to low-income users, who might not have a regular income and will
thus not qualify for a postpaid subscription”.
[Measuring the Information Society Report 2014]
Indeed, prepaid accesses have a very particular appeal in developing
economies, but this cannot be considered an absolute and inflexible truth, ignoring the
context of other relevant variables to national regulatory contexts, just like the
remuneration schemes and systems of traffic exchange between networks.
As the following illustration, from the Global Wireless Matrix Bank of America
Merrill Lynch's data, there is reasonable degree of dispersion of the percentage of pre-
paid in each country, indicated in the chart with per capita GDP of information.

8
Co
nsi
de
rati
on
s a
bo
ut
the
“IC
T p
rice
da
ta m
eth
od
olo
gy
”
Chart 3 - Mobile access and GDP per capita
With this distribution, to choose to analyze only pre-paid accesses affects the
representativeness of the sample base in many countries. This is the case of, for
example, Italy and Taiwan, whose GNP per capita is similar to each other, but that are
very distant in the proportion of pre-paid accesses, the first with a 80% base of pre-
paid accesses and the second, with less than 25%. A similar situation can be observed
in the case of Germany and Finland with a similar GNP per capita, but the first one with
more than 50% of pre-paid accesses and the second, with only 8%.
In addition to the difficulty of representativeness of the different distributions,
the unconditional choice of the pre-paid plan as a reference of comparison becomes
inconsistent with the choice of the standard plan (OECD mobile-cellular low-user call
distribution) that probably does not correspond to the entry plan of many nations.
Furthermore, when supply and demand for mobile telephony market (traffic
pattern and conditions of the plan) are determined simultaneously for the sake of
comparison, not taking into account the existing correlation between the two variables,
the probability of conceptual inconsistency of the method chosen is likely to increase.
This occurs due to the fact that the price elasticity of the demand, essential for any
analysis on market structure, is disconsidered. This approach leads into a hypothetical
situation where the consumer with the traffic pattern chosen as the standard would
necessarily use a pre-paid plan, regardless of the availability of more attractive and less
costly post-paid plans, as the data collection method disconsiders these options.
This approach underestimates consumer’s capacity to obtain information and
make rational decisions. According to the methodology, the consumer would always
choose a pre-paid plan, it being advantageous or not and despite of having access to a
diversity of plans and payment options.
It is important to stress that the variety of options available for the consumer is
the result of the increase in the competitiveness in the telecommunications market.
Only a healthy competitive environment is capable of offering the market players the

correct incentives in order to create competition in price, quality and innovation of the
products and thus, benefitting the end consumer.
Hence, to not considering the diversity of mobile plans is a discredit to all the
effort taken by the national regulatory authorities to improve competition, which is the
the most effective vector to drive a market towards efficient operation. In fact, in the
report “Measuring the Information Society”, the ITU highlights the impact enabled by
competition in the financial accessibility to telecom service, with a clear contradiction
to the data collection method for mobile telephony. See below:
The report finds that the price of ICT services falls with better market
regulation and increased competition. […]
The effects of competition in driving prices down and fostering innovation
have been most apparent in the mobile-cellular market, […]
As a result, of all the important elements in the analysis of the affordability of
ICT prices, competition and regulation are those upon which
telecommunication administrations may exert more direct control. They
therefore merit particular attention. […]
Therefore, the ultimate goal of policy and regulatory interventions in the
sector is often to bring about a sustainable reduction in the prices of ICT
services, and in many cases this is achieved through regulatory actions to
promote competition, […]
A pivotal element for ensuring that lower costs are passed on in terms of lower
prices for customers is competition. […]
Competition directly affects prices in markets where retail prices are
deregulated, such as the majority of mobile-cellular and fixed-broadband
markets. […]
Market competition is one of the main drivers of affordable prices in
telecommunication services. […]
Different competition levels largely explain the differences in mobile-cellular
prices observed across countries (an estimated 7 per cent), whereas
differences in the regulatory environment have less of an impact in setting
mobile-cellular prices, since regulation in most countries is already open
enough to allow competition. […]
Admitting the idea that an intense rivalry environment presses the market to a
reduction of prices, it would be expected that in most competitive countries the prices
were lower than those of most concentrated markets. It turns out that the ITU
methodology, in our view, has led to distortions that contradict this premise.
In the chart below it can be seen that there is no correlation between the HHI
concentration measure and the prices level.

10
Co
nsi
de
rati
on
s a
bo
ut
the
“IC
T p
rice
da
ta m
eth
od
olo
gy
”
Chart 4 - Competition and mobile affordability
According to our understanding, this contradiction is explained by
methodological flaw in data collection, analyzed in the next section, which amplifies the
distortion of a basket that does not take in account post-paid offer. For this reason, both
the basket and the collection method need to be revised.
Finally, we consider that the mobile-broadband should compose the IPB, given
the importance of this service in the current context of telecommunications. In 2012,
for the first time, ITU collected mobile-broadband prices through its annual ICT Price
Basket Questionnaire. In this case, to capture the price of different data packages,
covering prepaid and postpaid services, and supported by different devices (handset
and computer-based), mobile-broadband prices were collected for two different data
thresholds. This methodology is adherent to the arguments set out above that exposed
some of the weakness related to the manner in which mobile-cellular sub-basket is
defined.
In short, we propose:
� To update the mobile-cellular sub-basket, currently based on the
OECD 2009 Basket
� To consider the mode post-paid in the mobile-cellular sub-basket,
taking into account the ITU experience related to the evaluation of
the mobile-broadband prices.
� To consider the mobile-broadband as a component of the IPB.
We propose that these suggestions be included in the ITU Discussion Group
“Expert Group on Telecommunication/ICT Indicators (EGTI)”.
In case discussion on the standard consumption sub-basket related to mobile
telephony is not admitted, to guarantee stability and analysis of data overtime, we

suggest a revision to the collection method, considering that the present method
increases the above-discussed distortion.
This will be the subject of the next topic.

12
Co
nsi
de
rati
on
s a
bo
ut
the
“IC
T p
rice
da
ta m
eth
od
olo
gy
”
ABOUT THE RULES APPLIED ON COLLECTING MOBILE
CELLULAR PRICES
ITU defines a set of rules and assumptions to be applied when selecting tariff
plan that will be reported in the Price Basket Questionnaire. These rules are listed in
the Handbook for the Collection of Administrative Data on Telecommunications/ICT
2011, page 77 of the English version, with updates from February 2015.
ITU also defines a Call Distribution in its report “Measuring the Information
Society”, largely based on OECD’s mobile-cellular low-user call distribution, according
to a 2009 methodology as mentioned in the last section, which is the entry-level basket
with the smallest number of calls included. ITU states that the sub-basket reflects a
basic, representative low-usage package, rather than the cheapest option available.
Figure 1 - Set of plans that fit the methodology
Figure 2 - Set of plans that a user would subscribe
We can view these two definitions (plan selection methodology and the mobile-
cellular call distribution) as two sets of mobile plans available in a given country: one
set composed of plans that fit the selection methodology; and another set of plans that a
user with an usage profile equal to ITU’s call distribution would choose to subscribe
(considering that the user knows its own usage profile and fully understand each
available plan).
Depending on how each definition is made and the reality of each Member
State, there is a risk that these two sets have no intersection between them, as shown in
figure 3. This means that plans that fit the selection methodology are not among the
plans a user with ITU’s call distribution would choose to subscribe.

Figure 3 - No intersection between methodology and call distribution
Any Member State falling into this scenario is forced to report a plan that either
does not suit the methodology or a plan no user with ITU’s call distribution would
subscribe. It is safe to assume that a Member State would report a plan in the gray set
(a plan a user would choose). ITU may be reticent towards the Member State’s selected
plan, since it does not comply with the methodology.
In a more ideal scenario, there is an intersection between the two sets, as
shown in figure 4. In this case, a Member State is able to select a plan that both
complies with the methodology and is among the plans that a user with the same call
distribution defined by ITU would choose to subscribe.
Figure 4 - Intersection between methodology and distribution
However, we can explore this scenario further. Among the plans in the green
set, there are plans cheaper than others (the green set is composed only with basic,
low-usage plans), while in the gray set there are also plans cheaper than others.
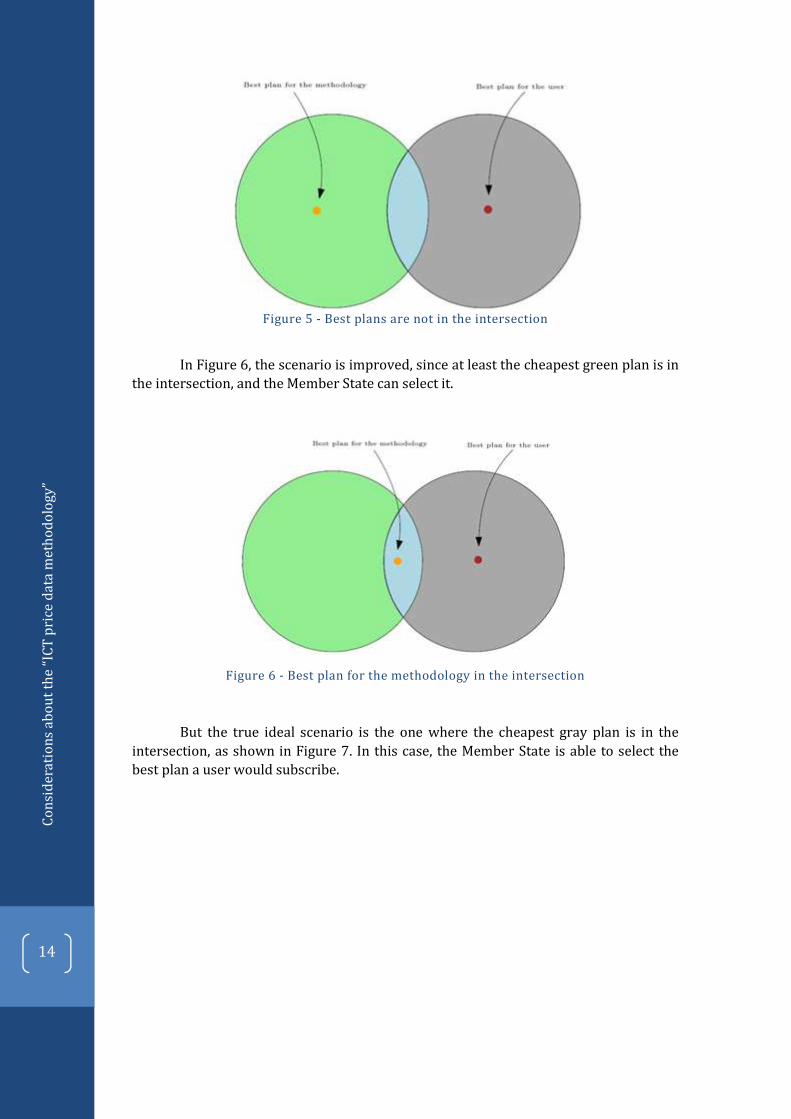
Figure 5 shows the case where the cheapest green plan and the cheapest gray
plan are not in the intersection, forcing the Member State to choose a more expensive
plan than the one available.
14
Co
nsi
de
rati
on
s a
bo
ut
the
“IC
T p
rice
da
ta m
eth
od
olo
gy
”
Figure 5 - Best plans are not in the intersection
In Figure 6, the scenario is improved, since at least the cheapest green plan is in
the intersection, and the Member State can select it.
Figure 6 - Best plan for the methodology in the intersection
But the true ideal scenario is the one where the cheapest gray plan is in the
intersection, as shown in Figure 7. In this case, the Member State is able to select the
best plan a user would subscribe.

Figure 7 - Best plan for the user is in the intersection.
Depending on how the methodology and the call distribution are made,
different Member States may fall in the different scenarios shown above. As long as this
occurs, the comparability among Member States is impaired, with some Member States
being forced to select plans that are not ideal, while others will not have this problem.
We believe that in order to achieve comparability, each Member State should
ideally match with the same scenario, or at least match with scenarios that are close
(like the ones in figure 5, 6 and 7). For that to happen the methodology should be
the least restrictive possible.
The call distribution is currently based on a 2009 survey by OECD. This should
be updated, as pointed above. While the methodology is currently too restrictive,
with rules like” it must be a prepaid plan”, we can also observe that the term
“non-promotional plan” is not precisely defined in the methodology, leading to
several plans being ruled out.
For the reason, we advocate that the reporting, by Member States, of a
promotional plan with a minimum duration of 12 months should be allowed.
Therefore, we believe both the methodology and the call distribution should be
put in discussion for the EGTI (Expert Group on Telecom Indicators) to assess these
issues and improve comparability among Member States.

16
Co
nsi
de
rati
on
s a
bo
ut
the
“IC
T p
rice
da
ta m
eth
od
olo
gy
”
ABOUT THE TAX BURDEN DISCLOSURE
In the ITU ICT Price Basket Questionnaire the following questions are made:
� i151Tax - Fixed-telephone tariff, tax rate:
o What is the tax rate included in the fixed-telephone tariffs (%)?
� i153Tax - Mobile-cellular tariff, tax rate:
o What is the tax rate included in the mobile-cellular prepaid tariffs (%)?
� i4213Tax - Fixed (wired)-broadband, tax rate:
o What is the tax rate included in the fixed (wired)-broadband Internet
tariffs (%)?
Considering the principles of publicity and transparency, as well as the
relevance of empowering consumers with information on the composition of prices in
different countries, we understand that these questions are extremely important and
the disclosure of such information must have the same highlight of assessed prices in
the “Measuring the Information Society Report”.
For this reason, we suggest adding column in the table related to “ICT
Basket Prices and sub-baskets”2 with data about tax burden.
2 Table 4.15 of the Measuring the Information Society Report 2014.