consideration of price caps reduction meeting of the board of governors of the california iso by...
TRANSCRIPT
Consideration of Price Caps Reduction
Meeting of the
Board of Governors of the
California ISO
By
David ParquetVice President
Enron North America Corp.June 28, 2000
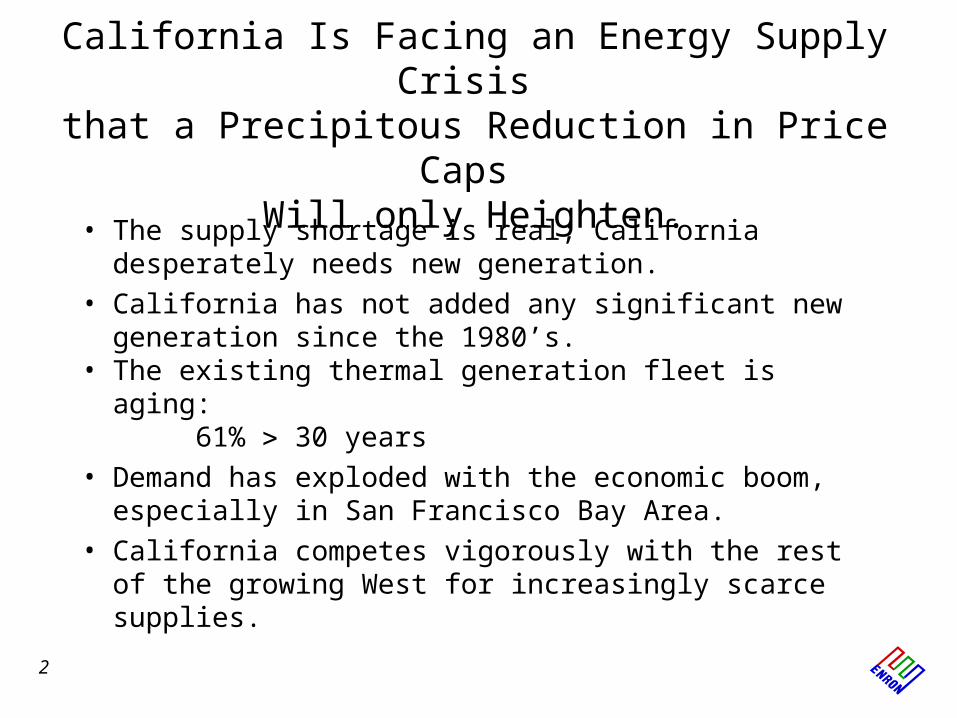
California Is Facing an Energy Supply Crisis that a Precipitous Reduction in Price Caps
Will only Heighten.
• The supply shortage is real; California desperately needs new generation.
• California has not added any significant new generation since the 1980’s.
• The existing thermal generation fleet is aging: 61% 30 years
• Demand has exploded with the economic boom, especially in San Francisco Bay Area.
• California competes vigorously with the rest of the growing West for increasingly scarce supplies.
2
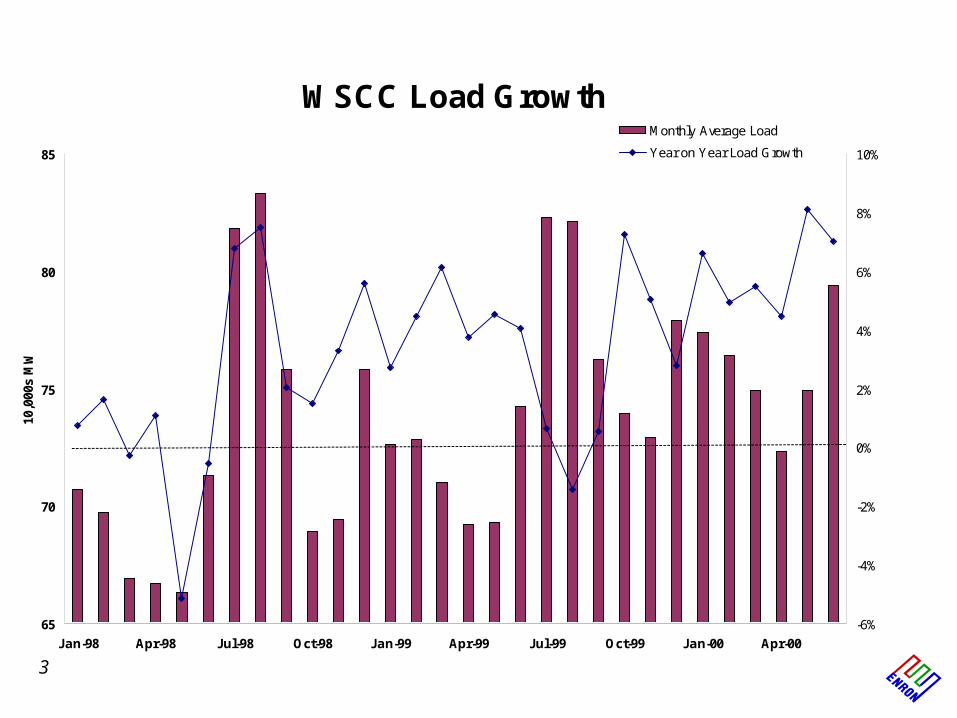
WSCC Load Growth
65
70
75
80
85
Jan-98 Apr-98 Jul-98 Oct-98 Jan-99 Apr-99 Jul-99 Oct-99 Jan-00 Apr-00
10,0
00s
MW
-6%
-4%
-2%
0%
2%
4%
6%
8%
10%
Monthly Average Load
Year on Year Load Growth
3
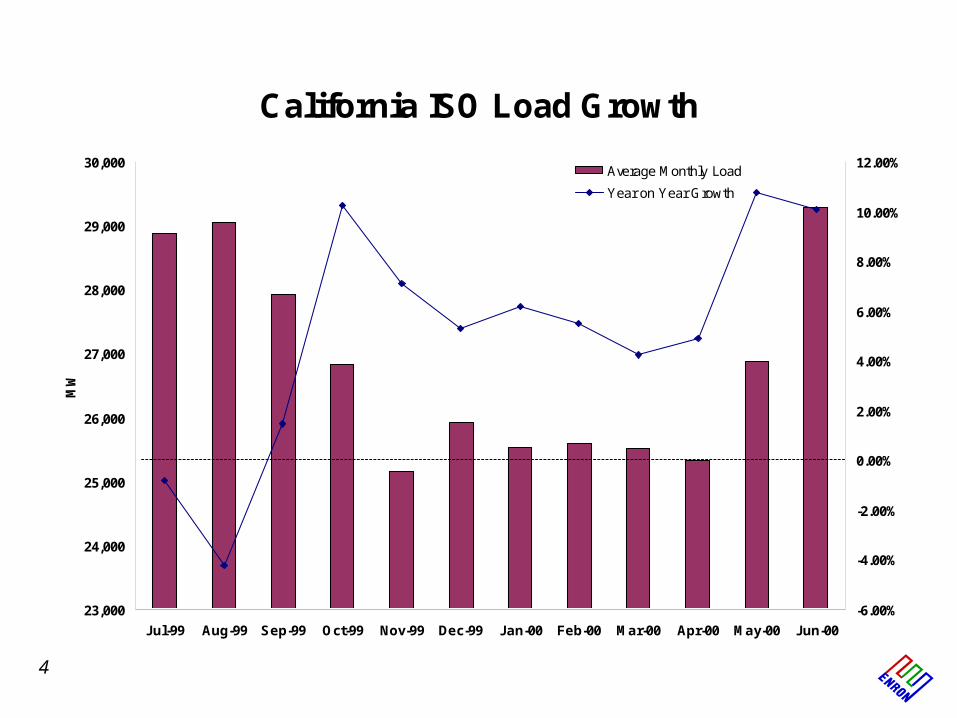
California ISO Load Growth
23,000
24,000
25,000
26,000
27,000
28,000
29,000
30,000
Jul-99 Aug-99 Sep-99 Oct-99 Nov-99 Dec-99 Jan-00 Feb-00 Mar-00 Apr-00 May-00 Jun-00
MW
-6.00%
-4.00%
-2.00%
0.00%
2.00%
4.00%
6.00%
8.00%
10.00%
12.00%Average Monthly Load
Year on Year Growth
4

0
20
40
60
80
100
120
140
160
Northwest Rockies Southwest California WSCC
WSCC Loads (GW)
California is not an island and cannot develop a self-contained solution.
5
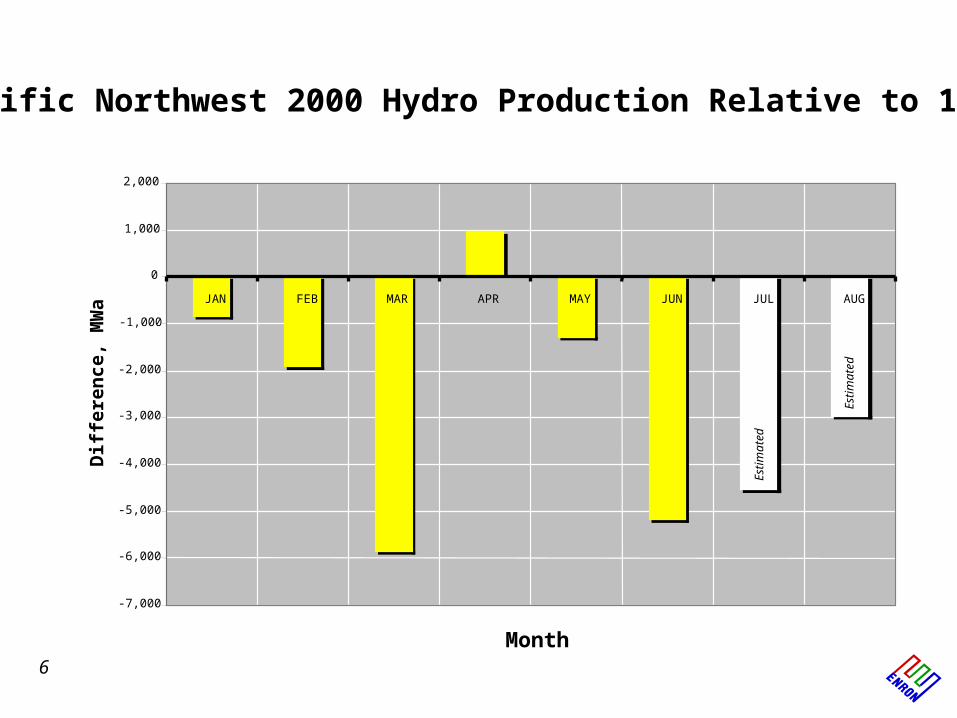
Pacific Northwest 2000 Hydro Production Relative to 1999
-7,000
-6,000
-5,000
-4,000
-3,000
-2,000
-1,000
0
1,000
2,000
JAN FEB MAR APR MAY JUN JUL AUG
Month
Dif
fere
nce
, M
Wa
Estim
ated
Estim
ated
6
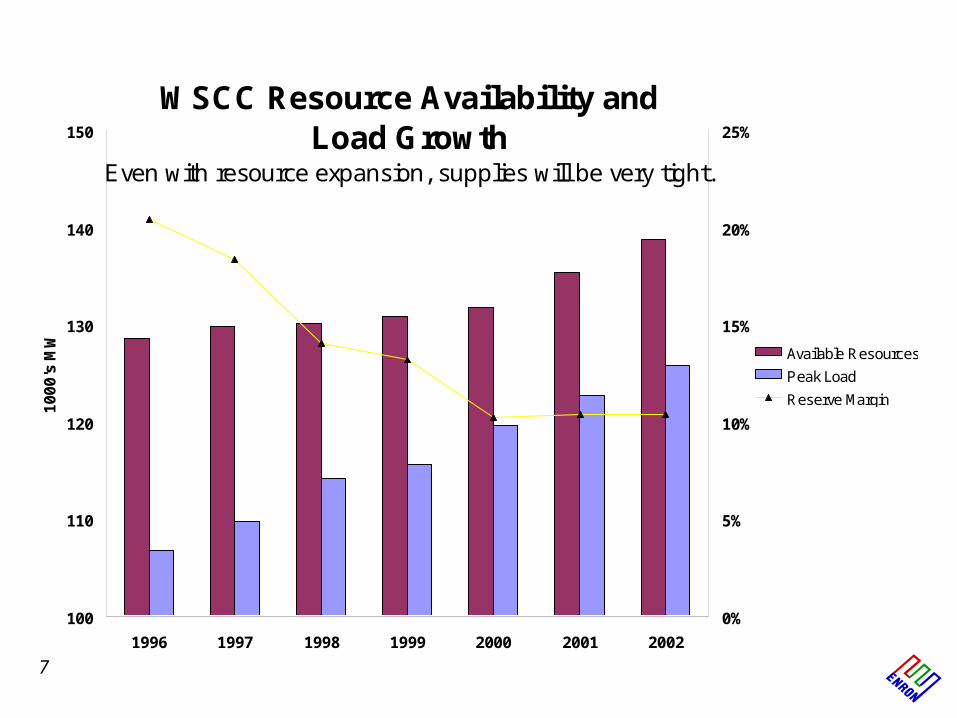
WSCC Resource Availability and Load Growth
Even with resource expansion, supplies will be very tight.
100
110
120
130
140
150
1996 1997 1998 1999 2000 2001 2002
10
00
's M
W
0%
5%
10%
15%
20%
25%
Available Resources
Peak Load
Reserve Margin
7
A Price Cap Reduction Will only Increase the Pressure on Reliability of California Electric System
• Investment in power plants will go elsewhere, taking jobs, economic and reliability benefits.
• Suppliers will sell outside California where markets are more predictable and prices are higher.
• Keeping the lights on will get tougher.
• Because of the interdependent linkages in California’s electric market, cannot change one aspect of structure without impacting all others.
• Uncertainty in the marketplace is the surest way to dry up the growing forward markets.
8
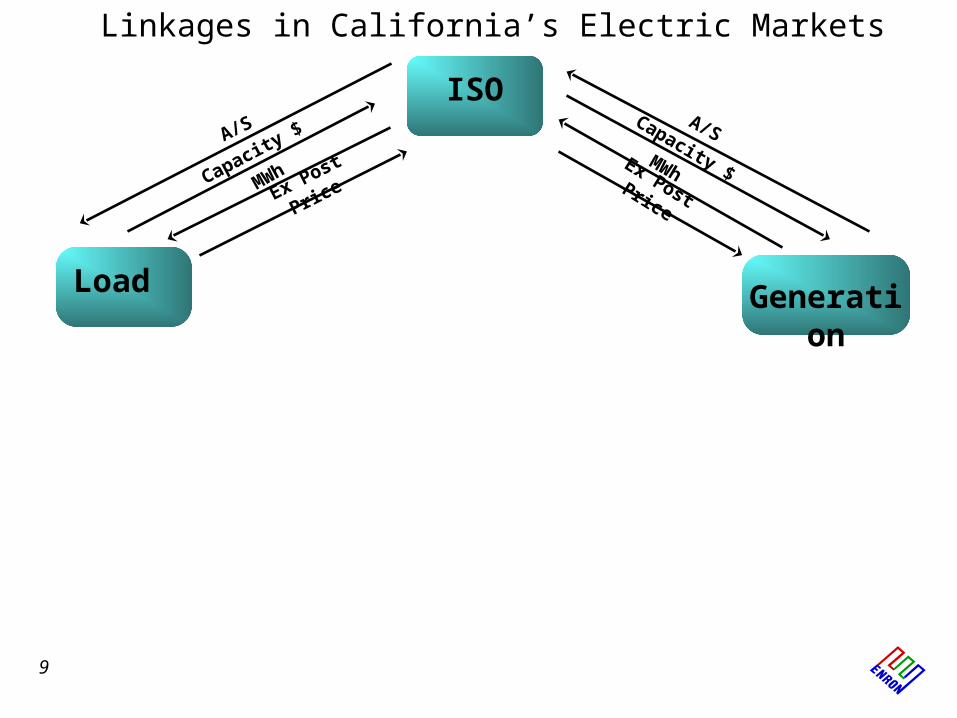
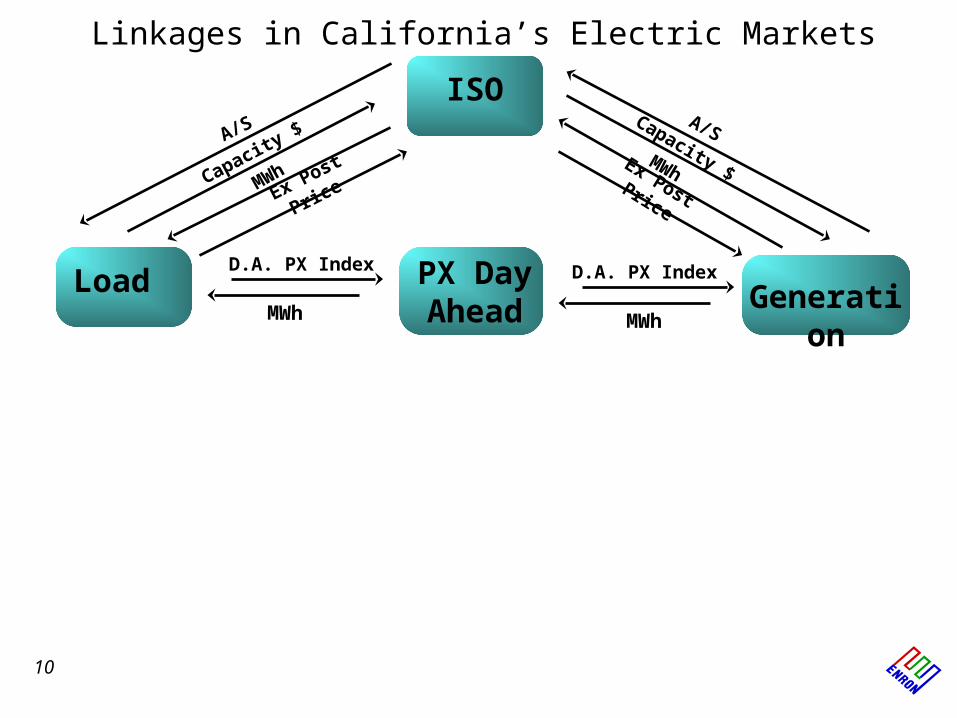
Load Generation
ISO
Linkages in California’s Electric Markets
A/S
Ex Post Price
MWhCapacity $Ex Post Price
MWh
Capacity $
A/S
9
Load Generation
ISO
PX Day AheadMWh
D.A. PX Index D.A. PX Index
MWh
A/S
Capacity $
MWh
Ex Post Price
Capacity $MWhEx Post Price
A/S
Linkages in California’s Electric Markets
10
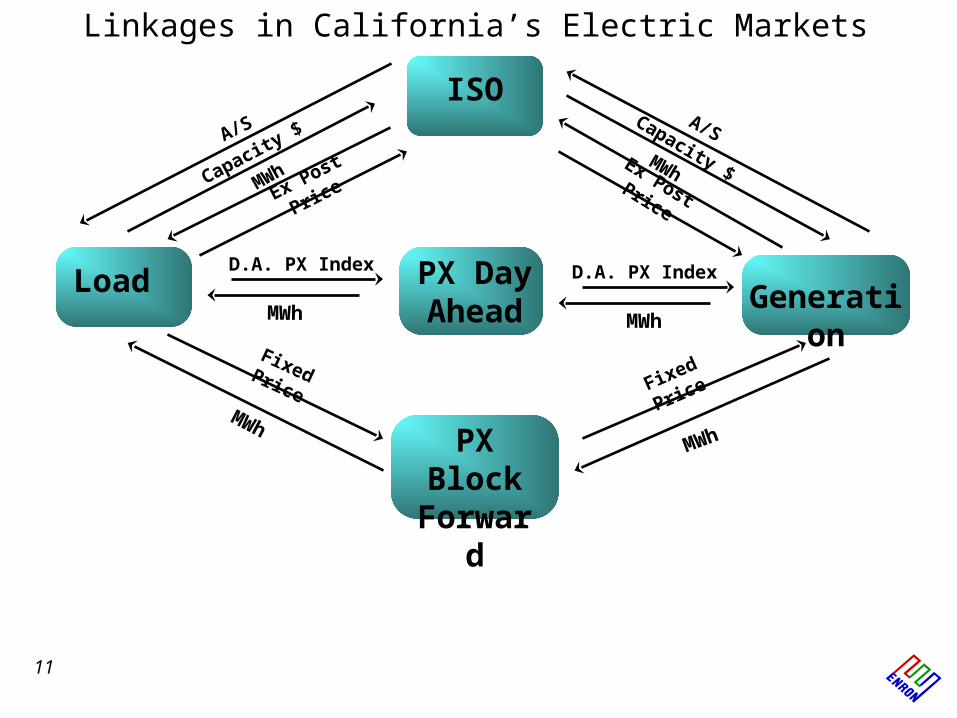
PX Block Forward
Load Generation
ISO
PX Day Ahead
Fixed Price
MWh
Fixed PriceMWh
MWh
D.A. PX Index D.A. PX Index
MWh
MWhEx Post Price
A/S
Capacity $
MWh
Ex Post Price
A/SCapacity $
Linkages in California’s Electric Markets
11
PX Block Forward
Load Generation
ISO
PX Day Ahead
Non CAISO MARKET
Fixed Price
MWh
Fixed PriceMWh
MW
h Negotiated
Price
MWh
D.A. PX Index D.A. PX Index
MWh
MW
h
Neg
otia
ted
Price
MWhEx Post Price
A/S
Capacity $
MWh
A/S
Ex Post Price
Capacity $
Linkages in California’s Electric Markets
12
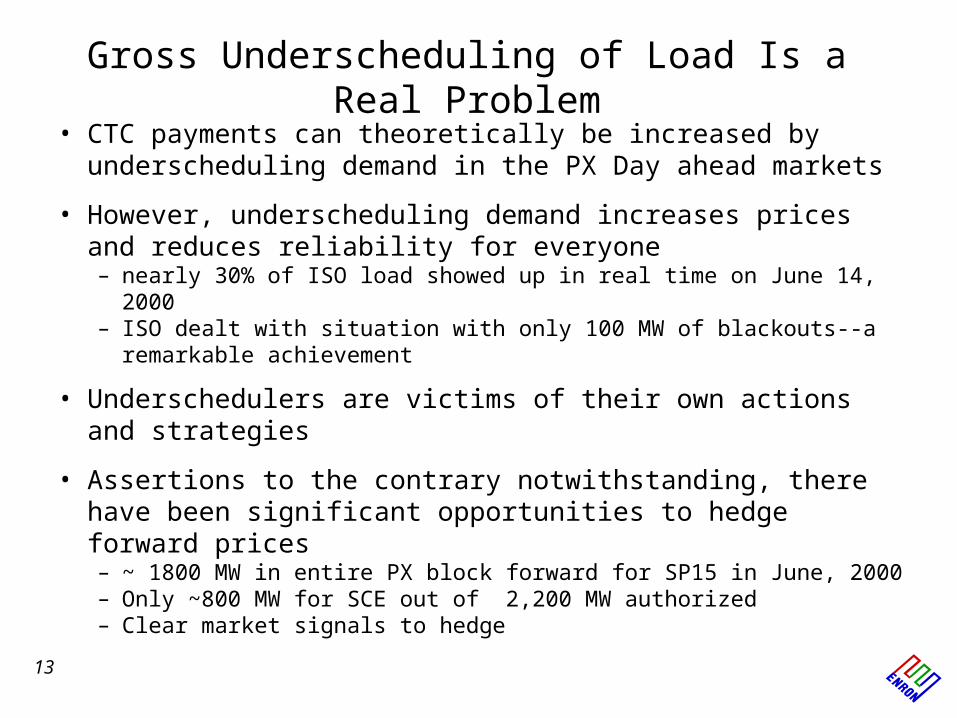
Gross Underscheduling of Load Is a Real Problem
• CTC payments can theoretically be increased by underscheduling demand in the PX Day ahead markets
• However, underscheduling demand increases prices and reduces reliability for everyone– nearly 30% of ISO load showed up in real time on June 14, 2000– ISO dealt with situation with only 100 MW of blackouts--a
remarkable achievement
• Underschedulers are victims of their own actions and strategies
• Assertions to the contrary notwithstanding, there have been significant opportunities to hedge forward prices– ~ 1800 MW in entire PX block forward for SP15 in June, 2000– Only ~800 MW for SCE out of 2,200 MW authorized – Clear market signals to hedge13
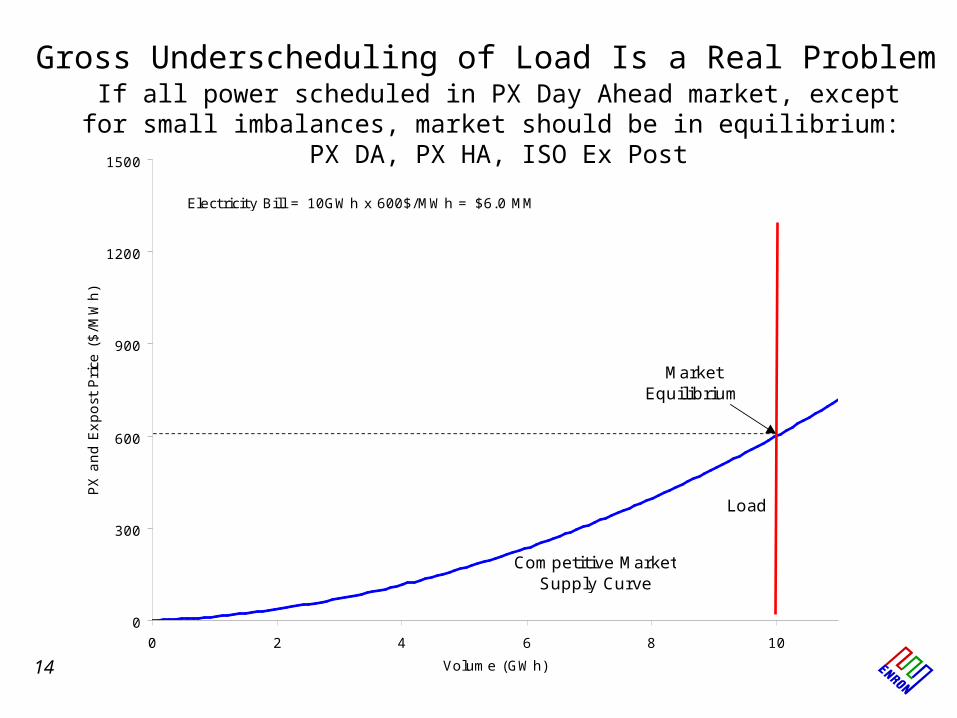
Gross Underscheduling of Load Is a Real Problem
If all power scheduled in PX Day Ahead market, except for small imbalances, market should be in equilibrium: PX DA, PX HA, ISO Ex Post
0
300
600
900
1200
1500
0 2 4 6 8 10
Volume (GWh)
PX
and E
xpost
Pri
ce (
$/M
Wh)
Competitive Market Supply Curve
Load
Electricity Bill = 10GWh x 600$/MWh = $6.0 MM
Market Equilibrium
14

Gross Underscheduling of Load Is a Real Problem
In actual fact, there is an incentive to underschedule, but consequence is pressure on real time reliability as Ex Post load grows.
0
300
600
900
1200
1500
0 2 4 6 8 10
Volume (GW)
PX
and E
xpost
Pri
ce (
$/M
Wh)
Load to Ex Post
Savings from Underscheduling Load
Load to PX Day Ahead
Electricity Bill = 8GWh x 400$/MWh + 2GWh x 600$/MWh = $4.4 MM
400
Underscheduling Value = $6.0 MM - $4.4 MM = $1.6 MM
Arbitrary Limit Bid
15

Gross Underscheduling of Load Is a Real Problem
But when there is massive underscheduling in a tight supply market, the ISO may have to take drastic action.
0
300
600
900
1200
1500
0 2 4 6 8 10
Volume (GW)
PX
and E
xpost
Pri
ce (
$/M
Wh)
Cost
Savings
Electricity Bill = 7GWh x 400$/MWh + 3GWh x 1500$/MWh = $7.3 MM
Underscheduling Value = $6 MM - $7.3 MM = -$1.3 MM
Arbitrary Limit Bid
(including replacement reserves to sustain
reliability)
Increasing load to Ex Post
16
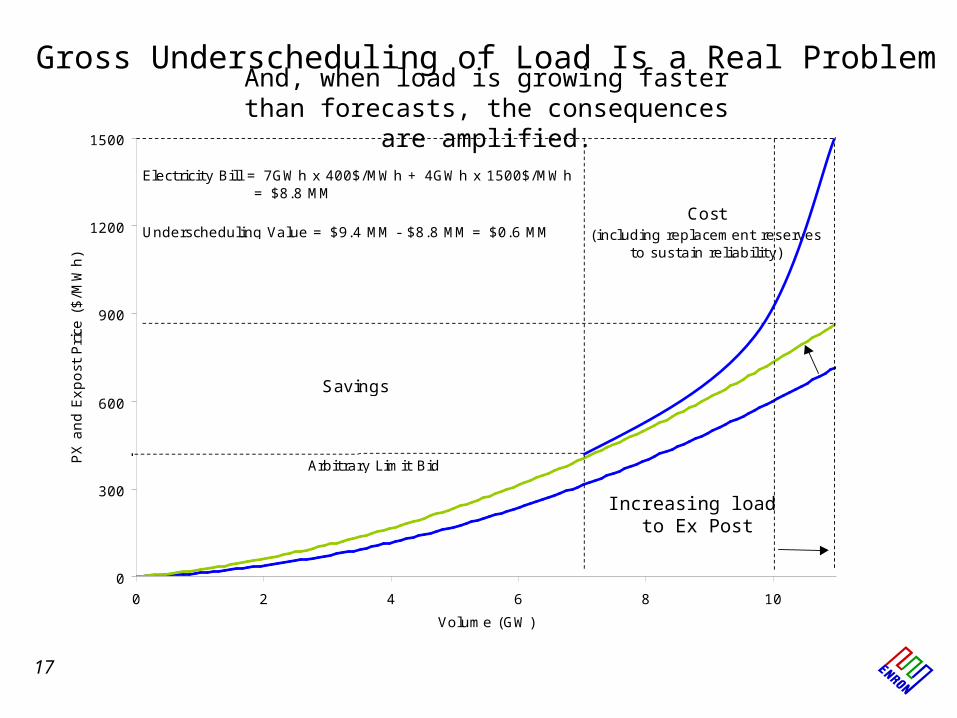
Gross Underscheduling of Load Is a Real ProblemAnd, when load is growing faster than
forecasts, the consequences are amplified.
0
300
600
900
1200
1500
0 2 4 6 8 10
Volume (GW)
PX
and E
xpost
Pri
ce (
$/M
Wh)
Cost
Savings
Electricity Bill = 7GWh x 400$/MWh + 4GWh x 1500$/MWh = $8.8 MM
Underscheduling Value = $9.4 MM - $8.8 MM = $0.6 MM
Arbitrary Limit Bid
(including replacement reserves to sustain reliability)
Increasing load to Ex Post
17
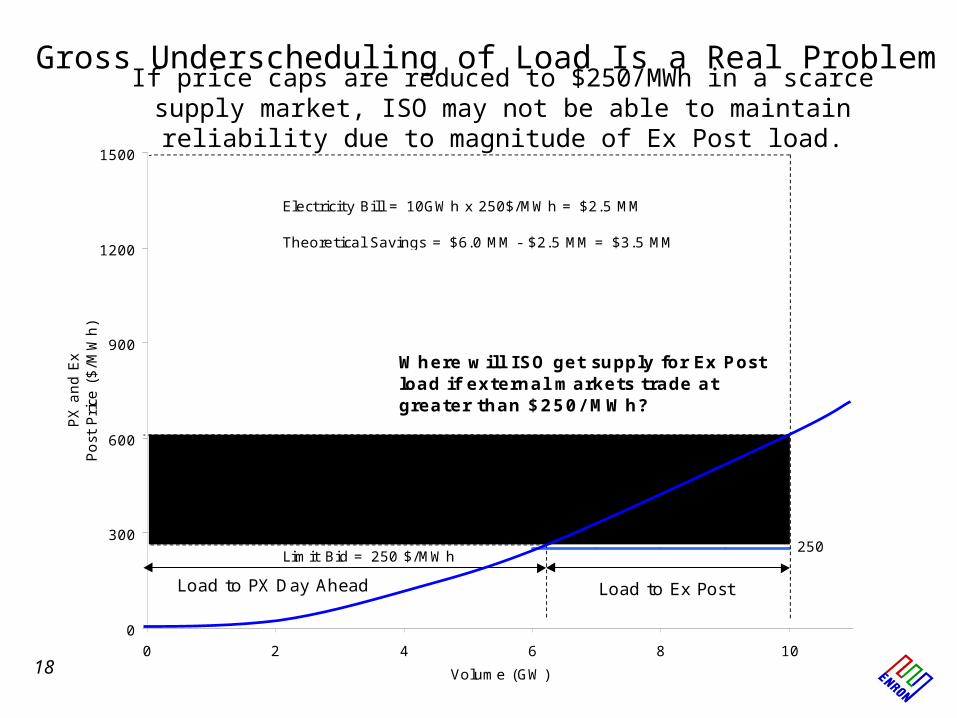
Gross Underscheduling of Load Is a Real ProblemIf price caps are reduced to $250/MWh in a scarce supply market, ISO
may not be able to maintain reliability due to magnitude of Ex Post load.
0
300
600
900
1200
1500
0 2 4 6 8 10
Volume (GW)
PX
and E
x
Post
Pri
ce (
$/M
Wh)
Theoretical Savings
Electricity Bill = 10GWh x 250$/MWh = $2.5 MM
Theoretical Savings = $6.0 MM - $2.5 MM = $3.5 MM
250
Load to Ex PostLoad to PX Day Ahead
Limit Bid = 250 $/MWh
Where will ISO get supply for Ex Post load if external markets trade at greater than $250/ MWh?
18
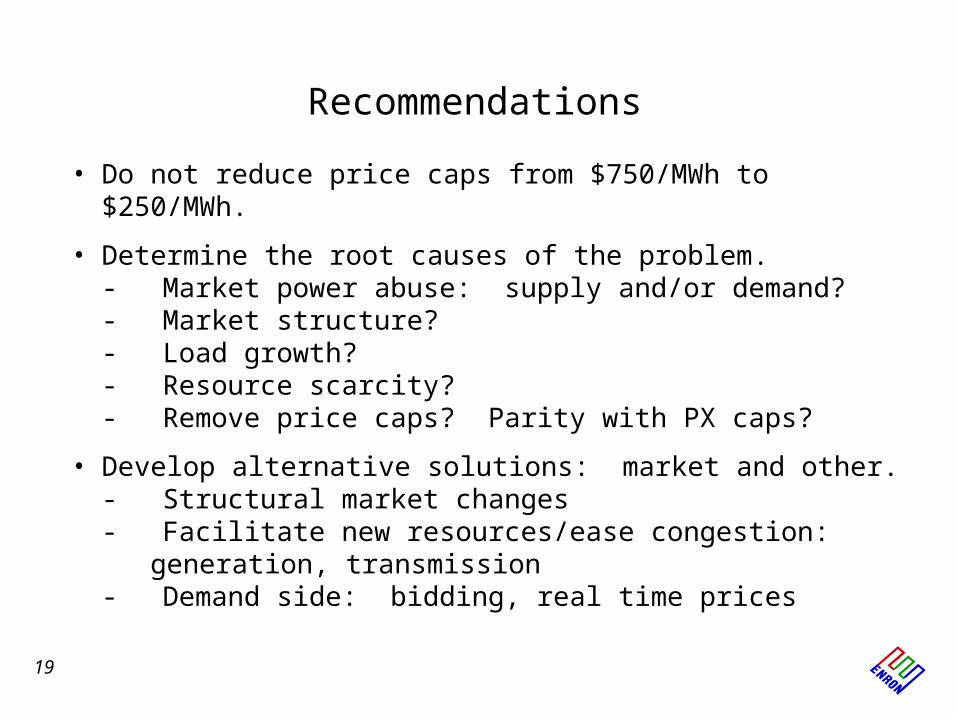
Recommendations
• Do not reduce price caps from $750/MWh to $250/MWh.
• Determine the root causes of the problem.- Market power abuse: supply and/or demand?- Market structure?- Load growth?- Resource scarcity?- Remove price caps? Parity with PX caps?
• Develop alternative solutions: market and other.- Structural market changes- Facilitate new resources/ease congestion:
generation, transmission- Demand side: bidding, real time prices
19

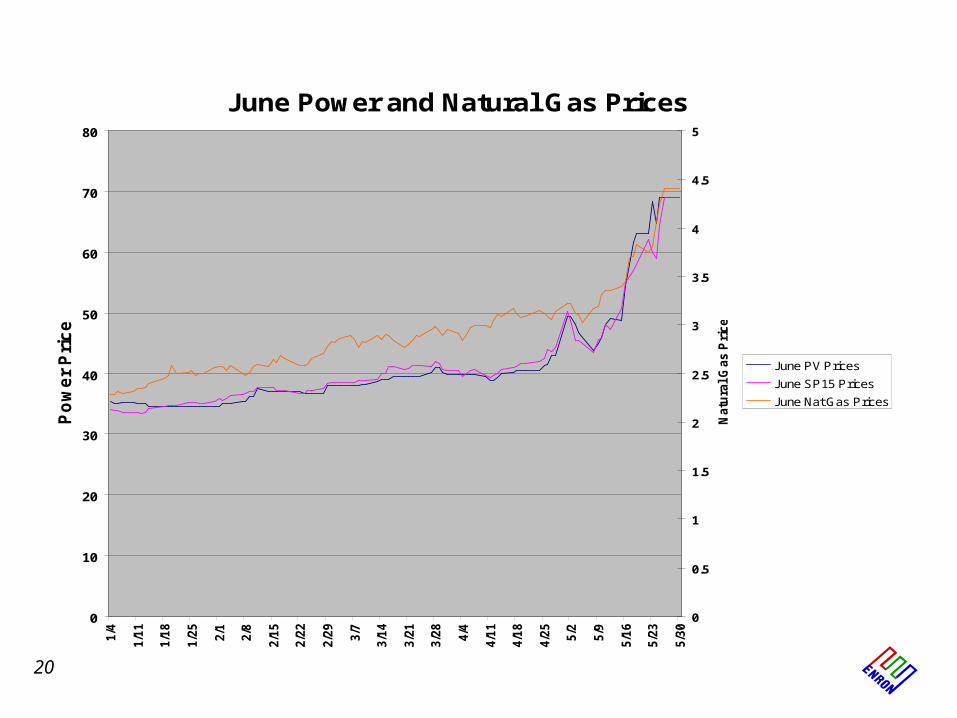
June Power and Natural Gas Prices
0
10
20
30
40
50
60
70
80
1/4
1/1
1
1/1
8
1/2
5
2/1
2/8
2/1
5
2/2
2
2/2
9
3/7
3/1
4
3/2
1
3/2
8
4/4
4/1
1
4/1
8
4/2
5
5/2
5/9
5/1
6
5/2
3
5/3
0
Po
we
r P
ric
es
0
0.5
1
1.5
2
2.5
3
3.5
4
4.5
5
Natu
ral G
as P
rices
June PV Prices
June SP15 Prices
June Nat Gas Prices
20
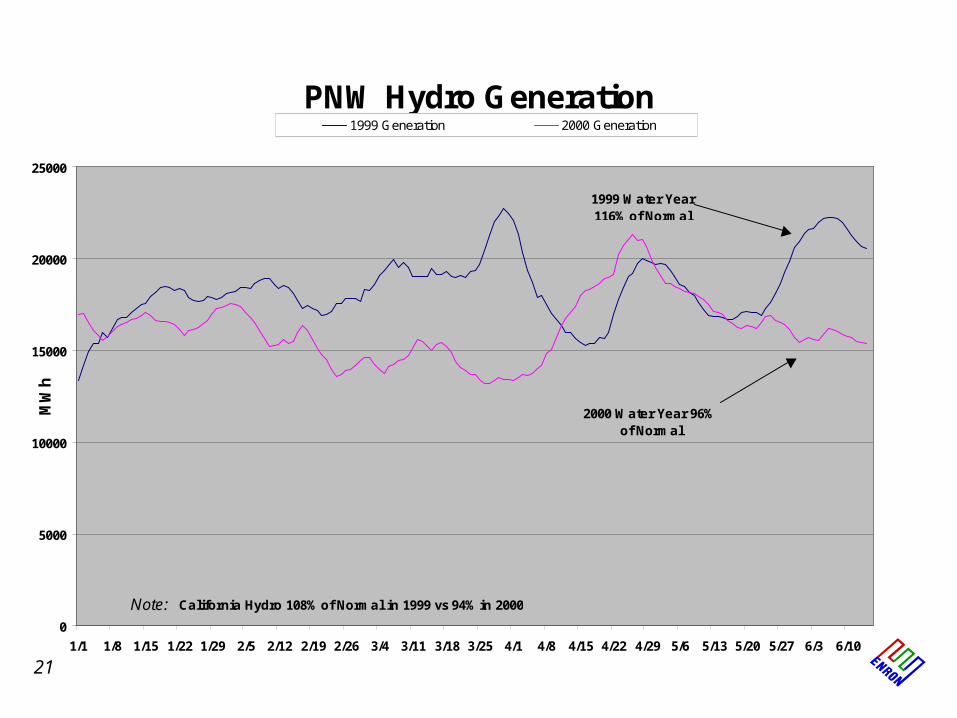
PNW Hydro Generation
0
5000
10000
15000
20000
25000
1/1 1/8 1/15 1/22 1/29 2/5 2/12 2/19 2/26 3/4 3/11 3/18 3/25 4/1 4/8 4/15 4/22 4/29 5/6 5/13 5/20 5/27 6/3 6/10
MW
h
1999 Generation 2000 Generation
1999 Water Year 116% of Normal
2000 Water Year 96% of Normal
Note: California Hydro 108% of Normal in 1999 vs 94% in 2000
21

June SP15 Block Forward Purchases vs. Power Prices
0
10
20
30
40
50
60
70
80
1/4/00 1/18/00 2/1/00 2/15/00 2/29/00 3/14/00 3/28/00 4/11/00 4/25/00 5/9/00 5/23/00
Po
wer
Pri
ces
0.00
1000.00
2000.00
3000.00
4000.00
5000.00
6000.00
7000.00
8000.00
MW
h
June PV Price
June SP-15 Price
BF Purchases
22