conservation cwr in bolivia
TRANSCRIPT
Conservation of Crop Wild Relative Species in Bolivia
An Outline to Identify Favorable and Unfavorable Factors
to Support a Conservation Program
by
Cecilia Gonzalez Paredes
A Thesis Presented in Partial Fulfillment of the Requirements for the Degree
Master of Science
Approved April 2011 by the Graduate Supervisory Committee:
Ann Kinzig, Chair Rimjhim Aggarwal
Netra Chhetri
ARIZONA STATE UNIVERSITY
May 2011

i
ABSTRACT
Since the Convention on Biological Diversity was established in
1992, more importance has been given to the conservation of genetic
resources in the international community. In 2001, the International Treaty
on Plant Genetic Resources for Food and Agriculture (PGRFA) focused
on conserving plant genetic resources, including crop wild relatives
(CWR). Some of these genetic resources hold desirable traits—such as
transfer of plant disease resistance, improvement of nutritional content, or
increased resistance to climate change--that can improve commercial
crops. For many years, ex situ conservation was the prevalent form of
protecting plant genetic resources. However, after PGRFA was published
in 1998, in situ techniques have increasingly been applied to conserve
wild relatives and enhance domesticated crops. In situ techniques are
preferred when possible, since they allow for continued evolution of traits
through natural selection, and viability of seed stock through continuous
germination and regeneration. In my research, I identified regions in
Bolivia and rated them according to their potential for successful programs
of in situ conservation of wild crop relatives. In particular, I analyzed areas
according to the following criteria: a) The prevalence of CWRs. b) The
impacts of climate change, land use change, population growth, and
economic development on the continued viability of CWRs in an area. c)
The socio-political and economic conditions that might impede or facilitate
successful conservation programs and outcomes. This work focuses on

ii
three genera of particular importance in Bolivia: Peanut (Arachis spp.),
Potato (Solanum spp.) and Quinoa (Chenopodium spp.). I analyzed the
above factors for each municipality in Bolivia (the smallest scale for which
appropriate data were available). The results indicate which municipalities
are most likely to successfully engage in CWR conservation projects.
Finally, I present guidelines for the creation of conservation projects that
pinpoint some of the potential risks and difficulties with in situ conservation
programs in Bolivia and more generally.
iii
DEDICATION
To God, my strength and peace in the most difficult times. My joy and
light. Estoy lista para seguirte!!
To the people in Bolivia and the need we have to wisely use our resources
for the benefit of all.
“…science without conscience is but the ruin of the soul.” François Rabelais
iv
ACKNOWLEDGMENTS
I would like to say thank you to my parents first of all, for encouraging me
to keep my path and conclude one more phase in my life. For their love
and their constant long distance support, I am forever grateful.
To my committee: Dr. Ann Kinzig, Dr. Rimjhim Aggarwal and Dr. Netra
Chhetri for all their time, advice and patience.
Special thanks to: Freddy Miranda, Maya Kapoor, Thomas Visic, Moritz
Beber, Amanda Trangsrud, Wangmo Knoepfel and Sharbel Gutierrez.
Thank you to all my friends in Bolivia and the Herbario Nacional de Bolivia
for their institutional support.

v
TABLE OF CONTENTS
Page
LIST OF TABLES..........................................................................................vi
LIST OF FIGURES....................................................................................... vii
CHAPTER
1 INTRODUCTION....................................................................... 1
Crop Wild relatives ................................................................. 2
Threats to CWR ………………………………………………….3
International framework for CWR conservation ………………5
First conservation actions ………………………………………8
Objectives.............................................................................. 11
Plurinational State of Bolivia – General Framework ………. 12
Municipalities as analytical unit ……………………………….16
Bolivia and the CWRs ………………………………………... 17
2 METHODS............................................................................... 20
Assessment for CWR conservation ..................................... 20
Selected species ……………………………………………….21
Peanut (Arachis sp.) …………………………………………...24
Potato (Solanum sp.) …………………………………………..26
Quinoa (Chenopodium sp.) …………………………………...28
Selection of municipalities …………………………………….29
Potential Threats to CWR………………………………….…..31
vi
Social and Economic Conditions Providing Opportunities for
Successful Conservation………………………………………35
3 RESULTS ................................................................................. 44
Peanut species and climate change..................................... 45
Potato species and climate change………………………..…47
Quinoa species and climate change..................................... 49
4 SYNTHESIS…......................................................................... 82
Peanut species...................................................................... 83
Potato species....................................................................... 85
Quinoa species…………………………………………………89
5 CONCLUSIONS AND RECOMMENDATIONS ………….……98
REFERENCES …...……………………………………………………….... 105
APPENDIX
A MAPS FOR OTHER RESULTS………………………………114
BIOGRAPHICAL SKETCH ....................................................................... 126

vii
LIST OF TABLES
Table Page
1. Climatic model for tropical Andes – Simulations for the end of
the 21st century ...................................................................... 33
2. Hypotheses for each variable.…………………………………. 36
3. Hypotheses and predictions for peanut. Arachis spp…………41
4. Hypotheses and predictions for potato. Solanum spp. ……….42
5. Hypothesis and predictions for quinoa species. Chenopodium
spp. ……………………………………………………………….43
6. Tolerable temperature and precipitation range for peanut
species ……………………………………………...……………45
7. Municipalities with a change of average precipitation in excess
of the tolerable range for Arachis batizocoi
............………………………………………………………….….46
8. Municipalities with a change of average temperature and
average precipitation in excess of the tolerable range for
Arachis duranensis………………………………………………46
9. Municipalities with a change of average temperature and
average precipitation beyond the tolerable range for Arachis
ringonii ……………………………………………………………47
10. Tolerable temperature and precipitation range for potato
species …………………………………………………………...47

viii
11. Municipalities with a change of average precipitation in excess
of the tolerable range for Solanum boliviense subsp.
astleyi……………………………………………………………..48
12. Municipalities with a change of average precipitation beyond
the tolerable range for Solanum gandarillasii …………………49
13 Municipalities with a change of average temperature and
average precipitation beyond the tolerable range for Solanum
alandiae …………………………………………………………...49
14. Tolerable temperature and precipitation range for quinoa
species ……………………………………………………….…..50
15. Municipalities with a change of average precipitation beyond
the tolerable range for Chenopodium hircinum.………………51
16. Municipalities with a change of average temperature beyond
the tolerable range for Chenopodium hircinum subsp.
catamarcensis……………………………………………..……..51
17. Municipalities with a change of average temperature and
average precipitation beyond the tolerable range for
Chenopodium hircinum subsp. eu-hircinum ……………........51
18. Summary for Arachis batizocoi………………………………….84
19. Summary for Arachis duranensis………………………...……..85
20. Summary for Arachis rigonii……………………………………..85
21. Summary for Solanum alandiae………………………………...87
22. Summary for Solanum boliviense subsp. astleyi………………88

ix
23. Summary for Solanum gandarillasii………………………….....88
24. Summary for Chenopodium hircinum…………………………..91
25. Summary for Chenopodium hircinum subsp.
catamarcensis……………………………………………………93
26. Summary for Chenopodium hircinum subsp. eu-hircinum…...94

x
LIST OF FIGURES
Figure Page
1. Bolivia - Political division and ecosystems. ............................ 14
2. Percent of mine concessions for peanut distribution.........…..53
3. Percent of mine concessions for potato distribution ...……….54
4. Percent of mine concessions for C. hircinum ….……………..55
5. Percent of mine concessions for C. hircinum subsp.
catamarcensis ……………………………………….…………..55
6. Percent of oil concessions for peanut distribution .…………..57
7. Percent of oil concessions for potato distribution …………….58
8. Percent of oil concessions for C. hircinum …………..………..59
9. Percent of oil concessions for C. hircinum subsp.
catamarcensis …………………………………………….……..59
10. Population density with growth rate for Arachis batizocoi ... 62
11. Population density with growth rate for Solanum
gandarillasii……………………………………………………….63
12. Population dynamics for Chenopodium hircinum subsp.
catamarcensis……………………………………………………64
13. Literacy Rate for peanut species ………………………………66
14. Literacy Rate for potato species ……………………………….67
15. Literacy Rate for C. hircinum …………………………………..68
16. Literacy rate for C. hircinum subsp. catamarcensis ………….68

xi
17. Percent of women involved in local government for peanut
distribution …………………………………………………….....70
18. Percent of women involved in local government for potato
distribution ………………………………………………………..71
19. Percent of women involved in local government C. hircinum
……………………………………………………………………..72
20. Percent of women involved in local government C. hircinum
subsp. catamarcensis …………………………………………..72
21. Percent of workers involved in agriculture activity for peanut
distribution ………………………………………………………..74
22. Percent of workers involved in agriculture activity for potato
distribution ………………………………………………………..75
23. Percent of workers involved in agriculture activity for C.
hircinum …………………………………………………………..76
24. Percent of workers involved in agriculture activity for C.
hircinum subsp. catamarcensis ………………………………..76
25. Percent of land assigned with tenure for peanut distribution
…………………………………………………………………….78
26. Percent of land assigned with tenure for potato distribution
………………………………………………………………….....78
27. Percent of land assigned with tenure for C. hircinum
…………………………………………………………………….80

xii
28. Percent of land assigned with tenure for C. hircinum subsp.
catamarcensis …………………………………………………...80
29. Final selection of municipalities with most promising conditions
for conservation projects……………………………………….97
30. Percent of mine concessions for C. hircinum subsp. eu-
hircinum ……………………………..………………………….114
31. Percent of oil concessions for C. hircinum subsp. eu-
hircinum………………………………………………………….115
32. Population dynamics for Arachis duranensis………………..116
33. Population dynamics for Arachis ringonii…………………….117
34. Population dynamics for Solanum alandiae…………………118
35. Population dynamics for Solanum boliviense subsp.
astleyi……………………………………………………………119
36. Population dynamics for Chenopodium hircinum……………120
37. Population dynamics for Chenopodium hircinum subsp. eu-
hircinum………………………………………………………….121
38. Literacy rate for C. hircinum subsp. eu-hircinum …………...122
39. Percent of women involved in local government C. hircinum
subsp. catamarcensis …………………………………………123
40. Percent of workers involved in agriculture activity for C.
hircinum subsp. eu-hircinum ………………………………….124

xiii
41. Percent of land assigned with tenure for for C. hircinum subsp.
eu-hircinum……………………………………………………...125
1
Chapter 1
INTRODUCTION
For thousands of years farmers have used a wide variety of plants
to obtain food. From season to season they would save seeds for future
planting. This process produced several hundred crop plants that were
domesticated from wild relatives (Damania, 2008). After significant
domestication of wild crop relatives, the continued viability of the wild
progenitors was neglected. Uncontrolled grazing and periodic slash and
burn activities produced severe genetic erosion and destruction of some
CWR habitat (though some CWR’s are found on the borders of cultivated
fields (Damania, 1994)). During the 1960s and 1970s the goal of
increasing crop production in developing countries led to the Green
Revolution. The introduction of identical crop germplasms over very large
geographic areas led to a reduction of diversity of the local land races
produced by hundreds of years of development and selection. Today, we
use mainly three crops (rice, wheat, and corn) and very few strains of
each relative to the earlier diversity of landraces. This has reduced the
diversity of crop species and strains we grow and consume, creating a
loss of agricultural biodiversity (FAO, 1999).
2
Crop Wild Relatives (CWR)
Crop wild relatives include crop ancestors and other closely related
species. CWRs can confer beneficial genetic traits in commercial crops
through interbreeding or gene transfer—such beneficial traits include
resistance to pest and disease, drought tolerance and improvement in the
nutritional value of crops, (Maxted et al, 2008; Meilleur and Hodgkin,
2004; Stolton et al, 2006). In the long term, this improvement could
enhance food security programs in many countries around the world.
These crop wild relatives provide useful genes through natural or artificial
introgression. This process is the origin of many of the land races or crop
varieties that are used today (Cromwell et al, 2003).
The use of CWR can be vital for poor communities in terms of
improving their crops with each new season to fight common threats like
pests diseases and climate variability. For example, in South Africa,
people in rural villages keep home gardens with a variety of CWR. They
personally use up to a 70% of this production and sell the rest. These
gardens are the places where regular crops can obtain new gene material
from CWR through pollination or human mediation and adapt to local
conditions. Several different countries have reported the use of CWR as a
source of food during periods of famine and seasonal farming (Azzu &
Collette, 2008). This is a low-cost, sustainable strategy for small farmers
3
to increase food security. Small farmers around the world do not need to
buy improved seeds or pay royalties for their crops (Mouillé, et al, 2010).
The contribution of CWR to food security programs extends beyond
use by the community of small farmers. Biotechnology has been used to
speed the transfer of useful genes coding for resistance to pests and
disease, or higher tolerance in saline soils, temperature, or humidity
(Prance, 1997; Hajjar & Hodkin, 2007; Hodkin & Hajjar, 2008). The
introduction of genes in crop plants has been easier and more effective
when genes come from close relatives of the crop. Single-gene-controlled
traits introduced from CWR to crops through biotechnology methods have
provided virus resistance in rice, blight resistance in potato, powdery
mildew resistance in wheat, and nematode resistance in tomato (Maxted
et al, 2008). Hajjar and Hodgkin (2007) review the presence of CWR
genes in released cultivars of 13 crops of international importance (wheat,
cassava, millet, rice, maize, sunflower, lettuce, banana, potato, groundnut,
tomato, barley and chickpea).
Threats to CWR
Given that it is difficult to quantify genetic erosion, it is important to
identify the threats that could increase genetic loss in CWRs (Maxted et al,
2008). As part of biodiversity more generally, CWR are under increasing

4
threat from factors such as: deforestation, mining, habitat fragmentation,
urban expansion, introduction of exotic species, land clearing, changing
agricultural systems, overgrazing, over-exploitation by humans, climate
change, and inappropriate legislation and policy (FAO, 2010).
The threat of climate change to CWR is highlighted in a study
focusing on three important crop genera: Arachis (peanut), Solanum (e.g.,
tomatoes and potatoes) and Vigna (e.g., beans) (Jarvis et al, 2008). The
study predicts that 16–22% of species in these genera will become extinct
before 2055 due to climate change. While some species are affected by
habitat fragmentation, others (like potato) find disturbed environments
suitable for migration. In the same way, some species adapt more easily
to climate change than others. Arachis (peanut) is an example of genera
that is highly vulnerable to climate change impacts.
The first State of the World Report on Plant Genetic Resources
(FAO, 1998), estimated that since the beginning of the 1900s, about 75%
of the genetic diversity of agricultural crops has been lost. One reason that
the report highlighted is the widespread abandonment of genetically
diverse traditional crops in exchange for genetically uniform modern crop
varieties.

5
This change in practices is creating widespread loss of genetic
diversity. In addition, when there are natural disasters, war, or civil strife,
local seed availability may be severely diminished; seeds and other
propagating materials may be lost or eaten; supply systems may be
disrupted; and seed production systems may be destroyed (FAO, 2010).
Not only are the world’s plant genetic resources (PGRs) unevenly
distributed but so is the capacity to use them. Most developing countries
lack the infrastructure and breeders to improve crops with biotechnology
(Kowalsky, 2002).
International framework for CWR conservation
The importance of the conservation and sustainable use of CWR is
recognized in a number of international agreements and fora. The United
Nation’s Food and Agriculture Organization (FAO), through both its
Commission on Genetic Resources for Food and Agriculture and its
Global System for the Conservation and Sustainable Utilization of Plant
Genetic Resources for Food and Agriculture, is the international
organization that is involved in the international policy context of CWR
(FAO, 2006). The main objectives of the Commission are to ensure the
conservation and sustainable utilization of genetic resources for food and
agriculture, as well as the fair and equitable sharing of benefits derived
from their use, for present and future generations. The Global System’s
6
objectives are to “ensure the safe conservation, and promote the
availability and sustainable use of, plant genetic resources by providing a
flexible framework for sharing the benefits and burdens” (FAO, 2006a).
In 1991, the FAO Conference encouraged the production of a first
Report on the State of the World’s Plant Genetic Resources for Food and
Agriculture. One of the main conclusions of this report was the need for an
integrated approach to the conservation and utilization of the Plant
Genetic Resources for Food and Agriculture program (PGRFA) (FAO,
1998).
A new report, published in 2010, shows an increase in concern and
awareness for WCR conservation (FAO, 2010). There also has been an
increase in the ex situ conservation approach, with more accessions to
gene banks and exchange among them. The in situ conservation
approach now has more surveys and inventories of species since the first
report was published. This kind of conservation still occurs mainly in
protected areas, and less attention has been given to conservation in
places outside these areas. There is therefore a need to encourage
farmers and local communities to sustainably use their agricultural
biodiversity (better and more clear policies, legislation, regulations for in
situ and on-farm management) (FAO, 2010).

7
The Convention on Biological Diversity (CBD) defines agricultural
biodiversity as all components of biological diversity of relevance to food
and agriculture and that constitute agroecosystems: the variety and
variability of animals, plants and microorganisms at the genetic, species
and ecosystem levels, which are necessary to sustain key functions of the
agroecosystem, and its structure and processes (decision V/5 of the CBD,
1992). One dimension of agricultural biodiversity identified by the CBD
that is of relevance to CWR refers to genetic resources for food and
agriculture; these constitute the main units of production in agriculture,
including cultivated species, domesticated species, and managed wild
plants, as well as wild relatives of cultivated and domesticated species.
In its new 2020 targets, the CBD seeks to stop the loss of genetic
diversity of cultivated plants and wild relatives (CBD, 2010). At the same
time, strategies have to be created and implemented to “preserve the
genetic diversity of other priority socio-economically valuable species as
well as selected wild species of plants and animals”. In addition, both ex
situ and in situ conservation of wild relatives of crop plants and other
socio-economically valuable species should be improved inside and
outside of protected areas (CBD, 2010).
During the past decade, the parties to the CBD agreed that the
priority at this time lies in facilitating the implementation of the Ecosystem

8
Approach (EA) for all biodiversity conservation actions. The EA defines 12
principles related to the holistic management of land, water and living
resources, and provides five points of operational guidance (CBD, 2002).
As Azzu and Collette (2008) recognize, “it is important to conserve CWR
within the context of the ecosystem as a whole, given their important
contribution not only to ecosystem health and resilience, but in the
provision of essential ecosystem services.”
First conservation actions
Until the mid 1990s, the main method of agricultural biodiversity
conservation was the collection and storage of seeds in national and
international gene banks as part of an ex situ strategy. This strategy today
is recognized as limited but complementary to in situ conservation; it can
serve as a useful counterpart to in situ conservation as long as samples
can be protected from genetic contamination (Mulvany and Berger, 2003).
There are two main advantages of preserving a CWR ecosystem
rather than just an individual species ex situ. The first is that in situ
conservation allows the process of evolution by natural selection to
continue, and thus the species adapts to its current environment, even as
that environment is changing. Prance (1997) suggests that a second
advantage is the avoidance of the complicated technology used in the

9
large and sophisticated facilities devoted to ex situ conservation. In
addition, seed banks are most effective for seeds from temperate regions,
where a period of dormancy is natural. In the case of tropical seeds, some
plants have recalcitrant seeds and others do not even qualify as orthodox
or recalcitrant (Baskin and Baskin, 2001). Orthodox seeds can survive
drying and/or freezing when kept on ex situ facilities. On the other hand,
various CWR are native to rainforest ecosystems where most of the seeds
are recalcitrant (they do not survive drying and freezing during ex-situ
conservation).
The concept of in situ conservation of PGRs has been expanded to
include the maintenance of varieties and cultivars of crop plants in
agroecosystems (Azzu and Collette, 2008). Agroecosystems can maintain
their stability and ecological equilibrium with the help of human
communities that exchange seeds from local crops with CWR seeds and
let natural cross-pollination take place. In some countries, this practice is
part of tradition and cultural practice; the variety, production, storage and
exchange are components of a dynamic agro-ecosystem. This system
becomes an important source of seeds for food crops for small farmers in
developing countries (Damania, 2008; Louette, 2000; Almekinders et al
1994).
10
Global Environment Facility (GEF) Project on CWR. In 2004 the
Global Environment Facility (GEF) decided to implement a project focused
on the in situ conservation of CWR in five countries. The three main
factors they considered when choosing the countries were: whether the
country had high levels of native biodiversity; whether the country had
more than five CWR species of world importance; and whether the country
had a high poverty level. Armenia, Bolivia, Madagascar, Sri Lanka and
Uzbekistán were the countries chosen (VBRFMA, 2009). The main
objective of this project was to build a database on the in situ distribution
of CWR in these five countries.
After six years, the project outcomes include an international
information system that supports the conservation of CWR in different
countries. An increased awareness of the need for safe and effective
conservation of CWR and their availability for crop improvement in these
five countries is the other outcome of this project (UNEP-GEF, 2008).
In Bolivia, the participating institutions synthesized information from
different sources and did fieldwork. Using the information included in gene
banks for the selected species, botanists in Bolivia made new collections
in the areas registered in the accessions notes from the gene bank. They
also added, whenever possible, new distribution points for species. They
identified 195 species of CWR from 17 genera (Anacardium, Ananas,

11
Annona, Arachis, Bactris, Capsicum, Chenopodium, Cyphomandra,
Euterpe, Ipomoea, Manihot, Phaseolus, Pseudananas, Rubus, Solanum,
Theobroma y Vasconcellea). Among the final products of this project was
the Red Book of CWR in Bolivia (Mora et al., 2009), and geo-referenced
maps containing the locations where species were collected.
Given this background, my overarching question is: What are the
opportunities for, and barriers to, conservation of CWRs in Bolivia,
particularly with respect to potato, peanut and quinoa?
Objectives
My first objective for this project was to identify regions in Bolivia
and rated them according to their potential for successful programs of in
situ conservation of wild crop relatives. In particular, I analyzed areas
according to the following criteria:
a) The prevalence of CWRs.
b) The impacts of climate change, land use change, population growth,
and economic development on the continued viability of CWRs in an area.
c) The socio-political and economic conditions that might impede or
facilitate successful conservation programs and outcomes.

12
My second objective was to use this information to elaborate a set
of recommendations that can promote the implementation of future
conservation projects for WCR’s in Bolivia.
The study took into account the distribution area of 3 species in
each of 3 genera, for a total of 9 species. To identify the opportunities, I
used the municipality division as my area of analysis since the data is
available in this scale. This also made it easier to identify if certain
municipalities would have potential interest in CWR conservation projects.
The analysis used primarily geographical information system tools to
identify the relationships between different factors analyzed in this study.
In order to understand why I chose my area of analysis and variables,
it is important to review some information about the Plurinational State of
Bolivia. In the next part I will describe some socio economic factors and
ecological features of the country.
Plurinational State of Bolivia – General Framework
The Plurinational State of Bolivia (Bolivia) is the fourth poorest
country in South America with a gross domestic product per capita of
$14, 715 (USD). There is a population of approximately 10,227, 299
habitants and a low density of 21.8 habitants per square mile (INE, 2007).

13
The main exportation products are: natural gas, zinc, gold, silver, soybean
and sugar (WB, 2011). The country is divided politically into (in order of
decreasing size) departments, provinces, municipalities and cantons.
Bolivia is also classified as a megadiverse country. Located
between the Andes and the Amazon, it has 22 different eco-regions. The
Chiquitano Dry Forest is the only endemic eco-region of Bolivia (Ibish &
Mérida, 2004). The 22 eco-regions are grouped into 3 main regions: The
high Andean region and altiplano, the eastern Andean slopes and inter-
Andean valleys, and the lowlands (Ibish & Mérida, 2004).
- The Andean region covers 28% of Bolivia. It is characterized by
high montane tropical vegetation. Elevation varies from 3,200 to
7,000 m. Monthly temperatures range from < 0 to 10°C.
- The Eastern Andean slopes and Inter-Andean valleys cover 13% of
Bolivia and are mainly composed of valleys and Yungas (the
Andean per-humid forests on the northeastern slopes of the
Andes). The average altitude is 2,500 m. Monthly temperatures
range from 15 to 25°C. This area is characterized by its agricultural
activity.
- Lowlands cover 59% of Bolivia. The altitudes range from 100 to
1,000 m, and extend from the humid Amazonian forest of Pando to
the dry Chaco forests in the southeast of the Santa Cruz and Tarija
departments. Monthly temperatures range from 23 to 28°C.

14
Fig 1. Bolivia - Political division and ecosystems.
Political situation. As a result of the colonial regime, indigenous
people were marginalized for many decades until 1952, when the first
Agrarian Revolution took place. Since then, indigenous groups have
increasingly participated in the political life of the country and demanded
recognition of their rights to land and natural resources management.
However, many of the political parties that first promised to listen to these
demands later neglected them (Do Alto, 2007).

15
The 1990’s brought a new set of regulations, with the introduction
of the Neoliberal model for all policies and environmental rules. The
government signed many international treaties, and welcomed the
cooperation of international agencies like Conservation International (CI)
or World Wide Fund for Nature (WWF). The first Department on
Environmental Issues in South America was established together with the
environmental legislation; in addition, the Natural Protected Areas System
emerged as a priority in Bolivia’s national policy.
For the past decade, Bolivia has experienced a set of changes in its
political organizations and social movements. The transition was from a
model where the central government had total control of all management
in the country, to a more decentralized model, where smaller scale
governments (municipalities) have new responsibilities and duties. These
changes are the product of regulations from international agencies like the
World Bank (WB) and the International Monetary Fund (IMF), but also
from different social movements that emerged out of the class struggle.
The most recent change of political parties in the central
government brought some additional changes to the environmental field.
The new Constitution recognizes that all natural resources are the
property of the nation and that any economic activity related to them
should benefit Bolivians and their social development. Indigenous groups

16
are legally recognized and moreover, their ownership of the natural
resources they use is recognized. The second Agrarian Revolution started
in 2008 and intends to distribute land to all indigenous groups in Bolivia.
In this political environmental context, implementing conservation
projects for WCR is an alternative way for rural communities in Bolivia to
act as stewards of their resources and potentially be economically
compensated.
Municipalities as analytical unit
Bolivia is divided into nine departments and each one is further
divided into provinces. Each province is divided into municipalities and
these are also divided into cantons. In total, Bolivia has 332 municipalities.
The decentralization process empowered municipalities over provinces,
giving them the chance to administrate and execute their projects with
state funds or international aid.
Murphree (2005) mentions five principles for policy-making in the
CAMPFIRE project executed in Zimbabwe. One of these principles
remarks on the importance of considering a smaller scale where more
efficiency can be achieved through communal resource management,
where members can have meetings face to face and enforce conformity

17
through peer pressure. Hence, I considered the municipality as the
appropriate scale of analysis in my project; it is small enough to allow
focused and context-sensitive resource management, and has the political
legitimacy to do so. In addition, many of the data required for my analysis
are available at the level of the municipality.
Aside from the improvement of their crops and land races to resist
disease outbreaks and climate change, there are other benefits that the
municipality can obtain from promoting the conservation of WCR’s. There
may be certain intellectual property rights they can claim, or they may be
able to market certain genetic properties that could confer benefits on
more distant crop complexes. Aguilar (2001) describes how some
indigenous communities in Peru and Ecuador have received legal
assistance from US universities, who are paying royalties to use their
knowledge and the variety of crops they domesticated and registered
under international intellectual property rights treaties.
Bolivia and the CWRs
The use of CWR in Bolivia is diverse. Mostly these wild relatives
are used to enhance the quality of traditional crops, by making them pest
or disease resistant, or by giving them additional nutritional properties.
Some communities use CWR as a direct food product, using them an

18
alternative to satisfy their nutritional needs. However, increasing problems
like land use change, road construction, and human population migration
may represent a threat to the ecosystems that shelter these CWR, and
thus to the CWR themselves (Hunter, 2008). In the State of the World’s
Plant Genetic Resources for Food and Agriculture report from 2010,
Bolivia reported 38 underutilized CWR species for which various
conservation activities were taking place, but little full-scale breeding
(FAO, 2010).
Until the execution of the GEF project on CWR, there was little
effort to try to conserve these resources in situ, with more emphasis on ex
situ conservation. PROINPA Foundation (Fundación Promoción e
Investigación de Productos Andinos – Research and promotion of Andean
products) and AGRECOL Andes (Agricultura y Ecología; Agriculture and
Ecology) are two national institutions that have worked on projects related
to WCR. PROINPA started during the 90s to build gene banks for tubers
and other Andean roots as well as for quinoa and other Andean grains.
These gene banks also worked with rural communities and introduced the
idea of local gardens for some crop varieties and also some CWR that
were used for breeding new crops (Rojas, et al. 2001; Terrazas et al,
2005; Garcia and Cadima, 2003).
19
AGRECOL Andes has noted the importance of CWR both for
breeding new crops adapted to specific climates and soils, and for use as
food sources. AGRECOL Andes has promoted different local seed
exchange events among local producers and workshops focused on
techniques to improve the use of traditional crops (IFOAM, n. d.; APECO,
2005).
In the remainder of the thesis I will cover in Chapter 2 the
methodology I used and the reason why I chose the variables I chose.
Chapter 3 covers the results. Chapter 4 is a synthesis of the results,
where I summarize for each of my species the state of each municipality
according to the variables I have considered. Chapter 5 and 6 cover
conclusions and recommendations.

20
Chapter 2
METHODS
Assessment for CWR conservation
The new targets set by the CBD in 2010 (CBD, 2010) suggest that
in order to decrease the loss of genetic diversity of crop and other wild
species of plants conservation programs for in situ conservation of crop
and selected wild species should be included in national biodiversity
strategy and action plans. The State of the World’s Plant Genetic
Resources for Food and Agriculture (PGFRA) report suggests that in order
to achieve an effective conservation of PGRFA in areas that are not
protected, social and economic issues must be addressed (FAO, 2010).
The assessment of threats to, and conservation status of, CWR has
often been neglected (Maxted et al 2008). CWR are a public good and
their conservation has a strong link with public institutions focused on
natural-resource management and conservation, and the need to build
awareness of and support for conservation in society. Therefore
governments should include conservation strategies in their national
plans. Sometimes these national strategies and action plans are
developed in or borrowed from different countries, however, and hence
pay little attention to local contexts. Alcorn (2005) suggests that

21
conservation projects should take a closer look at cultural habits, function,
and shape of communities closely related to the conservation of certain
species or ecosystems.
During this study I did an assessment of the effects of certain
threats to selected crop wild species, and also assessed the social and
economic conditions that might contribute to successful conservation
projects.. There is no established methodology for conducting this kind of
assessment, but I used the literature, including experiences from past
conservation projects, to assess threats and opportunities that can have
an impact on the conservation success of the selected species. In the next
part I will explain how I selected the species, and the threats and
opportunities included in my analysis.
Selected species
For the purpose of this thesis, I decided to concentrate my analysis
on 9 species selected from a project executed in Bolivia by the
Government with financial support of GEF. The GEF-supported project on
CWR increased interest in the in situ conservation of CWRs in Bolivia, and
was the first step in generating a detailed taxonomic list and distribution of
collection points for CWR in the country. The geographic information for
22
some ex situ samples was also verified in the course of the GEF-
supported project, providing new distribution information for the species.
More research has been done with three genera (potato, peanut and
quinoa) than any others in Bolivia. This was the main reason to choose
these genera for this study.
In Bolivia, most CWRs have no direct commercial use per se,
although they are often used at the local level. For instance, in the north of
Potosí, some wild varieties of quinoa produce a black grain that is used
locally by producers to make crackers. In Cochabamba, some wild potato
relatives that are known locally are used in food preparation. Some wild
species of peanut are used as food for farm animals (Mora et al, 2009).
Until recently, there were no urban or distant markets for these resources.
Without commercial markets, CWR conservation is often less attractive to
peasants and farmers, who prefer to invest in crop production that yields
greater economic benefit, or other activities that yield a return, such as
mining. More recently, there has been some attempt by companies and
NGOs to try to create markets for CWR products, though progress has
been slow (AOPEB, 2011).
The GEF-supported project rules precluded access to all data
collected for all CWR species in Bolivia and also restricted the number of
species per genus for which I was entitled to have data. In coordination
with project administrators, it was determined that I would have access to

23
all the collection-point data for three species from each of the three genera
of interest. Distribution of these 3 genera covers parts of the Andes, Inter-
Andean and valleys, and lowlands region. The species chosen had at
least two described potential uses, like resistance to some plant disease
or insects, tolerance to temperature or precipitation change, or as food or
medicine. This information was retrieved from the Red Book of crop wild
relatives from Bolivia (Mora et al., 2009).
A second variable considered in selecting the target species was
the percentage of land in each municipality housing the species that is
registered with clear property rights. For this part of the analysis, images
with information on land tenure process were used and later mapped onto
geo-referenced municipalities. In order to have species that represent
three levels of established property rights, the following were selected:
1. One species whose range encompassed an area with a high
percent of land registered (50% to 100%)
2. One species whose range encompassed an area with a moderate
percent of land registered (20% to 50%)
3. One species whose range encompassed an area with a low
percent of land registered (0 to 19%)
IUCN risk category was not a variable used for choosing any of the
species, as all are under some level of threat category according to the

24
Red Book (Mora et al., 2009). Below I give a brief description of each of
the species selected.
1) Peanut (Arachis sp.)
Arachis hypogea. In Bolivia, wild species of peanut are distributed
in lowlands of the Chaco region, which includes departments of
Chuquisaca, Santa Cruz and Tarija. All wild peanut species have a
characteristic that makes them vulnerable to disturbance. They are all
geocarpic (plants that fruit below ground) and this limits their seed
dispersal. Therefore, their distribution is limited. In general, wild peanut
relatives, unlike the domesticated peanut crop, have a preference for dry
to sub-humid habitats, sandy soils, open spaces in the middle of
chaqueño dry woodland1 or cerrado type forests. It is possible to find them
as part of weed communities, on roadsides, and clearings (Atahuachi &
Guzmán, 2008).
Atahuachi and Guzmán (2008) created a summary of the
taxonomy, distribution and ecology of peanut WCR. They found 20
species of wild peanut in Bolivia, of which 12 are endemic to the country. I
1Chaqueño dry woodland is composed of low forests, schrubs, dry savannas, and humid soils that cover the mountain range and part of the Chiquitania in Santa Cruz, Chuquisaca and Tarija. Its altitude is between 300 m and 600 m close to the bottom of Andean mountains (Killen, et al, 1993).
25
reviewed the ones described in the Red Book and chose the following
based on my criteria above:
Arachis batizocoi. This wild peanut species grows in open areas
in “soto” forest (forest composed of young trees, shrubs and weeds). This
species prefers well-drained sandy soils and mountainous habitats with
soils derived from sandstone (Atahuachi, 2009). This species is housed in
municipalities with well established land tenure. This species is resistant to
drought and also resistant to diseases such as early spot (Mora et al,
2009).
Arachis duranensis This wild peanut species grows in open
areas, as a roadside weed, and, less frequently, on the edge of “soto”
forest. The area where it is found is a transitional biographical strip
between Chaco and the Bolivian-Tucuman area, with a dry tropical
bioclimate (Atahuachi, 2009). This species is found in municipalities with
moderate amounts of land registered in the tenure process. A. duranensis
is drought tolerant and resistant to rust. It is considered an ancestor of the
tetraploid species Arachis hypogeaea and A. monticola (Mora et al, 2009).
Arachis ringonii. This wild peanut species apparently used to
grow on sandy soils in the streets of the city of Santa Cruz. The species
reported in the Red Book were found in house gardens (Atahuachi, 2009).

26
It seems that urban development is the main threat to this species, as land
is used for housing and roads are paved. This species is found in
municipalities with relatively low amounts of land registered in the tenure
process. It is important for its capacity of inter-species crosses and the
hybrids produced have high fertility (Mora et al, 2009).
2) Potato (Solanum sp.)
Solanum tuberosum is the crop we know as potato. The crop is
best adapted to cool climates such as the tropical highlands with mean
daily temperatures between 15 and 18°C as encountered in its center of
origin, the mountains of South America. Higher temperatures favor foliar
development and retard tuberization (Ewing and Struik, 1992). Lower
temperatures would hamper early plant development (Haverkort, 1990).
According to Patiño et al (2008), there are 34 wild species of potato
in Bolivia, of which 21 are endemic. Some of these species are distributed
over large areas, while others are only found locally. These latter species
are identified as being vulnerable to the expansion of agriculture and
urban borders, as well as to changes in temperature and precipitation
regimes. Below is a brief description of the three species chosen for this
genera.

27
Solanum alandiae. This species prefers disturbed areas near
cropland. It is common on the edge of streams and riverbanks and grows
in the inter- Andean valleys (Patiño, 2009). This species is found in
municipalities with a relatively high percentage of land registered in the
tenure process. It is important for its resistance to potato wart disease, soft
rot and flea beetles (Mora et al, 2009).
Solanum boliviense subsp. astleyi. This species is found in the
upper montane ecological belt. It grows in zones with stony soils where
small tree species, shrubs, and cacti grow (Patiño, 2009). This subspecies
is found in areas with relatively little land registered in the tenure process.
This subspecies is resistant to pathogenic fungi, to bacteria, bacteria wilt,
and a virus (PVY). It also has resistance to beetles, flea beetle, and
nematodes, and frost (Mora et al, 2009).
Solanum gandarillasii. This species is associated with thickets of
short trees or “soto” forest species or with xeric forests. It is found to grow
on poor hard, dry clay soils (Patio, 2009). This species is found in areas
with moderate amounts of land registered in the tenure process. It is
drought resistant and resistant to attack by insects such as tarnished plant
bug (Mora et al, 2009).

28
3) Quinoa (Chenopodium sp.)
Quinoa is well adapted to the low temperatures occurring on the
Andean Altiplano. The seeds are likely to germinate rapidly even at low
temperatures (Bois et al, 2006). Most wild species are found in the high
Andean region, where they are found among potato, wheat, tarwi, corn
and faba bean crops. They are also associated with grassy and
herbaceous patches. In the valley region, they are also found in the middle
of herbaceous vegetation where soils are semi-humid and dry in the
middle (Rojas et al, 2008).
Chenopodium hircinum. This species is found in the xeric
semiarid Puna region in the middle of fields of potato and barley. Its
habitat is foothills on dry saline soil rather than the hillside or near the salt
flats (Mamani et al, 2009). There is a relatively low percentage of land
registered in the tenure process in areas where this species is found. Its
leaves and grains are widely used in cooking by rural inhabitants. It is
used also as a medicinal plant (Mora et al, 2009).
Chenopodium hircinum subsp. eu-hircinum. This subspecies
grows in the middle of fields of cultivated potato, barley, and maize. These
crops can be on plains or hillsides. In the valley regions, the species is
found in “soto” forest (Mamani et al, 2009). Land tenure is well established

29
in areas where this species is found. This species is used for cooking and
seems to have a resistance to drought (Mora et al, 2009).
Chenopodium hircinum subsp. catamarcensis. This species is
found in fields where potato, regular quinoa, “oca”, “izaño”, maize, barley,
and vegetables grow. These crops are found in plains, hillsides and valley
bottoms where soils are dry and lack irrigation (Mamani et al, 2009). This
species covers an area with medium land tenure. The uses are mainly for
cooking and as a medicinal plant (Mora et al, 2009).
Selection of municipalities
After selecting the species, I obtained the original shape files with
the collection points for the GEF project. These files come only with the
geo-referenced points. To create approximate range maps for each
species, I used an ArcGIS tool, developed at Kew Botanical Gardens,
called the Conservation Assessment Tool – CATS (Moat, 2007). This tool
is the same as that used in the Red Book of CWR for Bolivia (Mora et al.,
2009). Given the distribution points of a single species, the tool identifies a
polygon that encompasses all distribution points. This is the species
distribution area. For each point, the CATS tool finds the relation between
each point and delimits the polygons for subpopulations of the species.
30
This last variable is called the Rapoport area. I used these polygons that
represent the subspecies distribution area and found which municipalities
where in these areas. I did not use other areas calculated with CATS as
topography in Bolivia is diverse and species distribution is heterogeneous
in this geography. In total, 93 municipalities were selected (many housing
more than one species). For the quinoa species I had to apply another
vegetation filter. This species grows in an altitude range over 2600 m. and
covers Inter-Andean valleys. This part of the country is not flat and
vegetation is grouped in different patches according to their requirements.
Quinoa usually grows in association with particular types of vegetation.
Therefore, once I had the distribution areas, I used a vegetation map to
overlay over these areas. Then I used the intersect tool, so only the
vegetation that was associated with the distribution points that was inside
the Rapoport area (subspecies), could be selected. This reduced the
number of municipalities considered for quinoa.
Below, I introduce the indicators I used to represent threats to each
species, as well as those used to indicate the municipalities where social
and economic conditions might prove favorable to conservation projects. I
end with a summary table indicating the relationship between each
indicator and potential conservation outcomes.
31
Potential Threats to CWR
Ideally, I would have included in this analysis information on
deforestation, fires, and land use change, because these are important
threats to the status of CWR. These data, however, were not available in
the needed formats. I therefore focused on threats from climate change,
mining concessions, oil concessions, and population growth (as a proxy
for land-use change and disturbance).
Climate change. The challenges caused by temperature and
precipitation regime changes around the world are a good reason to look
for crops that are resistant/tolerant to these variations, or have broad
enough climatological ranges that they can continue to persist in at least
part of their range even under climate change. Jarvis et al (2008)
concluded that some CWR are more vulnerable than others to climate
variations, such as temperature increase and precipitation decrease.
Some wild potato relatives can actually benefit from predicted climate
changes.
I assumed the distributions for my target species were determined
by temperature and precipitation requirements, and used the areas of their
distributions to determine the range of temperature and precipitation
regimes in which the species could persist. Climate data came from 26
32
weather stations distributed throughout Bolivia, and extended from 1994 to
2009. For temperature, the monthly average was used to calculate the
annual average and then the 15-year average. I did the same for
precipitation.
Using the analyst tool from ArcGis, I used the nearest neighbor
interpolation tool to produce a map with the temperature and precipitation
ranges in the country. By overlapping the area of distribution for each
species, it was possible to establish the boundaries for temperature and
precipitation for each one of the species and then compare that with the
expected climate changes in different regions.
I then reviewed climate-change predictions for South America, and
chose the one produced by Urritia and Vuille (2009). Their model was the
only one adapted to the Andean mountain chain and its influence on
climatological outcomes for the rest of the continent (Table 1).
After I produced the maps with current temperature and
precipitation distribution. I calculated the temperature and precipitation
range for each species. I then determined future climate conditions in
each of the municipalities, and identified those where the new temperature
or precipitation regimes were assumed to fall outside of the species’
tolerance.

33
Table 1.
Climatic model for tropical Andes – Simulations for the end of the 21st century (Urritia, R. & Vuille, M. 2009)
Model Scenario Variations Temp Rain Notes
Hadley
Centre
Regional
Climate
Modeling
System
Precis
(HadRM3)
RCM-A2
RCM-20C
A2 has
higher
temperatur
es than B2
T increase
2-4°C
depending
place. B2
PP.
increase
south of 0
°S except
the Andean
region
West Slope
Increase
1.5°C
Eastern up
decrease
- 0.8°C
Eastern low
decrease
-0.6°C
West slope
(-50mm)
East up
220 mm
East down
(-380mm)
Year
projections
2071–2100.
South
America
10°NA27°S
and
86°WÀ44°W
50km x
50km
Mining activity and oil concessions. One of the major economic
pillars in Bolivia is the extraction of minerals and petroleum. In 2008,
mining activity contributed 54% of the country’s GDP, with the extraction
of hydrocarbons contributing 11.34% (INE, 2008).
Both activities can produce landscape and environmental effects
that negatively impact species, including CWR. Mining activity alters soil
characteristics (density, texture, carbon levels, pH), and also causes water

34
pollution (Indorante et al, 1981; Adler et al, 2007), among other things. At
the same time, both mining and oil extraction often provide more
economic resources than agricultural activities, and may cause a net loss
of the agrarian labor force. This may further erode support for
conservation of wild crop relatives.
The hypothesis for this variable is thus that municipalities with more
mining/oil concessions will pose greater threats to CWR, both in terms of
destruction of resources and habitat, and in terms of lower interest in
conservation status. Nationwide data on mining and oil concessions are
available for 2006 and 2001, respectively. (Super Intendencia de
Hidrocarburos, 2001, SERGEOTECMIN, 2006).
Population. Most environmental assessments that analyze the
sociopolitical situation of a region to evaluate or measure the impact of a
certain project include population. Some places of biodiversity interest are
under pressure from population density and growth; growing populations
co-opt more resources and accelerate land-use change (USAID, 2005).
Some publications reflect that a reduction in rates of population increase
can promote environmental sustainability (Saito & Spurling, 1992;
Stedman-Edwards, 1997). Population dynamics can have different effect
over different ranges. For example in some areas with low population
35
density, increases in population may present an opportunity for
conservation of CWR species, both because some species prefer slightly
disturbed habitats, and because they can thrive in home gardens or under
the stewardship of agrarian populations.
This variable was analyzed using the population growth rate from
1992 to 2001 and the population density in 2001 (INE & PNUD, 2005). For
each species, the analysis was done using a dispersion graph, with
population growth rate on the Y-axis, and population density in 2001 on
the X-axis. Each point represents the situation in each municipality where
a particular species is present. I analyzed each dispersion graph for
positive, negative, or neutral impact on the species based on its growth
preferences. For instance, for a species that requires significant amounts
of undisturbed habitat, high population density and/or high population
growth rates are considered a threat. For a species that requires moderate
amounts of disturbance to persist, the extremes of both population density
(very high or very low) and growth rate (very high or very low) were
considered detrimental to survival. See Tables 3-5 for the analysis for
each species.
36
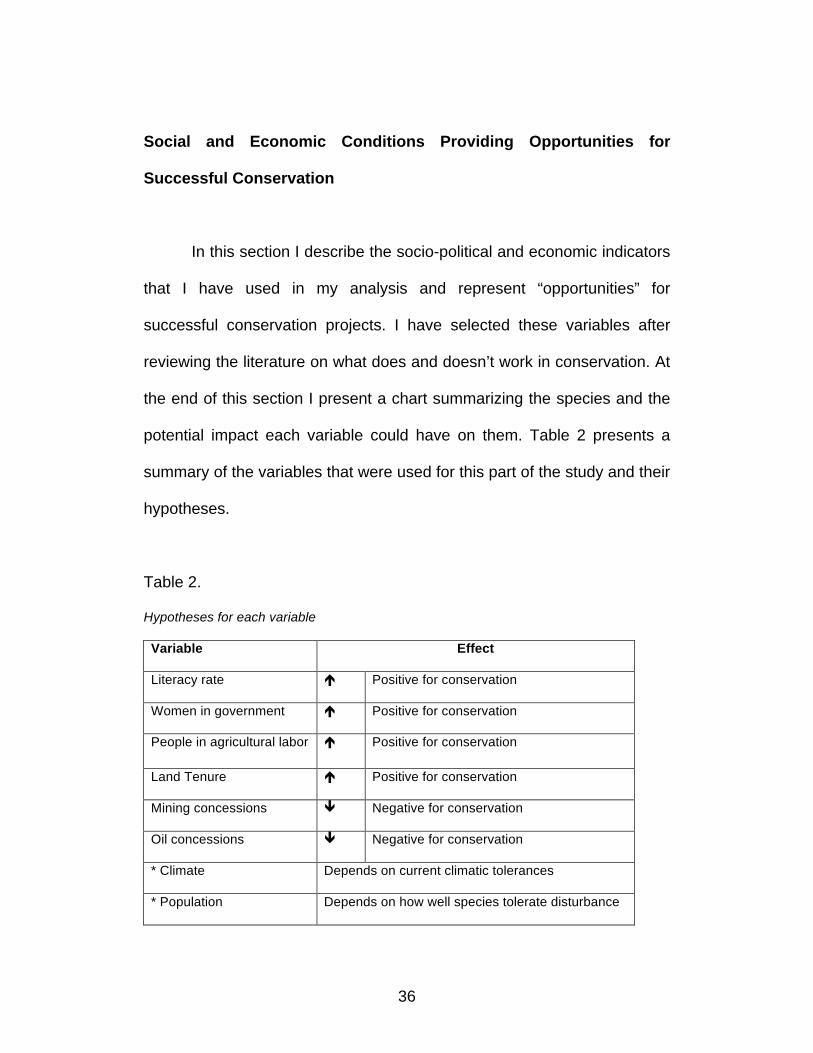
Social and Economic Conditions Providing Opportunities for
Successful Conservation
In this section I describe the socio-political and economic indicators
that I have used in my analysis and represent “opportunities” for
successful conservation projects. I have selected these variables after
reviewing the literature on what does and doesn’t work in conservation. At
the end of this section I present a chart summarizing the species and the
potential impact each variable could have on them. Table 2 presents a
summary of the variables that were used for this part of the study and their
hypotheses.
Table 2.
Hypotheses for each variable
Variable Effect
Literacy rate Positive for conservation
Women in government Positive for conservation
People in agricultural labor Positive for conservation
Land Tenure Positive for conservation
Mining concessions Negative for conservation
Oil concessions Negative for conservation
* Climate Depends on current climatic tolerances
* Population Depends on how well species tolerate disturbance
37
Literacy Rate. Communities with basic education (people can read
and write) can improve their ability to design, participate in, and execute a
conservation project (Murphree, 2005; Wilson 2005), and to determine the
relative benefits of each project. With some external financial support, they
can also systematize their knowledge and implement it in a conservation
strategy (Colchester, 1995; Wilkie et al, 2006). Education can also
strengthen evaluation and feedback processes. Some communities could
even claim intellectual properties for their traditional knowledge or their
crop varieties obtained from CWR’s. Basic education would help them to
understand and manage these intellectual properties systems and
international rules.
The hypothesis for literacy rate is the same for all species
considered; conservation outcomes are assumed to improve as literacy
rates increase. The data on literacy rates are taken from the last census in
2001 (INE & PNUD, 2005). Using ArcGis, I created a map for this variable.
Women involved in local government. Gender equity can be an
indicator of social justice in particular locations. High levels of women
participating in local government could reflect the right to participate at all
levels of the policymaking process, the right to self-representation and
autonomy and the right to political, economic and cultural self-
determination (Brechin et al, 2002). With the new decentralization model

38
in Bolivia, each local government should allow women to participate as
representatives in the management or governance process.
The World Bank supports projects that include gender equity. For
example, it takes into account the local mores such as whether women
can be in the presence of unrelated men (Gross et al, 2001). Women are
also often the stewards of CWRs. While men usually take care of
commercial domesticated crops and are concerned with increasing
production, women (either as individuals or in groups) often preserve wild
varieties and seeds for food security (Shiva, 1999; PROINPA n.d. and
FAO, 2010).
My hypothesis is that more women participating in local
government leads to more positive conservation outcomes. Data on
gender distribution in local governments are available from the last
election in 2010 (ACOBOL, 2010). These data were mapped for each of
the 93 municipalities.
People involved in agricultural activity. Traditional agriculture
often depends on crop diversity, and smallholders often plant different
species and varieties of crops in different spatial and temporal cropping
systems to reduce risk and ensure stabilized yields (Altiere & Merrick,
1988; FAO, 2010). As farms and output grow, however, this pattern of
39
heterogeneity on the landscape can give way to greater homogeneity and
extensive monocultures. In general, I hypothesized that the higher the
percent of the labor force engaged in agricultural activities, the higher the
likelihood that the populace would see the value of conservation activities
devoted to CWR. The exception was extensive large-scale,
commercialized agricultural production, which I took to have a negative
impact on many CWRs.
The last two censuses report the two main working groups for each
municipality. Crop-based agricultural workers are aggregated with those
raising cattle or other livestock, and with those working in fisheries. The
data used are from the last census in 2001 (INE & PNUD, 2005). Again, I
mapped the percent of people working on agriculture for each of 93
municipalities.
Land Tenure. One of the objectives of the present government is
to grant land tenure to all national citizens with a legitimate claim.
According to Wells et al (1999), Murphree (2005), and Borrini-Feyerabend
and Tarnowski (2005), possessing rights to land and its resources by law
promotes the interest and participation of communities and local
governments in conservation projects. For example, Gartlan (2004)
compared 2 projects in Cameroon and concluded that biodiversity
40
conservation projects cannot succeed where there is ambiguity and
antagonism over land tenure.
The hypothesis for land tenure is: municipalities with more land
under ownership have more interest in engaging in conservation projects.
The data available have been collected from 2006 to 2009 (INRA, 2010).
Following I summarize the hypotheses for each genera. Some
variables have the same hypotheses for all the species (table 3, 4 and 5).

41
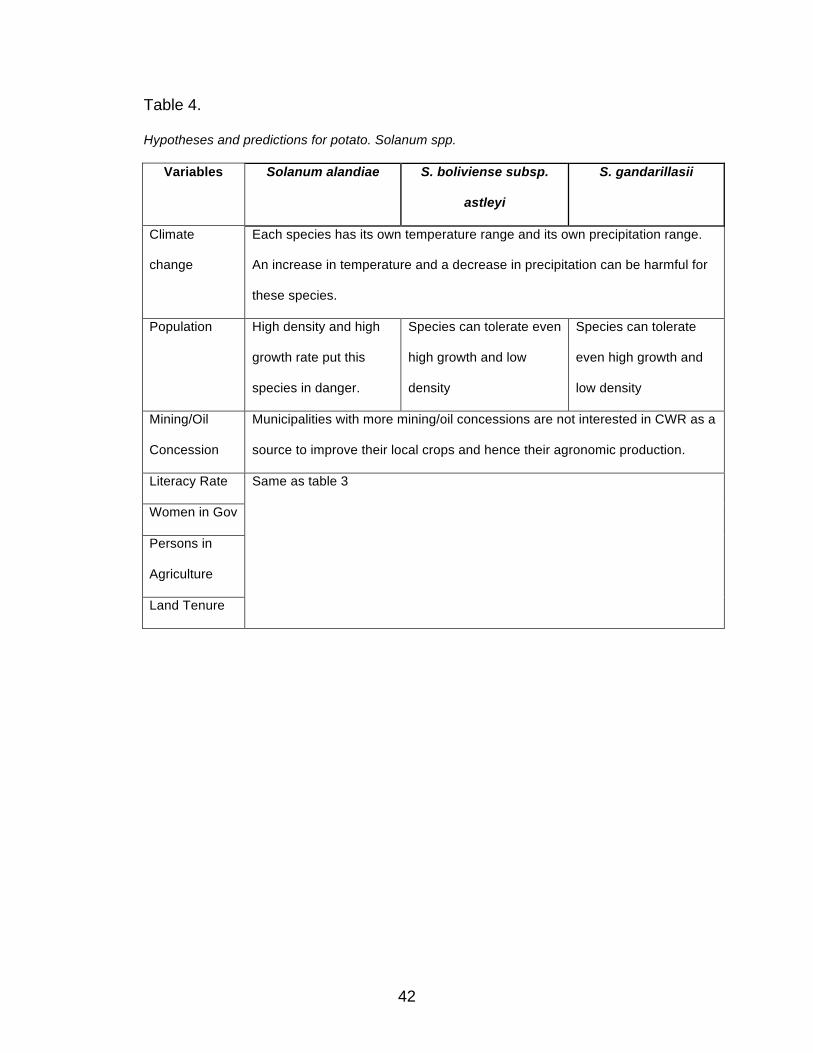
Table 3.
Hypotheses and predictions for peanut. Arachis spp.
Variables Arachis batizocoi A. duranensis A. rigonii
Climate
change
Each species has its own temperature range and its own Primary threat to
these species is an increase in precipitation.
Population Species can tolerate
moderate disturbance
(moderate density and
growth combinations).
Species can tolerate
moderate disturbance
(moderate density
and growth
combinations)
Species requires
relatively low
disturbance.
Mining/Oil
Concession
Municipalities with more mining/oil concessions are not interested in CWR
as a source to improve their local crops and hence their agronomic
production.
Literacy Rate
Higher rates of literacy are assumed to be beneficial to conservation
outcomes.
Women in Gov Higher levels of women participating in local government are assumed
beneficial for conservation outcomes
Persons in
Agriculture
More people involved in agriculture activities have more interest in
alternatives to improve their crops, as well as to open new markets in urban
areas. For peanut, there can be a threat in terms of producers where
commercial landowners are involved.
Land Tenure A higher percent of land with property rights is positive. However, if
category of use is for commercial cropland, there is a threat.
42
Table 4.
Hypotheses and predictions for potato. Solanum spp.
Variables Solanum alandiae S. boliviense subsp.
astleyi
S. gandarillasii
Climate
change
Each species has its own temperature range and its own precipitation range.
An increase in temperature and a decrease in precipitation can be harmful for
these species.
Population High density and high
growth rate put this
species in danger.
Species can tolerate even
high growth and low
density
Species can tolerate
even high growth and
low density
Mining/Oil
Concession
Municipalities with more mining/oil concessions are not interested in CWR as a
source to improve their local crops and hence their agronomic production.
Literacy Rate
Women in Gov
Persons in
Agriculture
Land Tenure
Same as table 3

43
Table 5.
Hypothesis and predictions for quinoa species. Chenopodium spp.
Variables C. hircinum C. hircinum subsp.
catamarcensis
C. hircinum subsp.
eu-hircinum
Climate change An increase in temperature and a decrease on precipitation can be
harmful for these species.
Population Species can tolerate even high growth and low density. High density and
high growth rate put these species in danger.
Mining/Oil
Concession
Literacy Rate
Women in Gov
Persons in
Agriculture
Land Tenure
Same as table 3

44
Chapter 3
RESULTS
Following, I will present the results for each of the variables in the
same order I presented them above, in methods. After each variable
general introduction, I will include then the results for the species. The first
two variables results are presented in charts or for population in dispersion
graphs. The rest of the results are presented in maps where the positive
values are shaded in black. The negative values will be presented in
white, and a light green color is used for the areas where no data was
obtained or generated. The other images produced in this thesis are
located in the appendix section.
Climate change
I extracted the list of municipalities that would suffer an
increase/decrease of temperature and precipitation (in percent) compared
to the values that were found for each species range. Some of the
municipalities will have an increase or decrease only in the temperature or
the precipitation, not necessarily both of them. The following charts show
the results of this comparison.

45
Peanut species and climate change In the following table (6) the ranges for each of the selected species
for peanut are given. This were used to identify the municipalities that
have projected average temperature or average precipitation that would
fall outside of a species current tolerance.
Table 6.
Tolerable temperature and precipitation range for peanut species
Variable Arachis batizocoi A. duranensis A. rigonii
Climate
change
Temperature range from
20.62 to 23.63 °C
Precipitation range is
from 240 to 849 mm.
Temperature range
from 22.50 to 24.79 °C
Precipitation range is
from 702 to 849 mm.
Temperature 25.13 °C
Precipitation average is
450 mm.
There is a decrease in temperature in the Lowlands of –0.6 °C.
While this doesn’t appear (using this simple analysis) to affect the
distribution of Arachis batizocol (only three municipalities out of 10 are
affected), it does threaten Arachis durenensis (Entre Rios) in one of its six
municipalities, and A. ringonii in the only municipality in which it exists
(Santa Cruz).
46
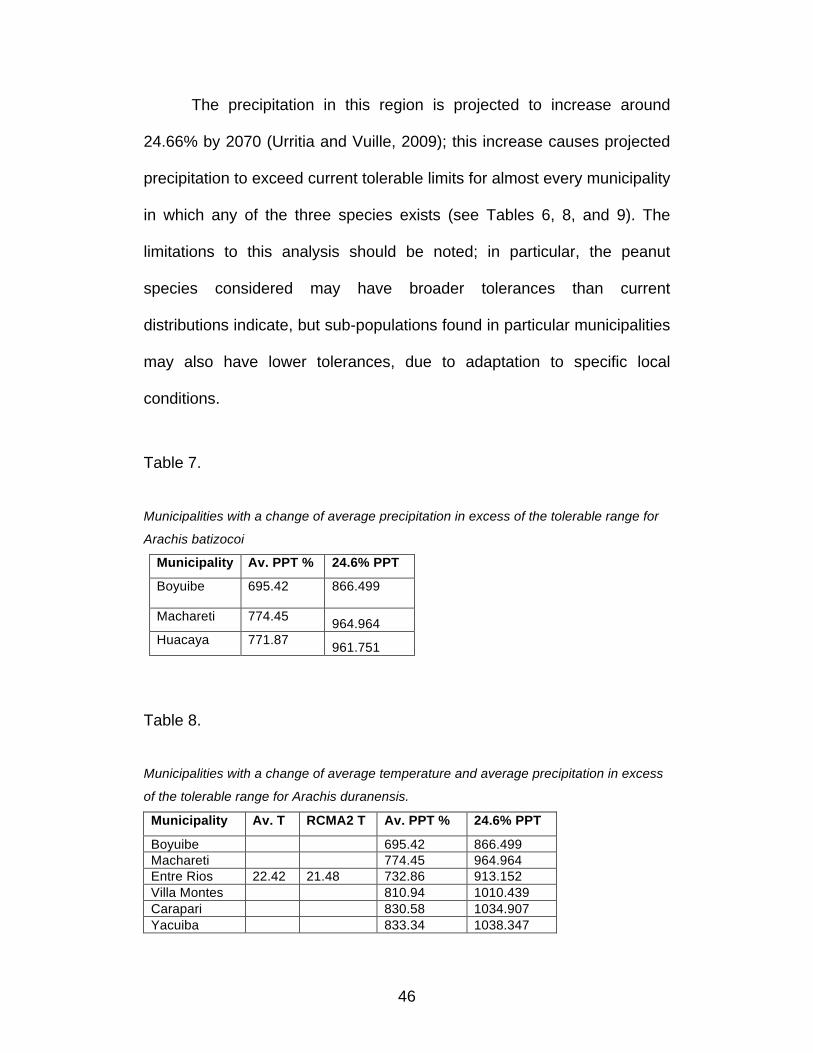
The precipitation in this region is projected to increase around
24.66% by 2070 (Urritia and Vuille, 2009); this increase causes projected
precipitation to exceed current tolerable limits for almost every municipality
in which any of the three species exists (see Tables 6, 8, and 9). The
limitations to this analysis should be noted; in particular, the peanut
species considered may have broader tolerances than current
distributions indicate, but sub-populations found in particular municipalities
may also have lower tolerances, due to adaptation to specific local
conditions.
Table 7.
Municipalities with a change of average precipitation in excess of the tolerable range for
Arachis batizocoi
Municipality Av. PPT % 24.6% PPT
Boyuibe 695.42 866.499
Machareti 774.45 964.964 Huacaya 771.87 961.751
Table 8.
Municipalities with a change of average temperature and average precipitation in excess
of the tolerable range for Arachis duranensis.
Municipality Av. T RCMA2 T Av. PPT % 24.6% PPT
Boyuibe 695.42 866.499 Machareti 774.45 964.964 Entre Rios 22.42 21.48 732.86 913.152 Villa Montes 810.94 1010.439 Carapari 830.58 1034.907 Yacuiba 833.34 1038.347

47
Table 9.
Municipalities with a change of average temperature and average precipitation beyond
the tolerable range for Arachis ringonii.
Municipality Av. T RCMA2 T Av. PPT % 24.6% PPT
Santa Cruz 25.05 24.40 995.261 1234.123
Potato species and climate change
The temperature range for the potato species is very similar except
for Solanum boliviense subsp. astleyi that has a more narrow temperature
range (Table 10). The precipitation range is wider for S. alandiae and
again narrower for S boliviense subsp. astleyi.
Table 10.
Tolerable temperature and precipitation range for potato species
Variable Solanum alandiae S. boliviense subsp. astleyi
S. gandarillasii
Climate
change
Temperature range
from 15.92 to 19.29 °C
Precipitation range is
from 23 to 552 mm.
Temperature range
from 11.96 to 12.83 °C
Precipitation range is
from 68 to 130 mm.
Temperature range
from 15.45 to 19 °C
Precipitation range is
from 117 to 540 mm.
The eastern slope of the Andean mountain chain houses the three
potato species under consideration. Projected climate changes for this
region include a temperature decrease of 0.8 oC, and a decrease in

48
precipitation of 250 mm, which is 17.24% of the current annual average
precipitation for the region (Table 11, 12 and 13). As with peanuts, shifts in
precipitation threaten current populations of potato more so than shifts in
temperature. The projected temperature changes are not projected to
affect S. boliviense subsp. astleyi or S. gandarillasii at all; it affects S.
alandiae in only one of the 19 municipalities in which it exists.
Decrease of precipitation affects both municipalities where S.
boliviense subsp. astleyi is present; it affects 8 of the 22 municipalities
where S. gandarillasii is present. Only three out of 19 municipalities are
affected by this decrease for S. alandiae.
Table 11.
Municipalities with a change of average precipitation in excess of the tolerable range for
Solanum boliviense subsp. astleyi
Municipality Av. PPT % 17.24% PPT
Betanzos 295.45 244.51
Puna 177.70 147.06
49
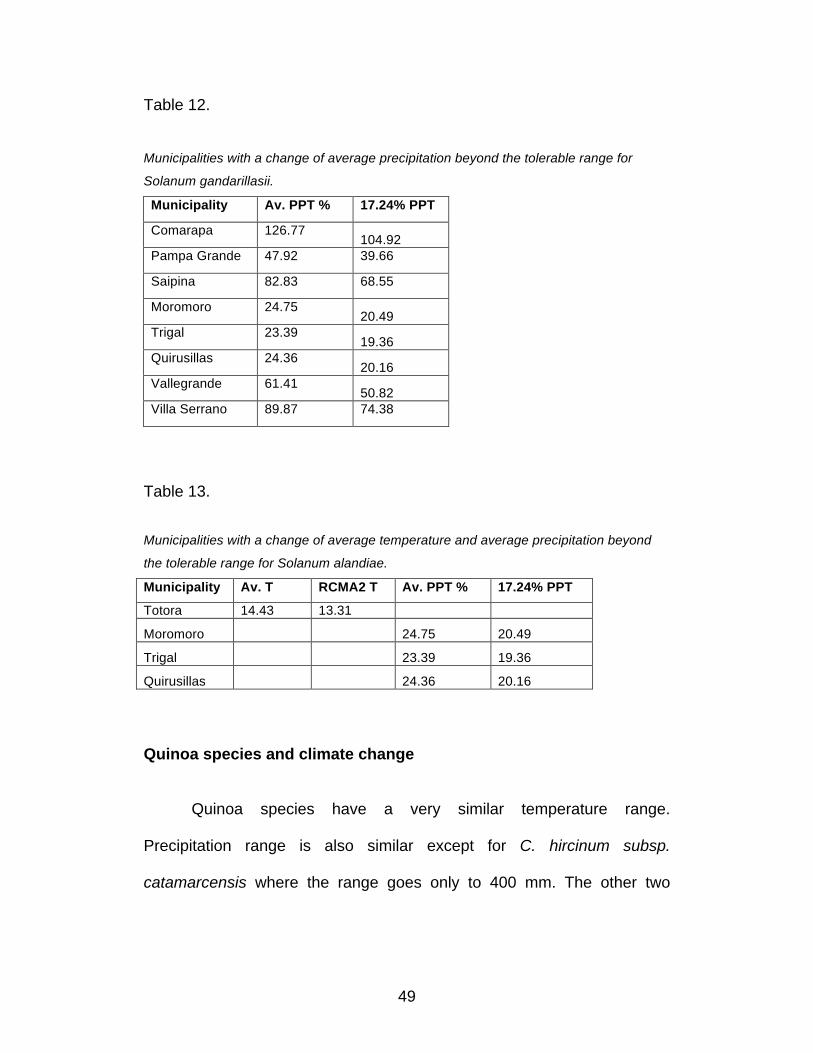
Table 12.
Municipalities with a change of average precipitation beyond the tolerable range for
Solanum gandarillasii.
Municipality Av. PPT % 17.24% PPT
Comarapa 126.77 104.92
Pampa Grande 47.92 39.66
Saipina 82.83 68.55
Moromoro 24.75 20.49
Trigal 23.39 19.36
Quirusillas 24.36 20.16
Vallegrande 61.41 50.82
Villa Serrano 89.87 74.38
Table 13.
Municipalities with a change of average temperature and average precipitation beyond
the tolerable range for Solanum alandiae.
Municipality Av. T RCMA2 T Av. PPT % 17.24% PPT
Totora 14.43 13.31
Moromoro 24.75 20.49
Trigal 23.39 19.36
Quirusillas 24.36 20.16
Quinoa species and climate change Quinoa species have a very similar temperature range.
Precipitation range is also similar except for C. hircinum subsp.
catamarcensis where the range goes only to 400 mm. The other two

50
species (Table 14) have precipitation ranges that go from the 20s to
values higher than 500 mm.
Table 14.
Tolerable temperature and precipitation range for quinoa species
Variable C. hircinum C. hircinum subsp.
catamarcensis
C. hircinum subsp. eu-
hircinum
Climate
change
Temperature
range from 10.48
to 21.35 °C
Precipitation
range is from 23
to 530 mm.
Temperature range from
12.03 to 19 °C
Precipitation range is from
50 to 400 mm.
Temperature range from
7.75 to 18.89 °C
Precipitation range is from
25 to 569 mm.
Urritia and Vuille (2009) project temperature increases in the high
Andean zones of Bolivia to be 1.5 °C, while precipitation is projected to
decrease by 10 mm. In contrast to potato and peanut, it is projected
temperature changes that are projected to present the greatest threat to
current populations of quinoa. In particular, temperature increases
threaten Chenopodium hircinum subsp. eu-hircinum in 9 of the 59
municipalities in which it currently exists (Table 17); threatens
Chenopodium hircinum subsp. catamarcensis (Table 16) in 2 of 24
municipalities, and there is no threat for Chenopodium hircinum (Table
15). In contrast, each of the three species are threatened by precipitation
decrease in just two of their municipalities.

51
Table 15.
Municipalities with a change of average precipitation beyond the tolerable range for
Chenopodium hircinum. Municipality Av. PPT % 25% PPT
Moromoro 24.75 18.566
Trigal 23.39 17.545
Table 16. Municipalities with a change of average temperature beyond the tolerable range for Chenopodium hircinum subsp. catamarcensis.
Municipality Av. T RCMA2 T
Pojo 18.36 20.40
Comarapa 18.91 20.63 Table 17. Municipalities with a change of average temperature and average precipitation beyond the tolerable range for Chenopodium hircinum subsp. eu-hircinum.
Municipality Av. T RCMA2 T Av. PPT % 25% PPT
Pojo 18.36 20.40
Comarapa 18.91 20.63
Pampa Grande 18.80 20.47
Aiquile 18.11 19.47
Pasorapa 17.95 19.18
Moromoro 18.39 19.90 24.75 18.56 Villa Serrano 18.39 20.11
Sopachuy 17.53 19.44
Tarvita 18.35 19.69
Pucara 18.35 21

52
Mining concessions
Mining concessions are thought to threaten conservation prospects
for CWR, both because they can destroy habitat and because they can
shift priorities away from agriculturally based activities. There are few
mining concessions in the area occupied by peanut (Fig. 2). The
municipalities where potatoes reside have some mining activity, but it is
still not significant (Fig 3). However, in the high Andean regions
encompassing the quinoa species, there are often significant mining
concessions (Fig. 4 and 5).
I have produced maps where black shows areas that are favorable
for conservation, while white shows areas that are unfavorable. Therefore,
the scale for this map has been reversed, with black representing the
lowest levels of percent area occupied by mining concessions, and white
showing the highest levels. The lowest value for this variable is 0% and
the highest is 44%. The four categories used in the synthesis were: 0 to
11% (), 12 to 22% (), 23 to 33% () and 34 to 44% ().

53
Fig. 2. Percent of mine concessions for peanut distribution

54
Fig. 3. Percent of mine concessions for potato distribution

55
Fig. 4 Percent
of mine
concessions
for C. hircinum
Fig. 5 Percent
of mine
concessions
for C. hircinum
subsp.
catamarcensis

56
Oil concessions
The distribution of oil concessions is in sharp contrast to the
distribution of mining concessions. Municipalities housing peanut have
relatively high levels of oil-extraction activity—at times reaching more than
80% of their land with identifiable oil concessions (Fig. 6). The
municipalities housing potato, on the other hand, have no oil concessions
(Fig 7), and the quinoa distribution includes only two municipalities any oil
activities, both with a fairly low percentage of the land devoted to oil
concessions (Fig. 8 and 9).
The color scale for this variable is like that for mining concessions,
with black assigned to low percentages and white to high. The highest
value for this variable is 99.95% and the lowest is 0%; the quartile
distributions are: 0 to 25% (), 26 to 50% (), 51 to 75% () and 76 to
100% ()

57
Fig. 6 Percent of oil concessions for peanut distribution.

58
Fig. 7 Percent of oil concessions for potato distribution.

59
Fig. 8 Percent
of oil
concessions
for C. hircinum
Fig. 9 Percent
of oil
concessions
for C. hircinum
subsp.
catamarcensis

60
Population
Different species are affected differently by population growth.
Some species thrive in disturbed environments, such as the edges of
agricultural fields and roads, or along city streets, and can therefore
benefit from growing populations. Others require more pristine conditions.
For each species, I produced scatter plots of current population
density (x axis) and population growth rates (19912-2001; y axis), and
then used the hypotheses listed in Tables 3, 4 and 5 to “guesstimate”
regions of the graph (i.e., the combinations of current population densities
and growth rates) that might be favorable or unfavorable for each species.
I show only three of those scatter plots here and the other six are included
in the appendix in order to allow for a bigger size. A. batizocoi can tolerate
relatively high disturbance, and so can tolerate high population growth
rates across a range of current densities. I therefore categorize population
dynamics as “favorable” for A. batizocoi for all of the municipalities in
which it currently exists except for Camiri (Figure 10). S. gandarillasii
(Figure 11) can similarly tolerate relatively high disturbance, and so I
categorized as “favorable” the population dynamics in all but Sucre and
Vacas municipalities (the two on the far right of the graph). Chenopodium
hircinum subsp. catamarcensis can tolerate high growth and low density.

61
However, high density and high growth rate put this species under threat
as well as low density and low growth rate. This is why Totora and Uyuni
(the two below 0 on the left corner) are qualified negative threat (Figure
12).
In the case of potato, figure 3 corresponds to Solanum gandarillasi,
where population density goes over 1000 persons per Km2. Solanum
alandiae has low population density but some municipalities have a
growth rate over 3. The situation with S. boliviense subsp. astleyi is
different, where there is low population density and the growth rate is
lower than 2.
Figure 4 for Chenopodium hircinum subsp. catamarcensis is
present in a municipality that has low population density but some
municipalities present high growth rates. C. hircinum subsp.
catamarcensis and C. hircinum subsp. eu-hircinum are present in
municipalities where there is high population density and growth rate.

62
Fig 10. Population dynamics for Arachis batizocoi.
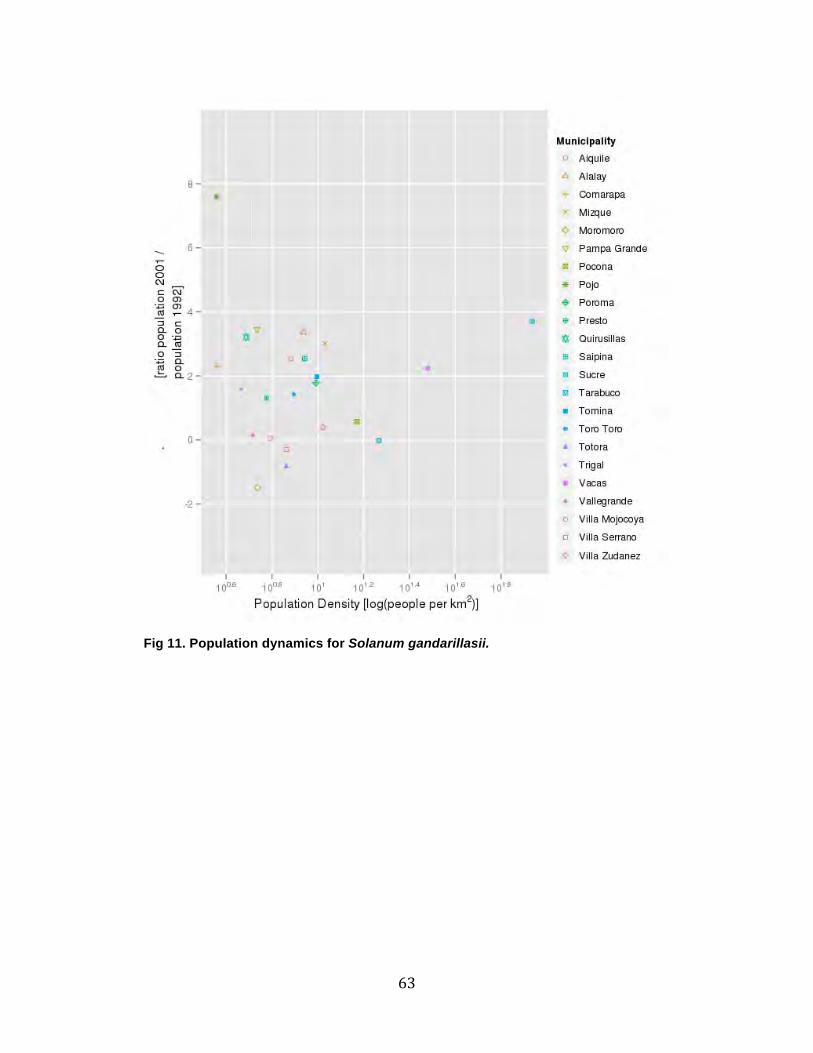
63
Fig 11. Population dynamics for Solanum gandarillasii.

64
Fig 12. Population dynamics for Chenopodium hircinum subsp. catamarcensis
Literacy Rate
In general this variable was hypothesized to be a positive variable
as it may increase the likelihood of establishing effective conservation
programs. In the eastern region of Bolivia (Fig. 13) and the high Andean
zone (Fig. 15 and 16) levels of literacy are relatively high. The inter-
Andean valleys, where potato and quinoa are found, have literacy rates

65
that fall below 60% (Fig. 14), though no municipalities in which my 9 target
species are found have literacy rates that fall below 40%. This could
represent a challenge when executing conservation projects compared to
higher literacy rates with peanut. However, as we may see in other
variables, there might be a correlation between higher literacy rate and
more interest in high economic value activities like oil extraction.
The maximum literacy rate for any municipality under consideration
was 96% and the lowest was about 40%. I divided this range into
quartiles, and assigned them into “highly unfavorable for conservation” (40
to 54%, ); somewhat unfavorable (54% to 68%; ); somewhat favorable
(68% to 72%; ); and highly favorable (72% to 96%; ).

66
Fig. 13 Literacy Rate for peanut species

67
Fig. 14 Literacy Rate for potato species

68
Fig. 15
Literacy Rate
for C. hircinum
Fig. 16 Literacy
Rate for C.
hircinum

69
Women in municipalities
A greater proportion of female participation in government is
assumed to improve the prospects for successful conservation. This
indicator may be a surrogate of how much women are included in decision
making processes. All municipalities have some female representation in
government, with the lowest level being 20% and the highest being 100%.
The eastern region in Bolivia that encompasses the existing
populations of peanut CWR have an average of 40% to 60% of women
elected and involved in municipal government (Fig. 17). A very similar
situation occurs in the Inter-Andean valleys, where potato is distributed
(Fig. 18). The Choque Cota municipality in Oruro has 100% female
representation in the government. This is where Chenopodium hircinum
and Chenopodium hircinum subsp. eu-hircinum grow (Fig. 19 and 20). For
the next section of synthesis, the municipalities were again divided into
quartiles; those having 20 to 40% representation of women were deemed
unfavorable for conservation outcomes (); those from 40 to 60% were
deemed somewhat unfavorable (); those from 60 to 80% were deemed
somewhat favorable (); and those from 80 to 100% highly favorable ().

70
Fig. 17 Percent of women involved in local government for peanut distribution

71
Fig. 18 Percent of women involved in local government for potato distribution

72
Fig. 19 Percent
of women
involved in
local
government C.
hircinum
Fig. 20 Percent
of women
involved in
local
government C.
hircinum
subsp. eu-
hircinum
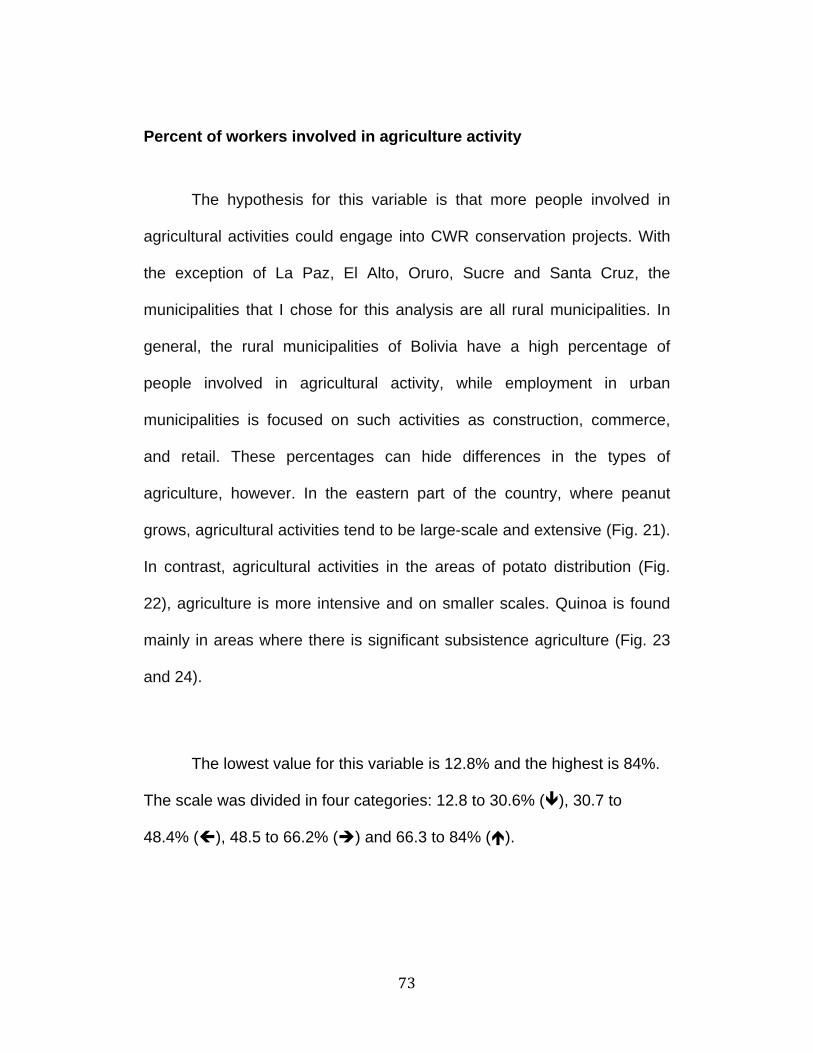
73
Percent of workers involved in agriculture activity
The hypothesis for this variable is that more people involved in
agricultural activities could engage into CWR conservation projects. With
the exception of La Paz, El Alto, Oruro, Sucre and Santa Cruz, the
municipalities that I chose for this analysis are all rural municipalities. In
general, the rural municipalities of Bolivia have a high percentage of
people involved in agricultural activity, while employment in urban
municipalities is focused on such activities as construction, commerce,
and retail. These percentages can hide differences in the types of
agriculture, however. In the eastern part of the country, where peanut
grows, agricultural activities tend to be large-scale and extensive (Fig. 21).
In contrast, agricultural activities in the areas of potato distribution (Fig.
22), agriculture is more intensive and on smaller scales. Quinoa is found
mainly in areas where there is significant subsistence agriculture (Fig. 23
and 24).
The lowest value for this variable is 12.8% and the highest is 84%.
The scale was divided in four categories: 12.8 to 30.6% (), 30.7 to
48.4% (), 48.5 to 66.2% () and 66.3 to 84% ().

74
Fig. 21 Percent of workers involved in agriculture activity for peanut distribution

75
Fig. 22 Percent of workers involved in agriculture activity for potato distribution
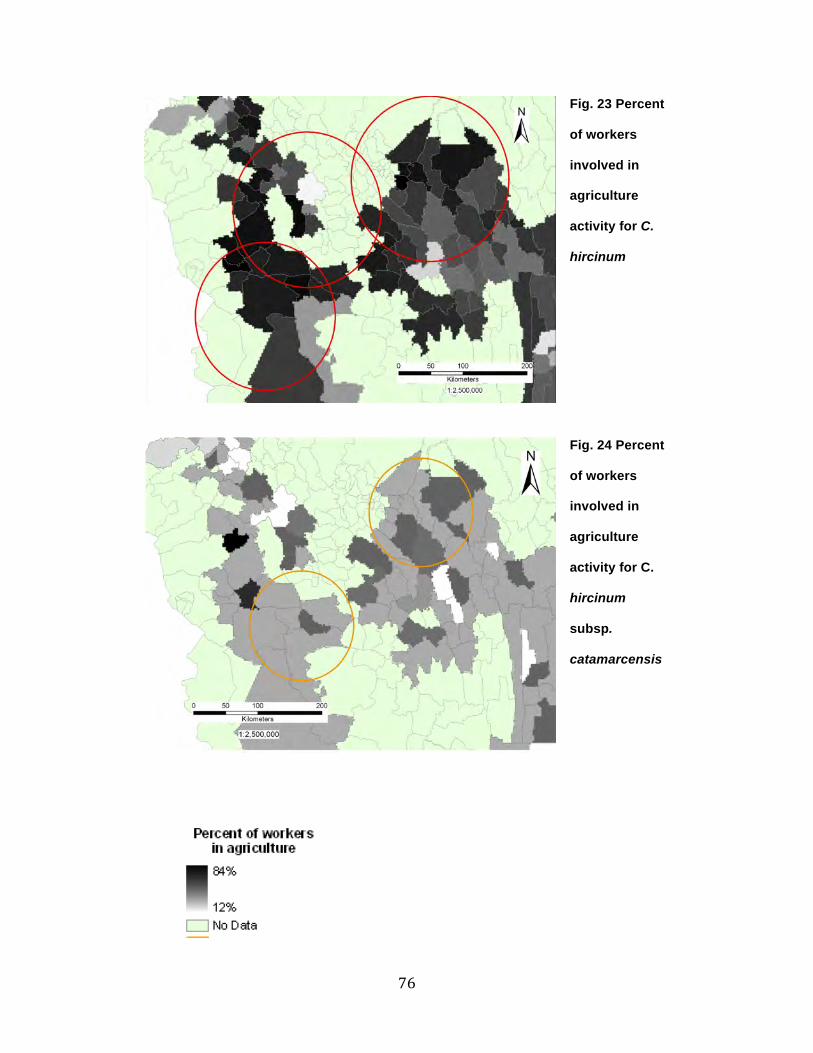
76
Fig. 23 Percent
of workers
involved in
agriculture
activity for C.
hircinum
Fig. 24 Percent
of workers
involved in
agriculture
activity for C.
hircinum
subsp.
catamarcensis

77
Land Tenure
When there is greater certainty over land tenure, there is greater
likelihood of successful conservation projects. The advances from land
tenure reform have been uneven in Bolivia; with the greatest progress in
establishing land tenure taking place in the lowlands in the eastern part of
the country, where peanut is distributed (Fig. 25). This is a positive
variable for municipalities where peanut is distributed. The outcome is less
promising for potato (Fig. 26); most municipalities containing potato
populations have a relatively low percentage of land registered under the
tenure process. The picture is more mixed for quinoa, with some home
municipalities having proceeded quite far in registering land tenure, and
others having made less progress (Fig. 27 and 28).
The lowest value for this variable is 0% and the highest is 96.5%.
The four categories used for the synthesis were: 0 to 24% (), 25 to 48%
(), 49 to 72% () and 73 to 96.5 ().

78
Fig. 25 Percent of land assigned with tenure for
peanut distribution

79
Fig. 26 Percent of land assigned with tenure for potato
distribution

80
Fig. 27 Percent
of workers
involved in
agriculture
activity for C.
hircinum
Fig. 28 Percent
of workers
involved in
agriculture
activity for C.
hircinum
subsp.
catamarcensis

81
The images not included in this section are found in the Appendix.
In this section the results are mainly visual, but there is still a need to
understand how each of the variables affect the selected species and how
can some municipalities be selected according to the combination of
threats and opportunities. Conservation makes little sense in places where
species are not threatened. It also makes little sense in places where the
social and economic conditions are unlikely to favor positive conservation
outcomes. I therefore identified municipalities where there was: (a) at least
one threat to species—from climate change, mining, oil, or population
growth; and (b) a relatively high number of positive social and economic
conditions—high literacy, high land tenure, high levels of women in
government, and/or a high percentage of the labor force in agriculture. In
the next chapter, I present a synthesis of the results for all municipalities,
and identify those where conservation projects are needed and likely to be
successful, based on the criterion above.

82
Chapter 4
SYNTHESIS
The results obtained from the analysis are combined in this section
in a manner that allows identification of the most promising municipalities
for conservation programs for each of the 9 species. I have summarized
each possible threat or opportunity as having very favorable prospects for
conservation (), somewhat favorable (), somewhat unfavorable ()
and unfavorable ().
For each species, I identified the municipalities that have some
threats to CWR, but also have favorable social and economic conditions
that might lead to successful conservation outcomes. I chose this
combination in order to find which municipalities having some level of
threat could execute CWR conservation projects with few resources given
a favorable socioeconomic and political context. Municipalities with more
threats would probably need greater resources to achieve favorable
conservation outcomes. Note that in this analysis I have not been able to
assign “weights” to the relative challenges associated with each variable.
For instance, an unfavorable ranking for climate change may be much
more difficult to overcome than an unfavorable ranking for literacy, though
I have counted an unfavorable ranking as the same in both cases.
83
Nonetheless, the patterns are instructive, and show for each municipality
the factors working in favor of successful conservation outcomes, and
those that would have to be overcome to ensure successful outcomes.
Some of these favorable municipalities (places where species are
threatened, but conservation projects are likely to be successful) house
more than one of the nine species considered, giving them even higher
priority for conservation programs. Some of the species considered in this
analysis are found in very few municipalities, and in some cases those
municipalities had very few indicators of favorable opportunities for
conservation. The characteristics of these municipalities were also
considered in order to formulate recommendations for conservation of
those narrowly distributed species, though it should be recognized that
achieving successful conservation of these species is likely to be more
difficult.
Peanut – Arachis spp.
The three municipalities that appear to be most favorable for
conservation of Arachis batizocoi are Camiri, Villa Vaca Guzman and
Machareti; oil is the common threat in all three municipalities (table 18).
For A. duranensis the Machareti municipality is the most promising, as all
the others have more than one threat (table 19). The prospects for Arachis

84
ringonii, which only exists in one municipality, are far less promising (table
20).
Table 18.
Summary for Arachis batizocoi
Municipality T° PP Min Oil Pop Lit Wom Agr LT
Cabezas
Charagua
Villa Vaca Guzmán
Gutierrez
Lagunillas
Camiri
Boyuibe
Cuevo
Machareti
Huacaya
T° = Temperature
PP = Precipitation
Min = Percent Mine concessions
Oil = Percent Oil concessions
Pop = Population dynamics
Lit = Literacy rate
Wom = Percent of Women in local government
Agr = Percent of people involved in agriculture
LT = Percent of land tenure process

85
Table 19.
Summary for Arachis duranensis
Municipality T° PP Min Oil Pop Lit Wom Agr LT
Boyuibe
Machareti
Entre Rios
Villa Montes
Caraparí
Yacuiba
Table 20.
Summary for Arachis rigonii
Municipality T° PP Min Oil Pop Lit Wom Agr LT
Santa Cruz
Potato – Solanum spp.
The three potato species I considered are mostly threatened by
declines in precipitation under climate change, and a lack of land-tenure
rights in the municipalities in which they are found. The conservation
status of all three is enhanced by the lack of oil concessions in their range.
For Solanum alandiae, the four most promising municipalities
appear to be Pucara, Villa Serrano, Trigal and Quirusillas (table 21). They

86
do not have favorable climatic conditions. They all have unfavorable or
somewhat unfavorable opportunities for women in government. The first
two municipalities have also unfavorable indicators for population and the
other two have unfavorable outcome for land tenure. There is only one
municipality chosen for Solanum boliviense subsp. astleyi: Betanzos (table
22). The unfavorable variables for this municipality are: decrease of
precipitation, low literacy rate, and lack of an adequate land tenure
process.
Conditions appear favorable in five municipalities for Solanum
gandarillasii (table 23): Comarapa, Saipina, Aiquile, Villa Mojocoya and
Sucre. The two first municipalities have an unfavorable outcome for
precipitation, while the others are unfavorable in population dynamics. The
socio political variables that are unfavorable for each are a low percentage
of women in the government and relatively low amounts of land registered
in the tenure process. Sucre is an urban municipality; therefore it also has
a low percent of people involved in agricultural labor.
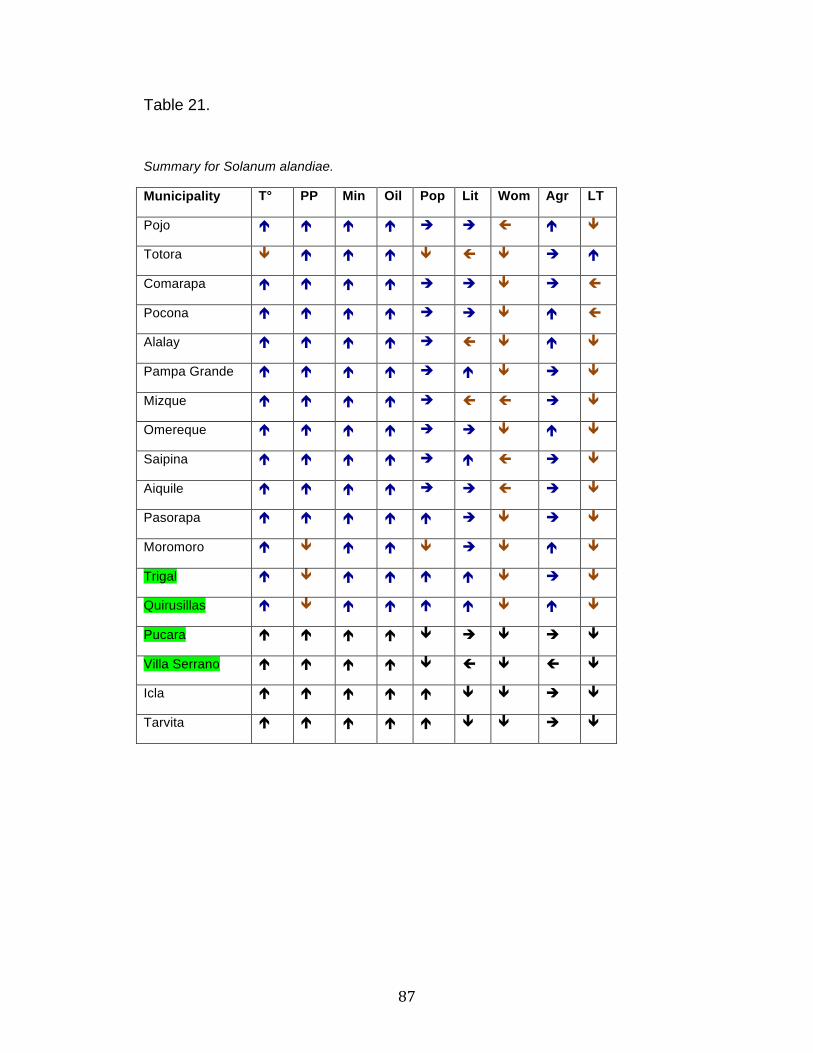
87
Table 21.
Summary for Solanum alandiae.
Municipality T° PP Min Oil Pop Lit Wom Agr LT
Pojo
Totora
Comarapa
Pocona
Alalay
Pampa Grande
Mizque
Omereque
Saipina
Aiquile
Pasorapa
Moromoro
Trigal
Quirusillas
Pucara
Villa Serrano
Icla
Tarvita
88
Table 22.
Summary for Solanum boliviense subsp. astleyi
Municipality T° PP Min Oil Pop Lit Wom Agr LT
Betanzos
Puna
Table 23.
Summary for Solanum gandarillasii
Municipality T° PP Min Oil Pop Lit Wom Agr LT
Totora
Comarapa
Pocona
Vacas
Alalay
Pampa Grande
Mizque
Saipina
Aiquile
Toro Toro
Moromoro
Trigal
Quirusillas
Vallegrande
Presto
Villa Mojocoya
Villa Serrano

89
Municipality T° PP Min Oil Pop Lit Wom Agr LT
Sucre
Tarabuco
Tomina
Villa Zudanez
Quinoa – Chenopodium spp.
The main threat to quinoa is the lack of an adequate land tenure
process in the municipalities where it is found. The municipalities where
there is an adequate land tenure process are usually areas where there
are communitarian territory bases (TCO for Territorio Comunitario de
Origen). This is a special kind of land tenure category that is granted to
indigenous groups. These TCOs may differ from other municipal
governments in terms of their structures and processes; traditional forms
of knowledge and practice would have to be accounted for in any
conservation project launched in those regions.
In the case of Chenopodium hircinum (table 24) there are seven
promising municipalities: Papel Pampa, Villa Poopo, Pojo, El Choro,
Sucre, Salinas de Garci Mendoza and Uyuni. First two municipalities have
somewhat unfavorable indicators for mining concessions and unfavorable
opportunities for women in local government. The other have population

90
dynamics as a threat and one unfavorable opportunity like lack of land
tenure, low percentage of people involved in agriculture and low
percentage of women participation in government.
Pojo, Comarapa and Uyuni were chosen for C. hircinum subsp.
catamarcensis (table 25). They have unfavorable trend for temperature
and unfavorable population dynamics; in addition, the first is unfavorable
for land tenure process while the other two are unfavorable for women
represented in local government. The municipalities of Pojo, Comarapa,
Papel Pampa, Aiquile and Sucre were chosen for C. hircinum subsp. eu-
hircinum (table 26). Three of these municipalities were chosen previously
for other species.
Finally, the municipality of Comarapa houses one potato species
and two quinoa species. Papel Pampa houses one potato species and
one quinoa species, while Pojo, Sucre and Uyuni house two quinoa
species.
91
Table 24.
Summary for Chenopodium hircinum
Municipality T° PP Min Oil Pop Lit Wom Agr LT
Tiraque
Pojo
Patacamaya
Sica-Sica
Totora
Umala
Caracollo
Comarapa
Pocona
Vacas
Eucaliptus
Papel Pampa
Oruro
Alalay
Pampa Grande
Mizque
Santiago de Huayllamarca
Omereque
Vila Vila
Saipina
Aiquile
El Choro
Toro Toro
Choquecota
92
Municipality T° PP Min Oil Pop Lit Wom Agr LT
Pasorapa
Corque
San Pedro
Machacamarca
Moromoro
Trigal
Villa Poopo
Vallegrande
Poroma
Presto
Colquechaca
Ravelo
Villa Mojocoya
Escara
Sucre
Andamarca
Ocuri
Belen de Andamarca
Tarabuco
Esmeralda
Santiago de Huari
Tocobamba
Tinquipaya
Chipaya
Salinas de G. Mendoza
Pampa Aullagas
93
Municipality T° PP Min Oil Pop Lit Wom Agr LT
Santuario Quillacas
Uyuni
Colcha"K"
Table 25.
Summary for Chenopodium hircinum subsp. catamarcensis
Municipality T° PP Min Oil Pop Lit Wom Agr LT
Tiraque
Pojo
Totora
Comarapa
Pocona
Vacas
Alalay
Mizque
Omereque
Vila Vila
Saipina
Aiquile
Toro Toro
Pasorapa
Poroma
Colquechaca
Andamarca

94
Municipality
T° PP Min Oil Pop Lit Wom Agr LT
Belen de Andamarca
Santiago de Huari
Salinas de G. Mendoza
Pampa Aullagas
Santuario Quillacas
Uyuni
Colcha"K"
Table 26.
Summary for Chenopodium hircinum subsp. eu-hircinum
Municipality T° PP Min Oil Pop Lit Wom Agr LT
La Paz
El Alto
Palca
Laja
Achocalla
Mecapaca
Viacha
Calamarca
Sapahaqui
Collana
Tiraque
Colquencha
Ayo-Ayo

95
Municipality T° PP Min Oil Pop Lit Wom Agr LT
Pojo
Coro Coro
Patacamaya
Sica-Sica
Umala
Caracollo
Comarapa
Pocona
Vacas
Eucaliptus
Papel Pampa
Totora
Alalay
Pampa Grande
Mizque
Santiago de Huayllamarca
Omereque
Vila Vila
Saipina
Aiquile
Toro Toro
Choquecota
Pasorapa
Corque
San Pedro
Moromoro
Poroma

96
Municipality T° PP Min Oil Pop Lit Wom Agr LT
Presto
Colquechaca
Ravelo
Villa Mojocoya
Pucara
Villa Serrano
Sucre
Ocuri
Tarabuco
Tomina
Villa Zudanez
Tocobamba
Tinquipaya
Betanzos
Icla
Sopachuy
Puna
Tarvita

97
Fig. 29. Final selection of municipalities with most promising conditions for conservation projects.
The map on figure 29 shows the 19 selected municipalities for all
the 9 species and marks those that house more than one species. These
municipalities could be promising candidates to start a pilot CWR
conservation project; CWRs face at least one threat in each, but the social
and economic conditions suggest potentially favorable outcomes where
conservation projects could be launched.
98
Chapter 5
CONCLUSIONS & RECOMMENDATIONS
Any successful conservation project should take into account the
different threats and opportunities present in the local context. Therefore it
is not possible to design a blueprint conservation plan for all of the species
analyzed here.
In general peanut is primarily threatened by:
– Increases in precipitation
– A relatively small agricultural labor force and relatively low
empowerment of women (as measured by percent in
governments)
– Significant percent of oil concessions
But has to its advantage:
– Relatively low threats from changes in temperature.
– Found in places with favorable (human) population dynamics
and high literacy rates.

99
This situation is different for Arachis ringonii. This species is only
found in one municipality, where it is threaten by temperature decrease,
precipitation increase, and oil concessions. The opportunities are not
favorable for population dynamics (as it is a fast growing urban area),
there are few people involved in agricultural labor, and there is a
relatively low level of land registered in the tenure process.
Potato is primarily threatened by:
– Decreases in precipitation
– Relatively low empowerment of women (as measured by
percent in governments)
– Relatively small proportion of land whose tenure has been
recognized/registered.
But has to its advantage:
– A large agricultural labor force
– A lack of oil and mining activities
The case for Solanum boliviense subsp. astleyi, which has also a
small distribution area, is more promising than the one for A. ringonii. The
threat for this species is precipitation decrease. The lack of mining and oil

100
concessions in this area, and the opportunity of favorable population
dynamics and people involved in agriculture, can compensate the
unfavorable literacy rate and low participation of women in local
governments.
Quinoa is primarily threatened by:
– Increases in temperature in a few municipalities
– Relatively low empowerment of women (as measured by
percent in governments)
– Relatively small proportion of land whose tenure has been
recognized/registered.
But has to its advantage:
– A high proportion of subsistence agriculturalists
– A lack of oil and mining activities
The species that had the smallest distribution area for quinoa is
Chenopodium hircinum and has at least two municipalities that could be
considered for a pilot conservation project.

101
The resources are simply not available to start conservation
projects for CWR in every municipality in Bolivia. The results of this
assessment could be used to identify priority areas for conservation, as
well as helping determine the resources that might be required in each
case. In general, one might consider placing conservation projects in
areas where there are a few threats to CWR (otherwise conservation is
not required) and social and economic conditions favor potentially
positive outcomes for conservation projects. In some cases, however,
where species ranges are severely restricted, one might need to consider
establishing conservation projects in areas where threats are numerous,
and socioeconomic conditions are not favorable to conservation. Greater
resources may need to be concentrated in those municipalities relative to
others where threats are lower and opportunities for successful outcomes
greater.

102
This analysis leads to several conclusions:
- Bolivia would benefit from a clear national-level framework on food
security and biodiversity that would have as one priority the
conservation of crop wild relatives.
- There is a strong connection between land tenure and conservation
efforts. Therefore, the land tenure process going on in Bolivia
should be maintained or strengthened in the near term, in order to
enhance the prospects for successful conservation projects.
Because this process is already occurring, and enjoys widespread
public support, it is one of the potential barriers to conservation in
Bolivia that can be most easily overcome.
- The potential impacts of climate change on CWRs are sobering.
While both precipitation changes and temperature changes
threaten crop wild relatives, the greater impacts in this study are
found to be related to precipitation change. More research is
needed, however, to understand how projected climate changes
will truly “downscale” to the different biogeographic regions of
Bolivia. Supporting research into climate change, climate-change
adaptation, and assisted migration (relocation of CWRs) in Bolivia’s
universities and research institutions could enhance prospects for

103
conservation of CWRs, and increase the capacity to identify those
populations of CWR that are most threatened by climate change.
- Bolivian residents should be educated on the benefits of conserving
and using CWRs. Such benefits include the resilience of
production, enhanced nutritional value of diets based on locally
produced foods, and potential commercial opportunities. Rural
residents in particular could benefit from such outreach programs,
which should include inexpensive approaches to maintaining CWRs
in local fields and household gardens.
- The central government and the municipalities should create and
promote internal markets for new products based on CWR (like
pasta made of quinoa or peanut oil).
- Municipalities that look the most promising with respect to the
potential for conserving CWRs should receive support, either from
the central government or the NGOs, in operationalizing
conservation programs. This could include training in how to secure
the property rights for endemic genetic material.

104
- The results of this study could be used to identify a handful of
municipalities in which pilot conservation projects could be
established. This conservation programs should be integrative,
covering conservation of species, education, the land tenure
process, research, in situ conservation in gardens (that can be
managed by community women), and crop improvement.

105
REFERENCES
ACOBOL – Asociación de Concejalas de Bolivia. 2010. Separata Elecciones Municipales 2010. 8 – 11 pp.
Aguilar, G. 2001. Access to genetic resources and protection of traditional knowledge in the territories of indigenous peoples. Elsevier - Environmental Science and Policy 4 (241 – 256). Alcorn, J. 2005. Dances around the Fire: Conservation Organizations and Community-Based Natural Resource Management. In: Brosius, P., A. Lowenhaupt-Tsing and C. Zerner (Eds.). Communities and Conservation. AltaMira Press. UK. Almekinders, C. J. M., N. P. Louwaars and G. H. Bruijn. 1994. Local seed systems and their importance for an improved seed supply in developing countries. In: Euphytica, 1994, Volume 78, Number 3, 207-216. Altieri, M. and L. Merrick. 1988. Agroecology and in situ conservation of native crop diversity in the third world. In: Wilson, E. and F. Peter (Eds.). Biodiversity. National Academic Press. Washington, USA. 361 – 369. AOPEB. 2011. Asociación de organizaciones de productores Ecológicos de Bolivia – Bolivian association of ecologic producers organizations. Retrieved Mar. 14, 2011 from: http://www.aopeb.org
Apaza, K., B. Zapata & S. Beck. 2008. Parientes Silvestres de Cultivos Identificados por Instituciones de Investigación Participantes del Proyecto UNEP/GEF. Revista de Agricultura. Año 60, No. 44. 9 – 16. Bolivia.
APECO – Asociación de Productores Ecológicos de Tarija. 2005.
Cambiando el rumbo. Hacia un manejo ecológico y sano de uva y otros productos agrícolas. Fundación Agrecol Andes. Bolivia.
Atahuachi, M. & L. Guzmán. 2008. Los Parientes Silvestres del Maní cultivado (ARachis hypogaea L.), en Bolivia. In: Revista de Agricultura. Año 60, No. 44. 24 - 30 Azzu, N. and L. Collette. 2008. Addressing the Conservation and Sustainable Utilization of Crop Wild Relatives: the International Policy
106
Context. In: Nigel Maxted, B Ford-Lloyd, J Irinodo, S.P. Kell, E Dulloo (Eds.) Crop Wild Relative Conservation and Use. CABI. England. Baskin, C. and J. Baskin. 2001. Seeds: Ecology, Biogeography, and, Evolution of Dormancy and Germination. Elsevier. USA.
Bioversity. 2007. A simple machine to boost quinoa consumption and improve nutrition. Retrieved May 27, 2009 from: http://www.bioversityinternational.org/index.php?id=21&tx_ttnews[tt_news]=346&tx_ttnews[backPID]={page:uid}&no_cache=1
Bioversity. 2008. Peanut conservation moves into the 21st century. In: Annual Report 2008. Retrieved May 27, 2009 from: http://www.bioversityinternational.org/publications/publications/annual_report/article/article/peanut-conservation-moves-into-the-21st-century.html
Bois, J. E., Winkel, T., Lhomme, J. P., Raffaillac, J. P. and A. Rocheteau. 2006. Response of some Andean cultivars of quinoa (Chenopodium quinoa Willd.) to temperature: Effects on germination, phenology, growth and freezing. In European Journal of Agronomy. Vol. 25, 4. pp. 299-308
Borrini-Feyerabend, G. and C. Tarnowski. 2005. Participatory Democracy in Natural Resource Management: A “Colombus’s Egg”?. In: Brosius, P., A. Lowenhaupt-Tsing and C. Zerner (Eds.). Communities and Conservation. 69 – 90.
Botany dictionary.org. 2001. Retrieved Mar. 28, 2011 from:
http://botanydictionary.org/
Brechin, S., P. Wilshusen, C. Fortwangler and P. West. 2002. Beyond the Square Wheel: Toward a more comprehensive understanding of biodiversity conservation as social and political process. In: Society and Natural Resources. 15. 41 – 64. Brosius, P., A. Lowenhaupt-Tsing and C. Zerner (Eds.). 2005. Communities and Conservation. AltaMira Press. UK. CBD. 1992. Convention on Biological Diversity: Text and Annexes. Secretariat of the Convention on Biological Diversity, Montreal. Retrieved May 15, 2009 from: http://www.biodiv.org/convention/convention.shtml.
CBD. 2010. Technical Rationale for the Strategic Goals and Targets, including Potential Indicators and Milestones. Retrieved Oct 10, 2010 from: http://www.cbd.int/doc/meetings/cop/cop-10/information/cop-10-inf-12-en.pdf

107
Colchester, M. 1995. Salvando la Naturaleza: Pueblos indígenas, Áreas Protegidas y Conservación de la Biodiversidad. UN discussion document.
Copa, M. 2006. Lagartos de Beni abren mercados. Retreived Jun 3, 2009 from: http://www.biodiversityreporting.org/article.sub?docId=25311&c=Bolivia&cRef=Bolivia&year=2007&date=October%202006
Cromwell, E., D. Cooper and P. Mulvany. 2003. Defining Agricultural Diversity. In: Conservation and Sustainable Use of Agricultural Biodiversity: A Sourcebook. Published by CIP-UPWARD. 5 – 12.
Damania, A.B. 1994. In situ conservation of biodiversity of wild
progenitors of cereal crops in the Near East. In: Biodiversity Let. 2:56–60. Damania, A. B. 2008. History, Achievements, and Current Status of
Genetic Resources Conservation. In: Agronomy Journal 100:S-27–S-39.
Do Alto, H. 2007. Cuando el nacionalismo se pone el poncho. In: Svampa, M. and P. Stefanoni (Eds.). Memoria, Insurgencia y Movimientos Sociales – Bolivia. CLACSO. Argentina.
Ekpere, J. 2002. Sui Generis Systems: The case of the “Oau
model” law on the protection of the rights of local communities, farmers and breeders and for the regulation of access to biological resources. Retrieved May 25, 2009 from: http://www.unctad.org/trade_env/test1/meetings/delhi/Countriestext/Ekpere.doc
Ewing, E. E. and P.C. Struik. 1992. Tuber formation in potato:
induction, initiation and growth. In: Horticultural Reviews 14: 89-198.
FAO. 1998. State of the World’s Plant Genetic Resources for Food and Agriculture. FAO, Rome, Italy. Retrieved May 15, 2009 from: http://www.fao.org/ag/aGp/AGPS/Pgrfa/pdf/swrfull.pdf.
FAO. 1999. Women: users, preservers and managers of
Agrobiodiversity. Italy. Retrieved May 25, 2009 from: http://www.fao.org/FOCUS/E/Women/biodiv-e.htm
FAO. 2001. International Treaty on Plant Genetic Resources for
Food and Agriculture. Texts of the Treaty. Retrieved May 25, 2009 from: http://www.planttreaty.org/texts_en.htm

108
FAO. 2006. Global System on Plant Genetic Resources. FAO, Rome, Italy. Retrieved May 4, 2009 from: http://www.fao.org/ag/cgrfa/PGR.htm#diagram. FAO. 2006a. Monitoring the Implementation of the Global Plan of Action for the Conservation and Sustainable Use of PGRFA. FAO, Rome, Italy. Retrieved May 4, 2009 from: http://apps3.fao.org/wiews/wiewspage.jsp?i_l=EN&show=GPAMpnitor. FAO. 2008. Potatoes, nutrition and diet. In: International Year of the Potato. Retrieved May 27, 2009 from: http://www.potato2008.org/en/potato/factsheets.html FAO. 2010. State of the world’s plant genetic resources for food and agriculture. FAO, Rome, Italy. Retrieved Feb 26, 2011 from: http://www.fao.org/docrep/013/i1500e/i1500e00.htm Forester, D. and G. Machlis. 1996. Modeling Human Factors that affect the loss of Biodiversity. In: Conservation Biology. Vol. 10, No 4. 1253 – 1263.
Garcia, W. & X. Cadima (Eds.). 2003. Manejo sostenible de la agrobiodiversidad de tuberculos andinos. PROINPA. Bolivia. Ghimire, K. 1994. Conservation and Social Development. United Nations Research Institute for Social Development, discussion documents. Grain. 2008. TRIPS – Close call in Geneva. Retrieved May 27, 2009 from: http://grain.org/seedling/?id=565. Hajjar, R. and T. Hodkin. 2007. The use of wild relatives in crop improvement: A survey of developments over the last 20 years. In: Euphytica 156: 1 – 13. Haverkort, A. 1990. Ecology of potato cropping systems in relation to latitude and altitude Original Research Article. In Agricultural Systems, Volume 32, Issue 3. pp. 251-272.
Hijmans, R., L. Guarino, A. Jarvis and R. O’Brien. 2004. DIVA-GIS. Retrieved May 4, 2009 from: http://www.diva-gis.org/ Hijmans, R.J., S.E. Cameron, J.L. Parra, P.G. Jones and A. Jarvis, 2005. Very high resolution interpolated climate surfaces for global land areas. International Journal of Climatology 25: 1965-1978

109
Hodgkin, T. and R. Hajjar. 2008. Using crop wild relatives for crop improvement: Trends and perspectives. In: Maxted, N., B Ford-Lloyd, J Irinodo, S.P. Kell and E. Dulloo (Eds.). Crop Wild Relative Conservation and Use. CABI. 536 – 548.
Hunter, D. 2008. The Crop Wild Relatives Project: Increasing knowledge, promoting awareness and enhancing action. In: Revista de Agricultura. Año 60, No. 44. 6-7. Bolivia.
Ibish, P. & G. Merida (eds.) 2004. Biodiversidad: la riqueza de
Bolivia. Estado de conocimiento y conservación. Editorial FAN, Santa Cruz, Bolivia IFOAM, n. d. Inventario de experiencias con aproximación a un Sistema Participativo de Garantía – SPG. Retrieved Feb 16, 2011 from: www.ifoam.org/about_ifoam/standards/pgs/.../sistematizacion-ecoferia.pdf
INE - Instituto Nacional de Estadística and PNUD – Programa de las Naciones Unidas para el Desarrollo. 2005. Bolivia. Atlas estadístico de Municipios. Bolivia.
INE – Instituto Nacional de Estadística. 2007. Información
Estadística. Retrieved March 12, 2009 from: http://www.ine.gov.bo/indice/visualizador.aspx?ah=PC010001.HTM
INRA – Instituto Nacional de Reforma Agraria. 2010. Land Tenure
process maps in shape file and excel charts. Personal communication with Ing. Daniel Zapata. Bolivia. Kowalsky, T. 2002. International patent rights and biotechnology: should the United States promote technology transfer to developing countries?. In: Loyola of Los Angeles International and Comparative Law Journal. Vol 25. Rev. 41: 41 – 61.
Louette, D. 2000. Traditional management of seed and genetic diversity: what is a landrace? In: Brush, S. (Ed.). Genes in the Field: on-farm conservation of crop diversity. IDRC. USA.
Maxted, N., S. P. Kell and B. V. Ford-Lloyd. 2008. Crop Wild
Relative Conservation and Use: Establishing the Context. In: Maxted, N., B Ford-Lloyd, J Irinodo, S.P. Kell and E. Dulloo (Eds.). Crop Wild Relative Conservation and Use. CABI. 3 – 30. McLean Stearman, A. 2006. One step forward, two steps back: The Sirionó and Yuquí community forestry projects in the Bolivian Amazon. In: Human Organization. Vol. 65 No 2. pp. 156 – 166.

110
McShane, T. and M. Wells (Eds.). 2004. Getting Biodiversity Projects to Work. Columbia University Press. New York, USA.
Meilleur, B.A., Hodgkin, T., 2004. In situ conservation of crop wild relatives: status and trends. Biodiversity and Conservation 13, 663–684. Ministerio de Desarrollo Rural y Tierras – MDRT. 2008. Parientes Silvestres de Cultivo. Retrieved May 5, 2009 from: http://www.cwrbolivia.gov.bo/index.php?option=com_content&task=view&id=5
Moat, J. 2007. Conservation assessment tools extension for ArcView 3.x, version 1.2. GIS Unit, Royal Botanic Gardens, Kew. Available at: http://www.rbgkew.org.uk/gis/cats Mora, A., B. Zapata Ferrufino, D. Hunter, G. Navarro, G. Galeano, K.S. Apaza, M. Baudoin, M. Dulloo, S. Cuellar, S. Beck, W. Ferreira and X. A. Scheldeman. 2009. Libro Rojo de parientes silvestres de cultivos de Bolivia (Red book of crop wild relatives of Bolivia). VMABCC. La Paz, Bolivia. 344 pp. Mouillé, B., R. Charrondière and B.Burlingame. 2010. The Contribution of Plant Genetic Resources to Health and Dietary Diversity. In: The State of the world’s plant genetic resources for food and agriculture. FAO. Thematic Studies. 20p. Retrieved Feb 16, 2010 from: http://www.fao.org/docrep/013/i1500e/i1500e17.pdf
Mulvany, P. and R. Berger. 2003. Agricultural Biodiversity: Farmers sustaining the web of life. In: Conservation and Sustainable Use of Agricultural Biodiversity. CIP-UPWARD. 134 – 224.
Murphree, M. 2005. Congruent objectives, competing interests, and
strategic compromise: concept and process in the evolution of Zimbabwe’s CAMPFIRE, 1984 – 1996. In: Brosius, P., A. Lowenhaupt-Tsing and C. Zerner (Eds.). Communities and Conservation. 105 – 148. Patiño, F., B. Condori, L. Segales & X. Cadima. 2007. Distribución Potencial, Actual y Futura de Especies Silvestres de Papa endémicas de Bolivia. In: Revista de Agricultura. Año 60, No. 44. 37 – 44 Pinto, M., E. Mamani & W. Rojas. 2007. Distribución Geográfica de Especies de Quinua Silvestre conservadas en el Banco de Germoplasma de Granos Altoandinos (BNGA). In: Revista de Agricultura. Año 60, No. 44. 45 – 55

111
Prance, G. 1997. The conservation of botanical diversity. In. Maxted, N., B. Ford-Lloyd and J. Hawkes (eds.). Plant Genetic Conservation. Chapman & Hall. 3 – 14.
PROINPA. n.d. Banco Nacional de Germoplasma de Tubérculos y Raíces Andinas. Bolivia
PROINPA. 2002 . Uso del Material Genético conservado en el Banco Nacional de Granos Altoandinos (BNGA). Bolivia. Rojas, W., M. Cayoja and G. Espindola. 2001. Catálogo de colección de quinua conservado en el Banco Nacional de Granos Alto Andinos. Fundación PROINPA. 128p. Bolivia. Reed, E. 1924. Anatomy, Embryology, and Ecology of Arachis hypogea. Botanical Gazette. Vol 78. No. 3. pp. 289-310. Renaudeau d’Arc, N and G. Lichtenstein (2003), “Impacto del manejo de la vicuna en Bolivia y Argentina sobre la conservacion de la vicuna y el desarollo local” Memoria III, Congreso Mundial sobre camelidos, Potosi, Bolivia. Tomo II : 903 – 908. Retreived Jun 3, 2009 from: http://www.macs.puc.cl/Publications/Renaudeaud_Arc_Lichtenstein.pdf Rojas, W., E. Mamani, M. Pinto, C. Alanoca & T. Ortuño. 2007. Identificación Taxonómica de Parientes Silvestres de Quinua del Banco de Germoplasma de Granos Altoandinos. In: Revista de Agricultura. Año 60, No. 44. 56 – 65 SERGEOTECMIN. 2006. Mapa Concesiones Mineras. Shape File. Bolivia. Shiva, V. 1999. Monocultures, Monopolies, Myths and the masculinization of agriculture. In: Development. 42:2: 35- 38. Retrieved Mar 20, 2011 from: http://www.ingentaconnect.com/content/pal/dev/1999/00000042/00000002/art00006
Schultz, J. 2008. Conclusion, What Bolivia teaches us. In: Schultz, J. and M. Crane-Draper. Dignity and defiance. Stories from Bolivia’s challenge to Globalization. University of California Press. 291-296.
112
Stolton, S., Maxted, N., Ford-Lloyd, B., Kell, S.P., Dudley, N., 2006. Food stores: using protected areas to secure crop genetic diversity. WWF Arguments for Protection Series. WWF, Gland,Switzerland.
Superintendencia de Hidrocarburos. 2001. Mapa Concesiones
Petroleras shape file. Ministerio de Hidrocarburos y Energía. Bolivia. Terrazas, F., A. Guidi, X. Cadima, R. Gonzalez, E. Chávez, J.
Almanza, M. Salazar & J.P. Baudoin. 2005. Conservación in situ y valoración de las papas natives en el microcentro de diversidad genetica de Candelaria, Cochabamba – Bolivia. In: Agrociencia. Vol IX, No 1 y No 2. 135 – 146.
Unidad de Ordenamiento Territorial. 2004. Mapa Vegetacion
Bolivia. Shape file. Bolivia. Unidad de Ordenamiento Territorial. 2004. Mapa Municipios
Bolivia. Shape file. Bolivia. United Nations – UN. 2008. International Year of the Potato – 2008.
Nutrition facts. Retrieved Jun 1, 2009 from: http://www.potato2008.org/en/potato/factsheets.html UNEP-GEF. 2008. In-situ Conservation of Crop Wild Relatives Through Enhanced Information Management and Field Application. Summary of the project and key findings.
UPOV. 1991. International Convention for the Protection of New Varieties of Plants. Retrieved May 25, 2009 from: http://www.upov.int/en/publications/conventions/1991/act1991.htm
VBRFMA - Viceministerio de Biodiversidad, Recursos Forestales y Medio Ambiente - Bolivia. 2009. Portal Nacional sobre Parientes Silvestres de Cultivo. Retrieved Feb. 25, 2009 from: http://www.cwrbolivia.gov.bo/index.php?option=com_frontpage Wells, M., S. Guggenheim, A. Khan, W. Wardojo and P. Jepson. 1999. Investing in Biodiversity. The world Bank. USA. Wilkie, D., G. Morelli, J. Demmer, M. Starkey, P. Telfer and M. Steil. 2006. Parks and People: Assesing the human welfare effects of establishing protected areas for biodiversity conservation. In: Conservation Biology. Vol. 20. No 1: 247 -249.

113
Wilson, K. 2005. Of Diffusion and Context: The Bubbling Up of Community-Based Resource Management in Mozambique in the 1990s. In: Brosius, P., A. Lowenhaupt-Tsing and C. Zerner (Eds.). Communities and Conservation. 149 – 176.
World Bank. 2010. World Development Indicators. Retrieved Oct 2, 2010 from: http://data.worldbank.org/data-catalog/world-development-indicators?cid=GPD_WDI World Bank (WB). 2011. Bolivia – Country Brief. Retrieved Mar 10, 2011 from: http://web.worldbank.org/WBSITE/EXTERNAL/COUNTRIES/LACEXT/BOLIVIAEXTN/0,,menuPK:322289~pagePK:141132~piPK:141107~theSitePK:322279,00.html#economy
World Trade Organization (WTO). WTO Website. Retrieved May 27, 2009 from: http://www.wto.org/
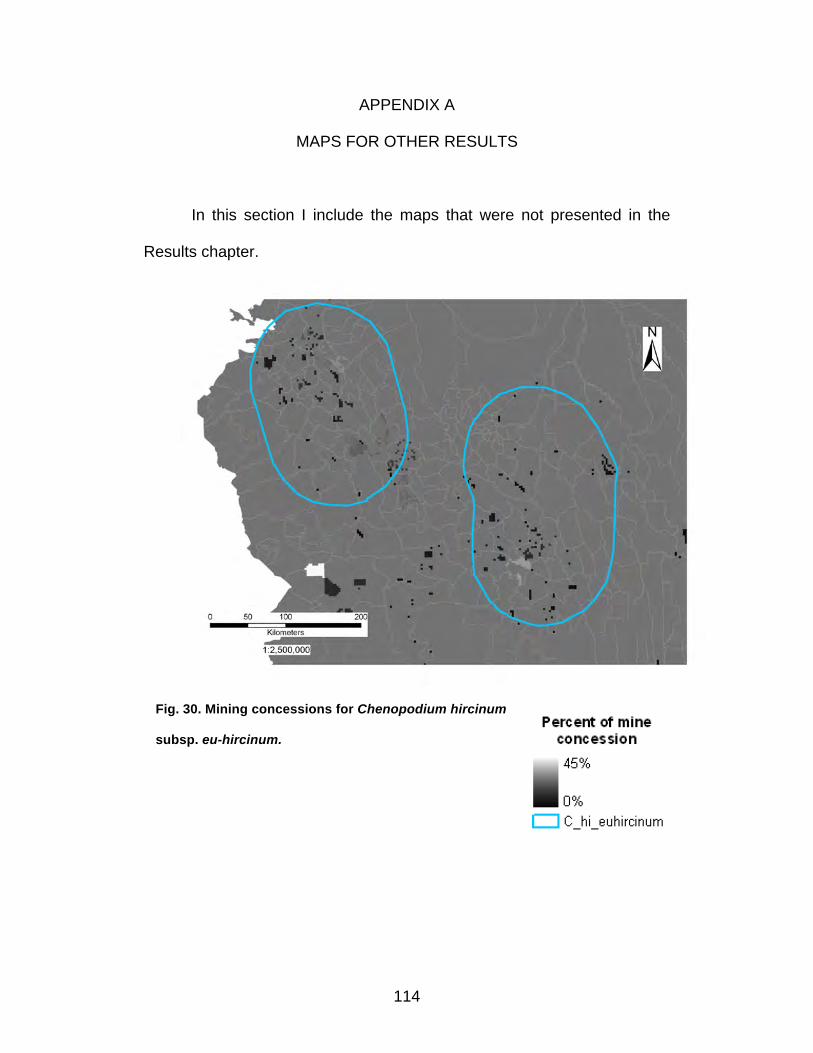
114
APPENDIX A
MAPS FOR OTHER RESULTS
In this section I include the maps that were not presented in the
Results chapter.
Fig. 30. Mining concessions for Chenopodium hircinum
subsp. eu-hircinum.
115
Fig. 31. Oil concessions for Chenopodium
hircinum subsp. eu-hircinum.

116
Fig. 32. Population dynamics for Arachis duranensis,
117
Fig. 33. Population dynamics for Arachis ringonii.

118
Fig. 34. Population dynamics for Solanum alandiae.

119
Fig. 35. Population dynamics for Solanum boliviense subsp. astleyi.

120
Fig. 36. Population dynamics for Chenopodium hircinum.
121
Fig. 37. Population dynamics for Chenopodium hircinum subsp. eu-hircinum.
122
Fig. 38. Literacy rate for Chenopodium hircinum
subsp. eu-hircinum.

123
Fig. 39. Women in local government for
Chenopodium hircinum subsp. catamarcensis.
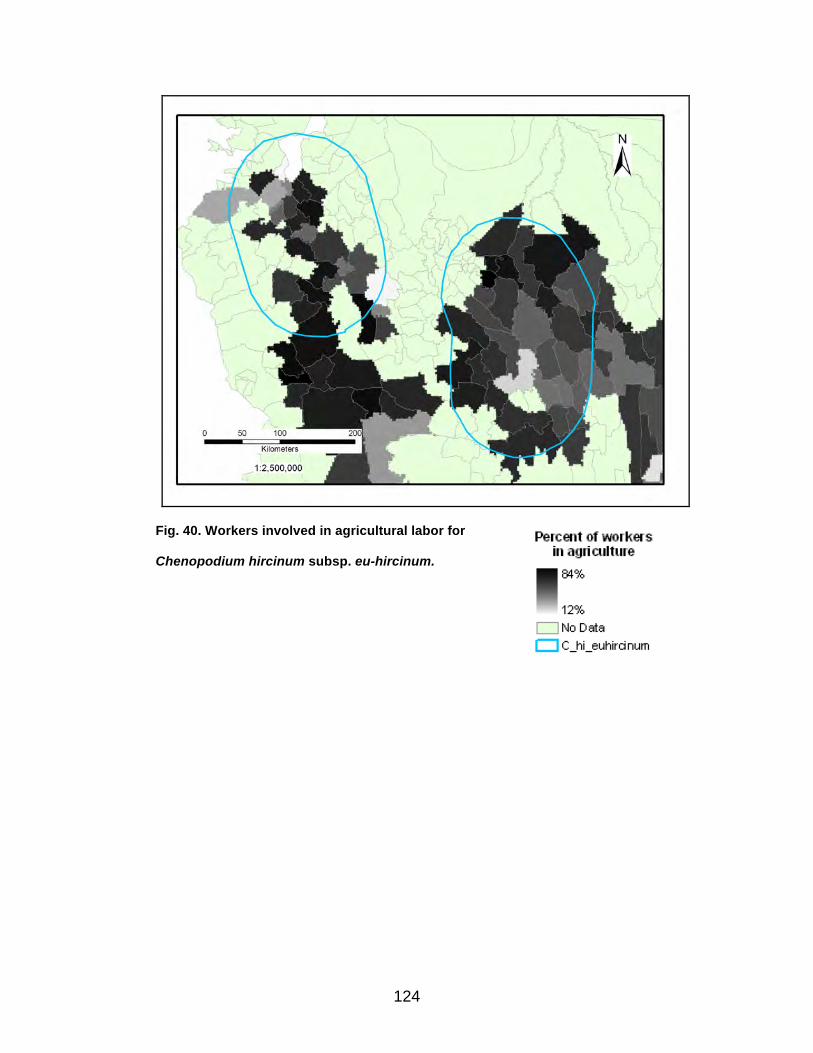
124
Fig. 40. Workers involved in agricultural labor for
Chenopodium hircinum subsp. eu-hircinum.
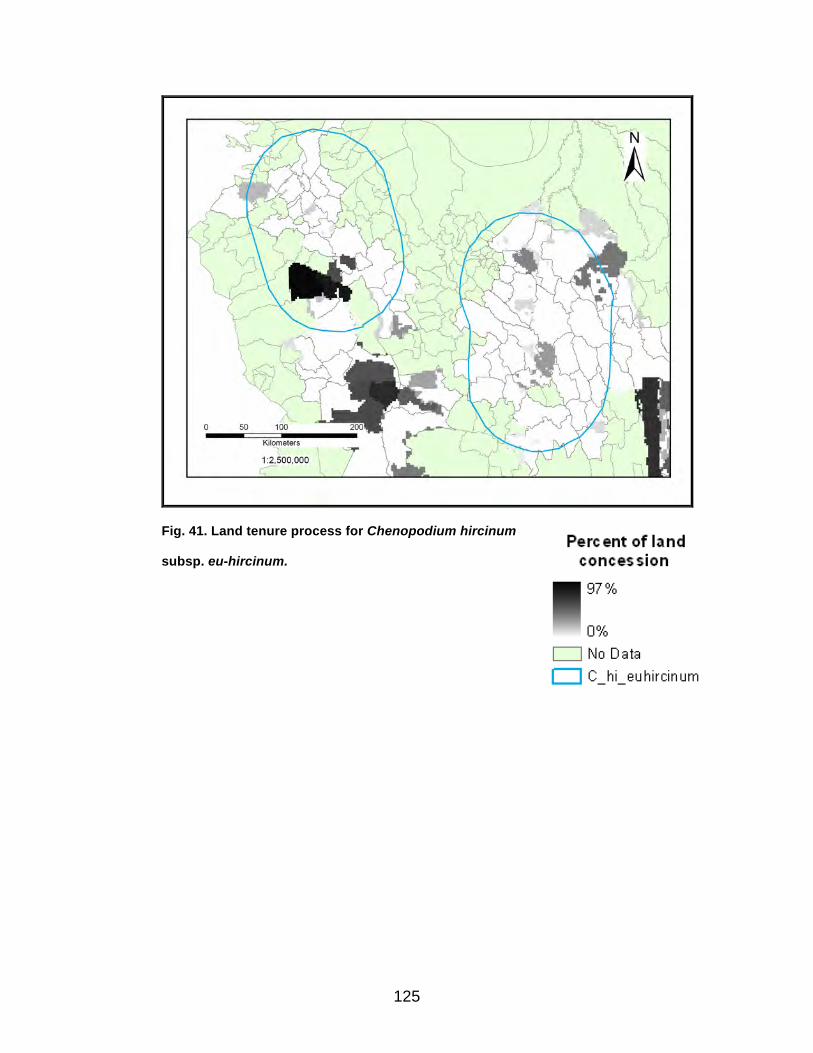
125
Fig. 41. Land tenure process for Chenopodium hircinum
subsp. eu-hircinum.
126
BIOGRAPHICAL SKETCH
Cecilia Gonzalez-Paredes was born in La Paz, Bolivia. She received the
degree of Bachelor of Biology from Universidad Autónoma de
Guadalajara, México in 2001. She taught the class of Introduction to
Botany at Universidad Mayor de San Andrés during spring 2002. During
the following years, she worked for REDESMA (Red de Desarrollo
Sostenible y Medio Ambiente - Sustainable Development and
Environment Network). During her last 3 years in REDESMA she was in
charge of the Network, publishing bimonthly bulletins, building the website
contents and coordinating activities with other NGO’s and government
units. In 2006, she moved to Germany and under the sponsorship of
InWent, participated from the professional training program on
Conservation of Biodiversity. In 2008, she entered the Graduate School at
Arizona State University.
Permanent Address: [email protected] or Casilla 2849
La Paz – Bolivia
The author typed this thesis.