connecting students with statistical research
TRANSCRIPT

Connecting Students with StatisticalResearch
Paul [email protected]
Department of Statistical ScienceUniversity College London
RSS 3 April 2019
With thanks to Nick Grindle, Elinor Jones and colleagues whohave generously contributed their time
1

Outline
• Research-based education; UCL Connected Curriculum
• ‘Meet your Professor’ assessment in Statistical Science
• How it started
• Implementation
• Feedback from students (and staff)
• Reflection
• The future
2
Research-based eduation
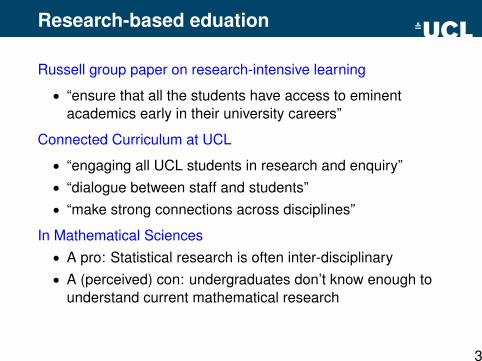
Russell group paper on research-intensive learning
• “ensure that all the students have access to eminentacademics early in their university careers”
Connected Curriculum at UCL
• “engaging all UCL students in research and enquiry”• “dialogue between staff and students”• “make strong connections across disciplines”
In Mathematical Sciences• A pro: Statistical research is often inter-disciplinary• A (perceived) con: undergraduates don’t know enough to
understand current mathematical research
3
Activities in UCL Statistical Science
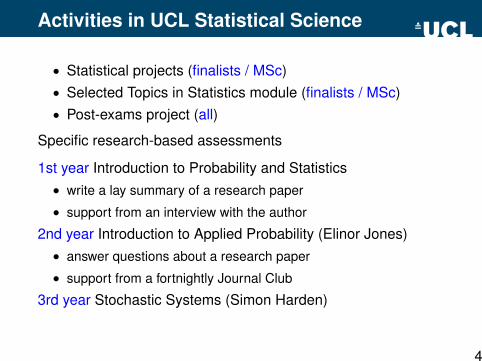
• Statistical projects (finalists / MSc)• Selected Topics in Statistics module (finalists / MSc)• Post-exams project (all)
Specific research-based assessments
1st year Introduction to Probability and Statistics• write a lay summary of a research paper
• support from an interview with the author
2nd year Introduction to Applied Probability (Elinor Jones)• answer questions about a research paper
• support from a fortnightly Journal Club
3rd year Stochastic Systems (Simon Harden)
4

In the beginning . . .
UCL Arena Centre for Research-based Education has sentinformation about a Meet Your Professor scheme for firstyear students, according to which groups of students aregiven the task of finding out about the research of aprofessor, presenting the result back to this person. This ismotivated by the Provost’s research-based teachingagenda. There was some discussion about whether weshould offer something like this. XX proposed to do thiswithout assessment, but it was felt that making it anassessment as part of STAT0002 would be better. This wasdecided. (Action: next STAT0002 lecturer, which probablywill be PN.)
DTC minutes 4/6/2014
STAT0002: “exposing the students to real-world investigations.”
5

Meet your Professor
An induction activity proposed by UCL Arena Centre forResearch-based Education
• Groups of 6-8 students• Investigate the research of an academic• Meet to share findings• Interview the academic• Group communicates the key themes of their research,
aimed at a non-specialist audience• Powerpoint representation, leaflet, . . .• The academic to give feedback
6

Meet your Professor
An in-course assessment for the 1st year undergraduatemodule STAT0002 Introduction to Probability and Statistics
• Groups of 5-6 students (assigned by me)• Investigate the research of an academic• Meet to share findings• Interview the academic• Group communicates the key themes of their research,
aimed at a non-specialist audience• Powerpoint representation, leaflet, . . .• The academic to give feedback
6
Meet your Professor
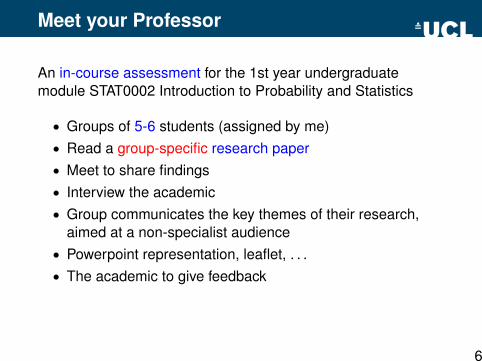
An in-course assessment for the 1st year undergraduatemodule STAT0002 Introduction to Probability and Statistics
• Groups of 5-6 students (assigned by me)• Read a group-specific research paper• Meet to share findings• Interview the academic• Group communicates the key themes of their research,
aimed at a non-specialist audience• Powerpoint representation, leaflet, . . .• The academic to give feedback
6

Meet your Professor
An in-course assessment for the 1st year undergraduatemodule STAT0002 Introduction to Probability and Statistics
• Groups of 5-6 students (assigned by me)• Read a group-specific research paper• Meet to discuss the paper• Interview the academic• Group communicates the key themes of their research,
aimed at a non-specialist audience• Powerpoint representation, leaflet, . . .• The academic to give feedback
6

Meet your Professor
An in-course assessment for the 1st year undergraduatemodule STAT0002 Introduction to Probability and Statistics
• Groups of 5-6 students (assigned by me)• Read a group-specific research paper• Meet to discuss the paper• Interview the author of the paper• Group communicates the key themes of their research,
aimed at a non-specialist audience• Powerpoint representation, leaflet, . . .• The academic to give feedback
6

Meet your Professor
An in-course assessment for the 1st year undergraduatemodule STAT0002 Introduction to Probability and Statistics
• Groups of 5-6 students (assigned by me)• Read a group-specific research paper• Meet to discuss the paper• Interview the author of the paper• Group communicates the key themes of the paper, aimed
at a non-specialist audience• Powerpoint representation, leaflet, . . .• The academic to give feedback
6

Meet your Professor
An in-course assessment for the 1st year undergraduatemodule STAT0002 Introduction to Probability and Statistics
• Groups of 5-6 students (assigned by me)• Read a group-specific research paper• Meet to discuss the paper• Interview the author of the paper• Group communicates the key themes of the paper, aimed
at a non-specialist audience• A short (1 side of A4 paper) structured report• The academic to give feedback
6

Meet your Professor
An in-course assessment for the 1st year undergraduatemodule STAT0002 Introduction to Probability and Statistics
• Groups of 5-6 students (assigned by me)• Read a group-specific research paper• Meet to discuss the paper• Interview the author of the paper• Group communicates the key themes of the paper, aimed
at a non-specialist audience• A short (1 side of A4 paper) structured report• One person (me) marks the reports and gives feedback
Time allowed: 6 weeks
6

The first assessment Oct-Dec 2014
I was hopeful but apprehensive about some things
• Support from colleagues (this wasn’t a problem)• Making the task clear, providing support to students• Students working in groups• Some papers too challenging ?• Wide range of experience and degree programmes:
Stats, Stats and Econ/Finance/Management/Language,Maths and Stats, Natural Sciences, Arts and Sciences, . . .
• Marking• judging the summaries fairly• (my) workload : each group has a different paper
7

Structure of the summary
1 Background and aimsGeneral context, why important, question(s) addressed, mainapplication
2 Data, statistical ideas and methodologyDescribe the data, key ideas, assumptions, methods, model,inference. Some reading may be necessary
3 Results and findingsMain results, relate the findings to the aims
4 Concluding remarksEmphasize main implication, limitations, future
Emphasis on clear communication
“Don’t try to make yourself look clever: it won’t work!”
8

Marking criteria
1. Clear overview of the main contribution of the paper,linking results to the aims
2. Understandable by non-specialists ?3. Describe, in general terms, the statistical methodology
used and ideas related to those encountered in STAT00024. Avoid making errors in describing the statistical aspects,
particularly errors that reveal a lack of understanding
A+ grade (≥ 80%) only if at least satisfactory on all 4 criteria
9
The papers
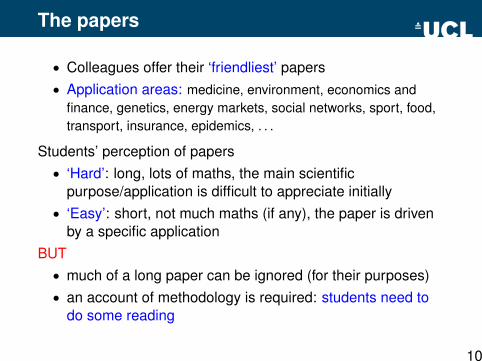
• Colleagues offer their ‘friendliest’ papers• Application areas: medicine, environment, economics and
finance, genetics, energy markets, social networks, sport, food,transport, insurance, epidemics, . . .
Students’ perception of papers• ‘Hard’: long, lots of maths, the main scientific
purpose/application is difficult to appreciate initially• ‘Easy’: short, not much maths (if any), the paper is driven
by a specific applicationBUT
• much of a long paper can be ignored (for their purposes)• an account of methodology is required: students need to
do some reading
10

Example paper 1
• no maths• main scientific aims and the results are clear• statistical methods not described in detail• students need to do some work to understand and explain:
• meta-analysis• sensitivity and specificity• confidence interval• hypothesis testing and p-values
11

Example paper 2
• Rather more Maths• Bayesian inference for a Gaussian mixture model• Dirichlet process prior for the mixing probabilities• Markov Chain Monte Carlo• Application: distinguish different types of blood cells• Challenge: explain model and inference in simple terms
12

Student support
• Lecture: explain the task and give advice• Worked example:
• a paper discussed during a lecture (Challenger SpaceShuttle Disaster)
• deconstruct the paper, assign key points to sections 1-4• example summary
• A detailed 3-page assignment sheet• “Lets be honest: you will probably not understand many of
the more technical aspects of the paper . . . ”• Impossible to cover everything, focus on the main idea(s)
• General questions via a Moodle discussion forum• “Look at general feedback given in previous years”
13
Resources
• Goodwill of colleagues• they propose 1-3 papers each• each paper: 1-hour interview
• Marking and feedback: ≈ 4 days
Feedback to students
• General feedback• Specific feedback on each group’s report
• Overall summary• Summary for each of the 4 sections• Highlighting specific issues• Giving praise
14

Feedback on a (relatively) weak summary
Volatility prediction based on scheduled macroeconomicsannouncements
Overall: You have made a good effort to try to explain some trickymathematical details. One problem is that you have relied on manyunexplained technical words and phrases, things that your target reader willnot understand.
Section 2: You have included in your text an explanation of the meaning ofthe notation that appears in the model equation. This is good. However, Iwould have been more impressed with a clear and simple general descriptionof the structure of the model, in particular description that related the errorterm in the model, the εt , to volatility and explained that in the model thisvolatility is affected by both the macroeconomic announcements and therecent volatility of the realized exchange rates. More generally, I admire thefact that you have tried to explain a lot of the detail contained in the paper, butI think that you have been over-ambitious: it would have been better toexplain fewer things and therefore have the space to be able to explain themmore carefully and more simply.
15

Feedback on a good summary
A Nonparametric Approach to the Removal of DocumentedInhomogeneities in Climate Time Series
Overall: This is a very clear summary. You might perhaps have saidsomething about how the models were fitted, and perhaps even that the GAMrequires the choice of a smoothing parameter, but I am happy with thechoices that you made. It is better that you used the limited space availableto make the main ideas clear than to risk clarity by explaining more.
Section 2: What you have written here is very clear. If I had to find a criticismI would say that you could have explained better the role of the thousandsimulated datasets : the idea is that these series have known jumps and thatthe task of the models is to recover the magnitudes of the jumps. However,this becomes absolutely clear in Section 3, so it is not a problem.
16

Feedback from staff
Informally
• Between-group variation• Some groups well-prepared, targeted questions . . .• Some groups cope well with organising the interview . . .
• Benefit from explaining research in simple terms• Nice when when students take a genuine interest• Students better informed when they choose projects
17
Feedback from students
Nick Grindle’s survey: Dec 2016. An open, optional question
Say you are meeting up with a friend following the‘Meet the Researcher’ activity.
What would you tell them about it?
Feel free to mention anything at all, for example whatyou learned, what you enjoyed or didn’t enjoy, whatwas easy or hard, what was well organised or wasn’t,or anything else.
213 students (of 219) gave a response
18

Learning: 136 students
Of these students• knowledge (facts and theories) 73%• skills (applying knowledge, . . . ) 27%• attributes (mindset required for research) 9%
“. . . I could feel [Dr Fs] enthusiasm . . . and his deep insight intostatistical theories such as Bayesian framework. He explained hisidea . . . in a understandable way and list a number of examples . . . ’
“. . . I developed new skills in communication, e.g. writing formalemails and asking concise questions to gain effective answering”
“This activity does help to improve my team work ability .”
“. . . enabled me not only to gain a deeper understanding of statistics,but also the importance of coherence and communication ability inconveying the statistical information . . . .”
19

Peers vs Profs: 63 students
• 63 students report learning from the prof (dialogue)• 51 (also) report learning from peers (collaboration)
“. . . it is really useful for us to meet the professor. . . . she has solvedthe questions we prepared. And also, we have known the aim of thispaper much more deeply.”
“The professor was really good to us. He answered all the questionsand explained every detail. I have almost understood his paper.”
“. . . everyone was active and shared the ideas with each other.Overall, I learned a lot from this activity, not only the theoreticalknowledge, but also how to well cooperate and communicate withothers.”
20

Difficulty / challenge: 76 students
“It was an enjoyable process to understand a research paper that isbeyond my current statistical knowledge ”
“I felt intimidated about the idea of interviewing the professor, butwhen you’re working with group it makes it much easier ”
“It was an interesting experience to talk to such an intelligent person,however, the difference of the knowledge between us and the profwas too big to understand too much ”
“The hardest part of the task was deciding which parts to leave out ofthe summary as a large paper had to be condensed into one page”
“It was challenging to coordinate the group and everyone haddifferent opinions, but that too [was] an opportunity to develop skills ”
“[The papers difficulty] only made the feeling of success afterunderstanding it with the help of my group even greater.”
21

Reflection
Run on 5 occasions
2014: 216 students (36 groups)2018: 288 students (48 groups)
Issues• Non-engagement• Within-group disagreements• Writing, especially for students whose first language is not
English• Scientific writing: clarity, use of mathematical notation
22
Recurring feedback themes
• Lack of cohesion between sections. . . . group memberswriting independently
• Less can be better. Don’t try to describe 6 differentmodels. Explain the most important one well.
• What are “the data”?• Give numbers a context. What does a reference value, e.g.
1, mean?• Equations. IF you include an equation then you must
explain the notation. Some of the best summaries avoidmaths.
• The first sentence(s). Simple non-technical, set the scene
23

The first sentence
1. “The two main aims of this paper were to validate theInternational Ovarian Tumor Analysis (IOTA) ‘simple rules’method and perform a meta-analysis comparing a recentresearch with six previous studies.” (2018)
2. “One general aim of diagnostics is to be less invasive whileretaining validity.” (2016)
Of these I prefer 2., but perhaps
Ovarian cancer is . . . . It is important to diagnose this diseaseaccurately because . . .
24

Positive aspects
• The keenest and most able students are stretched
“Thank you, thank you so much! I am loving readingthe paper!” (2018)
[Paper: Bayesian hierarchical model for the predictionof football results]
• Students understand better what we do• Teamwork, learning from each other• Interviewing• Writing something (o/w Stats students may not do this)
25

The future
• Alternative outputs: blog, vlog, press release, podcast,wiki, tweet(s), . . . ?
• Allow students to choose the papers and/or their groupmembers ??
• Measures to ensure that all students contribute• Increase the credit? Currently only 10% of final mark
Thank you for your attention
26