connecting it up - university of glasgow :: glasgow ... graphs are the quickest way to see patterns...
TRANSCRIPT

Connecting it up:towards a Route Map for STEM education in Scotland
Models in STEM


Unless otherwise stated, all content in this document is copyright (Copyright © University of Glasgow STEM-ED Scotland 2011). Copies may be made for educational non-commercial activities only without fee or prior permission as long as acknowledgement is given.To prevent inaccurate, misleading or inappropriate legal information being associated with The University of Glasgow, it is forbidden to alter or adapt the content of the materials without express permission. It is also forbidden to sell, license, copy or reproduce the contents of this document in whole or in part, in any manner, for commercial purposes.
3
AcknowledgementsThe support of the colleagues, individuals, groups and organisations that have contributed the data on which this report is based, whether through completing questionnaires, providing written feedback on the pathways, or taking part in interviews and discussions is gratefully acknowledged. In particular, the contributions made by David Binney (ASE), Ruth Forrester (SMC), Bob Kibble (ASE), Eddie Mullan (SMC), John Tease (Learning Teaching Scotland), and Vincent Bruce (STTA).
STEM-ED Scotland would like to express gratitude for the financial support and encouragement from the Esmeé Fairbairn Foundation for the production of the learning progressions in STEM. We would also like to acknowledge the financial support from the Scottish Government that enabled further consultation on the format and style of the learning progressions.
Supporting OrganisationsSTEM-ED ScotlandUniversity of Glasgow: Prof. John Coggins Dr Elsa Ekevall Moira Finlayson Jennifer Kirk
University of the West of Scotland: Prof. Alan Roach
Association for Science Education (ASE) Stuart Farmer
Scottish Mathematics Council (SMC) Chris Pritchard and Eddie Mullan
Scottish Technology Teachers Association (STTA) Gordon Greig
Contact:
STEM-ED ScotlandUniversity of Glasgow12A The SquareGLASGOW, G12 8QQ
0141 330 8486www.gla.ac.uk/departments/stem
Contents
Foreword Page 6Modelling and its importance in learning
Modelling Ideas and Investigations for Primary Learning Page 9
Modelling Scenarios Page 9-10Climate Page 11Rockets Page 11K’nex Page 12Kite fying Page 13-14
Modelling Investigations for Secondary Learning Page 15 Linear expansion Page 15-16Water Cycle and watching water boil Page 17-18Germination and acid rain Page 19-20Searching the internet for life! Page 21-22Why we need plants Page 23Wooden dice Page 24Gravity motor Page 25-26
4

5

6
ForewordModelling and its importance in learning
Modelling is a very important activity in education across science, technology and mathematics
In many areas studied in class patterns are established and understanding aided by discussing “models.” The models used become typically more elaborate and complex as education progresses from early levels through to higher education. It would be very beneficial forlearners to be made aware, in all cases, that models are being used, how they have contributed helpfully and what their deficiencies are.
We would wish to encourage teachers to use opportunities that repeatedly recur within experiential and active learning to “have conversations about the model used:” e.g. • howisthislike,andunlike,therealthing?• howdoesthishelpustoimaginewhatmight happenifwe...?• aretheredifferentwayswecouldrepresentthis?
This early language and use of terminology will help in later learning to build more complex and abstract mental models of things we find difficult to understand by comparing them to something that we do understand. It is a case of repeated examples in many different areas of learning that helps to develop understanding and confidence.
Definition
A model is a representation of a real situation. A model has to have a creator - the model maker. The model designer and maker must be involved in order to create the simplification.
An analogy is an object or system which already exists. It is in the decision to make use of particular properties which gives the analogy its simplifying power.
The language which you’ll find in writings about analogies is that they are used to make the unfamiliar clearer by relating it to the familiar. Often the familiar is referred to as the ‘source’ and the unfamiliar is referred to as the ‘target.’
Some Types
Models are generally used to simplify and clarify problems.They are also used to clarify learning points and illustrate concepts.
1 It is often practical to make a physical model rather than consider the real thing.2 It’s practical to consider a simulation rather than act out the actual event.3 It’s useful to consider a well-known situation which mirrors a new unfamiliar situation to help build understanding.4 A diagrammatic representation, be it a graph, chart, flowchart, map can help clarify thinking.5 It can be handy to create a notation which aids manipulation of the facts efficiently.
Specific examples of these are:
1 We might build a scale model of a bridge before building the real thing.2 a) Board games like Monopoly are simulations of property dealing. b) The weatherman uses simulation based on past experience to forecast the weather.3 The behaviour of electricity in a wire is analogous to the behaviour of water in a pipe. This can help their understanding when a child already has a notion of the behaviour of water in a pipe.4 a) Relationships like height to shoe size only come to light when a scatter graph is drawn. b) Patterns can become apparent when a suitable line graph is drawn, like the extension of a spring when different weights are hung on it. c) the schematic map of the London Underground is a very useful aid for navigating the network. 5 A problem such as “Three times Peter’s age is 10 years lessthanhisfather’sage.Hisfatheris25.HowoldisPeter?”becomes 3x = 25 – 10 … and transparently easier to solve. From the model, x = 5 which translates to “Peter is 5 years old”.
Limitations
Models and analogies are not the same as “the real thing”. If models and analogies are inappropriately applied wrong conclusions will be reached, and if an analogy is ‘taken too far’, the whole picture may be misunderstood. There is a danger that young people might start to take them literally. For example, if the earth is modelled in papier machethendoesthismeantheearthismadeofpaper?Orifwe use water in a pipe as an analogy for electricity then does this meanthatelectricityiswet?Itisimportanttokeepinmindhow the model is different from the thing being modelled.
Models often make simplifications for the sake of convenience. One cannot then ignore the simplification in any application of the model. For example the schematic map of the London Underground is excellent for helping you get from A to B, but it can’t be used as a scale drawing to find the distance between them.
The skill that teachers need to develop with their learners is to identify the ways in which the model helps and also the limitations of the model. This brings the skill of appreciating and using models into the arena of a classroom learning objective.
Interpolation
It may be inappropriate to read between values in a model. If a formula is created to model the number of people on a bus at any given bus-stop, the model can be used with whole numbers only … There may be 10 passengers at stop 9 and 16 at stop 10, but we can’t imply there were 13 passengers half-way between the stops.
Extrapolation
It is often not appropriate to go beyond the data range from which a model was created. For example, it is possible to model the relation between ‘year’ and the ‘record time for the mile’ … which includes the fact that the 4-minute mile happened in 1954 … but you wouldn’t expect the model to tell you when the 1-minute mile would be run.
7
Notes:
8
Mo
de
l T
yp
e
Sim
ula
tio
n
Ph
ys
ica
l N
ota
tio
na
l G
eo
me
tric
G
rap
hic
al
Co
gn
itiv
e
Ma
ths
Pro
ba
bili
ty d
rive
n
sim
ula
tio
n t
o im
ita
te
be
ha
vio
ur
wh
ere
m
an
y a
ctu
al
rep
etitio
ns a
re
imp
ractica
l
Ma
ps a
nd
Pla
ns.
Sca
le m
od
els
. T
rig
on
om
etr
y its
elf
ha
s its
ro
ots
in
m
akin
g s
ca
le
dra
win
gs
Exp
ressin
g t
he
u
nkn
ow
ns a
nd
th
e
va
ria
ble
s in
te
rms o
f sym
bo
ls
an
d
de
vis
ing
ru
les f
or
ma
nip
ula
tin
g s
aid
sym
bo
ls is a
co
mm
on
p
loy in
ma
the
ma
tics
an
d h
as p
rod
uce
d
mo
re t
ha
n o
ne
a
lge
bra
Ve
cto
rs a
re a
n
ab
str
act
co
nce
pt
wh
ich
be
co
me
s
ma
teri
al w
he
n
dir
ecte
d lin
e
se
gm
en
ts a
re u
se
d t
o
rep
rese
nt
the
m.
Th
e
law
s o
f E
uclid
ea
n
ge
om
etr
y a
pp
ly a
nd
ca
n b
e u
se
d t
o m
ake
d
ed
uctio
ns.
Dra
win
g g
rap
hs a
re
the
qu
icke
st
wa
y t
o
se
e p
att
ern
s a
nd
co
nn
ectio
ns.
Te
ch
niq
ue
s f
or
rela
tin
g t
he
se
gra
ph
s
to a
n a
lge
bra
ic
eq
uiv
ale
nt
cre
ate
s
bri
dg
es b
etw
ee
n t
he
g
rap
hic
al a
nd
n
ota
tio
na
l m
od
els
By c
on
sid
eri
ng
n
um
be
rs a
s 'm
on
ey
in t
he
ba
nk' a
nd
n
eg
ative
nu
mb
ers
as
de
bts
ca
n b
e a
go
od
a
na
log
y t
o u
se
to
in
tro
du
ce
in
teg
ers
.
Scie
nce
T
he
bo
ilin
g w
ate
r e
xp
eri
me
nt
an
d
co
nd
en
sa
tio
n t
o a
lim
ite
d e
xte
nt
sim
ula
tes t
he
wa
ter
cycle
in
th
e w
ea
the
r syste
m.
On
e m
igh
t stu
dy t
he
p
lan
eta
ry s
yste
m b
y
ma
kin
g a
n o
rre
ry …
w
ith
a lig
ht
so
urc
e,
ph
ase
s o
f th
e m
oo
n
or
Ve
nu
s c
an
be
e
xp
lain
ed
Th
e c
rea
tio
n o
f fo
rmu
la r
ela
tin
g
va
ria
ble
s is m
an
ife
st
in P
hysic
s.
Ch
em
ica
l fo
rmu
lae
alth
ou
gh
q
uite
diffe
ren
t ca
n
eq
ua
lly b
e u
se
d t
o
cla
rify
re
latio
nsh
ips
… w
hile
re
pre
se
ntin
g
ch
em
ica
l re
actio
ns
Wh
ere
ve
cto
r q
ua
ntitie
s e
.g.
forc
e,
ve
locity,
dis
pla
ce
me
nt
are
co
nce
rne
d a
g
eo
me
tric
mo
de
l is
o
fte
n t
he
mo
st
eff
icie
nt
rou
te t
o
un
de
rsta
nd
ing
or
a
so
lutio
n.
Wh
ere
sim
plif
ica
tio
n o
ccu
rs
e.g
. u
sin
g a
po
int
to
rep
rese
nt
a b
od
y
ag
ain
a g
eo
me
tric
m
od
el is
be
st.
Gra
ph
ing
on
e
va
ria
ble
ag
ain
st
an
oth
er
is o
fte
n
en
ligh
ten
me
nt
to t
he
u
nd
erl
yin
g
rela
tio
nsh
ip b
etw
ee
n
the
va
ria
ble
s.
With
in lim
its m
an
y
ne
w c
on
ce
pts
ca
n b
e
acce
sse
d b
y
ima
gin
ing
th
em
lik
e
so
me
oth
er
fam
ilia
r co
nce
pt.
E.g
. d
raw
ing
p
ara
llels
be
twe
en
w
ate
r flo
win
g t
hro
ug
h
a p
ipe
an
d e
lectr
icity
thro
ug
h a
wir
e c
an
be
h
elp
ful.
Te
ch
no
log
y
Ma
kin
g a
ga
me
(TC
H
3-0
9)
is in
its
elf
sim
ula
tio
n
Wo
rkin
g m
od
els
are
o
fte
n e
xp
loite
d t
o t
est
co
nce
pt
be
fore
tim
e
an
d e
ffo
rt a
re
exp
en
de
d o
n t
he
re
al
thin
g.
Fo
rmu
lae
use
d in
th
e
cre
atio
n o
f sp
rea
dsh
ee
ts d
on
't
alw
ays h
ave
an
e
qu
iva
len
t in
ma
ths
bu
t a
re v
ery
po
we
rfu
l in
dri
vin
g o
the
r m
od
els
su
ch
as
sim
ula
tio
n.
De
sig
nin
g a
n
an
ima
tio
n is m
ad
e
po
ssib
le b
y g
eo
me
tric
m
od
elli
ng
.
Usin
g t
he
gra
ph
ing
fa
cili
tie
s o
f sp
rea
dsh
ee
ts c
an
be
a
go
od
wa
y t
o c
rea
te
the
gra
ph
s.
Usin
g t
he
d
yn
am
ic r
ela
tio
n
be
twe
en
th
e d
ata
ta
ble
s a
nd
th
e
co
rre
sp
on
din
g g
rap
h
allo
ws y
ou
to
in
ve
stig
ate
th
e
va
rio
us p
ara
me
ters
of
a p
rob
lem
qu
ickly
Co
nsid
eri
ng
th
e
inte
rfa
ce
be
twe
en
th
e
use
r a
nd
th
e
co
mp
ute
r a
s a
'd
eskto
p' ca
n
sig
nific
an
tly e
ase
th
e
un
de
rsta
nd
ing
of
the
u
se
of
the
co
mp
ute
r.
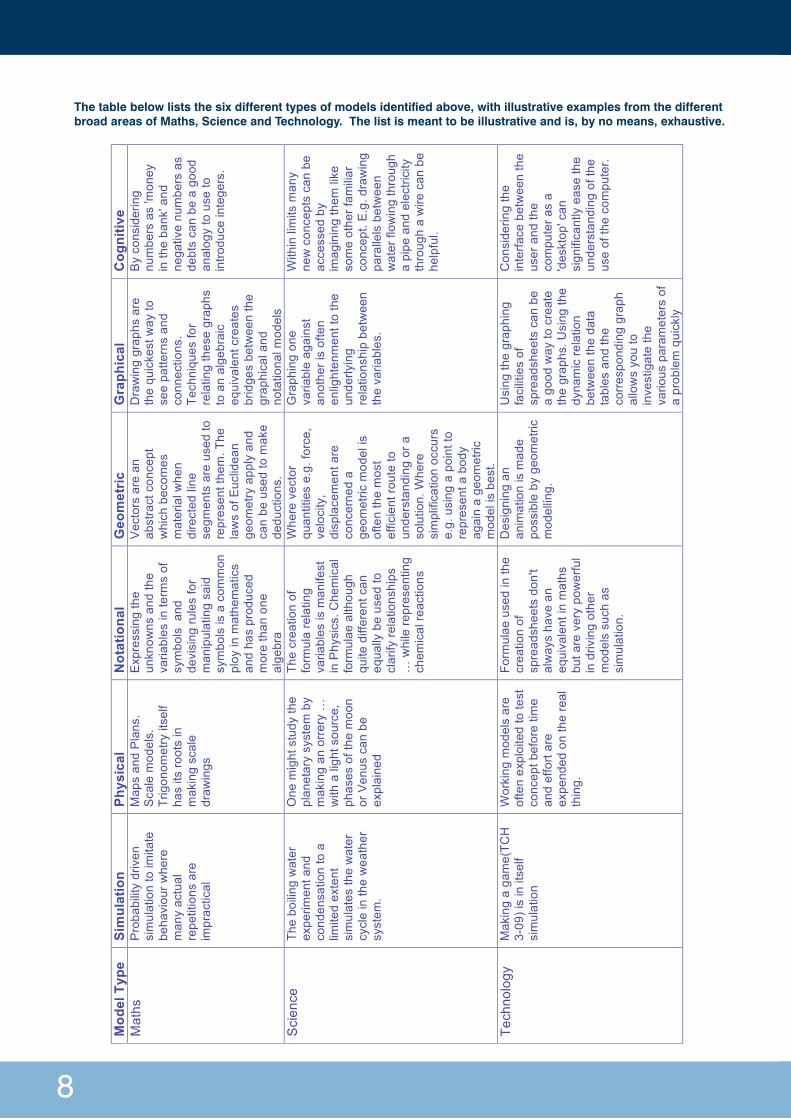
The table below lists the six different types of models identified above, with illustrative examples from the different broad areas of Maths, Science and Technology. The list is meant to be illustrative and is, by no means, exhaustive.
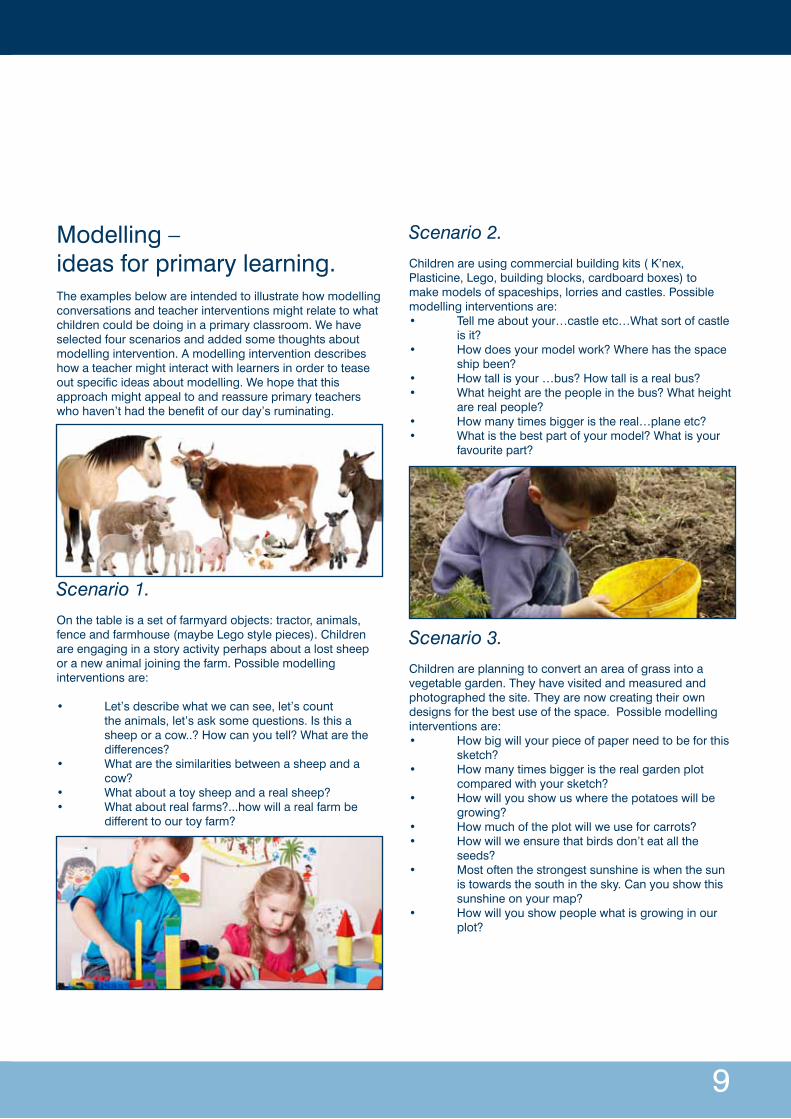
Modelling – ideas for primary learning.The examples below are intended to illustrate how modelling conversations and teacher interventions might relate to what children could be doing in a primary classroom. We have selected four scenarios and added some thoughts about modelling intervention. A modelling intervention describes how a teacher might interact with learners in order to tease out specific ideas about modelling. We hope that this approach might appeal to and reassure primary teachers who haven’t had the benefit of our day’s ruminating.
Scenario 1.
On the table is a set of farmyard objects: tractor, animals, fence and farmhouse (maybe Lego style pieces). Children are engaging in a story activity perhaps about a lost sheep or a new animal joining the farm. Possible modelling interventions are:
• Let’sdescribewhatwecansee,let’scount the animals, let’s ask some questions. Is this a sheeporacow..?Howcanyoutell?Whatarethe differences?• Whatarethesimilaritiesbetweenasheepanda cow?• Whataboutatoysheepandarealsheep?• Whataboutrealfarms?...howwillarealfarmbe differenttoourtoyfarm?
Scenario 2.
Children are using commercial building kits ( K’nex, Plasticine, Lego, building blocks, cardboard boxes) to make models of spaceships, lorries and castles. Possible modelling interventions are:• Tellmeaboutyour…castleetc…Whatsortofcastle isit?• Howdoesyourmodelwork?Wherehasthespace shipbeen?• Howtallisyour…bus?Howtallisarealbus?• Whatheightarethepeopleinthebus?Whatheight arerealpeople?• Howmanytimesbiggeristhereal…planeetc?• Whatisthebestpartofyourmodel?Whatisyour favouritepart?
Scenario 3.
Children are planning to convert an area of grass into a vegetable garden. They have visited and measured and photographed the site. They are now creating their own designs for the best use of the space. Possible modelling interventions are:• Howbigwillyourpieceofpaperneedtobeforthis sketch?• Howmanytimesbiggeristherealgardenplot comparedwithyoursketch?• Howwillyoushowuswherethepotatoeswillbe growing?• Howmuchoftheplotwillweuseforcarrots?• Howwillweensurethatbirdsdon’teatallthe seeds?• Mostoftenthestrongestsunshineiswhenthesun is towards the south in the sky. Can you show this sunshineonyourmap?• Howwillyoushowpeoplewhatisgrowinginour plot?
9

10
Scenario 4.
Children are exploring toy cars running down a ramp. The cars are running on over pieces of lino, carpet, wallpaper etc. Some children are measuring distances, others are writing results in a table. Possible modelling interventions are:• Whomightwanttoknowabouttheresultsofyour exploration?• Whyisthisworkimportanttopolicemen? Would your results be different if a real car rolled downaslope?Why?• Inwhatwaysisthisexperimentliketherealtests thatpolicemendo?• Usingamodelsavespolicementime.Canthis modelreallybehelpful?• Howwouldyoumakeyourmodeltestsmorelike therealtests?• Jasonsaysthatabiggertoycarwouldbebetter.He says it is nearer to the size of a real car. What do youthink?• Aphotographwouldhelppeopletounderstandthis explorationbutwouldadiagrambebetter?Why? Couldachartoratablebebetter?
Notes:
Investigations at primary level that involve the use of models and have cross-disciplinary links
1 Climate – Early level, e.g. P1Simple observation of sun, cloud, rain, temperature can be used to present a chart to model weather behaviour during the year. Extensions could involve designing and setting up a weather station to record the data. There are curriculum links with Social Studies.
Curriculum for Excellence Sciences, Technologies and Mathematics Links
Sciences
By safely observing and recording the sun and moon at various times, I can describe their patterns of movement and changes over time. I can relate these to the length of a day, a month and a year. SCN 1-06a
Technologies
Within real and imaginary settings, I am developing my practical skills as I select and work with a range of materials, tools and software. TCH 0-12aDuring practical activities and design challenges, I can estimate and measure using appropriate instruments and units. TCH 1-13a / TCH 2-13a
Mathematics and Numeracy Across Learning
I am aware of how routines and events in my world link with times and seasons, and have explored ways to record and display these using clocks, calendars and other methods. MNU 0-10a
I have used a range of ways to collect information and can sort it in a logical, organised and imaginative way using my own and others’ criteria. MNU 1-20b
2 Rockets – First level, e.g. P4
Interesting experiments can be carried out with film tub rockets and water rockets. There are opportunities for data collection and handling, and there is a lot of scope to discuss the similarities and differences when compared to real rockets.
Curriculum for Excellence Sciences, Technologies and Mathematics Links
Sciences
By investigating forces on toys and other objects, I can predict the effect on the shape or motion of objects. SCN 1-07a
Technologies
When exploring technologies in the world around me, I can use what I learn to help to design or improve my ideas or products. TCH 2-01aThrough discovery and imagination, I can develop and use problem-solving strategies to construct models. TCH 1-14a / TCH 2-14aHaving evaluated my work, I can adapt and improve, where appropriate, through trial and error or by using feedback. TCH 1-14b / TCH 2-14b
Mathematics and Numeracy Across Learning
I have used a range of ways to collect information and can sort it in a logical, organised and imaginative way using my own and others’ criteria. MNU 1-20b
11

12
3 K’nex and Lego - Second level, e.g. P7
Currently valued for developing problem solving skills, collaborative working, for developing spatial awareness, etc–buthowtodevelopmodellingskills?Thiswouldinvolve discussions/conversations to to highlight how the model is similar to, but not the same as the real thing modelled; and for using terminology, such as strength and scale. This could involve devising tests and testing against agreed criteria.
Curriculum for Excellence Sciences, Technologies and Mathematics Links
Technologies
By applying my knowledge and skills of science and mathematics, I can engineer 3D objects which demonstrate strengthening, energy transfer and movement. TCH 2-12a / TCH 3-12aDuring practical activities and design challenges, I can estimate and measure using appropriate instruments and units. TCH 1-13a / TCH 2-13aThrough discovery and imagination, I can develop and use problem-solving strategies to construct models. TCH 1-14a / TCH 2-14aHaving evaluated my work, I can adapt and improve, where appropriate, through trial and error or by using feedback. TCH 1-14b / TCH 2-14b
Mathematics and Numeracy Across Learning
Having explored a range of 3D objects and 2D shapes, I can use mathematical language to describe their properties, and through investigation can discuss where and why particular shapes are used in the environment. MTH 2-16a
Notes:

4 Kite flying
The project objective is for the class to work in groups to research, design, construct and test a kite, with particular regard to using commonplace materials to create substantial structures. The learners will be required to complete a Design Folio documenting the various stages of the process, and will build a number of small-scale prototypes to illustrate their concepts.
The class will research elements of aerodynamics, with an emphasis on the importance of symmetry to creating stable aerodynamic structures, and will be required to demonstrate an understanding of these principles through the conceptual design stages.
Learners will also investigate the properties of a range of common materials (drinking straws, paper, fabrics, etc), and will discover how relatively strong structures can be created from seemingly fragile materials through the application of simple geometric principles, i.e. creating triangular braces.
Engineering is the practical application of science and mathematics, in conjunction with the tools of technology, to find solutions to problems which result in the creation of functional products. The project can be set as an engineering problem by introducing design parameters and a practical purpose for the kite, for example the kite is going to act as a weather station and must be able to fly supporting a thermometer and/or wind meter, etc.
The project allows the teacher to act as a facilitator and the learners to show creativity and innovation.
Learning Outcomes
By the end of the project learners should:• Understandhowsimplestructurescanbemade stronger and more rigid• Understandhoweverydaymaterialscanbeutilised for alternative purposes• Beabletousesimplegeometryandmathematicsin the design of a structure
• Gainanappreciationoftheinherentstrengthsand weaknesses of materials• Haveanawarenessofthevariousstagesofthe design process• Beabletoresearchatopicandcollatefindings using a variety of sources• Haveanawarenessofthevariousstagesofthe manufacturing process• Havetheabilitytocommunicatetheirdesign proposal through use of sketches.• Beabletoevaluateadesignagainstanumberof given criteria• Havegainedskillsinjoiningmaterialsand components accurately• Haveanappreciationoftheimportanceoftesting and refinement in the design process• Beabletoevaluateadesignagainstaspecification
Resources Required
• ConstructionMaterials• FolioBooklets• Handles/String
Models
• DesignFolio(research,concepts,manufacturing process, evaluation)• Prototypes• FinalDesign
Comments
• Groupswillevaluatetheirdesignsagainstanumber of criteria, such as symmetry, weight, aesthetics, etc. Where appropriate the teacher may introduce peer assessment by having groups evaluate each others’ designs. • Learnersshoulduseavarietyofsourcesfor research (internet, books, magazines, etc)• Learnersshouldevaluatetheirengineering solutions against the success of meeting the specified design parameters, their performance, the cost of producing the product (e.g. unless the materials are each given a cost the amount of materials used in the design), and aesthetics.
Possible Development
• Itisanticipatedthatattheconclusionoftheproject learners will test their models outdoors. Objective criteria for success could be developed such as: maximum attainable height (measure the string), flight time, etc.
13
14
• Furthercross-curricularlinksmaybedeveloped by introducing a cultural component to the project. Kites are traditionally used in China in festivals and as an art form, and the class may be instructed to research and develop an Asian theme for their kite.• Learnersshouldbegiventheopportunitypost- testing to evaluate the success or failure of their designs and offer suggestions on how future designs could be improved.
Curriculum for Excellence Sciences, Technologies and Mathematics Links
Sciences
By investigating how friction, including air resistance, affects motion, I can suggest ways to improve efficiency in moving objects. SCN 2-07aThrough exploring properties and sources of materials, I can choose appropriate materials to solve practical challenges. SCN 1-15a
Technologies
When exploring technologies in the world around me, I can use what I learn to help to design or improve my ideas or products. TCH 2-01aBy applying my knowledge and skills of science and mathematics, I can engineer 3D objects which demonstrate strengthening, energy transfer and movement. TCH 2-12a / TCH 3-12aI have gained confidence and dexterity in the use of materials, tools, equipment, software or control technology and can apply specialist skills to make quality products. TCH 3-13aDuring practical activities and design challenges, I can estimate and measure using appropriate instruments and units. TCH 1-13a / TCH 2-13aI can use drawing techniques, manually or electronically, to represent objects or ideas, enhancing them using effects such as light, shadow and textures. TCH 2-15aI can practise and apply a range of preparation techniques and processes to manufacture a variety of items in wood, metal, plastic or other material, showing imagination and creativity, and recognising the need to conserve resources. TCH 3-13bBy using problem-solving strategies and showing creativity in a design challenge, I can plan, develop, organise and evaluate the production of items which meet needs at home or in the world of work. TCH 3-14a
Mathematics and Numeracy Across Learning
I can illustrate the lines of symmetry for a range of 2D shapes and apply my understanding to create and complete symmetrical pictures and patterns. MTH 2-19a / MTH 3-19aI have used a range of ways to collect information and can sort it in a logical, organised and imaginative way using my own and others’ criteria. MNU 1-20bI can draw 2D shapes and make representations of 3D objects using an appropriate range of methods and efficient use of resources. MTH 2-16cI can accurately measure and draw angles using appropriate equipment, applying my skills to problems in context. MTH 2-17bI can use the common units of measure, convert between related units of the metric system and carry out calculations when solving problems. MNU 2-11b
Notes:

ModellingInvestigations at secondary level that involve the use of models and have cross-disciplinary links
The following investigations can be used as a starting point to plan and implement interdisciplinary modelling projects between science, technology and mathematics departments in secondary schools. The investigations can be used in the classroom as they are described or they can act as a guide to stimulate discussions between departments on interdisciplinary projects involving modelling. To allow for flexibility no subject areas have been singled out as the lead area. The emphasis placed on the investigations in the classroom, and which curriculum areas are covered, have been left to the discretion of the teacher. The Curriculum for Excellence Experience and Outcomes in Sciences, Technologies and Mathematics that can be accomplished through the investigations range from Second Level through to Fourth Level.
1 Linear Expansion
As the rod, which is clamped at one end, is heated it will expand, causing the needle roller to rotate. This will be evident by the rotation of the straw.Time can be graphed against Size of deflection till the system stabilizes.
Repeat using rods of differing materials.
Winding thread round the needle, say 50 times, and measuring the length of the thread required will allow you to work out the circumference of the needle [Length of thread ÷ 50]. This is the length that the rod expands if the needle, and hence the straw, rotates through 360˚. Direct proportion will allow you to calculate the amount of expansion for each degree of rotation [Circumference of needle ÷ 360].This knowledge should allow you to calibrate the graduated scale to measure the amount of expansion. Discussion of what assumptions are being made, e.g. no slippage, should ensue.
Outcomes
• metalexpandswhenheated• differentmetalsexpandatdifferentrates.• differentmetalsexpandbydifferentamounts.
Data captured
• sizeofrotationandthecorrespondingtime.
Models
• diagramofequipment• tableofresults• graphofresults
Comment
• useofICTtowriteupareportandcreatetablesand graphs would enhance the experience and bring technology further into the project.
15
DRAFT - 1 Nov
13
Investigations at secondary level that involve the use of models and have cross-disciplinary
links
The following investigations can be used as a starting point to plan and implement interdisciplinary modelling projects between science, technology and mathematics departments in secondary schools. The investigations can be used in the classroom as they are described or they can act as a guide to stimulate discussions between departments on interdisciplinary projects involving modelling. To allow for flexibility no subject areas have been singled out as the lead area. The emphasis placed on the investigations in the classroom, and which curriculum areas are covered, have been left to the discretion of the teacher. The Curriculum for Excellence Experience and Outcomes in Sciences, Technologies and Mathematics that can be accomplished through the investigations range from Second Level through to Fourth Level.
1 Linear Expansion
As the rod, which is clamped at one end, is heated it will expand, causing the needle roller to rotate. This
will be evident by the rotation of the straw.
Time can be graphed against Size of deflection till the system stabilizes.
Repeat using rods of differing materials.
Winding thread round the needle, say 50 times, and measuring the length of the thread required will allow you to work out the circumference of the needle
[Length of thread ÷ 50]. This is the length that the rod expands if the needle, and hence the straw, rotates
through 360˚. Direct proportion will allow you to calculate the amount of expansion for each degree of
rotation [Circumference of needle ÷ 360]. This knowledge should allow you to calibrate the graduated scale to measure the amount of expansion.
Discussion of what assumptions are being made, e.g. no slippage, should ensue.
Outcomes
metal expands when heated
different metals expand at different rates. different metals expand by different amounts.
Data captured
size of rotation and the corresponding time.
clamp
flame
metal rod
stand
needle acting as a roller
straw transfixed on needle
card with
graduations

Possible Development
• Usingelectronicequipmenttheactualtemperatures of the rod could be measured. Thereafter, calibration of the graduations behind the straw could be used to construct a rudimentary thermometer. Discussion of how using a thermometer to make a thermometer would seem silly, but should take place. The idea that there would be no need for this if you were inventing your own temperature scale might help the learner develop an appreciation that units are man-made.
• Theideaofuncertainty,howmeasurement uncertainties might ‘swamp’ the results and how uncertainties in the data might be represented in the model.
Curriculum for Excellence Science Technologies & Mathematics Links
Sciences
Learning in the sciences will enable me to: develop the skills of scientific inquiry and investigation using practical techniques
I have developed my knowledge of the Periodic Table by considering the properties and uses of a variety of elements relative to their positions. SCN 3-15a
Technologies
From my studies of technologies in the world around me, I can begin to understand the relationship between key scientific principles and technological developments. TCH 3-01aI enhance my learning by applying my ICT skills in different learning contexts across the curriculum. TCH 3-04aBy applying my knowledge and skills of science and mathematics, I can engineer 3D objects which demonstrate strengthening, energy transfer and movement. TCH 2-12a / TCH 3-12a
Mathematics and Numeracy Across Learning
I can solve practical problems by applying my knowledge of measure, choosing the appropriate units and degree of accuracy for the task and using a formula to calculate area or volume when required. MNU 3-11aI can display data in a clear way using a suitable scale, by choosing appropriately from an extended range of tables, charts, diagrams and graphs, making effective use of technology. MTH 2-21a / MTH 3-21aI can evaluate and interpret raw and graphical data using a variety of methods, comment on relationships I observe within the data and communicate my findings to others.
MNU 4-20a
16
Notes:

17
2 Water Cycle and Watching Water Boil.
Water, initially at room temperature is heated under a constant heat source until it boils. The heat is kept on the beaker as steam is formed. When the steam hits the cold plate it condenses and runs off.
During this process the temperature is taken at constant time intervals, say each minute and continued for about 4 or 5 minutes after it has reached the point of boiling.
When the heat source is removed data can be collected as the liquid cools towards room temperature.
As an aside, another beaker of water can be left sitting in the sun covered by a clear class plate. After a while moisture will
be observed on the underside of the plate.
Outcomes
• agraphicillustrationofthewatercycle.• acurvewhichshowsthetemperature‘sticking’ once it reaches the boiling point.• acoolingcurvewhichshows,informally, exponential decay.
Data captured
• temperatureandthecorrespondingtime.
Models
• diagramofequipment• theexperimentitselfisamodelofthe‘WaterCycle’ in the Earth’s weather.• graphofresultsshowingtwodistinctphasesviz rising temperature and an equilibrium state. [this models how the radiator in a car works . . . while there’s water in the radiator it can’t rise above the boiling point of water].• graphofresultsshowingtheclassiccoolingcurve.• possibleanimatedgraphicstoillustratethewater cycle.
Comment
As well as the Water Cycle, the learners could be made aware that the same process is used in the Whisky Distilling Industry and in oil refining. Possible Development
ICT can be used to simulate the cooling curve:On a fresh Microsoft Excel spreadsheet start a table see belowEnter the word ‘Difference’ in cell A1.In cell A3 type =$B$2*A2. It should read 48 which is 0·6 × 80.Select A3 and ‘Fill down’ to cell A21.In the ‘reading’ column enter the numbers 1 to 20 by filling down or typing.In D2 enter ‘room temperature, here 20˚C. In D3 enter =D2Select D3 and ‘Fill down’ to cell D21.In cell E3 type =A2+$D$2. It should read 100 when you hit <RETURN>.Select E3 and ‘Fill down’ to cell E21.
Difference rate of cooling reading room
temperature
water
temperature
80 0.6 1 20
DRAFT - 1 Nov
15
2 Water Cycle and Watching Water Boil.
Water, initially at room temperature is heated under a constant heat source until it boils. The heat is kept
on the beaker as steam is formed. When the steam hits the cold plate it condenses and runs off.
During this process the temperature is taken at constant time intervals, say each minute and continued for
about 4 or 5 minutes after it has reached the point of boiling.
When the heat source is removed data can be collected as the liquid cools towards room temperature.
As an aside, another beaker of water can be left sitting in the sun covered by a clear class plate. After a while moisture will be observed on the underside of the plate.
Outcomes
a graphic illustration of the water cycle.
a curve which shows the temperature ‘sticking’ once it reaches the boiling point.
a cooling curve which shows, informally, exponential decay.
Data captured
temperature and the corresponding time.
Models
diagram of equipment
the experiment itself is a model of the ‘Water Cycle’ in the Earth’s weather. graph of results showing two distinct phases viz rising temperature and an equilibrium state. [this
models how the radiator in a car works . . . while there’s water in the radiator it can’t rise above
the boiling point of water]. graph of results showing the classic cooling curve.
possible animated graphics to illustrate the water cycle.
Comment
As well as the Water Cycle, the learners could be made aware that the same process is used in the Whisky
Distilling Industry and in oil refining.
steam
water
thermometer
beaker
metal plate on clamp
beaker heat source

Select C2 to E21 and insert a chart like this:
Play with the fraction in B2 (currently 0·6) to see if you get a model that more represents the graph you obtained from observing the water cool.
Curriculum for Excellence Sciences, Technologies and Mathematics Links
Sciences
I can apply my knowledge of how water changes state to help me understand the processes involved in the water cycle in nature over time. SCN 2-05aBy contributing to experiments and investigations, I can develop my understanding of models of matter and can apply this to changes of state and the energy involved as they occur in nature. SCN 3-05a
Technologies
I enhance my learning by applying my ICT skills in different learning contexts across the curriculum. TCH 3-04aUsing appropriate software, I can work individually or collaboratively to design and implementa game, animation or other application. TCH 3-09aBy applying my knowledge and skills of science and mathematics, I can engineer 3D objects which demonstrate strengthening, energy transfer and movement. TCH 2-12a / TCH 3-12aHaving explored graphical techniques and their application, I can select, organise and represent information and ideas graphically. TCH 3-15a
Mathematics and Numeracy Across Learning
I can solve practical problems by applying my knowledge of measure, choosing the appropriate units and degree of accuracy for the task and using a formula to calculate area or volume when required. MNU 3-11aI can display data in a clear way using a suitable scale, by choosing appropriately from an extended range of tables, charts, diagrams and graphs, making effective use of technology. MTH 2-21a / MTH 3-21aI can select appropriately from a wide range of tables, charts, diagrams and graphs when displaying discrete, continuous or grouped data, clearly communicating the significant features of the data. MTH 4-21a
18
Notes:

3 Germination and Acid Rain
Explore success/failure rate of the germination of cress seeds under different conditions.i . Make sure you know the germination rate of a batch of seeds by looking at a batch of about 50 seeds using distilled water.ii. Now use various other waters: • rainwatercollectedlocally • waterwithapHof5…anyrainbelow5·0 is considered acid. • waterwithapHof4 • waterwithapHof3iii. As well as failure rates collect data on the speed at which germination takes place.iv. Run simulations to model larger sowings on the computer … larger sowings which would otherwise be impractical.
Running the simulation in Microsoft Excel.Let us say that we have discovered the failure rate of the seeds is 0·1. [10%]In F1 type 0.1.In A1 type =IF(RAND()<$F$1,”fail”,”succeed”)Select A1 and ‘Fill right’ to E1.Select A1 to E1 and ‘Fill down’ to row 20.This will simulate the outcome of planting 100 seeds whose chances of not germinating are 0·1.
To save you having to count them,In A22 type succeedIn A23 type failIn B22 type =COUNTIF(A1:E20,A22)In B23 type =COUNTIF(A1:E20,A23)To simulate another batch of 100, double click an empty cell and press <RETURN>
To simulate a more acid soil, make the failure rate in F1 bigger.Collect the data to perform statistical analysis on it.
Outcomes
• aquickillustrationthattheeffectofpollutionhason plant life.• themoreacidisthewatersupplytheless successful is the germination.• themoreacid,theslowerisanygermination. learn the beginnings of computer simulation.
Data captured
• acidityandthecorrespondingtimetogerminate and success rate as a percentage of seeds sown.
Models
• Controlledacidsolutionconcentrationsmodelsthe rain’s acidity (but not its chemical composition)• Computersimulation• Graphstohighlighttherelationbetweenacidityand success rate.
Comment
It could be instructive to have a look at industrial centres near you and the direction of the prevailing wind. Possible Development
• Awebsearchforsiteswhereacidrainhasbecome a major problem to provide materials for a report. • Doalkalinesoilshavethesameorsimilareffect?• Doallplantsreacttoacidrainthesameway?
19

Curriculum for Excellence Sciences, Technologies and Mathematics LinksSciences
I have propagated and grown plants using a variety of different methods. I can compare these methods and develop my understanding of their commercial use. SCN 4-02aI can explain some of the processes which contribute to climate change and discuss the possible impact of atmospheric change on the survival of living things. SCN 3-05b
Technologies
Having explored graphical techniques and their application, I can select, organise and represent information and ideas graphically. TCH 3-15aI enhance my learning by applying my ICT skills in different learning contexts across the curriculum. TCH 3-04aI explore and experiment with the features and functions of computer technology and I can use what I learn to support and enhance my learning in different contexts. TCH 1-04a / TCH 2-04aHaving analysed how lifestyle can impact on the environment and Earth’s resources, I can make suggestions about how to live in a more sustainable way. TCH 2-02a
Mathematics and Numeracy Across Learning
I can find the probability of a simple event happening and explain why the consequences of the event, as well as its probability, should be considered when making choices. MNU 3-22aBy applying my understanding of probability, I can determine how many times I expect an event to occur, and use this information to make predictions, risk assessment, informed choices and decisions. MNU 4-22aIn order to compare numerical information in real-life contexts, I can find the mean, median, mode and range of sets of numbers, decide which type of average is most appropriate to use and discuss how using an alternative type of average could be misleading. MTH 4-20bI can solve problems by carrying out calculations with a wide range of fractions, decimal fractions and percentages, using my answers to make comparisons and informed choices for real life situations. MNU 3-07a
When analysing information or collecting data of my own, I can use my understanding of how bias may arise and how sample size can affect precision, to ensure that the data allows for fair conclusions to be drawn. MTH 3-20b
20
Notes:
4 Searching the Internet for Life!
Use the internet to help you find answers to the following questions.• whatfractionofstarsinthegalaxyhaveplanetary systems?• whatfractionoftheplanetsroundoursuncould supportlife?• whatfractionofthosedosupportlife?
Can you use the answer to these questions to come up with an estimate of there being other life in the galaxy apart from us?
Suppose your answer to the three questions were Q1 0·1, Q2 0·2, Q3 0.3 then you could run a simulation to combine your answers and find what fraction of the planets round our galaxy support life.Open a spreadsheet and in A1 type =IF(AND(RAND()<0.1,RAND()<0.2,RAND()<0.3),”life”,”-”)The computer creates 3 random numbers. If the first one is less than 0·1 AND the next is less than 0·2 AND the third is less than 0·3 the word “life” will appear in the cell, otherwise a dash will appear signifying “no life”.Fill your formula to make a row of 5 and then down to cover 100 cells.This will simulate the exploration of 100 suns for life.Double-clicking an empty cell and pressing <RETURN> will explore another 100 suns. Do this several times and average your data.Write a report on the possibility of life in the galaxy. What other questions would you have to have the answers to in order to answer the question, “What is the likelihood of life somewhereelsecontactingus?
Outcomes
• howtoformareasonedargumentforlifeinthe galaxy.• theuseofknowninformationtoestimatethatwhich we don’t know.• findinginformationfromthewebanddecidinghow robust it is.• discussionandargumentamongstpeers.
Data captured
• variousproportionsandpercentagesandlearned opinion.
Models
• theuseofsimulationtocombineprobabilities.• thedevelopmentofacalculatortodothe combining.
Comment
Answers vary and the learner should be encouraged to cite his source or sources and if he used them as they were or did he collect various sources and take an average.Q1 some sources give 25% Q2 2/9 if you count Pluto as a planet and consider Earth and Mars as habitable Q3 1/2 if you accept the answer to Q2.
Possible Development
Learners might be directed to read up on the Drake Equation.
Curriculum for Excellence Sciences, Technologies and Mathematics Links
Sciences
By using my knowledge of our solar system and the basic needs of living things, I can produce a reasoned argument on the likelihood of life existing elsewhere in the universe. SCN 3-06a
Technologies
I enhance my learning by applying my ICT skills in different learning contexts across the curriculum. TCH 3-04aI explore and experiment with the features and functions of computer technology and I can use what I learn to support and enhance my learning in different contexts. TCH 1-04a / TCH 2-04a
21

Mathematics and Numeracy Across Learning
I can find the probability of a simple event happening and explain why the consequences of the event, as well as its probability, should be considered when making choices. MNU 3-22aBy applying my understanding of probability, I can determine how many times I expect an event to occur, and use this information to make predictions, risk assessment, informed choices and decisions. MNU 4-22aIn order to compare numerical information in real-life contexts, I can find the mean, median, mode and range of sets of numbers, decide which type of average is most appropriate to use and discuss how using an alternative type of average could be misleading. MTH 4-20bWhen analysing information or collecting data of my own, I can use my understanding of how bias may arise and how sample size can affect precision, to ensure that the data allows for fair conclusions to be drawn. MTH 3-20b
22
Notes:

5 Plants producing oxygen
Sit the assembly in strong sunlight and watch the underwater plant giving off bubbles.Using the calibratations measure the volume (ml) of the gas given off per minute.Remove the tube from the water and insert a glowing taper into it.
Whatisthegasproduced?Calculate the rate at which the gas is being produced.Repeat the experiment several times so that you have enough data to average.Whathappensifyoudoubletheamountofweed?
Explore other parameters in the experiment. If you use artificiallightdoesitmakeadifference?Usetwolampsinsteadofone.Doesthatmakeadifference?
Write a report of your findings.
Outcomes
• anappreciationofthefactthatplantsproduce oxygen• anappreciationofthefactthatplantsneedlightto do this.• identifyingarelationbetweentheamountofweed and the rate of oxygen production.• identifyingarelationbetweentheamountoflight and the rate of oxygen production
Data captured
• volumewithtimeforafixedvolume.• quantityofweedandvolumeinafixedtime• amountoflightandvolumeinafixedtime
Models
• thediagramoftheexperimentitself.• theuseoftheweedtorepresentallplantlifeinthe world.• theuseofgraphstosearchforrelationships.
Comment
Howsoundisthesecondmodel?Doallplantlifeinsunlightgiveoffoxygen?
Possible Development
Similar experiments can be devised exploring the respiration of a plant using lime water to detect the production of carbondioxide.
Curriculum for Excellence Sciences, Technologies and Mathematics Links
Sciences
Through carrying out practical activities and investigations, I can show how plants have benefited society. SCN 2-02bI have collaborated on investigations into the process of photosynthesis and I can demonstrate my understanding of why plants are vital to sustaining life on Earth. SCN 3-02a
Technologies
Having analysed how lifestyle can impact on the environment and Earth’s resources, I can make suggestions about how to live in a more sustainable way. TCH 2-02aFrom my studies of sustainable development, I can reflect on the implications and ethical issues arising from technological developments for individuals and societies. TCH 3-02a
Mathematics and Numeracy Across Learning
Having discussed the variety of ways and range of media used to present data, I can interpret and draw conclusions from the information displayed, recognising that the presentation may be misleading. MNU 2-20aI can evaluate and interpret raw and graphical data using a variety of methods, comment on relationships I observe within the data and communicate my findings to others. MNU 4-20aIn order to compare numerical information in real-life contexts, I can find the mean, median, mode and range of sets of numbers, decide which type of average is most appropriate to use and discuss how using an alternative type of average could be misleading. MTH 4-20b
DRAFT - 1 Nov
22
5 Why we need plants.
Sit the assembly in strong sunlight and watch the underwater plant giving off bubbles.
Using the calibratations measure the volume (ml) of the gas given off per minute. Remove the tube from the water and insert a glowing taper into it.
What is the gas produced?
Calculate the rate at which the gas is being produced.
Repeat the experiment several times so that you have enough data to average.
What happens if you double the amount of weed?
Explore other parameters in the experiment. If you use artificial light does it make a difference? Use two
lamps instead of one. Does that make a difference?
Write a report of your findings.
Outcomes
an appreciation of the fact that plants produce oxygen
an appreciation of the fact that plants need light to do this. identifying a relation between the amount of weed and the rate of oxygen production.
identifying a relation between the amount of light and the rate of oxygen production
Data captured
volume with time for a fixed volume.
quantity of weed and volume in a fixed time
amount of light and volume in a fixed time
Models
the diagram of the experiment itself. the use of the weed to represent all plant life in the world.
the use of graphs to search for relationships.
Comment
How sound is the second model? Do all plant life in sunlight give off oxygen?
Possible Development
Similar experiments can be devised exploring the respiration of a plant using lime water to detect the
production of CO2.
Curriculum for Excellence Sciences, Technologies and Mathematics Links Sciences Through carrying out practical activities and investigations, I can show how plants have benefited society. SCN 2-02b
water weed
beaker
filter funnel
calibrated measuring tube.
23
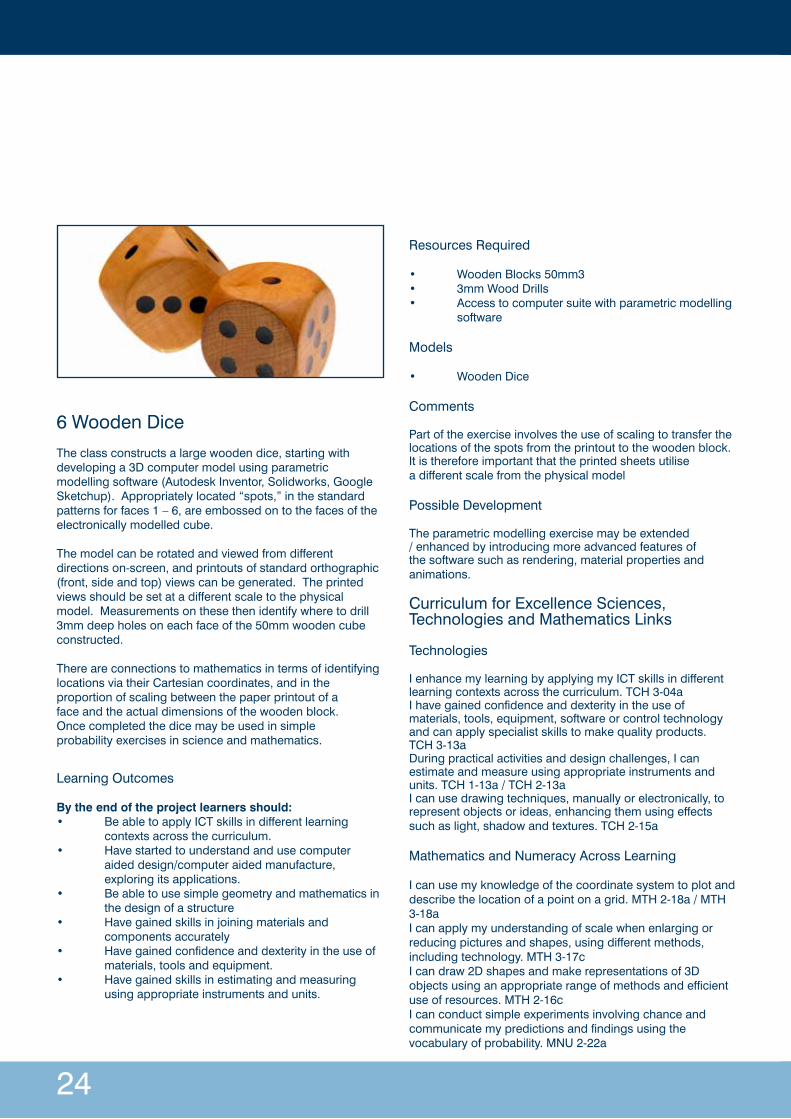
6 Wooden Dice
The class constructs a large wooden dice, starting with developing a 3D computer model using parametric modelling software (Autodesk Inventor, Solidworks, Google Sketchup). Appropriately located “spots,” in the standard patterns for faces 1 – 6, are embossed on to the faces of the electronically modelled cube.
The model can be rotated and viewed from different directions on-screen, and printouts of standard orthographic (front, side and top) views can be generated. The printed views should be set at a different scale to the physical model. Measurements on these then identify where to drill 3mm deep holes on each face of the 50mm wooden cube constructed.
There are connections to mathematics in terms of identifying locations via their Cartesian coordinates, and in the proportion of scaling between the paper printout of a face and the actual dimensions of the wooden block. Once completed the dice may be used in simple probability exercises in science and mathematics.
Learning Outcomes
By the end of the project learners should:• BeabletoapplyICTskillsindifferentlearning contexts across the curriculum.• Havestartedtounderstandandusecomputer aided design/computer aided manufacture, exploring its applications.• Beabletousesimplegeometryandmathematicsin the design of a structure• Havegainedskillsinjoiningmaterialsand components accurately• Havegainedconfidenceanddexterityintheuseof materials, tools and equipment.• Havegainedskillsinestimatingandmeasuring using appropriate instruments and units.
Resources Required
• WoodenBlocks50mm3• 3mmWoodDrills• Accesstocomputersuitewithparametricmodelling software
Models
• WoodenDice
Comments
Part of the exercise involves the use of scaling to transfer the locations of the spots from the printout to the wooden block. It is therefore important that the printed sheets utilise a different scale from the physical model
Possible Development
The parametric modelling exercise may be extended / enhanced by introducing more advanced features of the software such as rendering, material properties and animations.
Curriculum for Excellence Sciences, Technologies and Mathematics Links
Technologies
I enhance my learning by applying my ICT skills in different learning contexts across the curriculum. TCH 3-04aI have gained confidence and dexterity in the use of materials, tools, equipment, software or control technology and can apply specialist skills to make quality products. TCH 3-13aDuring practical activities and design challenges, I can estimate and measure using appropriate instruments and units. TCH 1-13a / TCH 2-13aI can use drawing techniques, manually or electronically, to represent objects or ideas, enhancing them using effects such as light, shadow and textures. TCH 2-15a
Mathematics and Numeracy Across Learning
I can use my knowledge of the coordinate system to plot and describe the location of a point on a grid. MTH 2-18a / MTH 3-18aI can apply my understanding of scale when enlarging or reducing pictures and shapes, using different methods, including technology. MTH 3-17cI can draw 2D shapes and make representations of 3D objects using an appropriate range of methods and efficient use of resources. MTH 2-16cI can conduct simple experiments involving chance and communicate my predictions and findings using the vocabulary of probability. MNU 2-22a
24

7 Gravity motor
This exercise involves the construction of a simple mechanism which uses a pulley and weight attached to a framework to convert linear into rotational motion, driving a spindle. The weight at the end of the pulley may be altered to provide a demonstration of the relationship between mass and acceleration.
The model comprises a frame, built from three pieces of timber with a fourth smaller piece at the front as a bearing block. Two triangular braces made from plastic or sheet metal are attached to the back of the frame and support a length of threaded rod (spindle), with two nuts holding the rod in place. A short piece of dowel or carriage bolt inserted into the bearing block acts as a pulley.
The string can be wound around the spindle by rotating it, then releasing the weight at the end of the string to engage the motor.
Learners will use a range of tools and materials in the construction of the mechanism, and will gain experience in joining different materials together.
Learning Outcomes
By the end of the project learners should:• Havegainedskillsinjoiningmaterialsand components accurately• Understandtherelationshipbetweenkeyscientific principles and technological developments.• Beabletoengineer3Dobjectswhichdemonstrate strengthening, energy transfer and movement.• Havegainedconfidenceanddexterityintheuseof materials, tools and equipment.• Havegainedskillsinestimatingandmeasuring using appropriate instruments and units.
Resources Required
• Timber• Aluminium/Plasticforspindlebraces• Threadedrodforspindle• String• Nuts/Boltsforpulleysystem• Weights
Models
• Completedgravitymotor
Comments
• Thescaleofthemodelcanbeadaptedtosuitthe materials available• Forclarityaflagorothervisualindicatorcanbe attached to the top of the spindle.
Possible Development
• Themechanismwillprovideexploitablerotational motion, which may be used to drive another machine or mechanism such as a fan or dynamo.• Theclassmayexplorefrictionasadesignfactorby the creative use of alternative materials e.g., in the string or the pulley block.• Themechanismmayalsobesimulatedusing parametric modelling (Autodesk Inventor, Solidworks, Google Sketchup). This will provide an opportunity to introduce the class to assembly files as opposed to creating single parts.
25

26
Curriculum for Excellence Sciences, Technologies and Mathematics Links
Sciences
By investigating how friction, including air resistance, affects motion, I can suggest ways to improve efficiency in moving objects. SCN 2-07aI have collaborated in investigations into the effects of gravity on objects and I can predict what might happen to their weight in different situations on Earth and in space. SCN 3-08aBy investigating renewable energy sources and taking part in practical activities to harness them, I can discuss their benefits and potential problems. SCN 3-04b
Technologies
By applying my knowledge and skills of science and mathematics, I can engineer 3D objects which demonstrate strengthening, energy transfer and movement. TCH 2-12a / TCH 3-12a I have gained confidence and dexterity in the use of materials, tools, equipment, software or control technology and can apply specialist skills to make quality products. TCH 3-13aDuring practical activities and design challenges, I can estimate and measure using appropriate instruments and units. TCH 1-13a / TCH 2-13aI can practise and apply a range of preparation techniques and processes to manufacture a variety of items in wood, metal, plastic or other material, showing imagination and creativity, and recognising the need to conserve resources. TCH 3-13b
Mathematics and Numeracy Across Learning
I can display data in a clear way using a suitable scale, by choosing appropriately from an extended range of tables, charts, diagrams and graphs, making effective use of technology. MTH 2-21a / MTH 3-21a
Notes:

Notes:
27

© University of Glasgow 2011Design: MVLS Graphic Support Unit, University of Glasgow - www.glasgow.ac.uk/gsuThe University of Glasgow, charity number SC004401