connectedness and meaning: new analytical directions …ceur-ws.org/vol-1551/article-02.pdf ·...
TRANSCRIPT

Connectedness and Meaning:
New Analytical Directions for Official Statistics*
Frederic Clarke and Chien-Hung Chien
Australian Bureau of Statistics
Keywords: Semantic statistics, linked data, network analysis, linked employer-
employee database (LEED), Australian Bureau of Statistics (ABS), Graphically
Linked Information Discovery Environment (GLIDE).
Abstract. The Australian Bureau of Statistics (ABS) is exploring the use of
Semantic Web approach for statistical production from Big Data sources. While
Big Data provides new business opportunities for statistical production, there
are significant capability challenges facing the ABS. In particular, there is a
compelling need for an integrated analytical platform that can facilitate the rep-
resentation, linking, discovery and visualisation of complex information from
diverse sources. This paper discusses the approach taken by the ABS in apply-
ing Semantic Web approach to these specific challenges. It describes the proto-
type Graphically Linked Information Discovery Environment (GLIDE) devel-
oped by the ABS, and provides practical examples of how GLIDE is used for
statistical purposes.
1. Introduction
With the convergence of previously distinct communications and networking technol-
ogies, the Internet has evolved into a unified global platform for connecting people,
places and things. This “network of networks” provides nearly universal access to a
range of user services, such as telephony, email, web browsing, social media, real-
time messaging, video, and geolocation. Such services are available from both fixed
and mobile user devices – smart phones, tablets, notebook and desktop computers.
They can also be delivered through either wired or wireless access points, including
fibre, ADSL, 3G/4G, WiFi and satellite.
The ease of access and pervasiveness of Internet-mediated services has fuelled an
explosive growth in digital presence and interaction. A large part of our everyday
* Please note that we use only synthetic data in the paper for demonstration purposes.
Acknowledgements
We gratefully acknowledge several people who provided inputs for this paper. Siu-Ming Tam,
Laurent Lefort, John Machin, Daniel Elazar, Andreas Mayer and Kerry Taylor for their com-
ments and guidance at various stage of drafting. Chris Conran, Andreas Mayer, Laurent Lefort,
John Machin, Timothy Cosgrove and Armin Haller (Statistical Informatics sprint team) for
their contributions to the development of the GLIDE.

lives is now spent online, whether for business, education, social contact or enter-
tainment. In addition, a web of connected digital devices is emerging that operates
independently of human intervention. These devices are continually producing snap-
shots of the ambient environment and the condition of things within it. Examples
include satellite and ground sensors, smart energy meters, traffic flow meters, point-
of-sale scanners, and even networked medical instruments.
Much of this human- and machine-generated data – collectively referred to as ‘Big
Data’ – is now accessible to national statistical agencies. It can be assembled and
analysed to create a richer, more dynamic and better focused statistical picture of
society, the economy and the environment. In conjunction with data collected by sur-
veys and administrative programs, Big Data allows government to better attune its
impact at a national and regional level through tailored service delivery and informed
policy intervention.
The Australian Bureau of Statistics (ABS) is in a unique position to enable a whole-
of-government approach for solutions to the complex policy challenges facing Aus-
tralia (APSC, 2013). In particular, policy development and evaluation is increasingly
hindered by the persistence of so-called “wicked problems” (APSC, 2007). These are
social, economic or environmental problems that are difficult to clearly define and
involve complex – often hidden – interdependencies among many possible causal
factors. A frequently cited wicked problem is indigenous disadvantage, which in-
volves factors such health, income, employment, education, housing, social benefits,
spending patterns, and access to basic infrastructure and community services (APSC,
2007).
To address such problems, the Australian Government has identified the need for ‘a
new kind of thinking that is capable of grasping the big picture’ (APSC, 2007). This
requires the problem-specific fusion of information from diverse sources – traditional
and novel – each containing a different lens through which to view the problem and
understand the interplay between different contributing factors. No one dataset or
statistical product is sufficient to discern the big picture. In this context, the use of Big
Data offers fresh analytical insights into longstanding policy problems.
However, the use of Big Data for official statistics raises many methodological, tech-
nological and operational issues (Tam and Clarke, 2015). Among these, there are five
significant challenges for ABS analytical capability: (i) ensuring consistency in the
interpretation of statistical concepts across diverse data sources; (ii) linking multiple
datasets in multiple ways to support a variety of analytical perspectives; (iii) integrat-
ing the structured and unstructured content of datasets organised in different ways;
(iv) manipulating highly multidimensional data in statistical computation; and (v)
enabling fast and adaptive information discovery on the scale of Big Data.
The ABS is exploring the use of Semantic Web approach to enhance its analytical
capability for Big Data. We have built a prototype analytical platform – the Graph-
ically Linked Information Discovery Environment (GLIDE) to demonstrate new ways
of representing, linking, discovering and visualising complex information from di-
verse sources.

The ABS is evaluating the potential value of GLIDE for solving a range of difficult
analytical problems in the areas of firm-level productivity, labour market dynamics,
and regional economic activity. Themes of current interest include firm entry and exit,
job flows, multiple job holders, and employment tenure. Each of these themes is driv-
ing the ongoing development of GLIDE features and infrastructure. As the analytical
‘storylines’ mature and evolve, new source datasets – administrative, survey, census
and transactional – will be uploaded to enhance the analytical richness of the linked
dataset (Jeffery et al., 2008).
This paper is structured as follows. Section 2 describes the ABS vision of using Se-
mantic Web approach as an enabler of statistical production in a Big Data world. Sec-
tion 3 discusses the GLIDE architecture; presents the conceptual model representing
statistical units in the prototype LEED; shows the visualisation tools; and provides a
couple of GLIDE use cases; and Section 4 concludes and proposes future research
directions.
2. Using Semantic Web Approach
A clear strategic imperative for the ABS is that it should seize opportunities to use
Big Data for new information solutions that meet the evolving information needs of
statistical consumers. It should also seek where possible to augment or replace tradi-
tional data collection with new Big Data sources – such as satellite imagery, mobile
device positioning, transaction streams, and online user activity – to reduce the cost
and time to market of statistical products. The realisation of this vision requires ad-
vanced capabilities for deriving statistically valid inferences from large, complex and
highly interconnected datasets. Five analytical challenges must be addressed:
Ensuring consistency in the interpretation of statistical concepts across diverse
data sources. The information content of emerging Big Data sources – such as sen-
sors measurements, commercial transactions, and social interactions – needs to be
consistently related to core statistical concepts. This is very difficult in the absence
of a common frame of reference.
Linking multiple datasets in multiple ways to support a variety of analytical per-
spectives. Big data is a rich source of information about entities of statistical inter-
est – persons, businesses and so on. These need to be connected in different ways
to understand complex interdependencies. Current data linking approaches in the
ABS are inadequate for more general problems that involve different record and
linkage types, multiple datasets, and the absence of a common linking key.
Integrating the structured and unstructured content of datasets organised in differ-
ent ways. Datasets of statistical value – particularly those from Big Data sources –
can contain unstructured content organised in different ways, such as the free text
fields in survey and administrative records. Unstructured content does not conform
to the traditional relational database model and the ABS needs to develop infra-
structure to combine it with structured data.
Manipulating highly multidimensional data in statistical computation. Datasets
from Big Data sources are likely to be wide (contain hundreds or thousands of var-
iables) as well as deep (contain millions of records). This accentuates a known

mismatch between the pattern of data access in exploratory data analysis, and the
way that data is represented and stored in relational databases. Wide datasets pose
a particular challenge for ABS analytical systems, and the dimensionality issue is
exacerbated when datasets are integrated from multiple sources.
Enabling fast and adaptive information discovery on the scale of Big Data. Infor-
mation discovery is the process in which analytically useful information – features,
patterns, trends and estimates – is derived from the content of individual and linked
datasets. The ABS needs fast and adaptive analytical engines that can automatical-
ly trawl large, complex datasets for statistically significant insights.
The ABS is applying a Semantic Web approach to the representation, linking, discov-
ery and visualisation of complex information from traditional and emerging data
sources. While the broad capability objective is to enhance ABS analytical practice
for the uptake of Big Data, the framework we are developing also enhances main-
stream statistical production. The intention is to combine the best practices of the
Semantic Web approach in publishing open linked data with the Generic Statistical
Business Process Model to enhance the quality and timeliness of the ABS statistics
(UNECE, 2013, W3C, 2014). The key innovations that underpin the new approach
are to:
Represent information as a network of entities and relationships. A network (or
graph) model depicts the interacting components of a system by a set of nodes, and
the system interactions by links between the nodes. In an information network, the
nodes represent entities of different type (e.g. Business, Person, Job, Industry,
Place, and Event) that are contained in the content of one or more datasets. The
links are different kinds of relationships that exist among the entities (e.g. employ-
er-of, works-in-job, and in-industry).
Describe the semantics of data in a machine-interpretable form. The ABS is eval-
uating the use of the W3C Vocabularies framework – part of the W3C Semantic
Web standards – for the development of a prototype Statistical Units Ontology.
Semantic description captures the explicit “meaning” of these concepts by precise-
ly specifying the logical properties of classes and their relationships. When the de-
scription is expressed in a formal semantic modelling language, software systems
are able to consistently translate the concepts into different metadata schemes, and
to logically reconcile similar concepts embedded in disparate data sources.
Enable machine reasoning on data to derive new insights. Semantic descriptions of
statistical concepts enable specialised inferencing software to automatically reason
over an information network to generate new analytical insights. GLIDE is a gen-
eralised inference platform that supports the synergistic interplay of inductive and
deductive methods in information discovery. The ABS is currently investigating
the application of deductive reasoning methods – such as first order logic – for of-
ficial statistics.
Extract and transform the content of unstructured data. For unstructured data to be
useful for statistical purposes, its information content must be extracted from the
“data container” in which it is held – whether that is a document, a database record
or a data stream. The content also needs to be transformed into an appropriate form
for statistical analysis and compilation. The ABS is investigating the application of
new methods and tools for this purpose, including natural language processing, su-
pervised machine learning, and multidimensional clustering. These tools will be in-
tegrated into the GLIDE for statistical production.
Embed advanced visualisation in information systems. Information discovery is the
process in which analytically useful information – features, patterns, trends and es-
timates – is derived from the content of individual and linked datasets. There is a
strong need to develop interactive view of multidimensional datasets for explorato-
ry analysis in the world of Big Data. For this reason, the ABS is developing a dy-
namic visualisation framework that will enable users to explore data from different
analytical perspectives.
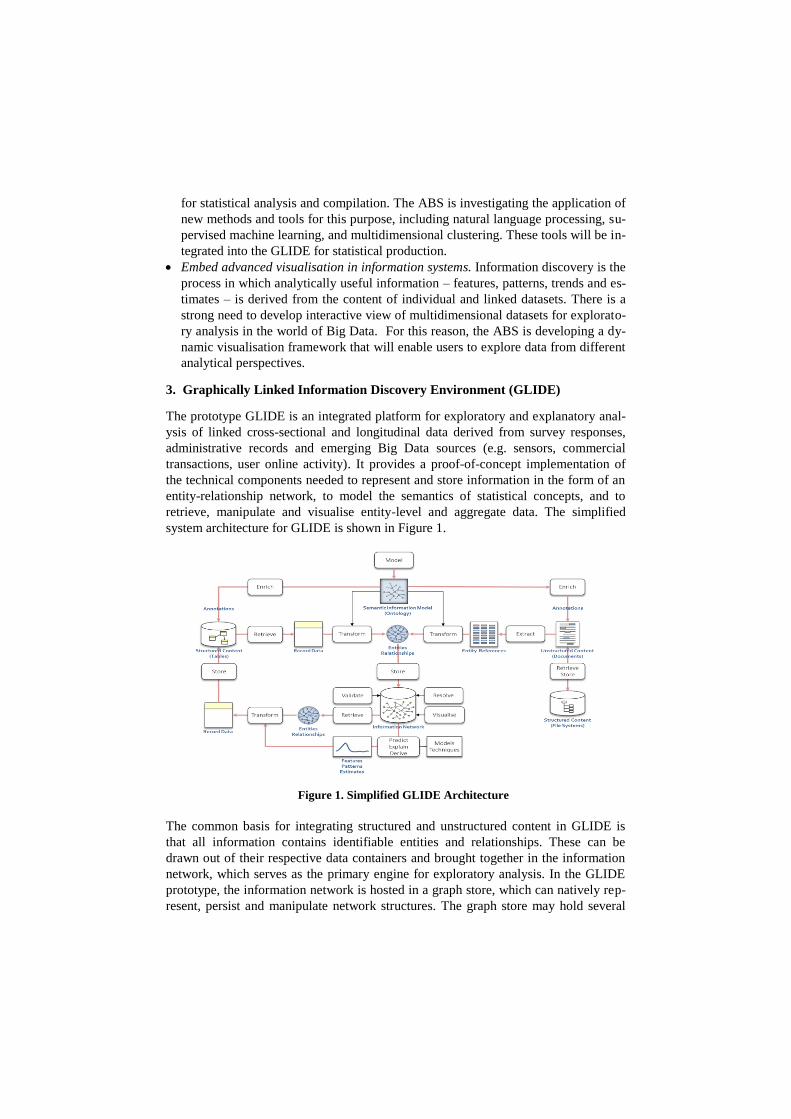
3. Graphically Linked Information Discovery Environment (GLIDE)
The prototype GLIDE is an integrated platform for exploratory and explanatory anal-
ysis of linked cross-sectional and longitudinal data derived from survey responses,
administrative records and emerging Big Data sources (e.g. sensors, commercial
transactions, user online activity). It provides a proof-of-concept implementation of
the technical components needed to represent and store information in the form of an
entity-relationship network, to model the semantics of statistical concepts, and to
retrieve, manipulate and visualise entity-level and aggregate data. The simplified
system architecture for GLIDE is shown in Figure 1.
Figure 1. Simplified GLIDE Architecture
The common basis for integrating structured and unstructured content in GLIDE is
that all information contains identifiable entities and relationships. These can be
drawn out of their respective data containers and brought together in the information
network, which serves as the primary engine for exploratory analysis. In the GLIDE
prototype, the information network is hosted in a graph store, which can natively rep-
resent, persist and manipulate network structures. The graph store may hold several

distinct information networks, each meeting the needs of a different analytical prob-
lem. A set of application components – deployed as infrastructure services with ab-
stract interfaces – provides the manual and automated functions needed to manage,
transport and analyse data in the GLIDE domain. These services are grouped into four
basic classes:
Services that enable data in different structural formats and from different sources
to be stored, retrieved, transformed and enriched by users and systems.
Services that enable the information artefacts of unstructured content to be extract-
ed, normalised, matched, and classified. For example, entity references are extract-
ed from text documents; product descriptions used in Prices processing are normal-
ised and matched; survey responses are coded to predefined classifications.
Services that enable statistical concepts, entities and relationships to be modelled,
visualised, resolved, and validated.
Services that support the explanation of observed phenomena, the prediction of
new observations, and the derivation of aggregate values and summary measures.
The current version of GLIDE uses a prototype LEED as a validation dataset. A
LEED has a broad range of analytical applications and its impact on policy develop-
ment and evaluation is far reaching (Abowd et al., 2004, Chien et al., 2012). There are
many studies that use a LEED for analysis, including: identifying the effects of job
matching on productivity (Abowd et al., 2014) and describing the characteristics of
productive firms using multilevel models (Chien and Mayer, 2015b). Table 1 provides
details on the software components.
Table 1. Software Components
RDF Database Open Source Version Virtuoso1 version 7.2 by OpenLink Software on 64-
bit Windows Server machine, 4 Core CPU and 64GB of RAM.
Ontology Editor Protégé2 version 5 OWL 2 editor – used to create the GLIDE ontology.
Visualisation Hand-coded HTML5, CSS3, JavaScript using JQuery, D3.JS and Google
Maps API. Deployed to the Virtuoso Web server.
RDF conversion TARQL3 version 1.0a – used to convert CSV data files into URI named
RDF triples based on the GLIDE ontology. These are loaded into Virtuoso.
Statistical analysis R statistical platform4 version 3.0.1 – used for statistical analysis. Key pack-
ages include SPARQL and igraph.
1 http://sourceforge.net/projects/virtuoso/files/virtuoso/7.2.1/ 2 http://protege.stanford.edu/ 3 https://github.com/tarql/tarql 4 https://cran.r-project.org/

Identifying and Combining Different Data Sources.
The Semantic Web approach uses the Resource Description Framework (RDF) as the
mechanism for linking heterogeneous datasets to form an information network. This
makes it easy to extend the prototype LEED and incorporate new datasets, since the
source datasets are “virtually linked” by their constituent entities through a dynamic
set of relationships. The Web Ontology Language (OWL) provides a way to precisely
specify these relationships. We use the W3C time, geography coordinates and RDF
data cube vocabularies. As an example, Figure 2 shows the potential connection
points between the data tables of five LEED source datasets: Business Activity
Statements (BAS), Business Income Tax (BIT), Pay As You Go (PAYG) statements,
and the ABS Business Register (ABS BR).
Figure 2. Connected Data in Tabular Form
Depicting LEED as a heterogeneous network of information.
Figure 3 represents the tabular information in the tables in the form of an information
network. Each record is reconceived as a particular type of entity (shown as grey
ovals) whose properties are defined by the fields of the table. For example, the rec-
ords of the ABS BR table are seen as business entities with properties that include
ABN, location and trading name. These properties are simply depicted as relation-
ships with other entities (shown as coloured ovals), or with objects that have a literal
value (shown as coloured rectangles). The concept of job is decomposed into two
elements in the network model. This captures the many-to-many relationships that
exist when you consider jobs from the perspective of a firm or a person. In job shar-
ing, for example, a firm can provide a job (i.e. employer role) that can then be ful-
filled by multiple employees. On the other hand, multiple job holders can fulfil differ-
ent employee roles (Harwood and Mayer, 2014).
ABN PERIODICITY REPORTING_PERIOD STATE INDUSTRY_CODE TURNOVER WAGES
… … … … … … …
ANNUAL 2010-11 NSW 1 $200,000 $100,000
… … … … … … …
ABN FINANCIAL_YEAR STATE PROFIT_AND_LOSS INDUSTRY_CODE ASSETS SALES
… … … … … … …
466318498 2010-11 NSW $20,000 1 $500,000 $200,000
… … … … … … …
SCRAMBLED TFN ABN GROSS_SALARY FINANCIAL_YEAR
… … … …
567784321 466318498 $50,000 2010-11
… … … …
SCRAMBLED_TFN OCCUPATION FINANCIAL_YEAR FAMILY_NAME GIVEN_NAME OCC_CODE SALARY&WAGE
… … … … … … …
567784321 Sales 2010-11 BLOKE JOE 221 $50,000
… … … … … … …
ABN STATE TRADING_NAME ECONOMIC_ACTIVITY POST_CODE SECTOR SURVEY_ID
… … … … … … …
466318498 NA XYZ PTY LTD RETAIL 2000 PRIVATE Eco1234
… … … … … … …
ABS Business Register (ABS)
Pay As You Go Statements (ATO)
Business Activities Statements (ATO)
Business Income Tax (ATO)
Personal Income Tax (ATO)

Figure 3. Connected Data in Network Form
Information discovery using advanced visualisation.
Figure 4 shows an interactive graph that summarises information across all firms in
the economy. Turnover and total Employees are plotted against number of firms,
grouped by state and industry, in the year 2009-10, 2010-11 and 2011-12. This draws
on turnover information from BAS, employee counts from PAYG summaries, and
state and industry information from ABS Business Register. It shows both the total
industry Turnover and the number of firms has fallen in Victoria (VIC), though the
total employment count has remained about the same. This may suggest some consol-
idation in the industry, with smaller non-employing firms dropping out.
Figure 4. Interactive Graph of Macroeconomic Environment for Manufacturing In-
dustry
VICQLD
WA
QLD
WA
VIC
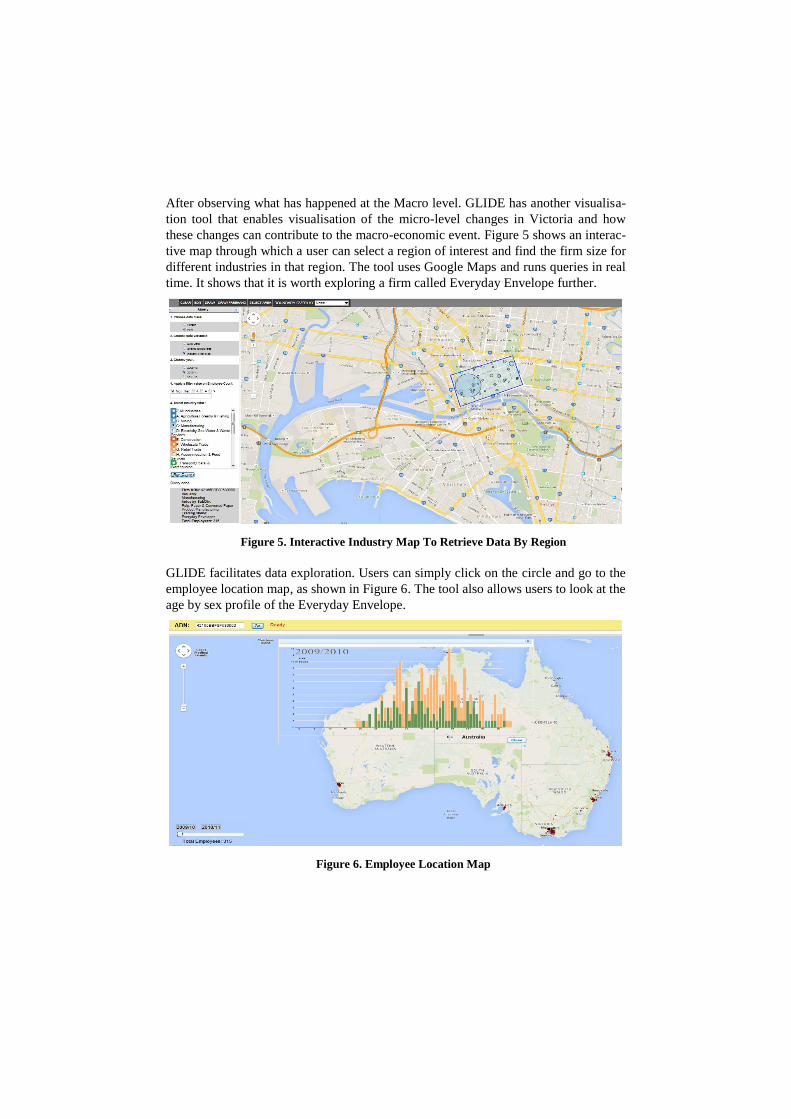
After observing what has happened at the Macro level. GLIDE has another visualisa-
tion tool that enables visualisation of the micro-level changes in Victoria and how
these changes can contribute to the macro-economic event. Figure 5 shows an interac-
tive map through which a user can select a region of interest and find the firm size for
different industries in that region. The tool uses Google Maps and runs queries in real
time. It shows that it is worth exploring a firm called Everyday Envelope further.
Figure 5. Interactive Industry Map To Retrieve Data By Region
GLIDE facilitates data exploration. Users can simply click on the circle and go to the
employee location map, as shown in Figure 6. The tool also allows users to look at the
age by sex profile of the Everyday Envelope.
Figure 6. Employee Location Map

Use case: Detecting spurious firm death events using semantic LEED.
GLIDE provides a platform to explore complex labour market networks. An example
of this is to detect spurious firm death events. Firms can exit the economy because of
administrative reasons which does not reflect true deaths of enterprises. GLIDE inter-
acts with the statistical software R. Figures 7 and 8 show an example of bipartite net-
work graphs using R. If the majority of employees of a deregistered firm are working
for the same new firm in the following year, this is likely to reflect continuing eco-
nomic activity. Conversely, if the employees are dispersed between a number of
firms, this is likely to reflect a true firm death (Chien and Mayer, 2015a).
Figure 7. True Firm Death
Figure 8. Firm Takeover
Pre Exit
before exiting
Exited
after exiting and outcomes
People & Industries
Employee (base)
:Income Up
:Same Income
:Income Down
Manufacturing
Retail Trade
Accomodation/Food
Admin/Support Serv.
Arts & Rec. Serv.
Other Serv.
Unknown
Pre Exit
before exiting
Exited
after exiting and outcomes
People & Industries
Employee (base)
:Income Up
:Same Income
:Income Down
Retail Trade
Finance & Insurance
Prof/Sci/Tech Serv.
Health & Social
>30 employees
<30 employees
>30 employees
<30 employees

4. Conclusions and future directions
This paper describes the future vision of the ABS on the use of semantic technology
for statistical purposes. It describes the prototype graphically linked information dis-
covery environment (GLIDE) developed using Semantic Web approach. Note that
GLIDE has been used for research analysis but not yet for statistical production.
First, it demonstrates the advantages of representing firm-employee connection in
bipartite network graphs. The analysis has shown that it is important to distinguish
true firm deaths from spurious ones. Failure to correct for them can introduce po-
tential statistical bias, i.e. continuing firms being miss-classified as firm deaths.
Second, there are benefits to using deductive reasoning for data confrontation. It
can introduce process efficiency by using these rules to check for anomalies. More
work is needed to investigate scalable methods.
Finally, GLIDE contains useful data visualisation tools that allow users to explore
Big Data. It can be used to investigate macro-economic factors and drill down into
the micro level as shown in the example.
We have found the benefits of Semantic Web approach are compelling. The ABS is
continuing to explore its integration with existing statistical processes.
5. Reference
ABOWD, J., M. , KRAMARZ, F., PÉREZ-DUARTE, S. & SCHMUTTE, I. M. 2014.
Sorting Between and Within Industries: A Testable Model of Assortative Matching.
National Bureau of Economic Research, Inc.
ABOWD, J. M., HALTIWANGER, J. C. & LANE, J. I. 2004. Integrated Longitudi-
nal Employee-Employer Data for the United States. TP-2004-02, 1-13.Available:
ftp://ftp.census.gov/ces/tp/tp-2004-02.pdf
APSC. 2007. Tackling wicked problems : A public policy perspective. Available:
http://www.apsc.gov.au/publications-and-media/archive/publications-
archive/tackling-wicked-problems
APSC. 2013. CAPABILITY REVIEW: Australian Bureau of Statistics. i-
52.Available: http://www.apsc.gov.au/__data/assets/pdf_file/0007/40111/ABS-
Capability-Review.pdf
CHIEN, C., CLARKE, C. & AMARASINGHE, A. 2012. Enhancing the ABS’s use
of Personal Income Tax Data. Unpiblished Methodological Advisory Committee
Paper. Canberra.
CHIEN, C. & MAYER, A. 2015a. A New Analytical Platform to Explore Linked
Data Methodological Advisory Committee Paper No 1352.0.55.151. Canberra.
CHIEN, C. & MAYER, A. 2015b. Use of a prototype Linked Employer-Employee
Database to describe characteristics of productive firms. Available:
http://www.abs.gov.au/ausstats/[email protected]/ProductsbyReleaseDate/09B55DF266DC01
57CA257E4400131360?OpenDocument

HARWOOD, A. & MAYER, A. 2014. Big Data and Semantic Technology: A Future
for Data Integration, Exploration and Visualisation. National Association for Official
Statistics Prize for Young Statisticians. Rio de Janiero.
JEFFERY, S. R., FRANKLIN, M. J. & HALEVY, A. Y. 2008. Pay-as-you-go User
Feedback for Dataspace Systems. ACM SIGMOD/PODS Conference. Vancouver.
TAM, S.-M. & CLARKE, F. 2015. Big Data, Statistical Inference and Official Statis-
tics. 1351.0.55.054.Available:
http://www.abs.gov.au/AUSSTATS/[email protected]/DetailsPage/1351.0.55.054Mar%20201
5?OpenDocument
UNECE. 2013. Generic Statistical Business Process Model [Online]. Available:
http://www1.unece.org/stat/platform/display/GSBPM/GSBPM+v5.0 [Accessed
09/07/2015 2015].
W3C. 2014. Best Practices for Publishing Linked Data [Online]. Available:
http://www.w3.org/TR/ld-bp/ [Accessed 09/07/2015 2015].