connect crs to classroom math.pdf
TRANSCRIPT

8/20/2019 Connect CRS to Classroom MATH.pdf
http://slidepdf.com/reader/full/connect-crs-to-classroom-mathpdf 1/83
For Mathematics Teachers
CONNECTING
COLLEGE R EADINESS
STANDARDS™
TO THE CLASSROOM
For Mathematics Teachers

8/20/2019 Connect CRS to Classroom MATH.pdf
http://slidepdf.com/reader/full/connect-crs-to-classroom-mathpdf 2/83
ACT endorses the Code of Fair Testing Practices in
Education and the Code of Professional Responsibilities
in Educational Measurement , guides to the conduct of
those involved in educational testing. ACT is committed
to ensuring that each of its testing programs upholds the
guidelines in each Code .
A copy of each Code may be obtained free of charge
from ACT Customer Services (68), P.O. Box 1008,
Iowa City, IA 52243-1008, 319/337-1429.
Visit ACT’s website at: www.act.org
© 2008 by ACT, Inc. All rights reserved. 1179
8/20/2019 Connect CRS to Classroom MATH.pdf
http://slidepdf.com/reader/full/connect-crs-to-classroom-mathpdf 3/83

8/20/2019 Connect CRS to Classroom MATH.pdf
http://slidepdf.com/reader/full/connect-crs-to-classroom-mathpdf 4/83
8/20/2019 Connect CRS to Classroom MATH.pdf
http://slidepdf.com/reader/full/connect-crs-to-classroom-mathpdf 5/83
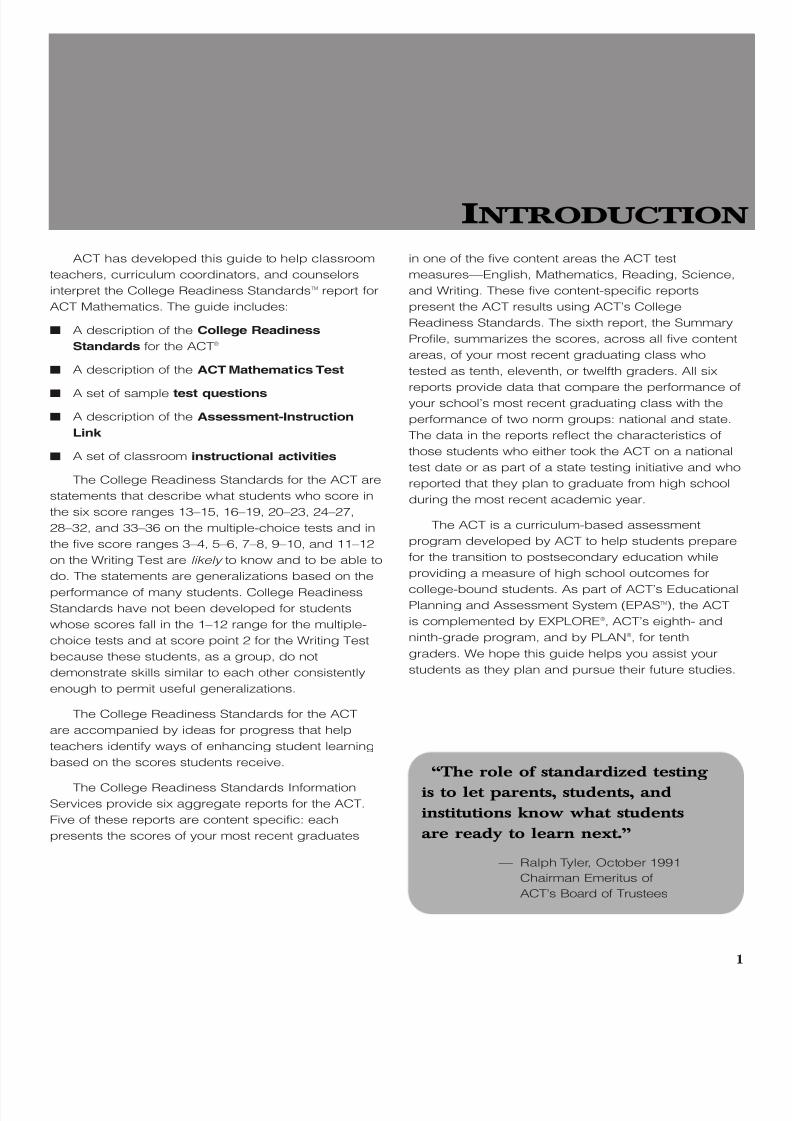
ACT has developed this guide to help classroom
teachers, curriculum coordinators, and counselors
interpret the College Readiness StandardsTM report for
ACT Mathematics. The guide includes:
■ A description of the College Readiness
Standards for the ACT®
■ A description of the ACT Mathematics Test
■ A set of sample test questions
■ A description of the Assessment-Instruction
Link
■ A set of classroom instructional activities
The College Readiness Standards for the ACT are
statements that describe what students who score in
the six score ranges 13–15, 16–19, 20–23, 24–27,
28–32, and 33–36 on the multiple-choice tests and in
the five score ranges 3–4, 5–6, 7–8, 9–10, and 11–12
on the Writing Test are likely to know and to be able to
do. The statements are generalizations based on the
performance of many students. College Readiness
Standards have not been developed for students
whose scores fall in the 1–12 range for the multiple-
choice tests and at score point 2 for the Writing Test
because these students, as a group, do not
demonstrate skills similar to each other consistently
enough to permit useful generalizations.
The College Readiness Standards for the ACT
are accompanied by ideas for progress that help
teachers identify ways of enhancing student learning
based on the scores students receive.
The College Readiness Standards InformationServices provide six aggregate reports for the ACT.
Five of these reports are content specific: each
presents the scores of your most recent graduates
in one of the five content areas the ACT test
measures—English, Mathematics, Reading, Science,
and Writing. These five content-specific reports
present the ACT results using ACT’s College
Readiness Standards. The sixth report, the Summary
Profile, summarizes the scores, across all five content
areas, of your most recent graduating class who
tested as tenth, eleventh, or twelfth graders. All six
reports provide data that compare the performance ofyour school’s most recent graduating class with the
performance of two norm groups: national and state.
The data in the reports reflect the characteristics of
those students who either took the ACT on a national
test date or as part of a state testing initiative and who
reported that they plan to graduate from high school
during the most recent academic year.
The ACT is a curriculum-based assessment
program developed by ACT to help students prepare
for the transition to postsecondary education while
providing a measure of high school outcomes for
college-bound students. As part of ACT’s EducationalPlanning and Assessment System (EPASTM), the ACT
is complemented by EXPLORE®, ACT’s eighth- and
ninth-grade program, and by PLAN®, for tenth
graders. We hope this guide helps you assist your
students as they plan and pursue their future studies.
INTRODUCTION
“The role of standardized testing
is to let parents, students, and
institutions know what students
are ready to learn next.”
— Ralph Tyler, October 1991
Chairman Emeritus of
ACT’s Board of Trustees
1
8/20/2019 Connect CRS to Classroom MATH.pdf
http://slidepdf.com/reader/full/connect-crs-to-classroom-mathpdf 6/83
2
THE C OLLEGE R EADINESS
STANDARDS R EPORT FOR ACT
MATHEMATICS
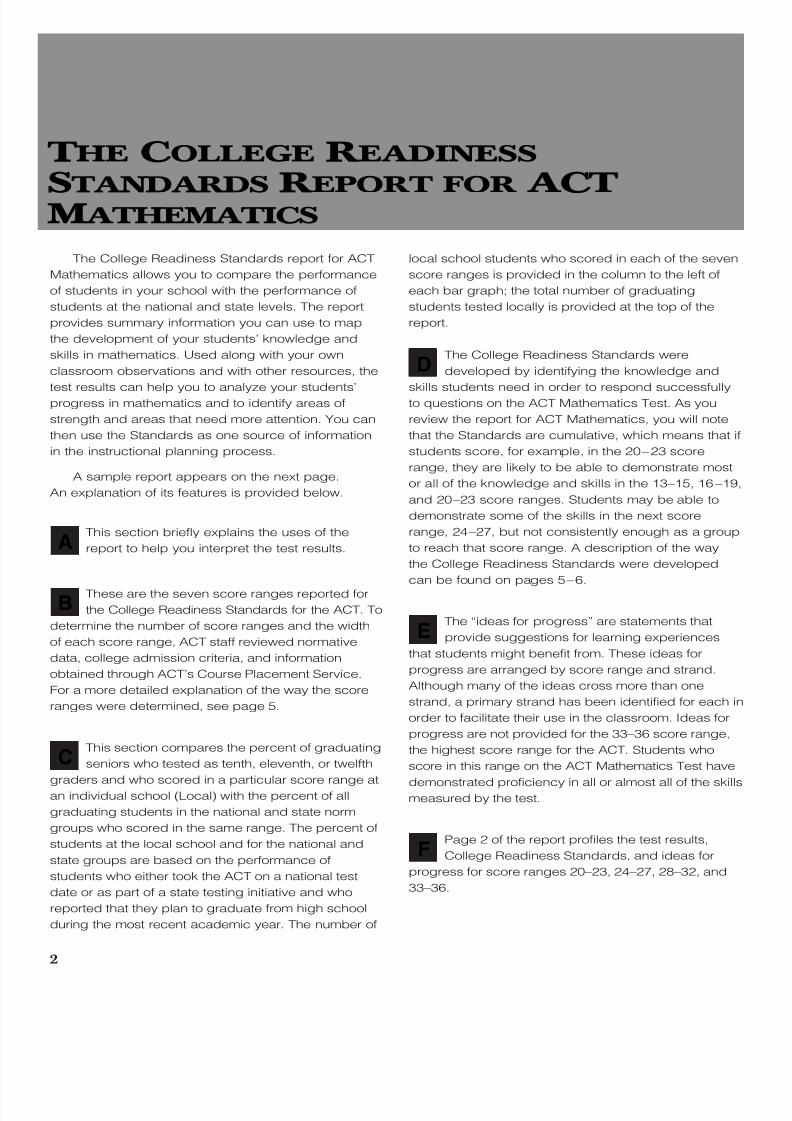
The College Readiness Standards report for ACT
Mathematics allows you to compare the performance
of students in your school with the performance of
students at the national and state levels. The report
provides summary information you can use to map
the development of your students’ knowledge and
skills in mathematics. Used along with your own
classroom observations and with other resources, the
test results can help you to analyze your students’progress in mathematics and to identify areas of
strength and areas that need more attention. You can
then use the Standards as one source of information
in the instructional planning process.
A sample report appears on the next page.
An explanation of its features is provided below.
This section briefly explains the uses of the
report to help you interpret the test results.
These are the seven score ranges reported for
the College Readiness Standards for the ACT. To
determine the number of score ranges and the width
of each score range, ACT staff reviewed normative
data, college admission criteria, and information
obtained through ACT’s Course Placement Service.
For a more detailed explanation of the way the score
ranges were determined, see page 5.
This section compares the percent of graduating
seniors who tested as tenth, eleventh, or twelfth
graders and who scored in a particular score range atan individual school (Local) with the percent of all
graduating students in the national and state norm
groups who scored in the same range. The percent of
students at the local school and for the national and
state groups are based on the performance of
students who either took the ACT on a national test
date or as part of a state testing initiative and who
reported that they plan to graduate from high school
during the most recent academic year. The number of
local school students who scored in each of the seven
score ranges is provided in the column to the left of
each bar graph; the total number of graduating
students tested locally is provided at the top of the
report.
The College Readiness Standards were
developed by identifying the knowledge and
skills students need in order to respond successfullyto questions on the ACT Mathematics Test. As you
review the report for ACT Mathematics, you will note
that the Standards are cumulative, which means that if
students score, for example, in the 20–23 score
range, they are likely to be able to demonstrate most
or all of the knowledge and skills in the 13–15, 16–19,
and 20–23 score ranges. Students may be able to
demonstrate some of the skills in the next score
range, 24–27, but not consistently enough as a group
to reach that score range. A description of the way
the College Readiness Standards were developed
can be found on pages 5–6.
The “ideas for progress” are statements that
provide suggestions for learning experiences
that students might benefit from. These ideas for
progress are arranged by score range and strand.
Although many of the ideas cross more than one
strand, a primary strand has been identified for each in
order to facilitate their use in the classroom. Ideas for
progress are not provided for the 33–36 score range,
the highest score range for the ACT. Students who
score in this range on the ACT Mathematics Test have
demonstrated proficiency in all or almost all of the skillsmeasured by the test.
Page 2 of the report profiles the test results,
College Readiness Standards, and ideas for
progress for score ranges 20–23, 24–27, 28–32, and
33–36.
F
E
D
C
B
A

8/20/2019 Connect CRS to Classroom MATH.pdf
http://slidepdf.com/reader/full/connect-crs-to-classroom-mathpdf 7/83
F
3
D
E
C
B
A

8/20/2019 Connect CRS to Classroom MATH.pdf
http://slidepdf.com/reader/full/connect-crs-to-classroom-mathpdf 8/83

8/20/2019 Connect CRS to Classroom MATH.pdf
http://slidepdf.com/reader/full/connect-crs-to-classroom-mathpdf 9/83
5
WHAT ARE THE COLLEGE
R EADINESS STANDARDS?
The College Readiness Standards communicate
educational expectations. Each Standard describes
what students who score in the designated range are
likely to be able to do with what they know. Students
can typically demonstrate the skills and knowledge
within the score ranges preceding the range in which
they scored, so the College Readiness Standards are
cumulative.
In helping students make the transition from high
school to postsecondary education or to the world of
work, teachers, counselors, and parents can use the
College Readiness Standards for the ACT to interpret
students’ scores and to understand which skills
students need to develop to be better prepared for
the future.
HOW WERE THE SCORE R ANGES
DETERMINED?
To determine the number of score ranges and
the width of each score range for the ACT, ACT staff
reviewed ACT normative data and considered the
relationship among EXPLORE, PLAN, and the ACT.
In reviewing the ACT normative data, ACT staff
analyzed the distribution of student scores across the
score scale, 1–36. Because the ACT is used for
college admission and course-placement decisions,
differing admission criteria (e.g., open, liberal,
traditional, selective, and highly selective) and the
course-placement research that ACT has conducted
over the last forty years were also reviewed. ACT’s
Course Placement Service provides colleges and
universities with cutoff scores that are used to place
students into appropriate entry-level courses in
college; and these cutoff scores were used to help
define the score ranges.
After analyzing all the data and reviewing different
possible score ranges, ACT staff concluded that
using the seven score ranges 1–12, 13–15, 16–19,
20–23, 24–27, 28–32, and 33–36 would best
distinguish students’ levels of achievement so as to
assist teachers, administrators, and others in relating
ACT test scores to students’ skills and
understandings.
HOW WERE THE COLLEGE
R EADINESS STANDARDS DEVELOPED?
After a review of normative data, college
admission criteria, and information obtained through
ACT’s Course Placement Service, content experts
wrote the College Readiness Standards based on
their analysis of the skills and knowledge students
need in order to successfully respond to the test
questions in each score range. Experts analyzed
numerous test questions that had been answered
correctly by 80% or more of the examinees within
each score range. The 80% criterion was chosen
because it offers those who use the College
DESCRIPTION OF THE
C OLLEGE R EADINESS STANDARDS
“The examination should describe
the student in meaningful terms—
meaningful to the student, the parent,
and the elementary and high school
teacher—meaningful in the sense
that the profile scores correspond
to recognizable school activities,and directly suggest appropriate
distributions of emphasis in learning
and teaching.”
— E. F. Lindquist, February 1958
Cofounder of ACT

8/20/2019 Connect CRS to Classroom MATH.pdf
http://slidepdf.com/reader/full/connect-crs-to-classroom-mathpdf 10/83
6
Readiness Standards a high degree of confidence
that students scoring in a given score range will most
likely be able to demonstrate the skills and knowledge
described in that range.
As a content validity check, ACT invited nationally
recognized scholars from high school and university
Mathematics and Education departments to review
the College Readiness Standards for the ACT
Mathematics Test. These teachers and researchers
provided ACT with independent, authoritative
reviews of the ways the College Readiness Standards
reflect the skills and knowledge students need to
successfully respond to the questions on the ACT
Mathematics Test.
Because the ACT is curriculum based, ACT and
independent consultants conduct a review every three
to four years to ensure that the knowledge and skills
described in the Standards and outlined in the testspecifications continue to reflect those being taught in
classrooms nationwide.
HOW SHOULD THE COLLEGE
R EADINESS STANDARDS BE
INTERPRETED AND USED?
The College Readiness Standards reflect the
progression and complexity of the skills measured in
the ACT. Because no ACT test form measures all of
the skills and knowledge included in the College
Readiness Standards, the Standards must beinterpreted as skills and knowledge that most
students who score in a particular score range are
likely to be able to demonstrate. Since there were
relatively few test questions that were answered
correctly by 80% or more of the students who scored
in the lower score ranges, the Standards in these
ranges should be interpreted cautiously. The skills
and understandings of students who score in the
1–12 score range may still be evolving. For these
students the skills and understandings in the higher
score ranges could become their target achievement
outcomes.
It is important to recognize that the ACT does not
measure everything students have learned nor does
any test measure everything necessary for students to
know to be successful in college or in the world of
work. The ACT Mathematics Test includes questions
from a large domain of skills and from areas of
knowledge that have been judged important for
success in college and beyond. Thus, the College
Readiness Standards should be interpreted in a
responsible way that will help students understand
what they need to know and do if they are going to
make a successful transition to college, vocational
school, or the world of work. Students can use theStandards to identify the skills and knowledge they
need to develop to be better prepared for their future.
Teachers and curriculum coordinators can use the
Standards to learn more about their students’
academic strengths and weaknesses and can then
modify their instruction and guide students
accordingly.
HOW ARE THE COLLEGE R EADINESS
STANDARDS ORGANIZED?
As content experts reviewed the test questions
connected to each score range, distinct yet
overlapping areas of knowledge and skill were
identified. For example, there are many types of
questions in which students are asked to solve
arithmetic problems. Therefore, Basic Operations &
Applications is one area, or strand, within the College
Readiness Standards for ACT Mathematics. The other
strands are Probability, Statistics, & Data Analysis;
Numbers: Concepts & Properties; Expressions,
Equations, & Inequalities; Graphical Representations;
Properties of Plane Figures; Measurement; and
Functions.
The strands provide an organizational framework
for the College Readiness Standards statements. As
you review the Standards, you will note a progression
in complexity within each strand. For example, in the
13–15 range for the Basic Operations & Applications
strand, students are able to “solve problems in one or
two steps using whole numbers,” while in the 33–36
range, students demonstrate that they are able to
“solve complex arithmetic problems involving percent
of increase or decrease and problems requiring
integration of several concepts from pre-algebra
and/or pre-geometry (e.g., comparing percentages oraverages, using several ratios, and finding ratios in
geometry settings).”
8/20/2019 Connect CRS to Classroom MATH.pdf
http://slidepdf.com/reader/full/connect-crs-to-classroom-mathpdf 11/83

8/20/2019 Connect CRS to Classroom MATH.pdf
http://slidepdf.com/reader/full/connect-crs-to-classroom-mathpdf 12/83
8
■ Students who score in the 1–12 range are most likely beginning to develop the knowledge and skills
assessed in the other score ranges.
1–12
13–15
Standards
ideas forprogress
Standards
ideas forprogress
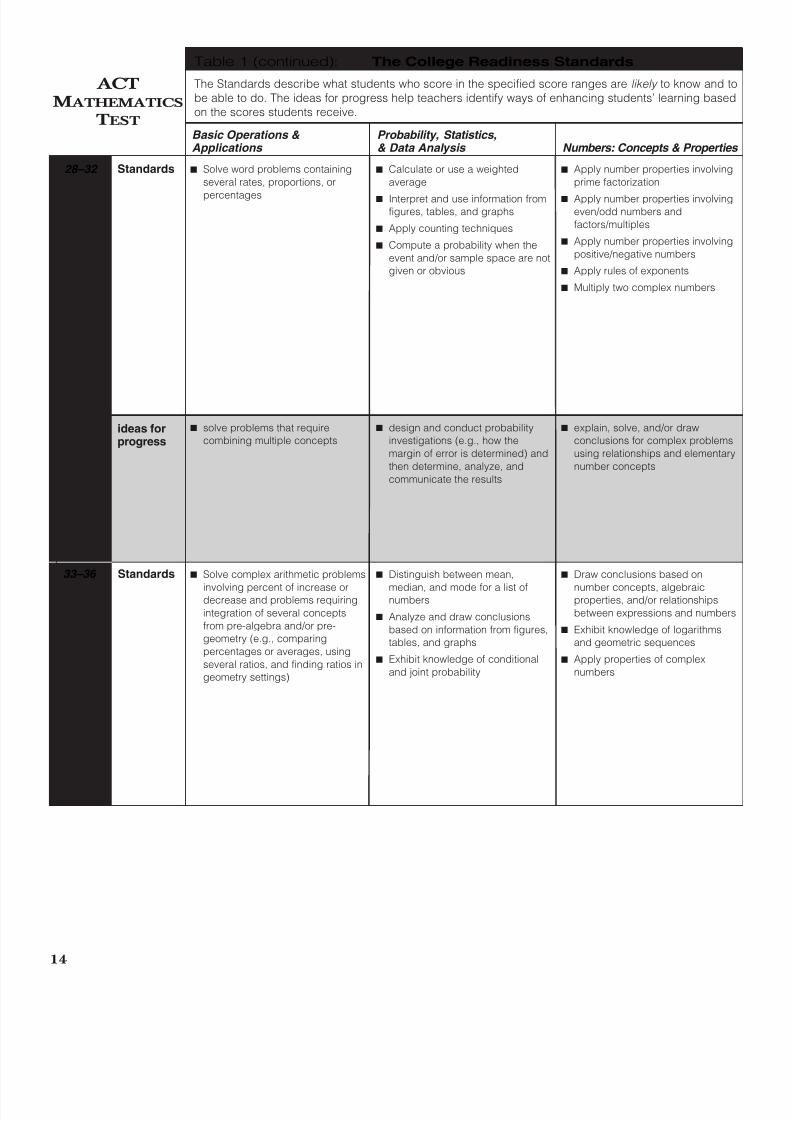
Table 1: The College Readiness Standards
The Standards describe what students who score in the specified score ranges are likely to know and tobe able to do. The ideas for progress help teachers identify ways of enhancing students’ learning basedon the scores students receive.
Basic Operations & Applications
Probability, Statistics,& Data Analysis Numbers: Concepts & Properties
■ Calculate the average of a list of
positive whole numbers
■ Perform a single computation
using information from a table or
chart
■ Recognize equivalent fractions and
fractions in lowest terms
■ Perform one-operation computation
with whole numbers and decimals
■ Solve problems in one or two steps
using whole numbers
■ Perform common conversions
(e.g., inches to feet or hours to
minutes)
■ solve real-world problems that
involve measures of central
tendency (e.g., mean, median,
mode)
■ interpret data from a variety of
displays (e.g., box-and-whisker
plot) and use it along with
additional information to solve
real-world problems
■ conduct simple probability
experiments and represent results
using different formats
■ investigate and build
understanding of the concept of
percentage as a comparison of a
part to a whole
■ use multiple operations to solve
multistep arithmetic problems
■ recognize and apply place
value, rounding, and elementary
number theory concepts
ACTMATHEMATICS
TEST
■ interpret data from a variety of
displays and use it in computation
(e.g., mean, median, mode, range)
■ organize, display, and analyze
data in a variety of ways
■ practice and apply estimation and
computation using whole numbers
and decimals
■ choose the appropriate method of
computation to solve multistep
problems (e.g., calculator, mental,
or pencil and paper)
■ practice selecting appropriate
units of measure (e.g., inches or
feet, hours or minutes, centimeters
or meters) and converting between
units
■ model and connect physical,
verbal, and symbolic
representations of money
8/20/2019 Connect CRS to Classroom MATH.pdf
http://slidepdf.com/reader/full/connect-crs-to-classroom-mathpdf 13/83
9
■ locate and describe
points in terms of their
position on the number
line
■ model a variety of
problem situations with
expressions and/or
equations
■ use the inverse
relationships for the
basic operations of
addition and subtraction
to determine unknown
quantities
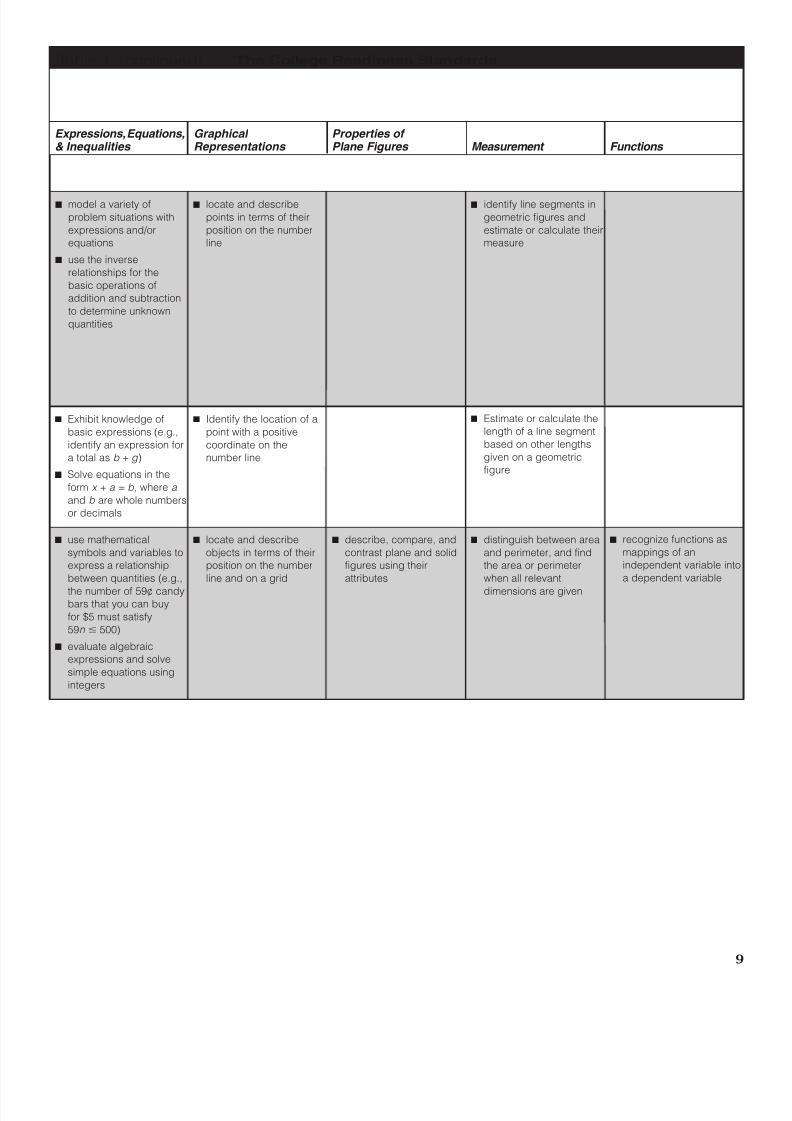
Table 1: (continued) The College Readiness Standards
Expressions, Equations,& Inequalities
Graphical Representations
Properties ofPlane Figures Measurement Functions
■ Identify the location of a
point with a positive
coordinate on the
number line
■ locate and describe
objects in terms of their
position on the number
line and on a grid
■ Exhibit knowledge of
basic expressions (e.g.,
identify an expression for
a total as b + g )
■ Solve equations in the
form x + a = b , where a
and b are whole numbers
or decimals
■ use mathematical
symbols and variables to
express a relationship
between quantities (e.g.,
the number of 59¢ candybars that you can buy
for $5 must satisfy
59n 500)
■ evaluate algebraic
expressions and solve
simple equations using
integers
■ describe, compare, and
contrast plane and solid
figures using their
attributes
■ identify line segments in
geometric figures and
estimate or calculate their
measure
■ recognize functions as
mappings of an
independent variable into
a dependent variable
■ Estimate or calculate the
length of a line segment
based on other lengths
given on a geometric
figure
■ distinguish between area
and perimeter, and find
the area or perimeter
when all relevant
dimensions are given

8/20/2019 Connect CRS to Classroom MATH.pdf
http://slidepdf.com/reader/full/connect-crs-to-classroom-mathpdf 14/83
10
■ Solve routine one-step arithmetic
problems (using whole numbers,
fractions, and decimals) such assingle-step percent
■ Solve some routine two-step
arithmetic problems
16–19
20–23
Standards
ideas forprogress
Standards
ideas forprogress
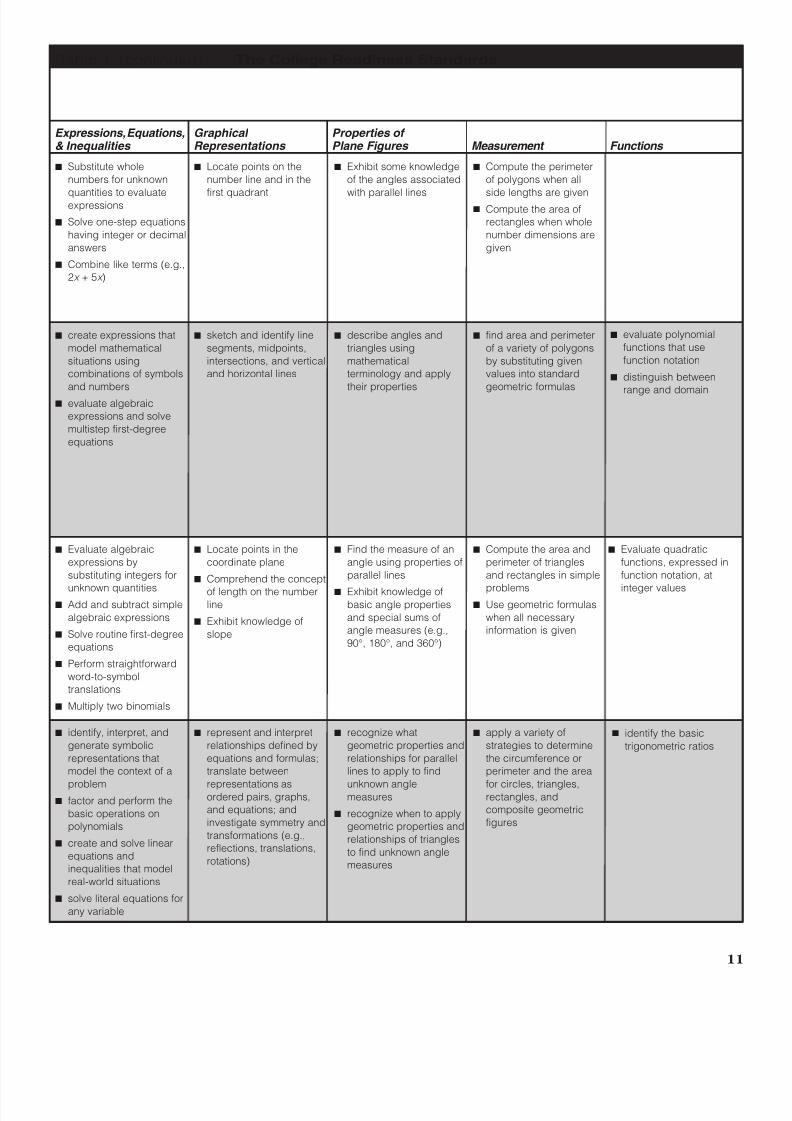
Table 1 (continued): The College Readiness Standards
The Standards describe what students who score in the specified score ranges are likely to know and tobe able to do. The ideas for progress help teachers identify ways of enhancing students’ learning basedon the scores students receive.
Basic Operations & Applications
Probability, Statistics,& Data Analysis Numbers: Concepts & Properties
■ Solve routine two-step or three-
step arithmetic problems involving
concepts such as rate and
proportion, tax added, percentageoff, and computing with a given
average
ACTMATHEMATICS
TEST
■ Calculate the average of a list of
numbers
■ Calculate the average, given thenumber of data values and the
sum of the data values
■ Read tables and graphs
■ Perform computations on data
from tables and graphs
■ Use the relationship between the
probability of an event and the
probability of its complement
■ Recognize one-digit factors of a
number
■ Identify a digit’s place value
■ solve routine arithmetic problems
that involve rates, proportions, and
percents
■ model and solve problems that
contain verbal and symbolicrepresentations of money
■ do multistep computations with
rational numbers
■ interpret data and use appropriate
measures of central tendency to
find unknown values
■ find the probability of a simple
event in a variety of settings■ gather, organize, display, and
analyze data in a variety of ways
to use in problem solving
■ conduct simple probability
experiments, use a variety of
counting techniques (e.g., Venn
diagrams, Fundamental Counting
Principle, organized lists), and
represent results from data using
different formats
■ apply elementary number
concepts, including identifying
patterns pictorially and numerically
(e.g., triangular numbers,
arithmetic and geometric
sequences), ordering numbers,
and factoring
■ recognize, identify, and apply field
axioms (e.g., commutative)
■ Calculate the missing data value,
given the average and all data
values but one
■ Translate from one representationof data to another (e.g., a bar
graph to a circle graph)
■ Determine the probability of a
simple event
■ Exhibit knowledge of simple
counting techniques
■ Exhibit knowledge of elementary
number concepts including
rounding, the ordering of decimals,
pattern identification, absolutevalue, primes, and greatest
common factor
■ construct and analyze Venn
diagrams to help determine simple
probabilities
■ use the inverse relationships for the
four basic operations,
exponentiation, and root extractions
to determine unknown quantities
■ perform basic operations withcomplex numbers
■ apply and use number properties
to model and solve problems that
involve reasoning with proportions
■ select and use appropriate units
when solving problems that involveone or more units of measure
8/20/2019 Connect CRS to Classroom MATH.pdf
http://slidepdf.com/reader/full/connect-crs-to-classroom-mathpdf 15/83
11
■ sketch and identify line
segments, midpoints,
intersections, and vertical
and horizontal lines
■ Locate points on the
number line and in the
first quadrant
■ create expressions that
model mathematical
situations using
combinations of symbols
and numbers
■ evaluate algebraic
expressions and solve
multistep first-degree
equations
■ evaluate polynomial
functions that use
function notation
■ distinguish between
range and domain
■ Substitute whole
numbers for unknown
quantities to evaluateexpressions
■ Solve one-step equations
having integer or decimal
answers
■ Combine like terms (e.g.,
2x + 5x )
Table 1: (continued) The College Readiness Standards
■ Locate points in the
coordinate plane
■ Comprehend the concept
of length on the numberline
■ Exhibit knowledge of
slope
■ represent and interpret
relationships defined by
equations and formulas;
translate between
representations asordered pairs, graphs,
and equations; and
investigate symmetry and
transformations (e.g.,
reflections, translations,
rotations)
■ Evaluate algebraic
expressions by
substituting integers for
unknown quantities■ Add and subtract simple
algebraic expressions
■ Solve routine first-degree
equations
■ Perform straightforward
word-to-symbol
translations
■ Multiply two binomials
■ recognize what
geometric properties and
relationships for parallel
lines to apply to find
unknown anglemeasures
■ recognize when to apply
geometric properties and
relationships of triangles
to find unknown angle
measures
■ identify, interpret, and
generate symbolic
representations that
model the context of a
problem■ factor and perform the
basic operations on
polynomials
■ create and solve linear
equations and
inequalities that model
real-world situations
■ solve literal equations for
any variable
■ Find the measure of an
angle using properties of
parallel lines
■ Exhibit knowledge ofbasic angle properties
and special sums of
angle measures (e.g.,
90°, 180°, and 360°)
■ describe angles and
triangles using
mathematical
terminology and apply
their properties
■ Exhibit some knowledge
of the angles associated
with parallel lines
■ Compute the perimeter
of polygons when all
side lengths are given■ Compute the area of
rectangles when whole
number dimensions are
given
■ find area and perimeter
of a variety of polygons
by substituting given
values into standard
geometric formulas
■ Compute the area and
perimeter of triangles
and rectangles in simple
problems■ Use geometric formulas
when all necessary
information is given
■ Evaluate quadratic
functions, expressed in
function notation, at
integer values
■ apply a variety of
strategies to determine
the circumference or
perimeter and the area
for circles, triangles,rectangles, and
composite geometric
figures
■ identify the basic
trigonometric ratios
Expressions, Equations,& Inequalities
Graphical Representations
Properties ofPlane Figures Measurement Functions

8/20/2019 Connect CRS to Classroom MATH.pdf
http://slidepdf.com/reader/full/connect-crs-to-classroom-mathpdf 16/83
12
■ Solve multistep arithmetic
problems that involve planning or
converting units of measure (e.g.,feet per second to miles per hour)
24–27 Standards
ideas forprogress
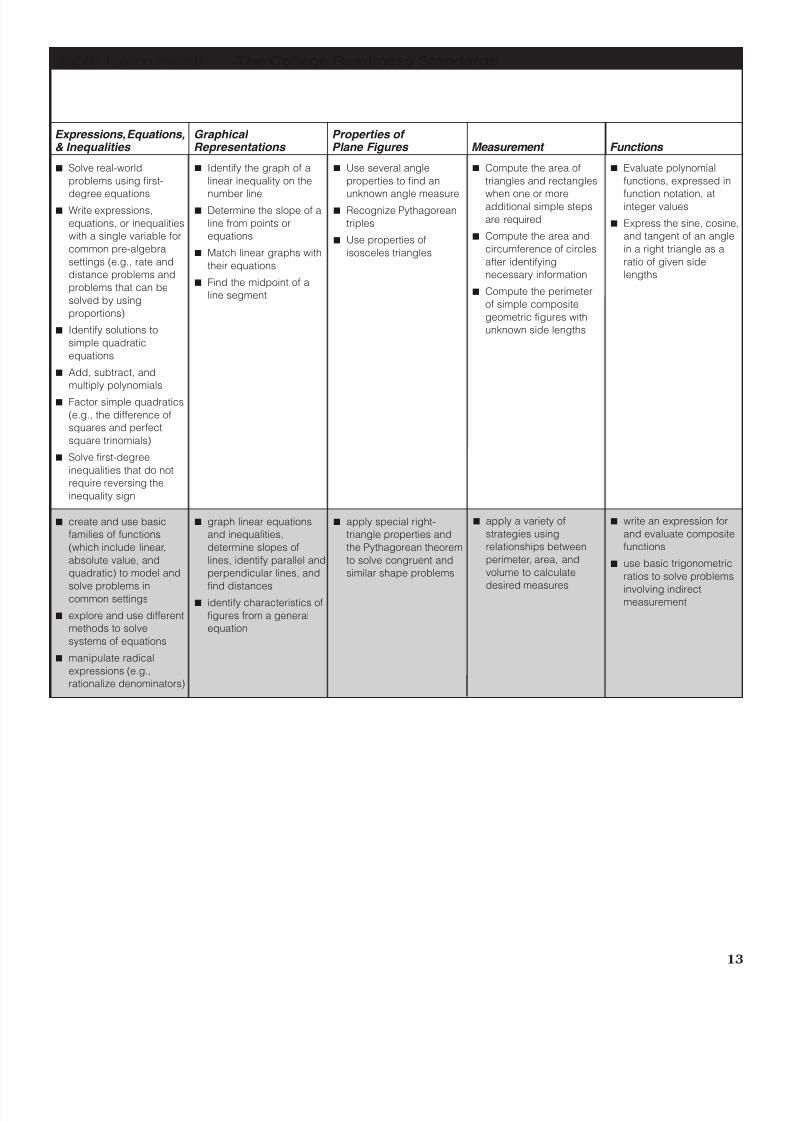
Table 1 (continued): The College Readiness Standards
The Standards describe what students who score in the specified score ranges are likely to know and tobe able to do. The ideas for progress help teachers identify ways of enhancing students’ learning basedon the scores students receive.
Basic Operations & Applications
Probability, Statistics,& Data Analysis Numbers: Concepts & Properties
ACTMATHEMATICS
TEST
■ Calculate the average, given the
frequency counts of all the data
values■ Manipulate data from tables and
graphs
■ Compute straightforward
probabilities for common situations
■ Use Venn diagrams in counting
■ Find and use the least common
multiple
■ Order fractions
■ Work with numerical factors
■ Work with scientific notation
■ Work with squares and square
roots of numbers
■ Work problems involving positive
integer exponents
■ Work with cubes and cube roots of
numbers
■ Determine when an expression is
undefined
■ Exhibit some knowledge of the
complex numbers
■ model and solve real-world
problems that involve a
combination of rates, proportions,
and/or percents
■ find the probability of simple
events, disjoint events, compound
events, and independent events in
a variety of settings using a variety
of counting techniques
■ apply and use elementary number
concepts and number properties to
model and solve nonroutine
problems that involve new ideas
8/20/2019 Connect CRS to Classroom MATH.pdf
http://slidepdf.com/reader/full/connect-crs-to-classroom-mathpdf 17/83
Expressions, Equations,& Inequalities
Graphical Representations
Properties ofPlane Figures Measurement Functions
13
■ graph linear equations
and inequalities,
determine slopes of
lines, identify parallel and
perpendicular lines, and
find distances■ identify characteristics of
figures from a general
equation
■ write an expression for
and evaluate composite
functions
■ use basic trigonometric
ratios to solve problems
involving indirectmeasurement
■ Identify the graph of a
linear inequality on the
number line■ Determine the slope of a
line from points or
equations
■ Match linear graphs with
their equations
■ Find the midpoint of a
line segment
■ create and use basic
families of functions
(which include linear,
absolute value, and
quadratic) to model and
solve problems incommon settings
■ explore and use different
methods to solve
systems of equations
■ manipulate radical
expressions (e.g.,
rationalize denominators)
■ Solve real-world
problems using first-
degree equations■ Write expressions,
equations, or inequalities
with a single variable for
common pre-algebra
settings (e.g., rate and
distance problems and
problems that can be
solved by using
proportions)
■ Identify solutions to
simple quadratic
equations
■ Add, subtract, and
multiply polynomials
■ Factor simple quadratics
(e.g., the difference of
squares and perfect
square trinomials)
■ Solve first-degree
inequalities that do not
require reversing the
inequality sign
Table 1: (continued) The College Readiness Standards
■ apply special right-
triangle properties and
the Pythagorean theorem
to solve congruent and
similar shape problems
■ Use several angle
properties to find an
unknown angle measure■ Recognize Pythagorean
triples
■ Use properties of
isosceles triangles
■ Evaluate polynomial
functions, expressed in
function notation, atinteger values
■ Express the sine, cosine,
and tangent of an angle
in a right triangle as a
ratio of given side
lengths
■ Compute the area of
triangles and rectangles
when one or moreadditional simple steps
are required
■ Compute the area and
circumference of circles
after identifying
necessary information
■ Compute the perimeter
of simple composite
geometric figures with
unknown side lengths
■ apply a variety of
strategies using
relationships between
perimeter, area, and
volume to calculate
desired measures
8/20/2019 Connect CRS to Classroom MATH.pdf
http://slidepdf.com/reader/full/connect-crs-to-classroom-mathpdf 18/83
14
■ Solve word problems containing
several rates, proportions, or
percentages
28–32 Standards
ideas forprogress
Table 1 (continued): The College Readiness Standards
The Standards describe what students who score in the specified score ranges are likely to know and tobe able to do. The ideas for progress help teachers identify ways of enhancing students’ learning basedon the scores students receive.
Basic Operations & Applications
Probability, Statistics,& Data Analysis Numbers: Concepts & Properties
ACTMATHEMATICS
TEST
■ Apply number properties involving
prime factorization
■ Apply number properties involvingeven/odd numbers and
factors/multiples
■ Apply number properties involving
positive/negative numbers
■ Apply rules of exponents
■ Multiply two complex numbers
■ solve problems that require
combining multiple concepts
■ design and conduct probability
investigations (e.g., how the
margin of error is determined) and
then determine, analyze, and
communicate the results
■ explain, solve, and/or draw
conclusions for complex problems
using relationships and elementary
number concepts
■ Solve complex arithmetic problems
involving percent of increase ordecrease and problems requiring
integration of several concepts
from pre-algebra and/or pre-
geometry (e.g., comparing
percentages or averages, using
several ratios, and finding ratios in
geometry settings)
■ Distinguish between mean,
median, and mode for a list ofnumbers
■ Analyze and draw conclusions
based on information from figures,
tables, and graphs
■ Exhibit knowledge of conditional
and joint probability
■ Draw conclusions based on
number concepts, algebraicproperties, and/or relationships
between expressions and numbers
■ Exhibit knowledge of logarithms
and geometric sequences
■ Apply properties of complex
numbers
■ Calculate or use a weighted
average
■ Interpret and use information fromfigures, tables, and graphs
■ Apply counting techniques
■ Compute a probability when the
event and/or sample space are not
given or obvious
33–36 Standards
8/20/2019 Connect CRS to Classroom MATH.pdf
http://slidepdf.com/reader/full/connect-crs-to-classroom-mathpdf 19/83
Expressions, Equations,& Inequalities
Graphical Representations
Properties ofPlane Figures Measurement Functions
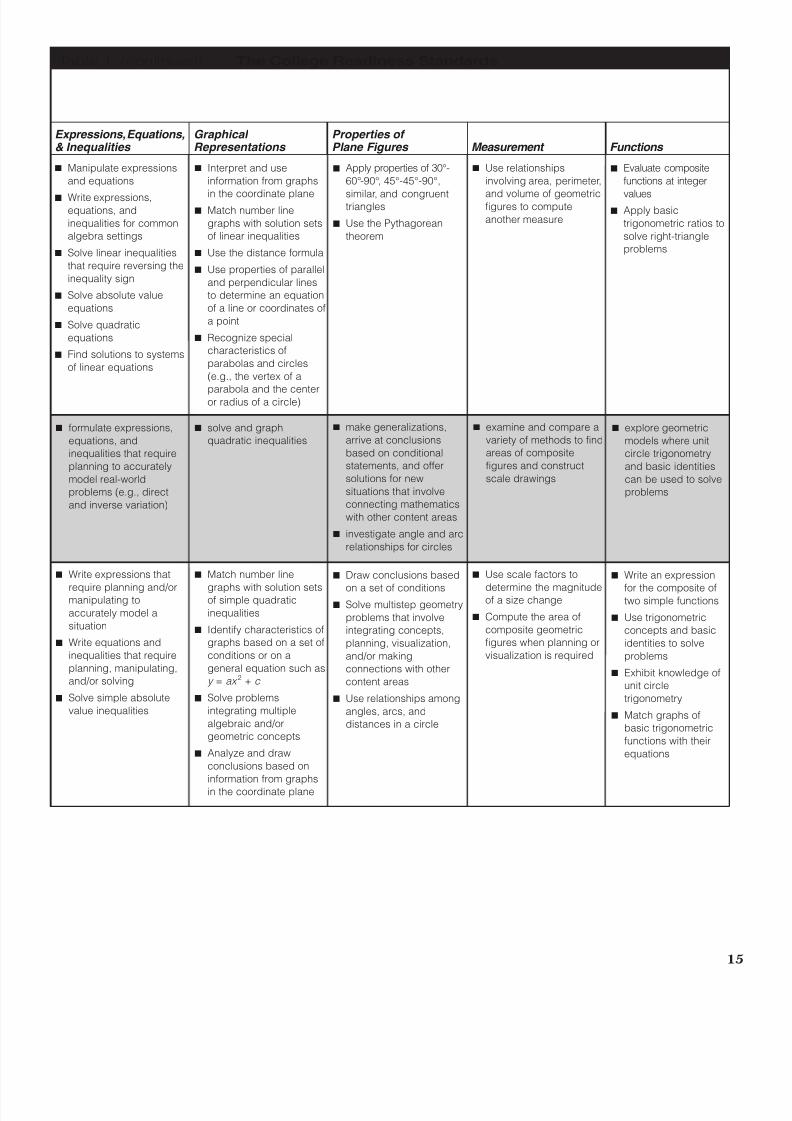
15
■ solve and graph
quadratic inequalities
■ Interpret and use
information from graphs
in the coordinate plane■ Match number line
graphs with solution sets
of linear inequalities
■ Use the distance formula
■ Use properties of parallel
and perpendicular lines
to determine an equation
of a line or coordinates of
a point
■ Recognize special
characteristics of
parabolas and circles
(e.g., the vertex of a
parabola and the centeror radius of a circle)
■ formulate expressions,
equations, and
inequalities that require
planning to accurately
model real-world
problems (e.g., direct
and inverse variation)
■ Manipulate expressions
and equations
■ Write expressions,equations, and
inequalities for common
algebra settings
■ Solve linear inequalities
that require reversing the
inequality sign
■ Solve absolute value
equations
■ Solve quadratic
equations
■ Find solutions to systems
of linear equations
Table 1: (continued) The College Readiness Standards
■ make generalizations,
arrive at conclusions
based on conditional
statements, and offer
solutions for new
situations that involve
connecting mathematics
with other content areas
■ investigate angle and arc
relationships for circles
■ Apply properties of 30°-
60°-90°, 45°-45°-90°,
similar, and congruenttriangles
■ Use the Pythagorean
theorem
■ Evaluate composite
functions at integer
values■ Apply basic
trigonometric ratios to
solve right-triangle
problems
■ Use relationships
involving area, perimeter,
and volume of geometricfigures to compute
another measure
■ examine and compare a
variety of methods to find
areas of composite
figures and construct
scale drawings
■ explore geometric
models where unit
circle trigonometry
and basic identities
can be used to solve
problems
■ Match number line
graphs with solution setsof simple quadratic
inequalities
■ Identify characteristics of
graphs based on a set of
conditions or on a
general equation such as
y = ax 2 + c
■ Solve problems
integrating multiple
algebraic and/or
geometric concepts
■ Analyze and draw
conclusions based on
information from graphs
in the coordinate plane
■ Write expressions that
require planning and/ormanipulating to
accurately model a
situation
■ Write equations and
inequalities that require
planning, manipulating,
and/or solving
■ Solve simple absolute
value inequalities
■ Draw conclusions based
on a set of conditions■ Solve multistep geometry
problems that involve
integrating concepts,
planning, visualization,
and/or making
connections with other
content areas
■ Use relationships among
angles, arcs, and
distances in a circle
■ Use scale factors to
determine the magnitudeof a size change
■ Compute the area of
composite geometric
figures when planning or
visualization is required
■ Write an expression
for the composite oftwo simple functions
■ Use trigonometric
concepts and basic
identities to solve
problems
■ Exhibit knowledge of
unit circle
trigonometry
■ Match graphs of
basic trigonometric
functions with their
equations
8/20/2019 Connect CRS to Classroom MATH.pdf
http://slidepdf.com/reader/full/connect-crs-to-classroom-mathpdf 20/83
16
WHAT DOES THE ACTMATHEMATICS TEST MEASURE?
The ACT Mathematics Test is a 60-question,
60-minute test designed to assess the mathematical
reasoning skills that students have typically acquired
in courses taken up to the beginning of Grade 12.
The multiple-choice test requires students to analyze
problems in real-world and purely mathematical
settings, plan and carry out solution strategies, and
verify the appropriateness of solutions. Most of the
test questions are individual items, but some may
belong to sets (i.e., several items based on the same
graph, chart, or information).
On the ACT Mathematics Test, students
demonstrate their ability to read and understand
mathematical terminology; to apply definitions,
algorithms, theorems, and properties; to interpret
and analyze data; and to use mathematics to solve
problems.
Students also apply quantitative reasoning in a
variety of ways, such as discerning relationships
between mathematical concepts, connecting and
integrating mathematical concepts and ideas, and
making generalizations. Computational skills and
knowledge of basic formulas are assumed as
background for the problems, but extensive
computation and memorization of complex formulas
are not required. The concepts covered on the test
emphasize the major content areas that are
prerequisite to successful performance in entry-level
college mathematics courses.
The questions focus on mathematical reasoning
and making connections within and among six
content areas and at various cognitive levels. These
areas and levels are shown in Figure 1 on page 17.
Through the various cognitive levels, students
demonstrate their ability to use and reason with
mathematics. Knowledge and Skills questions (about
50% of the test) require students to use one or more
facts, definitions, formulas, or procedures to solve
problems that are presented in purely mathematical
terms. Direct Application questions (about 28% of the
test) require students to use their knowledge and skills
to solve straightforward problems set in real-worldsituations. Understanding Concepts and Integrating
Conceptual Understanding questions (about 22% of
the test) assess students’ depth of understanding of
major concepts by requiring reasoning from a single
concept or the integration of several concepts to
reach an inference or a conclusion.
The content of the ACT Mathematics Test is
reflective of the content taught in mathematics
classrooms and of the prerequisite skills and
understandings necessary for successful transition
to entry-level college mathematics courses. ACT
routinely monitors the high school mathematicscurriculum through reviews of state and national
standards, current textbooks, and national
organizations’ curriculum frameworks; surveys of
secondary and postsecondary instructors; and
meetings with education consultants. A brief
description of the content sampled on the test and the
approximate percentage of the test devoted to each
content area on the ACT Mathematics Test are
provided on page 17.
DESCRIPTION OF THE
ACT MATHEMATICS TEST
“The test should measure what students can do with what they have
learned.”
— (ACT, 1996b, p. 2)
8/20/2019 Connect CRS to Classroom MATH.pdf
http://slidepdf.com/reader/full/connect-crs-to-classroom-mathpdf 21/83
17
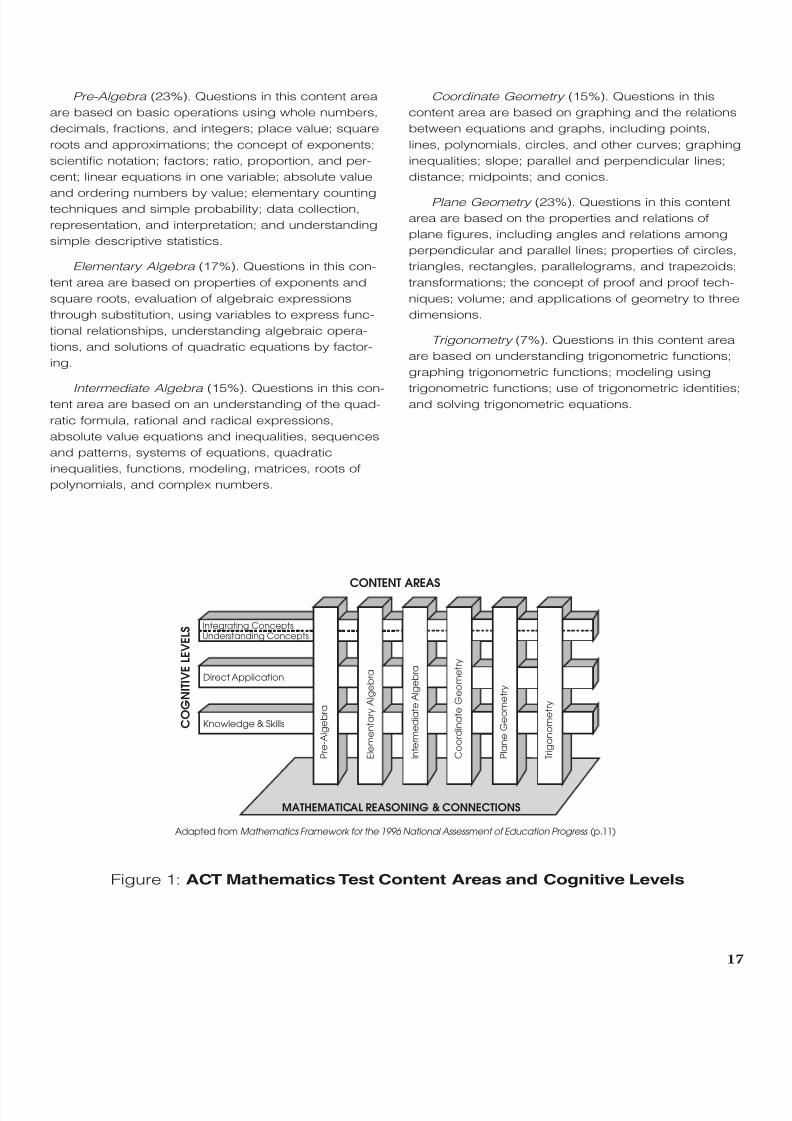
Pre-Algebra (23%). Questions in this content area
are based on basic operations using whole numbers,
decimals, fractions, and integers; place value; square
roots and approximations; the concept of exponents;
scientific notation; factors; ratio, proportion, and per-
cent; linear equations in one variable; absolute value
and ordering numbers by value; elementary countingtechniques and simple probability; data collection,
representation, and interpretation; and understanding
simple descriptive statistics.
Elementary Algebra (17%). Questions in this con-
tent area are based on properties of exponents and
square roots, evaluation of algebraic expressions
through substitution, using variables to express func-
tional relationships, understanding algebraic opera-
tions, and solutions of quadratic equations by factor-
ing.
Intermediate Algebra (15%). Questions in this con-tent area are based on an understanding of the quad-
ratic formula, rational and radical expressions,
absolute value equations and inequalities, sequences
and patterns, systems of equations, quadratic
inequalities, functions, modeling, matrices, roots of
polynomials, and complex numbers.
Coordinate Geometry (15%). Questions in this
content area are based on graphing and the relations
between equations and graphs, including points,
lines, polynomials, circles, and other curves; graphing
inequalities; slope; parallel and perpendicular lines;
distance; midpoints; and conics.
Plane Geometry (23%). Questions in this content
area are based on the properties and relations of
plane figures, including angles and relations among
perpendicular and parallel lines; properties of circles,
triangles, rectangles, parallelograms, and trapezoids;
transformations; the concept of proof and proof tech-
niques; volume; and applications of geometry to three
dimensions.
Trigonometry (7%). Questions in this content area
are based on understanding trigonometric functions;
graphing trigonometric functions; modeling using
trigonometric functions; use of trigonometric identities;and solving trigonometric equations.
CONTENT AREAS
P r e - A l g e b r a
E l e m e n t a r y A l g e b r a
I n t e r m e d i a t e A l g e b r a
Integrating ConceptsUnderstanding Concepts
Direct Application
Knowledge & Skills
MATHEMATICAL REASONING & CONNECTIONS
C O G N I T I V E L E V E L S
Adapted from Mathematics Framework for the 1996 National Assessment of Education Progress (p.11)
C o o r d i n a t e G e o m e t r y
P l a n e G e o m e t r y
T r i g o n o m e t r y
Figure 1: ACT Mathematics Test Content Areas and Cognitive Levels
8/20/2019 Connect CRS to Classroom MATH.pdf
http://slidepdf.com/reader/full/connect-crs-to-classroom-mathpdf 22/83
Strand Content Area
Basic Operations & Applications Pre-Algebra
Probability, Statistics, & Data Analysis Pre-Algebra
Elementary Algebra
Numbers: Concepts & Properties Pre-Algebra
Elementary Algebra
Intermediate Algebra
Expressions, Equations, & Inequalities Pre-Algebra
Elementary Algebra
Intermediate Algebra
Graphical Representations Coordinate Geometry
Properties of Plane Figures Plane Geometry
Measurement Plane GeometryCoordinate Geometry
Functions Intermediate Algebra
Coordinate Geometry
Trigonometry
18
WHAT IS ACT’S CALCULATOR
P OLICY FOR THE ACT?
Students may use any four-function, any scientific,
and almost any graphing calculator on the ACT
Mathematics Test. However, calculators are not
required. All problems can be solved without acalculator. If students regularly use a calculator in their
math work, they are encouraged to use one they are
familiar with as they take the Mathematics Test. Using
a more powerful, but unfamiliar, calculator is not likely
to give students an advantage over using the kind
they normally use.
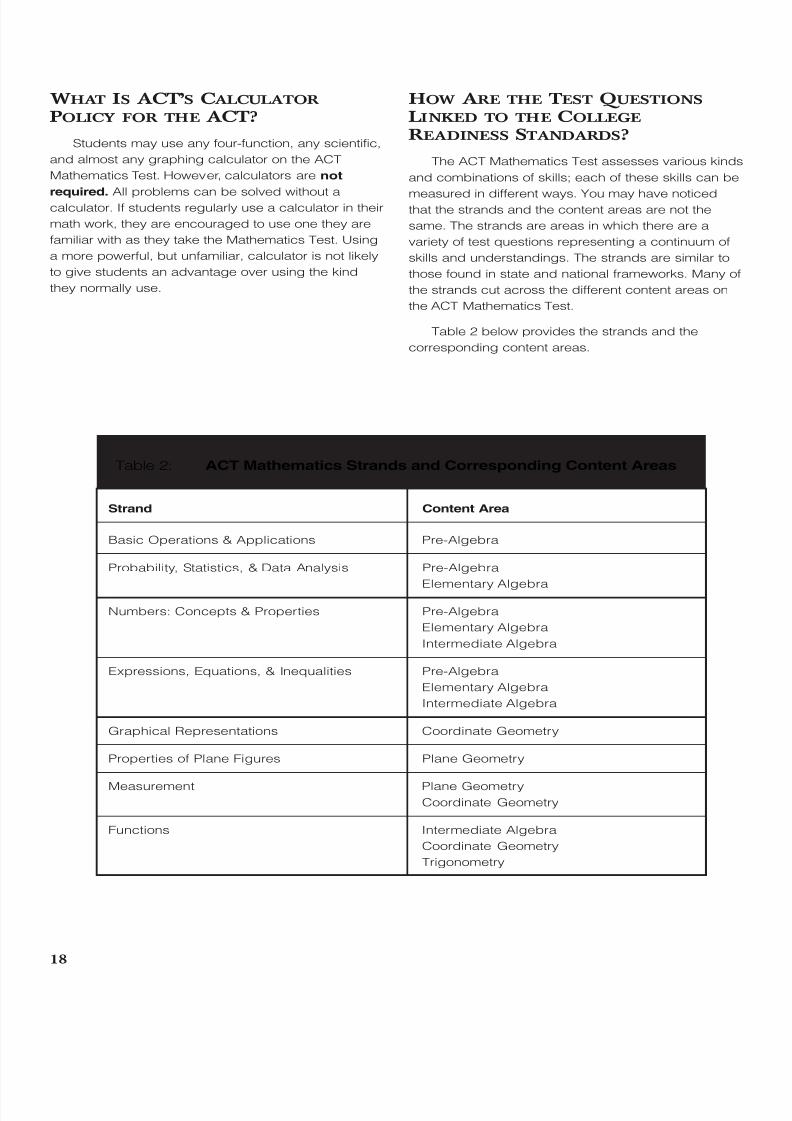
HOW ARE THE TEST Q UESTIONS
LINKED TO THE COLLEGE
R EADINESS STANDARDS?
The ACT Mathematics Test assesses various kinds
and combinations of skills; each of these skills can be
measured in different ways. You may have noticedthat the strands and the content areas are not the
same. The strands are areas in which there are a
variety of test questions representing a continuum of
skills and understandings. The strands are similar to
those found in state and national frameworks. Many of
the strands cut across the different content areas on
the ACT Mathematics Test.
Table 2 below provides the strands and the
corresponding content areas.
Table 2: ACT Mathematics Strands and Corresponding Content Areas
8/20/2019 Connect CRS to Classroom MATH.pdf
http://slidepdf.com/reader/full/connect-crs-to-classroom-mathpdf 23/83
19
THE N EED FOR THINKING SKILLS
Every student comes to school with the ability to
think, but to achieve their goals students need to
develop skills such as learning to make new
connections between texts and ideas, to understand
increasingly complex concepts, and to think through
their assumptions. Because of technological
advances and the fast pace of our society, it is
increasingly important that students not only know
information but also know how to critique and managethat information. Students must be provided with the
tools for ongoing learning; understanding, analysis,
and generalization skills must be developed so that
the learner is able to adapt to a variety of situations.
HOW ARE ACT TEST Q UESTIONS
LINKED TO THINKING SKILLS?
Our belief in the importance of developing
thinking skills in learners was a key factor in the
development of the ACT. ACT believes that students’
preparation for further learning is best assessed by
measuring, as directly as possible, the academic
skills that students have acquired and that they will
need to perform at the next level of learning. The
required academic skills can most directly be
assessed by reproducing as faithfully as possible the
complexity of the students’ schoolwork. Therefore, the
ACT test questions are designed to determine how
skillfully students solve problems, grasp implied
meanings, draw inferences, evaluate ideas, and make
judgments in subject-matter areas important to
success in intellectual work both inside and outside
school.
Table 3 on pages 20– 33 provides sample test
questions, organized by score range, that are linked
to specific skills within each of the eight Mathematics
strands. It is important to note the increasing level of
skill with mathematics—computing, reasoning, and
making connections—that students scoring in the
higher score ranges are able to demonstrate. The
questions were chosen to illustrate the variety of
content as well as the range of complexity within each
strand. The sample test questions for the 16–19,
20– 23, 24–27, 28–32, and 33–36 score ranges are
examples of items answered correctly by 80% or
more of the ACT examinees who obtained scores in
each of these five score ranges. The sample testquestions for the 13–15 score range, however, are
examples of items answered correctly by 80% of the
PLAN examinees who obtained scores in this score
range. PLAN test questions are given for the 13–15
score range because it was not possible, using the
80% criterion described on page 5, to identify ACT
sample test questions for this score range.
As you review the sample test questions, you will
note that each correct answer is marked with an
asterisk. For score ranges that include more than one
skill, boldface type is used to denote the skill that
corresponds to the sample test question.
“Learning is not attained by chance,
it must be sought for with ardour and
attended to with diligence.”
— Abigail Adams in a letter to
John Quincy Adams

8/20/2019 Connect CRS to Classroom MATH.pdf
http://slidepdf.com/reader/full/connect-crs-to-classroom-mathpdf 24/83
20
Table 3: ACT Sample Test Questions by Score RangeBasic Operations & Applications Strand
Score Range Basic Operations & Applications
13–15
16–19
20–23
24–27
28–32
Ten boxes of books were delivered to the school library. There
were 50 books in each box, except for the last box, which con-
tained only 40 books. How many books did the library receive in
this delivery?
A. 50
B. 450
*C. 490
D. 500
E. 540
A stone is a unit of weight equivalent to 14 pounds. If a person
weighs 177 pounds, how many stone, to the nearest tenth, does
this person weigh?
A. 247.8
B. 126.4
C. 79.1*D. 12.6
E. 7.9
Near a large city, planes take off from two airfields. One of the
fields is capable of sending up a plane every 3 minutes. The other
field is capable of sending up 2 planes every 7 minutes. At these
rates, which of the following is the most reasonable estimate of
the total number of planes the two airfields could send up in
90 minutes?
A. 18
B. 27
C. 36
D. 44*E. 55
Four students about to purchase concert tickets for $18.50 for
each ticket discover that they may purchase a block of 5 tickets
for $80.00. How much would each of the 4 save if they can get a
fifth person to join them and the 5 people equally divide the price
of the 5-ticket block?
A. $ 1.50
*B. $ 2.50
C. $ 3.13
D. $10.00
E. $12.50
A performance was rated on a 3-point scale by an audience. A rat-
ing of 1 was given by 30% of the audience, a rating of 2 by 60%,
and a rating of 3 by 10%. To the nearest tenth, what was the aver-
age of the ratings?
A. 1.2
B. 1.5
*C. 1.8
D. 2.0
E. 2.2
Sample Test Questions
Perform one-operation computation with wholenumbers and decimals
Solve problems in one or two steps using wholenumbers
Perform common conversions (e.g., inches to feet
or hours to minutes)
Solve routine one-step arithmetic problems (usingwhole numbers, fractions, and decimals) such assingle-step percent
Solve some routine two-step arithmetic
problems
Solve routine two-step or three-step arithmeticproblems involving concepts such as rate and
proportion, tax added, percentage off, andcomputing with a given average
Solve multistep arithmetic problems that involveplanning or converting units of measure (e.g., feetper second to miles per hour)
Solve word problems containing several rates,proportions, or percentages
8/20/2019 Connect CRS to Classroom MATH.pdf
http://slidepdf.com/reader/full/connect-crs-to-classroom-mathpdf 25/83
21
Table 3: ACT Sample Test Questions by Score RangeBasic Operations & Applications Strand
Score Range Basic Operations & Applications
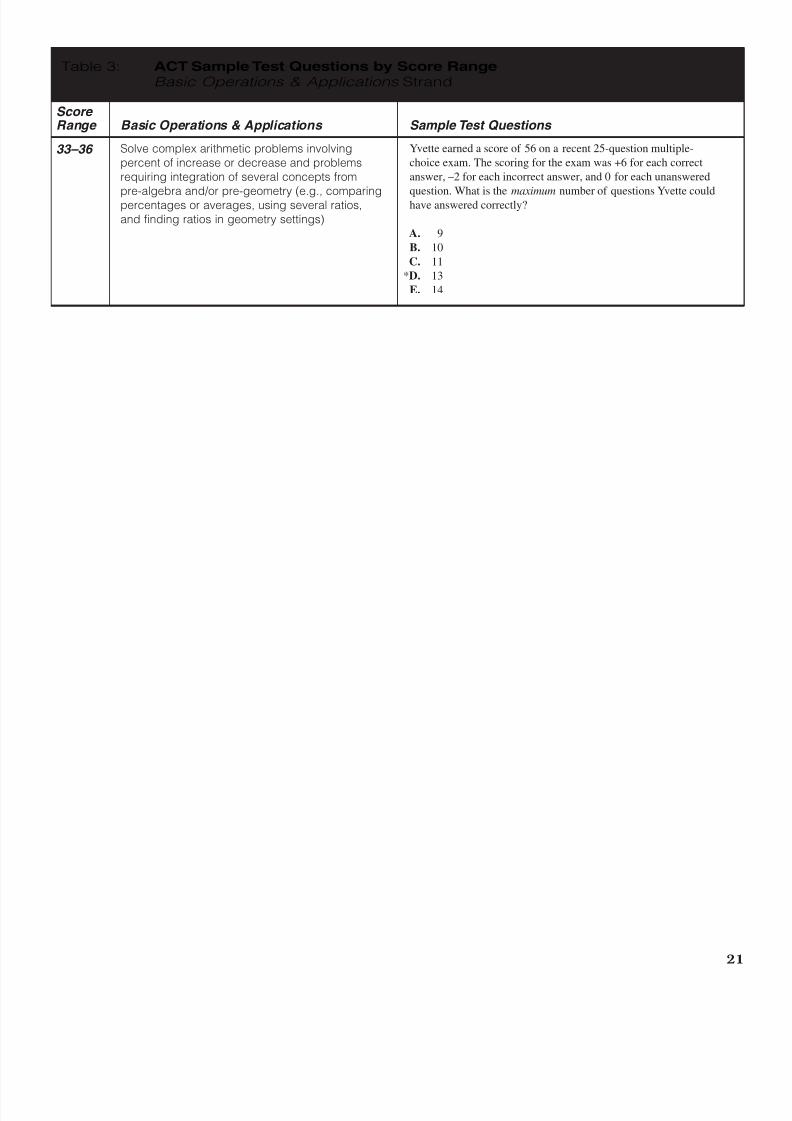
Solve complex arithmetic problems involvingpercent of increase or decrease and problemsrequiring integration of several concepts from
pre-algebra and/or pre-geometry (e.g., comparingpercentages or averages, using several ratios,and finding ratios in geometry settings)
33–36 Yvette earned a score of 56 on a recent 25-question multiple-
choice exam. The scoring for the exam was +6 for each correct
answer, –2 for each incorrect answer, and 0 for each unanswered
question. What is the maximum number of questions Yvette couldhave answered correctly?
A. 9
B. 10
C. 11
*D. 13
E. 14
Sample Test Questions
8/20/2019 Connect CRS to Classroom MATH.pdf
http://slidepdf.com/reader/full/connect-crs-to-classroom-mathpdf 26/83
22
Table 3: ACT Sample Test Questions by Score RangeProbability, Statistics, & Data Analysis Strand
Score Range Probability, Statistics, & Data Analysis
13–15
16–19
20–23
Sample Test Questions
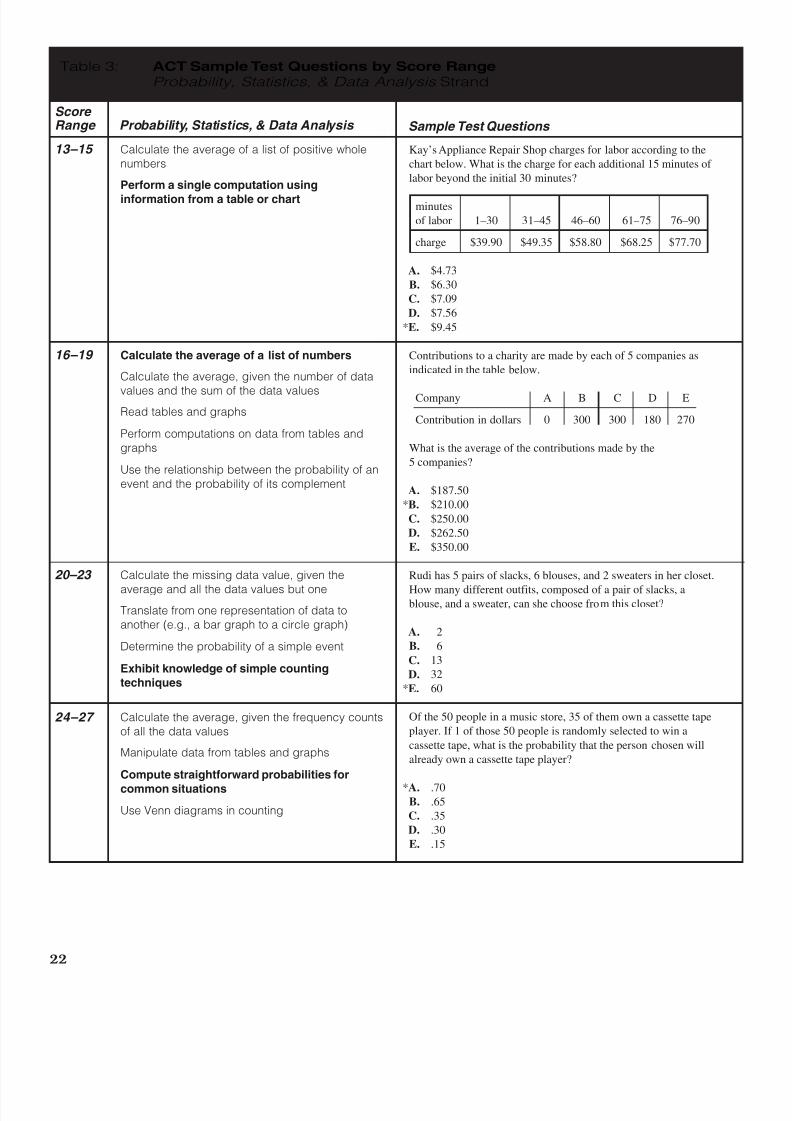
Calculate the average of a list of positive wholenumbers
Perform a single computation using
information from a table or chart
Calculate the average of a list of numbers
Calculate the average, given the number of data
values and the sum of the data valuesRead tables and graphs
Perform computations on data from tables andgraphs
Use the relationship between the probability of anevent and the probability of its complement
Calculate the missing data value, given the
average and all the data values but one
Translate from one representation of data toanother (e.g., a bar graph to a circle graph)
Determine the probability of a simple event
Exhibit knowledge of simple counting
techniques
Calculate the average, given the frequency countsof all the data values
Manipulate data from tables and graphs
Compute straightforward probabilities for
common situations
Use Venn diagrams in counting
Kay’s Appliance Repair Shop charges for labor according to the
chart below. What is the charge for each additional 15 minutes of
labor beyond the initial 30 minutes?
minutes
of labor 1–30 31–45 46–60 61–75 76–90
charge $39.90 $49.35 $58.80 $68.25 $77.70
A. $4.73
B. $6.30
C. $7.09
D. $7.56
*E. $9.45
Contributions to a charity are made by each of 5 companies as
indicated in the table below.
Company A B C D E
Contribution in dollars 0 300 300 180 270
What is the average of the contributions made by the
5 companies?
A. $187.50
*B. $210.00
C. $250.00
D. $262.50
E. $350.00
Rudi has 5 pairs of slacks, 6 blouses, and 2 sweaters in her closet.
How many different outfits, composed of a pair of slacks, ablouse, and a sweater, can she choose from this closet?
A. 2
B. 6
C. 13
D. 32
*E. 60
Of the 50 people in a music store, 35 of them own a cassette tape
player. If 1 of those 50 people is randomly selected to win a
cassette tape, what is the probability that the person chosen will
already own a cassette tape player?
*A. .70B. .65
C. .35
D. .30
E. .15
24–27
8/20/2019 Connect CRS to Classroom MATH.pdf
http://slidepdf.com/reader/full/connect-crs-to-classroom-mathpdf 27/83
Table 3: ACT Sample Test Questions by Score RangeProbability, Statistics, & Data Analysis Strand
Score Range Probability, Statistics, & Data Analysis
28–32
33–36
Sample Test Questions
23
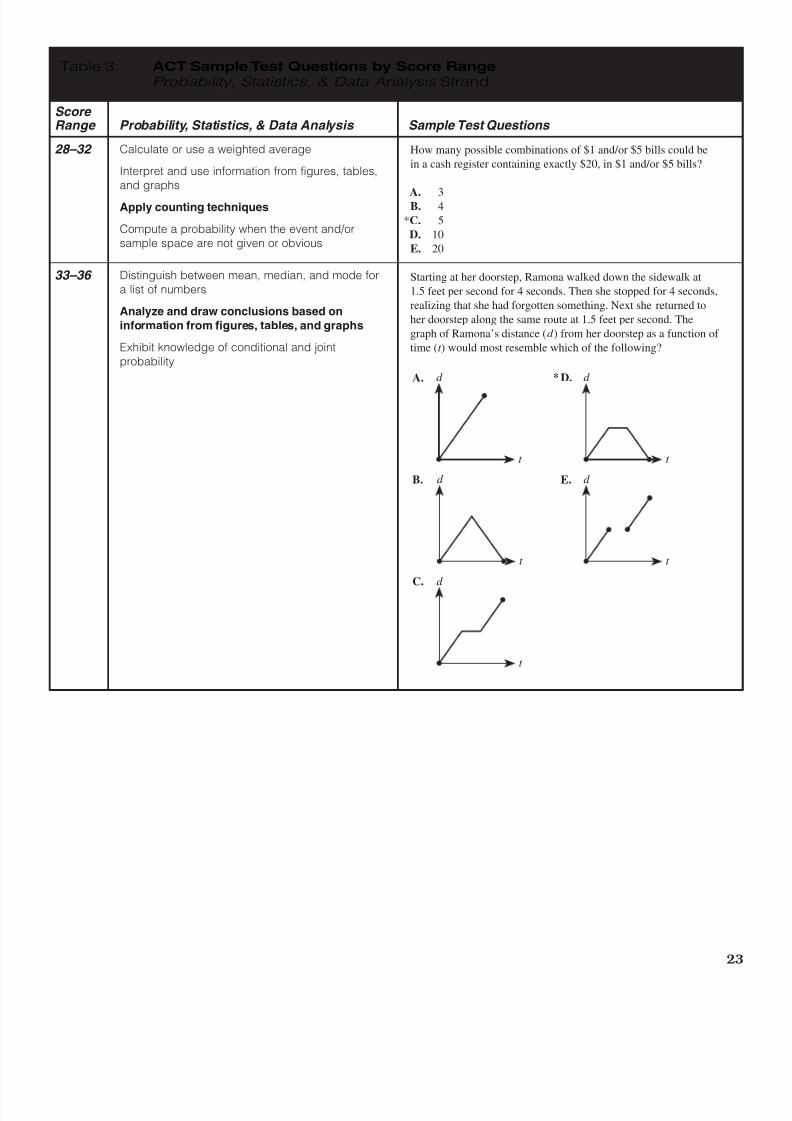
Calculate or use a weighted average
Interpret and use information from figures, tables,and graphs
Apply counting techniques
Compute a probability when the event and/orsample space are not given or obvious
Distinguish between mean, median, and mode fora list of numbers
Analyze and draw conclusions based on
information from figures, tables, and graphs
Exhibit knowledge of conditional and jointprobability
How many possible combinations of $1 and/or $5 bills could be
in a cash register containing exactly $20, in $1 and/or $5 bills?
A. 3B. 4
*C. 5
D. 10
E. 20
Starting at her doorstep, Ramona walked down the sidewalk at
1.5 feet per second for 4 seconds. Then she stopped for 4 seconds,
realizing that she had forgotten something. Next she returned to
her doorstep along the same route at 1.5 feet per second. The
graph of Ramona’s distance (d ) from her doorstep as a function of
time (t ) would most resemble which of the following?
d A.
B.
D.
E.
t
d
t
d
t
d
t
C. d
t
*

8/20/2019 Connect CRS to Classroom MATH.pdf
http://slidepdf.com/reader/full/connect-crs-to-classroom-mathpdf 28/83
24
Table 3: ACT Sample Test Questions by Score RangeNumbers: Concepts & Properties Strand
Score Range Numbers: Concepts & Properties
13–15
16–19
20–23
Sample Test Questions
24–27
28–32
Recognize equivalent fractions and fractions inlowest terms
Recognize one-digit factors of a numberIdentify a digit’s place value
Exhibit knowledge of elementary numberconcepts including rounding, the ordering of
decimals, pattern identification, absolute value,primes, and greatest common factor
Find and use the least common multiple
Order fractions
Work with numerical factors
Work with scientific notation
Work with squares and square roots of numbers
Work problems involving positive integerexponents
Work with cubes and cube roots of numbers
Determine when an expression is undefined
Exhibit some knowledge of the complex numbers
Apply number properties involving primefactorization
Apply number properties involving even/oddnumbers and factors/multiples
Apply number properties involving
positive/negative numbers
Apply rules of exponents
Multiply two complex numbers
Due to the secure nature of the test, it was not possible toprovide a sample test question for this skill.
The greatest common divisor of 84, 90, and 66 (that is, the largestexact divisor of all three numbers) is:
*A. 6
B. 12
C. 18
D. 36
E. 90
What is the 7th term in this sequence of “triangular” numbers,
defined by the figures below: 1, 3, 6, 10, . . . ?
*
* * *
* * * * * ** * * * * * * * * * . . .
1 3 6 10
A. 7
B. 22
C. 25
*D. 28
E. 40
What is the least common multiple of 80, 70, and 90 ?
A. 80
B. 240
C. 504*D. 5,040
E. 504,000
If a and b are real numbers, and a > b and b < 0, then which of
the following inequalities must be true?
A. a > 0
B. a < 0
C. a2 > b
2
D. a2 < b2
*E. b2 > 0
8/20/2019 Connect CRS to Classroom MATH.pdf
http://slidepdf.com/reader/full/connect-crs-to-classroom-mathpdf 29/83
25
Table 3: ACT Sample Test Questions by Score RangeNumbers: Concepts & Properties Strand
Score Range Numbers: Concepts & Properties
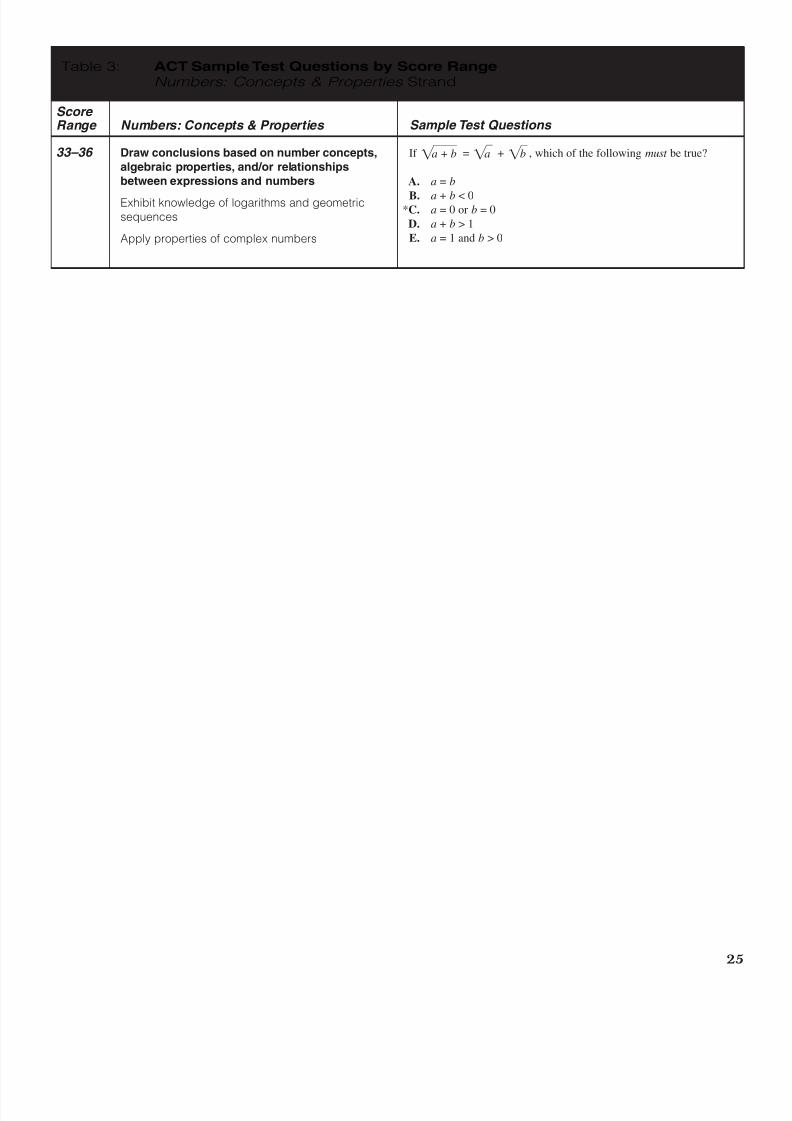
33–36
Sample Test Questions
Draw conclusions based on number concepts,
algebraic properties, and/or relationships
between expressions and numbers
Exhibit knowledge of logarithms and geometricsequences
Apply properties of complex numbers
If = + , which of the following must be true?
A. a = b
B. a + b < 0*C. a = 0 or b = 0
D. a + b > 1
E. a = 1 and b > 0
b a a + b

8/20/2019 Connect CRS to Classroom MATH.pdf
http://slidepdf.com/reader/full/connect-crs-to-classroom-mathpdf 30/83
26
Table 3: ACT Sample Test Questions by Score RangeExpressions, Equations, & Inequalities Strand
Score Range Expressions, Equations, & Inequalities
13–15
16–19
20–23
Sample Test Questions
24–27
Exhibit knowledge of basic expressions (e.g.,identify an expression for a total as b + g )
Solve equations in the form x + a = b , where
a and b are whole numbers or decimals
Substitute whole numbers for unknown
quantities to evaluate expressions
Solve one-step equations having integer ordecimal answers
Combine like terms (e.g., 2x + 5x )
Evaluate algebraic expressions by substitutingintegers for unknown quantities
Add and subtract simple algebraic expressions
Solve routine first-degree equations
Perform straightforward word-to-symboltranslations
Multiply two binomials
Solve real-world problems using first-degree
equations
Write expressions, equations or inequalities with asingle variable for common pre-algebra settings(e.g., rate and distance problems and problemsthat can be solved by using proportions)
Identify solutions to simple quadratic equations
Add, subtract, and multiply polynomials
Factor simple quadratics (e.g., the difference ofsquares and perfect square trinomials)
Solve first-degree inequalities that do not requirereversing the inequality sign
What is the solution of x + 3.4 = 20.91 ?
A. 24.31
B. 23.95C. 17.87
*D. 17.51
E. 6.15
The operation x ~ y stands for . Which of the following is
equal to 7 ~ 3 ?
A. 10
B. 6
C. 5
D. 4
*E. 2
If –(5 x – 21) = 2 x, then x = ?
*A. 3
B. 5
C. 7
D. –3
E. –7
The relationship between temperature expressed in degrees
Fahrenheit (F ) and degrees Celsius (C ) is given by the formula
F = C + 32
If the temperature is 14 degrees Fahrenheit, what is it in degrees
Celsius?
*A. –10
B. –12
C. –14
D. –16
E. –18
9__5
1__2
1__4
x + y_____ x – y
8/20/2019 Connect CRS to Classroom MATH.pdf
http://slidepdf.com/reader/full/connect-crs-to-classroom-mathpdf 31/83
27
Table 3: ACT Sample Test Questions by Score RangeExpressions, Equations, & Inequalities Strand
Score Range Expressions, Equations, & Inequalities
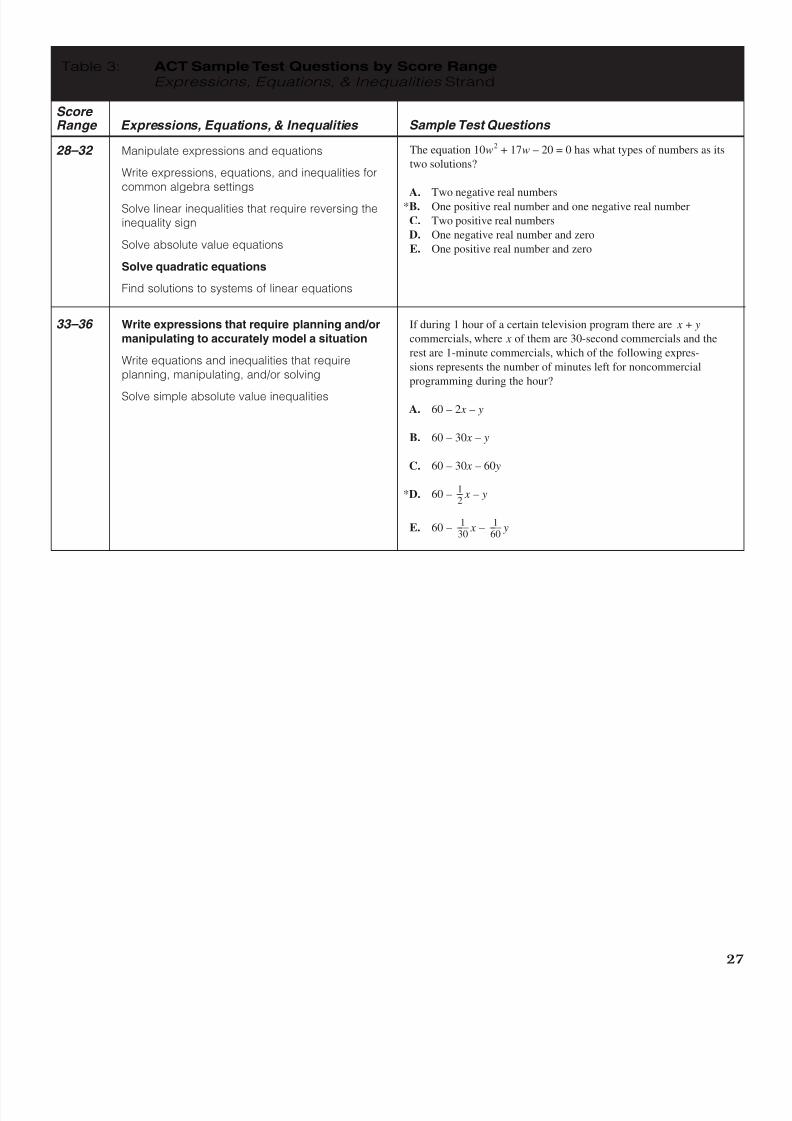
28–32
33–36
Sample Test Questions
Manipulate expressions and equations
Write expressions, equations, and inequalities forcommon algebra settings
Solve linear inequalities that require reversing theinequality sign
Solve absolute value equations
Solve quadratic equations
Find solutions to systems of linear equations
Write expressions that require planning and/or
manipulating to accurately model a situation
Write equations and inequalities that requireplanning, manipulating, and/or solving
Solve simple absolute value inequalities
If during 1 hour of a certain television program there are x + y
commercials, where x of them are 30-second commercials and the
rest are 1-minute commercials, which of the following expres-
sions represents the number of minutes left for noncommercial
programming during the hour?
A. 60 – 2 x – y
B. 60 – 30 x – y
C. 60 – 30 x – 60 y
*D. 60 – x – y
E. 60 – x – y1___
601___30
1__2
The equation 10w2 + 17w – 20 = 0 has what types of numbers as its
two solutions?
A. Two negative real numbers*B. One positive real number and one negative real number
C. Two positive real numbers
D. One negative real number and zero
E. One positive real number and zero

8/20/2019 Connect CRS to Classroom MATH.pdf
http://slidepdf.com/reader/full/connect-crs-to-classroom-mathpdf 32/83
28
Table 3: ACT Sample Test Questions by Score RangeGraphical Representations Strand
Score Range Graphical Representations
13–15
16–19
20–23
Sample Test Questions
24–27
Identify the location of a point with a positive
coordinate on the number line
Locate points on the number line and in the firstquadrant
Locate points in the coordinate plane
Comprehend the concept of length on the number
line
Exhibit knowledge of slope
Identify the graph of a linear inequality on the
number line
Determine the slope of a line from points or
equations
Match linear graphs with their equations
Find the midpoint of a line segment
The coordinates of the endpoints of a certain segment on the real
number line below are –4 and 20. What is the coordinate of the
midpoint of this segment?
A. 7
*B. 8
C. 10
D. 12
E. 16
Two straight lines are graphed in the standard ( x , y) coordinate
plane below. What are the coordinates of their intersection?
A.
,
*B. (1,1)
C. ,
D. ,
E. 2 , 2
Eight points with integer coordinates are plotted in the standard
( x , y) coordinate plane below. Which of the plotted points has an
x-coordinate less than 1 and a y-coordinate of at least 2 ?
A. AB. BC. C
D. D*E. E
What is the slope of the line 4 x – 3 y = 5 ?
A. –
B. –
C. –
D.
*E.4__3
3__4
3__4
4__3
5__3
2____2
2____2
3__2
3__2
3__
4
3__
4
x –4–8 0 4 8 12 16 20 24
x =
y
x
y
(2,0)
?(0,2)
y
x
A
B
C
D
E
O
2
–2
2–2
8/20/2019 Connect CRS to Classroom MATH.pdf
http://slidepdf.com/reader/full/connect-crs-to-classroom-mathpdf 33/83
29
Table 3: ACT Sample Test Questions by Score RangeGraphical Representations Strand
Score Range Graphical Representations
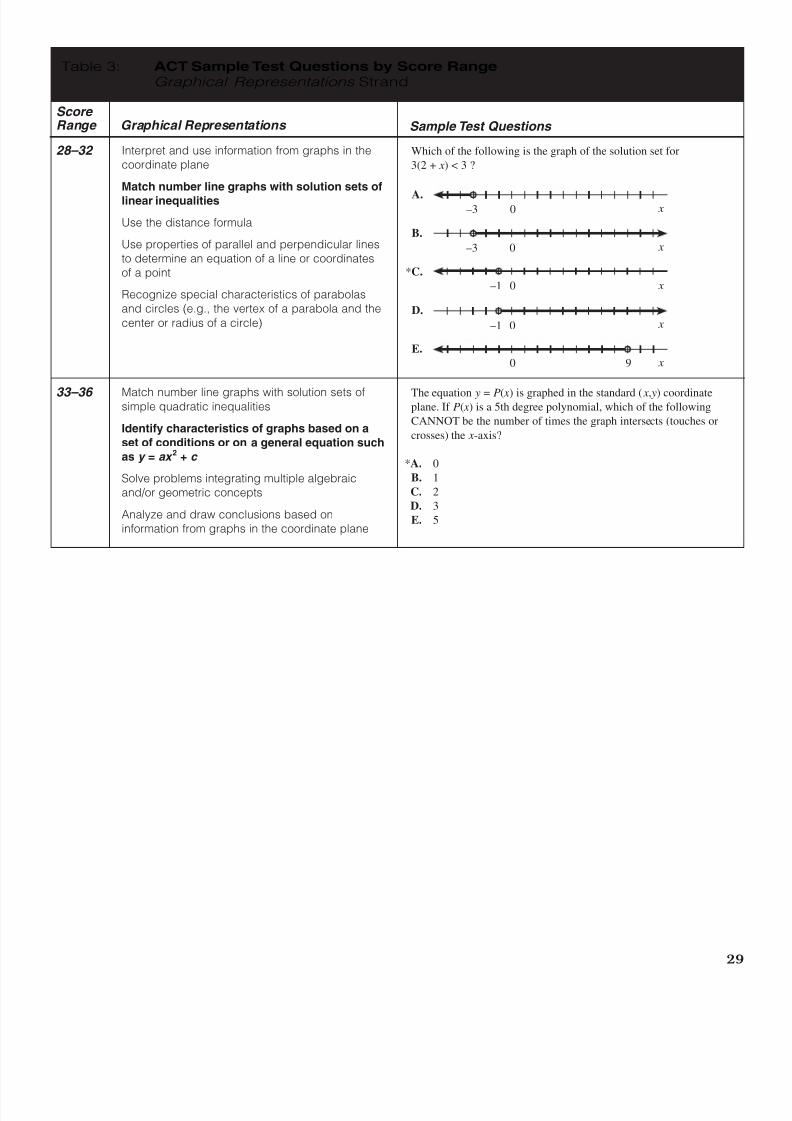
28–32
33–36
Sample Test Questions
Interpret and use information from graphs in thecoordinate plane
Match number line graphs with solution sets of
linear inequalities
Use the distance formula
Use properties of parallel and perpendicular linesto determine an equation of a line or coordinatesof a point
Recognize special characteristics of parabolasand circles (e.g., the vertex of a parabola and the
center or radius of a circle)
Match number line graphs with solution sets ofsimple quadratic inequalities
Identify characteristics of graphs based on a
set of conditions or on a general equation such
as y = ax 2 + c
Solve problems integrating multiple algebraicand/or geometric concepts
Analyze and draw conclusions based oninformation from graphs in the coordinate plane
Which of the following is the graph of the solution set for
3(2 + x ) < 3 ?
The equation y = P( x ) is graphed in the standard ( x , y) coordinateplane. If P( x ) is a 5th degree polynomial, which of the following
CANNOT be the number of times the graph intersects (touches or
crosses) the x -axis?
*A. 0
B. 1
C. 2
D. 3
E. 5
x
x
x
x
x
–3 0
–3 0
–1 0
–1 0
A.
9
B.
*C.
D.
E.
0
8/20/2019 Connect CRS to Classroom MATH.pdf
http://slidepdf.com/reader/full/connect-crs-to-classroom-mathpdf 34/83
30
Table 3: ACT Sample Test Questions by Score RangeProperties of Plane Figures Strand
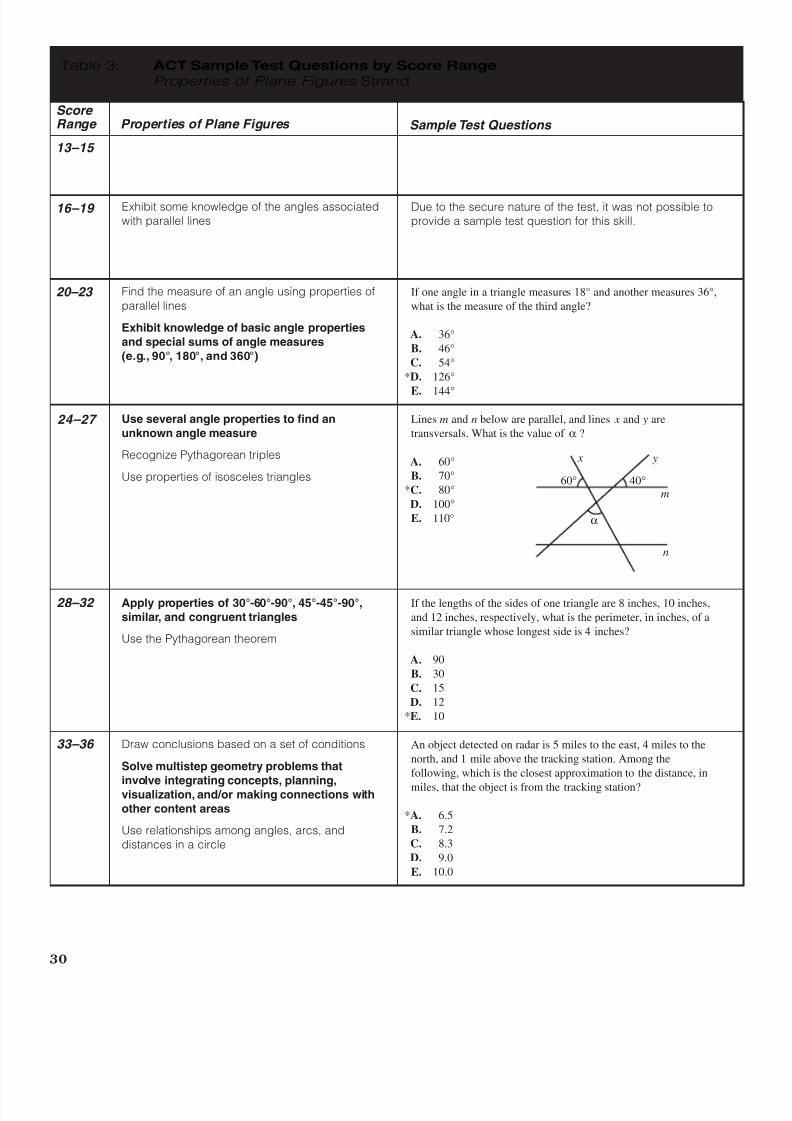
Score Range Properties of Plane Figures
13–15
16–19
20–23
Sample Test Questions
24–27
28–32
33–36
Exhibit some knowledge of the angles associatedwith parallel lines
Find the measure of an angle using properties of
parallel lines
Exhibit knowledge of basic angle properties
and special sums of angle measures
(e.g., 90°, 180°, and 360°)
Use several angle properties to find an
unknown angle measure
Recognize Pythagorean triples
Use properties of isosceles triangles
Apply properties of 30°-60°-90°, 45°-45°-90°,
similar, and congruent triangles
Use the Pythagorean theorem
Draw conclusions based on a set of conditions
Solve multistep geometry problems that
involve integrating concepts, planning,visualization, and/or making connections with
other content areas
Use relationships among angles, arcs, anddistances in a circle
Due to the secure nature of the test, it was not possible toprovide a sample test question for this skill.
If one angle in a triangle measures 18° and another measures 36°,
what is the measure of the third angle?
A. 36°
B. 46°
C. 54°
*D. 126°
E. 144°
Lines m and n below are parallel, and lines x and y are
transversals. What is the value of α ?
A. 60°
B. 70°
*C. 80°
D. 100°
E. 110°
If the lengths of the sides of one triangle are 8 inches, 10 inches,
and 12 inches, respectively, what is the perimeter, in inches, of a
similar triangle whose longest side is 4 inches?
A. 90
B. 30
C. 15
D. 12
*E. 10
An object detected on radar is 5 miles to the east, 4 miles to the
north, and 1 mile above the tracking station. Among the
following, which is the closest approximation to the distance, in
miles, that the object is from the tracking station?
*A. 6.5
B. 7.2
C. 8.3
D. 9.0
E. 10.0
x y
α
40°60°m
n

8/20/2019 Connect CRS to Classroom MATH.pdf
http://slidepdf.com/reader/full/connect-crs-to-classroom-mathpdf 35/83
31
Table 3: ACT Sample Test Questions by Score RangeMeasurement Strand
Score Range Measurement
13–15
16–19
20–23
Sample Test Questions
24–27
Estimate or calculate the length of a line segmentbased on other lengths given on a geometricfigure
Compute the perimeter of polygons when all
side lengths are given
Compute the area of rectangles when wholenumber dimensions are given
Compute the area and perimeter of triangles
and rectangles in simple problems
Use geometric formulas when all necessary
information is given
Compute the area of triangles and rectangleswhen one or more additional simple steps arerequired
Compute the area and circumference of circlesafter identifying necessary information
Compute the perimeter of simple composite
geometric figures with unknown side lengths
In the figure below, the lengths of line segments are given in feet.
If BC ___
is parallel to DE ___
, how many feet long is AE ___
?
A. 2 21
B. 2
*C. 3
D. 6
E. 12
The out-of-bounds lines around a basketball court in Central Park
need to be repainted. The court is a rectangle 90 feet long and
50 feet wide. What is its perimeter, in feet?
A. 140
B. 190
C. 230
*D. 280
E. 4,500
In the triangle below, ∠ R is a right angle and the lengths of the
sides are as marked. In square inches, what is the area of RST ?
A.60*B. 120
C. 130
D. 240
E. 312
How many feet long is the perimeter of the figure sketched
below?
A. 12B. 14
C. 15
*D. 16
E. 18
2__3
2__5
4
A
8
6
D
C
E
B
10
3 ft
5 ft
3 ft
1 ft
26 inches
R
S
T
24 inches
10 inches
8/20/2019 Connect CRS to Classroom MATH.pdf
http://slidepdf.com/reader/full/connect-crs-to-classroom-mathpdf 36/83
32
Table 3: ACT Sample Test Questions by Score RangeMeasurement Strand
Score Range Measurement
28–32
33–36
Sample Test Questions
Use relationships involving area, perimeter, andvolume of geometric figures to compute anothermeasure
Use scale factors to determine the magnitude
of a size change
Compute the area of composite geometric figures
when planning or visualization is required
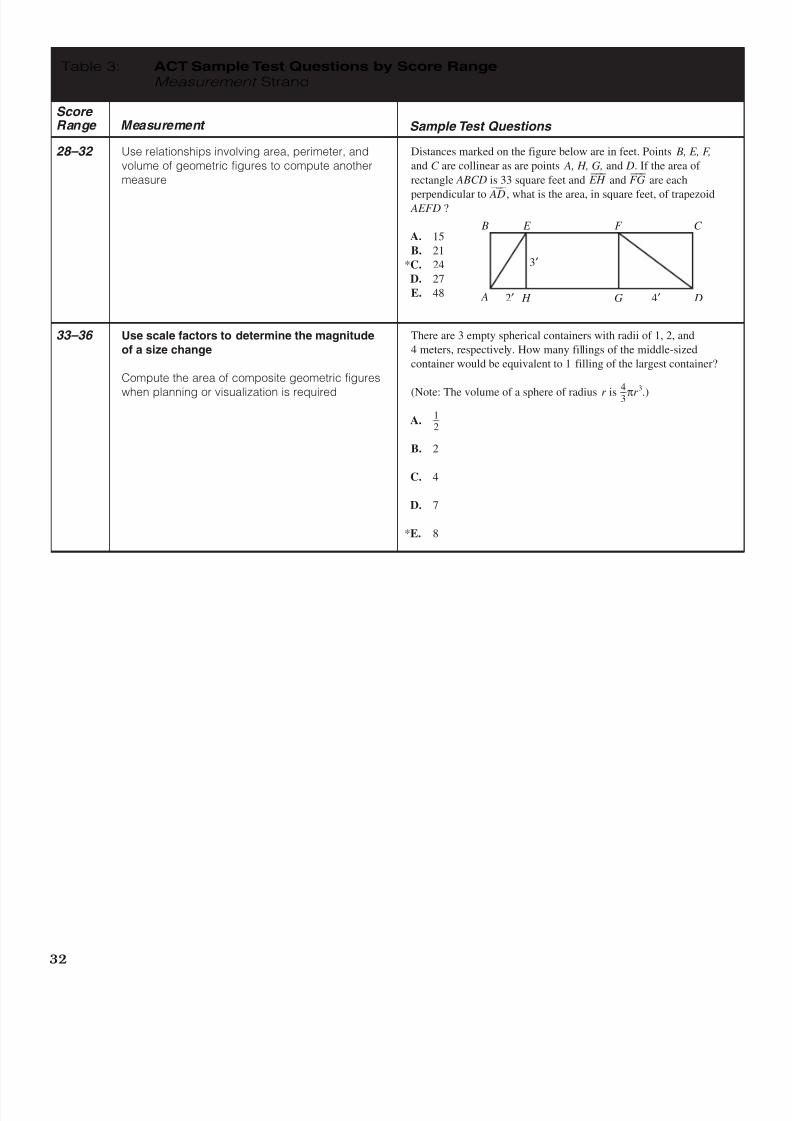
Distances marked on the figure below are in feet. Points B, E, F,
and C are collinear as are points A, H, G, and D. If the area of
rectangle ABCD is 33 square feet and EH ___
and FG___
are each
perpendicular to AD
___
, what is the area, in square feet, of trapezoid AEFD ?
A. 15
B. 21
*C. 24
D. 27
E. 48
There are 3 empty spherical containers with radii of 1, 2, and
4 meters, respectively. How many fillings of the middle-sized
container would be equivalent to 1 filling of the largest container?
(Note: The volume of a sphere of radius r is πr 3
.)
A.
B. 2
C. 4
D. 7
*E. 8
1__2
4__3
C B
4′ A D
F
G
E
H 2′
3′
8/20/2019 Connect CRS to Classroom MATH.pdf
http://slidepdf.com/reader/full/connect-crs-to-classroom-mathpdf 37/83
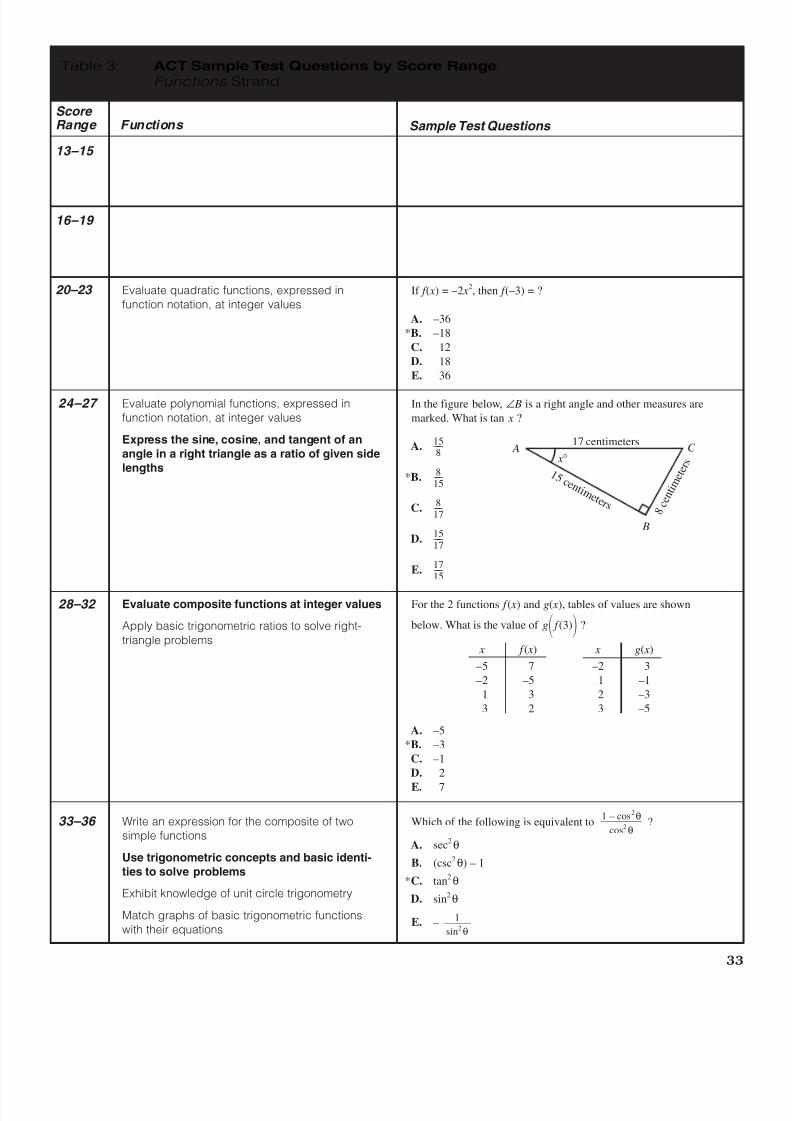
Table 3: ACT Sample Test Questions by Score RangeFunctions Strand
Score Range Functions
13–15
16–19
20–23
Sample Test Questions
24–27
28–32
33–36
Evaluate quadratic functions, expressed infunction notation, at integer values
Evaluate polynomial functions, expressed infunction notation, at integer values
Express the sine, cosine, and tangent of an
angle in a right triangle as a ratio of given side
lengths
Evaluate composite functions at integer values
Apply basic trigonometric ratios to solve right-
triangle problems
Write an expression for the composite of twosimple functions
Use trigonometric concepts and basic identi-
ties to solve problems
Exhibit knowledge of unit circle trigonometry
Match graphs of basic trigonometric functionswith their equations
If f ( x ) = –2 x 2, then f (–3) = ?
A. –36
*B. –18
C. 12
D. 18
E. 36
In the figure below, ∠ B is a right angle and other measures are
marked. What is tan x ?
A.
*B.
C.
D.
E.
For the 2 functions f ( x ) and g( x ), tables of values are shown
below. What is the value of g f (3) ?
x f ( x ) x g( x )
–5 7 –2 3
–2 –5 1 –1
1 3 2 –3
3 2 3 –5
A. –5
*B. –3
C. –1
D. 2
E. 7
Which of the following is equivalent to ?
A. sec2θ
B. (csc2θ) – 1
*C. tan2θ
D. sin2θ
E. – 1_____sin2
θ
1 – cos2θ_______
cos2θ
17____15
15____17
8____17
8____15
15____8
x ° A
B
C 17 centimeters
1 5 c e n t i m e t e r s 8
c e n t i m
e t e r s
33

8/20/2019 Connect CRS to Classroom MATH.pdf
http://slidepdf.com/reader/full/connect-crs-to-classroom-mathpdf 38/83
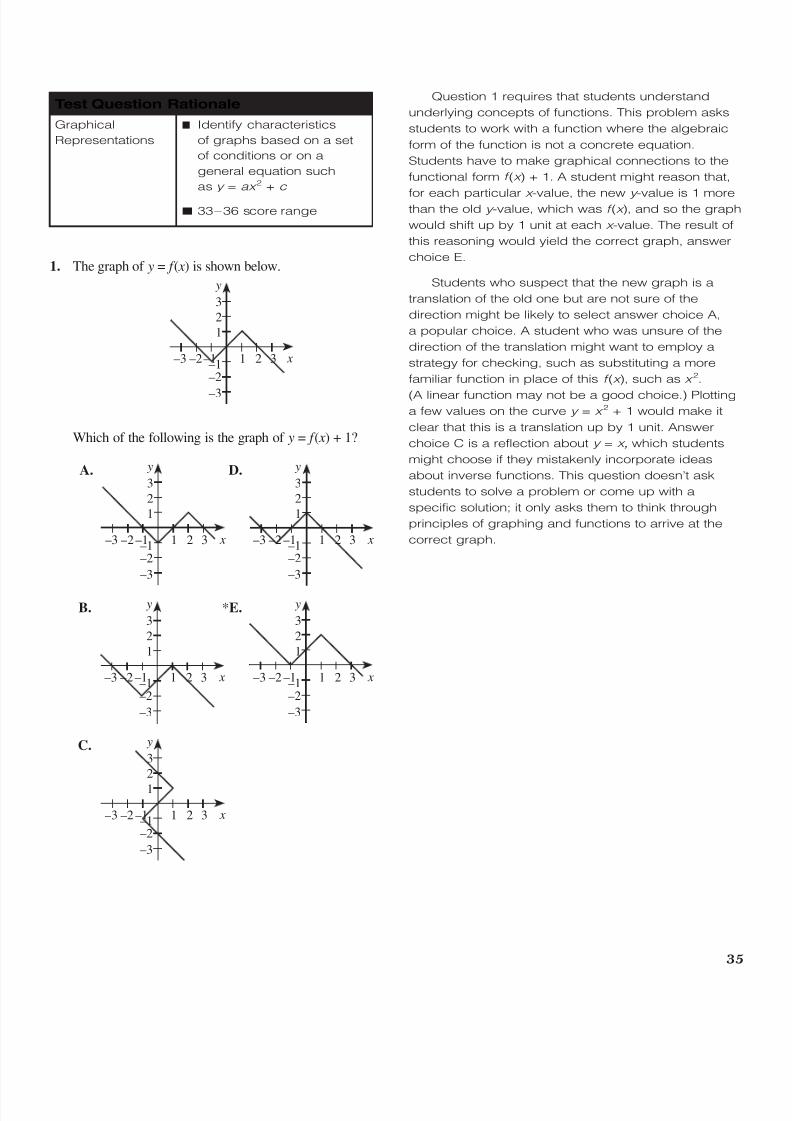
8/20/2019 Connect CRS to Classroom MATH.pdf
http://slidepdf.com/reader/full/connect-crs-to-classroom-mathpdf 39/83
1. The graph of y = f ( x ) is shown below.
Which of the following is the graph of y = f ( x ) + 1?
Question 1 requires that students understand
underlying concepts of functions. This problem asks
students to work with a function where the algebraic
form of the function is not a concrete equation.
Students have to make graphical connections to the
functional form f (x ) + 1. A student might reason that,
for each particular x -value, the new y -value is 1 morethan the old y -value, which was f (x ), and so the graph
would shift up by 1 unit at each x -value. The result of
this reasoning would yield the correct graph, answer
choice E.
Students who suspect that the new graph is a
translation of the old one but are not sure of the
direction might be likely to select answer choice A,
a popular choice. A student who was unsure of the
direction of the translation might want to employ a
strategy for checking, such as substituting a more
familiar function in place of this f (x ), such as x 2.
(A linear function may not be a good choice.) Plotting
a few values on the curve y = x 2 + 1 would make it
clear that this is a translation up by 1 unit. Answer
choice C is a reflection about y = x , which students
might choose if they mistakenly incorporate ideas
about inverse functions. This question doesn’t ask
students to solve a problem or come up with a
specific solution; it only asks them to think through
principles of graphing and functions to arrive at the
correct graph.
■ Identify characteristics
of graphs based on a set
of conditions or on a
general equation such
as y = ax 2 + c
■ 33–36 score range
Graphical
Representations
Test Question Rationale
35
–1
y
x 1–2 2–3
21
3
–3
–1–2
3
A.
B.
C.
D.
*E.
y
x 1–2 2 3–3 –1
21
3
–3
–1–2
y
x 1–2 2 3–3 –1
2
1
3
–3
–1–2
y
x 1–2 2 3–3 –1
21
3
–3
–1–2
y
x 1–2 2 3–3 –1
2
1
3
–3
–1–2
y
x 1–2 2 3–3 –1
2
1
3
–3
–1–2
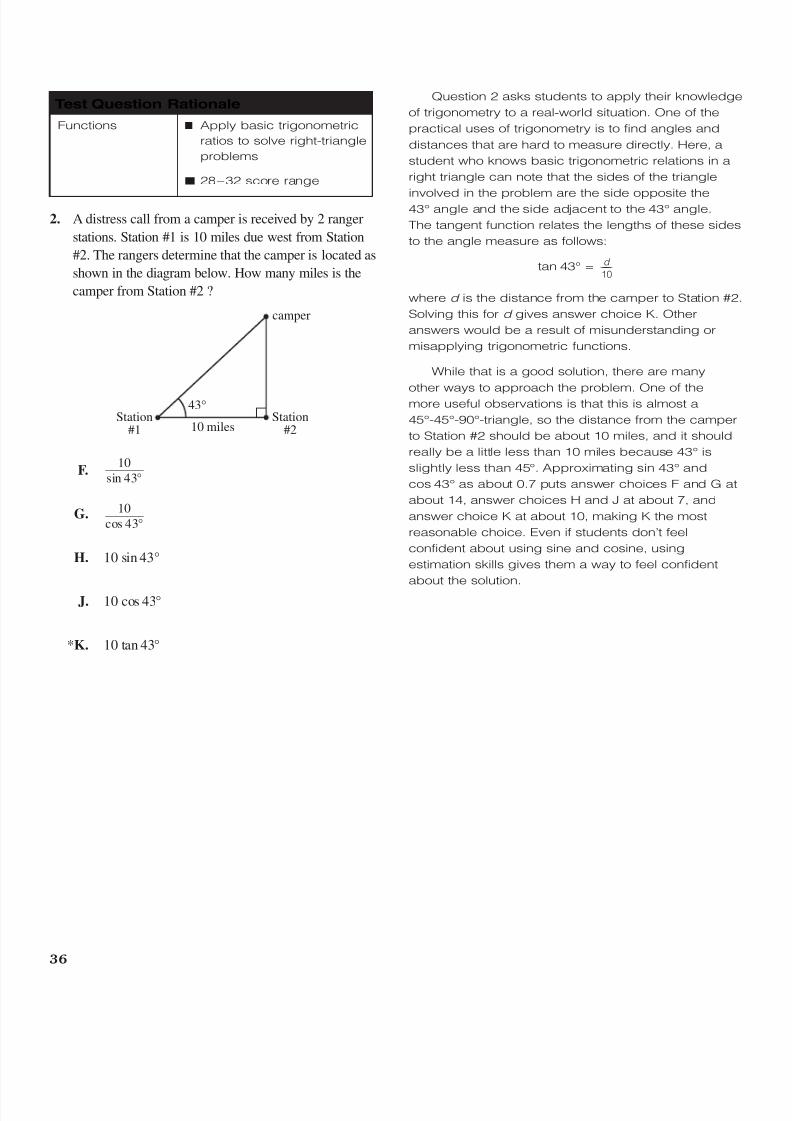
8/20/2019 Connect CRS to Classroom MATH.pdf
http://slidepdf.com/reader/full/connect-crs-to-classroom-mathpdf 40/83
36
2. A distress call from a camper is received by 2 ranger
stations. Station #1 is 10 miles due west from Station
#2. The rangers determine that the camper is located as
shown in the diagram below. How many miles is the
camper from Station #2 ?
F.
G.
H. 10 sin 43°
J. 10 cos 43°
*K. 10 tan 43°
Question 2 asks students to apply their knowledge
of trigonometry to a real-world situation. One of the
practical uses of trigonometry is to find angles and
distances that are hard to measure directly. Here, a
student who knows basic trigonometric relations in a
right triangle can note that the sides of the triangle
involved in the problem are the side opposite the43° angle and the side adjacent to the 43° angle.
The tangent function relates the lengths of these sides
to the angle measure as follows:
tan 43° =
where d is the distance from the camper to Station #2
Solving this for d gives answer choice K. Other
answers would be a result of misunderstanding or
misapplying trigonometric functions.
While that is a good solution, there are many
other ways to approach the problem. One of themore useful observations is that this is almost a
45°-45°-90°-triangle, so the distance from the camper
to Station #2 should be about 10 miles, and it should
really be a little less than 10 miles because 43° is
slightly less than 45°. Approximating sin 43° and
cos 43° as about 0.7 puts answer choices F and G at
about 14, answer choices H and J at about 7, and
answer choice K at about 10, making K the most
reasonable choice. Even if students don’t feel
confident about using sine and cosine, using
estimation skills gives them a way to feel confident
about the solution.
d ______10
10_______cos 43°
10_______sin 43°
■ Apply basic trigonometric
ratios to solve right-triangle
problems
■ 28–32 score range
Functions
Test Question Rationale
43°
10 miles
camper
Station#1
Station#2

8/20/2019 Connect CRS to Classroom MATH.pdf
http://slidepdf.com/reader/full/connect-crs-to-classroom-mathpdf 41/83
37
WHY IS IT IMPORTANT TO LINK
ASSESSMENT WITH INSTRUCTION?
Assessment provides feedback to the learner and
the teacher. It bridges the gap between expectations
and reality. Assessment can gauge the learners’
readiness to extend their knowledge in a given area,
measure knowledge gains, identify needs, and
determine the learners’ ability to transfer what was
learned to a new setting.
When teachers use assessment tools to gather
information about their students, then modify
instruction accordingly, the assessment process
becomes an integral part of teaching and learning.
Using assessment to inform instruction can help
teachers create a successful learning environment.
Students can use assessment as a tool to help
them revise and rethink their work, to help integrate
prior knowledge with new learning, and to apply their
knowledge to new situations. Connecting assessment
to classroom instruction can help both teachers and
students take charge of thinking and learning.
As teachers review student performances on
various measures, they can reexamine how to help
students learn. As Peter Airasian, the author of
Classroom Assessment, says, “Assessment is not an
end in itself, but a means to another end, namely,
good decision making” (p. 19). Linking assessment
and instruction prompts both teachers and students to
take on new roles and responsibilities. Through
reflecting together on their learning, students and
teachers can reevaluate their goals and embark on a
process of continuous growth.
ARE YOUR STUDENTS DEVELOPING
THE NECESSARY SKILLS?Many high schools monitor the effectiveness of
their educational program by tracking the success of
their graduates after they leave high school. Some of
the criteria by which schools measure success are the
number of graduates who enroll in postsecondary
institutions, the courses into which those students are
placed, and the attrition rate of those students.
Because many colleges use ACT scores as one
piece of information in making decisions about
admissions and course placement, high schools can
use students’ ACT scores as they review their schoolsperformance. It is important to tie all the assessment
information you gather to the goals of your
mathematics program and to discuss how these goals
are aligned with information about postsecondary
institutions. With an ever-increasing number of high
school graduates entering college, it becomes the
school’s responsibility to ensure that its graduates
have mastered the prerequisite skills necessary for
success in entry-level courses. ACT’s Educational
Planning and Assessment System (EPAS), of which
EXPLORE, PLAN, and the ACT are each a part, can
help provide information about students’ level ofknowledge and skills that can be used to guide
students’ secondary school learning experiences.
EXPLORE and PLAN are developmentally and
conceptually linked to the ACT and thus provide a
coherent framework for students and counselors and
a consistent skills focus for teachers from Grades 8
through 12.
THE ASSESSMENT-INSTRUCTION
LINK
“Every objective, every lesson plan,
every classroom activity, and every
assessment method should focus on
helping students achieve those
[significant] outcomes that will help
students both in the classroom and
beyond.”
— Kay Burke, editor of Authentic
Assessment: A Collection

8/20/2019 Connect CRS to Classroom MATH.pdf
http://slidepdf.com/reader/full/connect-crs-to-classroom-mathpdf 42/83
38
As students and others review test scores from
EXPLORE, PLAN, and the ACT, they should be aware
that ACT’s data clearly reveal that students’ ACT test
scores are directly related to preparation for college.
Students who take rigorous high school courses,
which ACT has defined as core college preparatory
courses, achieve much higher test scores thanstudents who do not. ACT has defined core college
preparatory course work as four or more years of
English, and three or more years each of
mathematics, social studies, and natural science.
ACT works with colleges to help them develop
guidelines that place students in courses that are
appropriate for their level of achievement as
measured by the ACT. In doing this work, ACT has
gathered course grade and test score data from a
large number of first-year students across a wide
range of postsecondary institutions. These data
provide an overall measure of what it takes to be
successful in a standard first-year college course.
Data from 98 institutions and over 90,000 students
were used to establish the ACT College Readiness
Benchmark Scores, which are median course
placement scores achieved on the ACT that are
directly reflective of student success in a college
course.
Success is defined as a 50 percent chance that a
student will earn a grade of B or better. The courses
are the ones most commonly taken by first-year
students in the areas of English, mathematics, social
studies, and science, namely English Composition,
College Algebra, an entry-level College Social
Studies/Humanities course, and College Biology. The
ACT scores established as the ACT College
Readiness Benchmark Scores are 18 on the English
Test, 22 on the Mathematics Test, 21 on the Reading
Test, and 24 on the Science Test. The College
Readiness Benchmark Scores were based upon a
sample of postsecondary institutions from across the
United States. The data from these institutions were
weighted to reflect postsecondary institutions
nationally. The Benchmark Scores are median course
placement values for these institutions and as such
represent a typical set of expectations.
College Readiness Benchmark Scores have also
been developed for EXPLORE and for PLAN, to
indicate a student’s probable readiness for college-
level work, in the same courses named above, by the
time the student graduates from high school. The
EXPLORE and PLAN College Readiness Benchmark
Scores were developed using records of students
who had taken EXPLORE, PLAN, and the ACT (four
years of matched data). Using either EXPLORE
subject-area scores or PLAN subject-area scores, we
estimated the conditional probabilities associated with
meeting or exceeding the corresponding ACT
Benchmark Score. Thus, each EXPLORE (1–25) or
PLAN (1–32) score was associated with an estimated
probability of meeting or exceeding the relevant ACT
Benchmark Score. We then identified the EXPLORE
and PLAN scores, at Grades 8, 9, 10, and 11, that
came the closest to a 0.5 probability of meeting or
exceeding the ACT Benchmark Score, by subject
area. These scores were selected as the EXPLORE
and PLAN Benchmark Scores.
All the Benchmark Scores are given in Table 4.
Note that, for example, the first row of the table should
be read as follows: An eighth-grade student who
scores 13, or a ninth-grade student who scores 14,
on the EXPLORE English Test has a 50 percent
probability of scoring 18 on the ACT English Test; and
a tenth-grade student who scores 15, or an eleventh-
grade student who scores 17, on the PLAN English
Test has a 50 percent probability of scoring 18 on the
ACT English Test.
EXPLORE PLAN
Test Score Test Score ACT
Subject Test Grade 8 Grade 9 Grade 10 Grade 11 Test Score
English 13 14 15 17 18
Mathematics 17 18 19 21 22
Reading 15 16 17 19 21
Science 20 20 21 23 24
Table 4: College Readiness Benchmark Scores
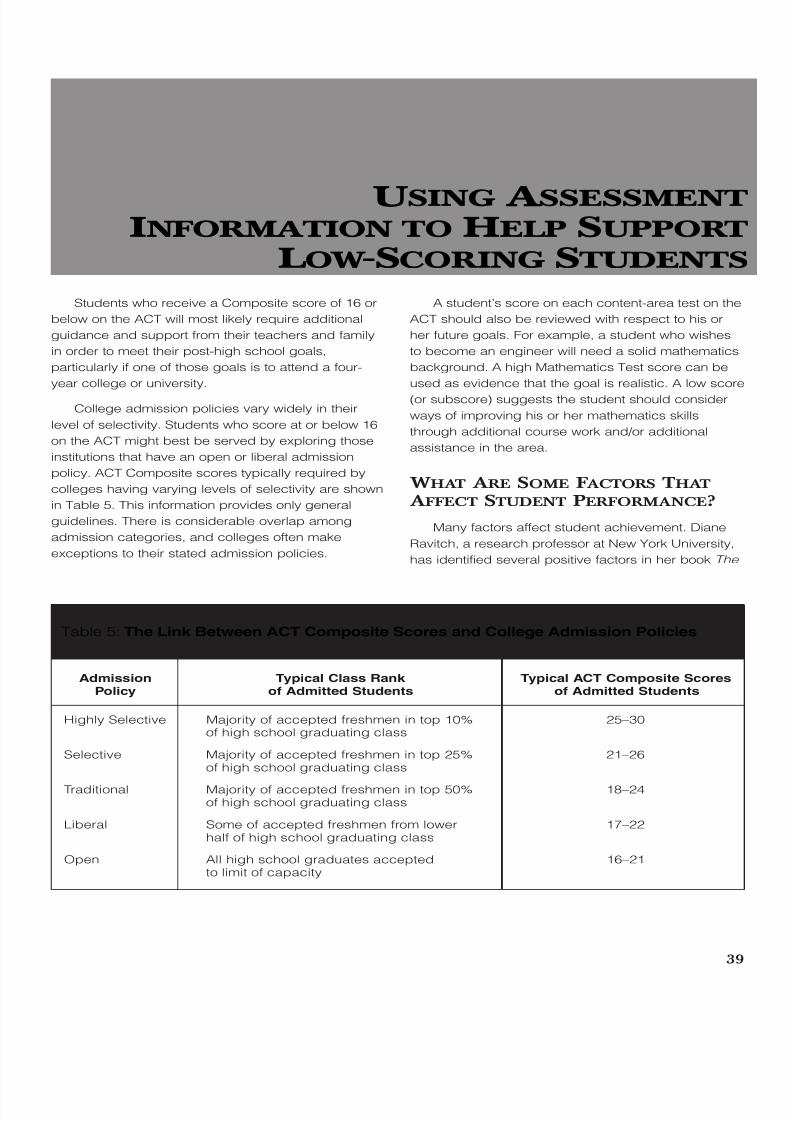
8/20/2019 Connect CRS to Classroom MATH.pdf
http://slidepdf.com/reader/full/connect-crs-to-classroom-mathpdf 43/83
39
U SING ASSESSMENT
INFORMATION TO HELP S UPPORT
LOW-SCORING STUDENTS
Students who receive a Composite score of 16 or
below on the ACT will most likely require additional
guidance and support from their teachers and family
in order to meet their post-high school goals,
particularly if one of those goals is to attend a four-
year college or university.
College admission policies vary widely in their
level of selectivity. Students who score at or below 16
on the ACT might best be served by exploring those
institutions that have an open or liberal admission
policy. ACT Composite scores typically required by
colleges having varying levels of selectivity are shown
in Table 5. This information provides only general
guidelines. There is considerable overlap among
admission categories, and colleges often make
exceptions to their stated admission policies.
A student’s score on each content-area test on the
ACT should also be reviewed with respect to his or
her future goals. For example, a student who wishes
to become an engineer will need a solid mathematics
background. A high Mathematics Test score can be
used as evidence that the goal is realistic. A low score
(or subscore) suggests the student should consider
ways of improving his or her mathematics skills
through additional course work and/or additional
assistance in the area.
WHAT ARE SOME FACTORS THAT
AFFECT STUDENT P ERFORMANCE?
Many factors affect student achievement. Diane
Ravitch, a research professor at New York University,
has identified several positive factors in her book The
Admission Typical Class Rank Typical ACT Composite ScoresPolicy of Admitted Students of Admitted Students
Highly Selective Majority of accepted freshmen in top 10% 25–30of high school graduating class
Selective Majority of accepted freshmen in top 25% 21–26of high school graduating class
Traditional Majority of accepted freshmen in top 50% 18–24of high school graduating class
Liberal Some of accepted freshmen from lower 17–22half of high school graduating class
Open All high school graduates accepted 16–21to limit of capacity
Table 5: The Link Between ACT Composite Scores and College Admission Policies

8/20/2019 Connect CRS to Classroom MATH.pdf
http://slidepdf.com/reader/full/connect-crs-to-classroom-mathpdf 44/83
40
Schools We Deserve: Reflections on the Educational
Crisis of Our Time (1985, pp. 276 and 294). These
factors, which were common to those schools that
were considered effective in teaching students,
include
■ a principal who has a clearly articulated vision for
the school, and the leadership skills to empower
teachers to work toward that vision;
■ a strong, clearly thought-out curriculum in which
knowledge gained in one grade is built upon in
the next;
■ dedicated educators working in their field of
expertise;
■ school-wide commitment to learning, to becoming
a “community of learners”;
■ a blend of students from diverse backgrounds;
■ “high expectations for all” students; and
■ systematic monitoring of student progress through
an assessment system.
There are also factors that have a negative impact
on student achievement. For example, some students
“may not know about, know how, or feel entitled to
take academic advantage of certain opportunities, like
college preparatory courses, college entrance exams,
and extracurricular learning opportunities” (Goodwin,
2000, p. 3).
All students need to be motivated to perform well
academically, and they need informed guidance in
sorting out their educational/career aspirations.
Teachers who challenge their students by providing a
curriculum that is rigorous and relevant to their world
and needs (Brewer, Rees, & Argys, 1995; Gay, 2000),
and who have a degree and certification in the area
in which they teach (Ingersoll, 1998) and ample
opportunities to collaborate with their peers
(McCollum, 2000), are more likely to engender
students’ success in school.
MAKING THE INVISIBLE VISIBLE
Using assessment information, such as ACT’s
Educational Planning and Assessment System
(EPAS), can help bring into view factors that may
affect—either positively or negatively—student
performance. Reviewing and interpreting assessment
information can encourage conversations between
parents and teachers about what is best for students.
Using data is one way of making the assumptions you
have about your students and school, or the needs of
students, visible.
Collecting assessment information in a systematic
way can help teachers in various ways. It can help
teachers see more clearly what is happening in their
classrooms, provide evidence that the method of
teaching they’re using really works, and determine
what is most important to do next. As teachers
become active teacher-researchers, they can gain asense of control and efficacy that contributes to their
sense of accomplishment about what they do each
day.
There are many different types of assessment
information that a school or school district can collect.
Some types yield quantitative data (performance
described in numerical terms), others qualitative data
(performance described in nonnumerical terms, such
as text, audio, video, or photographs, etc.). All types,
when properly analyzed, can yield useful insights into
student learning. For example, schools and teachers
can collect information from
■ standardized tests (norm- or criterion-referenced
tests);
■ performance assessments (such as portfolios,
projects, artifacts, presentations);
■ peer assessments;
■ progress reports (qualitative, quantitative, or both)
on student skills and outcomes;
■ self-reports, logs, journals; and
■ rubrics and rating scales.
Reviewing student learning information in the
context of demographic data may also provide insight
and information about specific groups of students, like
low-scoring students. Schools therefore would benefit
by collecting data about
■ enrollment, mobility, and housing trends;

8/20/2019 Connect CRS to Classroom MATH.pdf
http://slidepdf.com/reader/full/connect-crs-to-classroom-mathpdf 45/83
41
■ staff and student attendance rates and tardiness
rates;
■ dropout, retention, and graduation rates;
■ gender, race, ethnicity, and health;
■ percent of free/reduced lunch and/or public
assistance;
■ level of language proficiency;
■ staff/student ratios;
■ number of courses taught by teachers outside
their endorsed content area;
■ retirement projections and turnover rates; and
■ teaching and student awards.
WHAT DOES IT MEAN TO BE A
LOW-SCORING STUDENT?
Low-achieving students tend to be those students
who score low on standardized tests. Students who
slip behind are the likeliest to drop out and least likely
to overcome social and personal disadvantages.
According to Judson Hixson, a researcher at the
North Central Regional Educational Laboratory
(NCREL), students who are at risk should be
considered in a new light:
Students are placed “at risk” when they
experience a significant mismatch betweentheir circumstances and needs, and the
capacity or willingness of the school to accept,
accommodate, and respond to them in a
manner that supports and enables their
maximum social, emotional, and intellectual
growth and development.
As the degree of mismatch increases, so
does the likelihood that they will fail to either
complete their elementary and secondary
education, or more importantly, to benefit from
it in a manner that ensures they have the
knowledge, skills, and dispositions necessary
to be successful in the next stage of their
lives—that is, to successfully pursue post-
secondary education, training, or meaningful
employment and to participate in, and
contribute to, the social, economic, and
political life of their community and society
as a whole.
The focus of our efforts, therefore, should be
on enhancing our institutional and professional
capacity and responsiveness, rather than cat-
egorizing and penalizing
students for simply being who they are.
(Hixson, 1993, p. 2)
Hixson’s views reveal the necessity of looking at al
the variables that could affect students’ performance,
not just focusing on the students themselves.
Low-achieving students may demonstrate some of
the following characteristics:
■ difficulty with the volume of work to be completed;
■ low reading and writing skills;
■ low motivation;
■ low self-esteem;
■ poor study habits;
■ lack of concentration;
■ reluctance to ask for help with tasks/assignments;
and
■ test anxiety.
Many of these characteristics are interconnected.
A low-scoring student cannot do the volume of work a
successful student can do if it takes a much longer
time to decipher text passages because of low
reading skills. There is also the issue of intrinsic
motivation in that students have little desire to keep
trying to succeed if they habitually do not experience
success.
But again, we must not focus only on the students
themselves, but also consider other variables that
could affect their academic performance, such as
■ job or home responsibilities that take time away
from school responsibilities;
■ parental attitude toward and involvement in
students’ school success;
■ students’ relationships with their peers;
■ lack of opportunities to engage in complex
problems that are meaningful to students; and
■ lack of adequate support and resources.
For example, some students who score low on
tests are never introduced to a curriculum that
8/20/2019 Connect CRS to Classroom MATH.pdf
http://slidepdf.com/reader/full/connect-crs-to-classroom-mathpdf 46/83
42
challenges them or that addresses their particular
needs: “Much of the student stratification within aca-
demic courses reflects the social and economic strati-
fication of society. Schools using tracking systems or
other methods that ultimately place low-income and
marginal students in lower-level academic courses
are not adequately preparing them to plan forpostsecondary education, succeed in college, and
prepare for lifelong learning” (Noeth & Wimberly,
2002, p. 18).
As Barbara Means and Michael Knapp have
suggested, many schools need to reconstruct their
curricula, employing instructional strategies that help
students to understand how experts think through
problems or tasks, to discover multiple ways to solve
a problem, to complete complex tasks by receiving
support (e.g., cues, modifications), and to engage
actively in classroom discussions (1991).
Many individuals and organizations are interested
in helping students succeed in the classroom and in
the future. For example, the Network for Equity in
Student Achievement (NESA), a group of large urban
school systems, and the Minority Student
Achievement Network (MSAN), a group of school
districts in diverse suburban areas and small cities,
are organizations that are dedicated to initiating
strategies that will close the achievement gap among
groups of students. Many schools and districts have
found participation in such consortia to be helpful.
According to Michael Sadowski, editor of theHarvard Education Letter, administrators and teachers
who are frustrated by persistent achievement gaps
within their school districts “have started to look for
answers within the walls of their own schools. They’re
studying school records, disaggregating test score
and grade data, interviewing students and teachers,
administrating questionnaires—essentially becoming
researchers—to identify exactly where problems exist
and to design solutions” (Sadowski, 2001, p. 1).
A student may get a low score on a standardized
test for any of a number of reasons. To reduce the
probability of that outcome, the following pages
provide some suggestions about what educators and
students can do before students’ achievement is
assessed on standardized tests like the ACT.
WHAT CAN EDUCATORS AND
STUDENTS DO BEFORE STUDENTS
TAKE THE ACT?
Integrate assessment and instruction. Because
the ACT is curriculum based, the most important
prerequisite for optimum performance on the test is asound, comprehensive educational program. This
“preparation” begins long before any test date. Judith
Langer, the director of the National Research Center
on English Learning and Achievement, conducted a
five-year study that compared the English programs
of typical schools to those that get outstanding results
Schools with economically disadvantaged and
diverse student populations in California, Florida, New
York, and Texas predominated the study. Langer’s
study revealed that in higher performing schools “test
preparation has been integrated into the class time,
as part of the ongoing English language arts learning
goals.” This means that teachers discuss the
demands of high-stakes tests and how they “relate to
district and state standards and expectations as well
as to their curriculum” (Langer, Close, Angelis, &
Preller, 2000, p. 6).
Emphasize core courses. ACT research
conducted in urban schools both in 1998 and 1999
shows that urban school students can substantially
improve their readiness for college by taking a
tougher sequence of core academic courses in high
school. Urban students taking a more rigorous
sequence of courses in mathematics and science andfinding success in those courses score at or above
national averages on the ACT. Regardless of gender,
ethnicity, or family income, those students who elect to
take four or more years of rigorous English courses
and three or more years of rigorous course work in
mathematics, science, and social studies earn higher
ACT scores and are more successful in college than
those who have not taken those courses (ACT &
Council of Great City Schools, 1999). Subsequent
research has substantiated these findings and
confirmed the value of rigor in the core courses
(ACT, 2004; ACT & The Education Trust, 2004).
Teach test-taking strategies. Students may be
helped by being taught specific test-taking strategies,
such as the following:
■ Learn to pace yourself.
■ Know the directions and understand the answer
sheet.
8/20/2019 Connect CRS to Classroom MATH.pdf
http://slidepdf.com/reader/full/connect-crs-to-classroom-mathpdf 47/83
43
■ Read carefully and thoroughly.
■ Answer easier questions first; skip harder
questions and return to them later.
■ Review answers and check work, if time allows.
■ Mark the answer sheet quickly and neatly; avoid
erasure marks on the answer sheet.
■ Answer every question (you are not penalized for
guessing on the ACT).
■ Become familiar with test administration
procedures.
■ Read all the answer choices before you decide
which is the correct answer.
Students are more likely to perform at their best
on a test if they are comfortable with the test format,
know appropriate test-taking strategies, and are
aware of the test administration procedures. Test
preparation activities that help students perform better
in the short term will be helpful to those students who
have little experience taking standardized tests or who
are unfamiliar with the format of the ACT.
Search out other sources of help. School
personnel in urban or high-poverty middle schools
can investigate programs such as GEAR-UP, which
“provides federal funds for schools to prepare
low-income middle school students for high school
and college preparation through multiple school
reform efforts. School districts, colleges, communityorganizations, and businesses often form partnerships
to provide teachers with enhanced professional
development opportunities to ensure they have the
necessary tools and strategies to teach middle school
and high school effectively” (Noeth & Wimberly,
2002, p. 18).
WHAT DO THE ACT MATHEMATICS
TEST R ESULTS INDICATE ABOUT
LOW-SCORING STUDENTS?
Students who score below 16 on the ACTMathematics Test are likely to have some or all of the
knowledge and skills described in the ACT
Mathematics College Readiness Standards for the
13–15 range. In fact, they may well have some of the
skills listed in the 16–19 range. However, these
students need to become more consistent in
demonstrating these skills in a variety of contexts or
situations.
The EPAS Mathematics College Readiness
Standards indicate that students who score below 16
tend to be able to
■ Perform one-operation computation with whole
numbers and decimals
■ Solve problems in one or two steps using wholenumbers
■ Perform common conversions (e.g., inches to feet
or hours to minutes)
■ Calculate the average of a list of positive whole
numbers
■ Perform a single computation using information
from a table or chart
■ Recognize equivalent fractions and fractions in
lowest terms
■ Exhibit knowledge of basic expressions
(e.g., identify an expression for a total as b + g )
■ Solve equations in the form x + a = b, where a
and b are whole numbers or decimals
■ Identify the location of a point with a positive
coordinate on the number line
■ Estimate or calculate the length of a line segment
based on other lengths given on a geometric
figure
In sum, these students typically show skill workingprimarily with whole numbers and decimals, whether
they are looking at data, solving equations, or dealing
with measuring geometric figures. These students will
likely benefit from encouragement in performing
calculations and solving equations involving rational
numbers; in extending their knowledge of graphing to
the coordinate plane; in becoming more comfortable
with the basic concepts of probability, statistics, and
data analysis through real-world problems; and in
extending measurement concepts to include
perimeter and area for a variety of geometric figures.
WHAT DOES R ESEARCH SAY ABOUT
HOW MATHEMATICS INSTRUCTION
SHOULD BE CONDUCTED?
Research suggests that learning is maximized
when students take a demanding core curriculum and
engage in rigorous learning activities. The core
curriculum must be embedded in a learning

8/20/2019 Connect CRS to Classroom MATH.pdf
http://slidepdf.com/reader/full/connect-crs-to-classroom-mathpdf 48/83
44
environment where students are motivated to work
hard. To be motivated, students need to see the
relevance of their schoolwork (LaPoint, Jordan,
McPartland, & Towns, 1996). Research also suggests
that framing learning and performance tasks within
contexts that are familiar cultural experiences may
improve students’ cognitive functioning andconsequently their achievement (Boykin & Bailey,
2000).
National Council of Teachers of Mathematics
(NCTM) recommendations for change in mathematics
education call for teachers to use a wide range of
instructional strategies:
A variety of instructional methods should
be used in classrooms to cultivate students’
abilities to investigate, make sense of, and
construct meanings from new situations; to
make and provide arguments for conjectures;and to use a flexible set of strategies to solve
problems from both within and outside
mathematics. In addition to traditional teacher
demonstrations and teacher-led discussions,
greater opportunities should be provided for
small-group work, individual explorations, peer
instruction, and whole-class discussions in
which the teacher serves as a moderator.
(NCTM, 1989, pp. 125, 128)
WHAT CAN BE DONE TO HELP
STUDENTS UNDERSTAND THE
MATHEMATICAL SITUATIONS THEY
ENCOUNTER ?
Students need to see how mathematics crosses
into other disciplines and is used in real life, not just
as isolated pieces of information to be used only in
mathematics class. Today’s mathematics instruction
should not be just about memorization, though some
things like the basic facts of arithmetic need to be
internalized to the point of automatic recall. The
memorization-and-drill approach does not provide anin-depth understanding of those mathematical
concepts required to build a strong foundation in
math, nor does the lecture method.
The “scaffolding” method, in which the teacher
sets up interactive learning activities at increasingly
challenging levels as students progress toward
mastery of a concept, can be used as an alternative
to drills and lecture. The learning activities can be
organized so that the students are interacting with the
teacher or with their peers. The teacher needs to
monitor group discussions and guide the students as
they use strategies of questioning, summarizing,
clarifying, and predicting to achieve comprehension
of the major concept(s) being taught. For example, ateacher could increase the level of difficulty in the
Algebraic Equations instructional activity on
pages 58–61 by using a larger coefficient of the
variable so that students would have to think more
about how to sort and group the equations. Another
idea using this same activity would be to have those
students who have internalized how to solve algebraic
equations work with others who still need assistance,
by playing a game of “concentration.” The teacher
could make a set of cards with simple one-step
equations and their solutions and have the students
pair a one-step equation with the correct solution as a
“match.” The level of difficulty for the game could be
increased by making another set of cards that include
a variety of one- and two-step equations. Each
student takes a turn selecting cards until he/she gets
a matched pair (one-step equations) or matched
group (two-step equations). Play would continue until
all of the cards were selected, and a player’s standing
within the group could be calculated by assigning
points for each “match.” Matched groups that involve
two steps for their solution could be worth more
points.
Mathematics study should include investigation ofpatterns in numbers, shapes, data, probability, and
growth/decay, along with practice in communicating
mathematically. Students should also be encouraged
to guess:
Part of developing student confidence is the
realization that guessing plays an important
role in learning mathematics. Even so,
students must learn that the guesses must be
tempered by validation and attempts to
structure an explanation as to why the guess
is an appropriate response to the situation at
hand. Developing the ability to conjecture,
test, revise, and reconjecture is an important
step toward thinking mathematically.
(Association for Supervision and Curriculum
Development [ASCD], 1999, p. 9)
Today, mathematics requires students to move
beyond memorization and drill and to develop
skills that include problem solving, reasoning,
8/20/2019 Connect CRS to Classroom MATH.pdf
http://slidepdf.com/reader/full/connect-crs-to-classroom-mathpdf 49/83
45
representation, and communication. Students need to
be able to visualize and make connections between
the various branches of mathematics and between
mathematics and other content areas. Students might
need to solve a probability problem geometrically by
using coordinates from a Cartesian plane, or to use
their knowledge of number concepts, properties, andtheorems (such as exponentiation, root extraction, and
the Pythagorean theorem) along with their algebraic
manipulation skills to solve a measurement problem
involving perimeter, area, or volume of a composite
geometric figure. Teachers need to guide their
students through activities such as small-group work,
individual explorations, use of technology, peer
instruction, and math logs/journals so that the
students have the opportunity to develop reasoning
and problem-solving skills—skills they’ll need to use
when confronted with purely mathematical problems
and in real-world situations with connections to other
content areas.
Teachers also need to help students understand
difficult or abstract concepts by using real-life
examples to make the concepts more concrete. For
example, the order of operations to solve two-step
algebra equations could be reinforced using shoes
and socks. When students get dressed they put on
socks first, then shoes; but when they want to
undress, they do the reverse: they remove instead of
put on, removing their shoes first and socks second.
In analyzing the equation 2x + 3 = 10, the order of
operations is to multiply x by 2 and then add 3. Tosolve the equation, the inverse operations are used in
the reverse order: subtract 3 and then divide by 2.
Analyze the equation → get dressed
Multiply x by 2 → put on socks
Add 3 → put on shoes
Solve the equation → get undressed
Subtract 3 → take off shoes
Divide by 2 → take off socks
By connecting the abstract to the concrete as in the
shoes and socks example, the teacher can reinforcemathematical concepts by relating them to situations
in everyday life.
WHAT K NOWLEDGE AND SKILLS
ARE LOW-SCORING STUDENTS
R EADY TO LEARN?
For students who score below 16 on the ACT
Mathematics Test, their target achievement outcomes
could be the College Readiness Standards listed inthe 16–19 range:
■ Solve routine one-step arithmetic problems (using
whole numbers, fractions, and decimals) such as
single-step percent
■ Solve some routine two-step arithmetic problems
■ Calculate the average of a list of numbers
■ Calculate the average, given the number of data
values and the sum of the data values
■ Read tables and graphs
■ Perform computations on data from tables and
graphs
■ Use the relationship between the probability of an
event and the probability of its complement
■ Recognize one-digit factors of a number
■ Identify a digit’s place value
■ Substitute whole numbers for unknown quantities
to evaluate expressions
■Solve one-step equations having integer ordecimal answers
■ Combine like terms (e.g., 2x + 5x )
■ Locate points on the number line and in the first
quadrant
■ Exhibit some knowledge of the angles associated
with parallel lines
■ Compute the perimeter of polygons when all side
lengths are given
■ Compute the area of rectangles when whole
number dimensions are given
By no means should these be seen as limiting or
exclusive goals. As stated earlier, it is important to use
multiple sources of information to make instructional
decisions and to recognize that individual students
learn at different rates and in different sequences.
What’s important is to get students communicating
mathematically.
8/20/2019 Connect CRS to Classroom MATH.pdf
http://slidepdf.com/reader/full/connect-crs-to-classroom-mathpdf 50/83
46
WHAT STRATEGIES/MATERIALS CAN
TEACHERS USE IN THEIR
CLASSROOMS?
According to Bryan Goodwin, senior program
associate at the Mid-continent Research Education
Laboratory (McREL), “it is important to note thatimproving the performance of disenfranchised
students does not mean ignoring other students.
Indeed, many of the changes advocated—such as
making curricula more rigorous and creating smaller
school units—will benefit all students” (Goodwin,
2000, p. 6). Means and Knapp (1991) express a
similar view:
A fundamental assumption underlying much of
the curriculum in America’s schools is that certain
skills are “basic” and must be mastered before
students receive instruction on more “advanced”
skills, such as reading comprehension, written
composition, and mathematical reasoning. . . .
Research from cognitive science questions this
assumption and leads to a quite different view of
children’s learning and appropriate instruction. By
discarding assumptions about skill hierarchies
and attempting to understand children’s
competencies as constructed and evolving both
inside and outside of school, researchers are
developing models of intervention that start with
what children know and provide access to
explicit models of thinking in areas that
traditionally have been termed “advanced”or “higher order.” (p. 1)
Pages 48–61 exemplify the kind of teacher-
developed activities that could be used in a
classroom for all students, not just those who have
scored low on a standardized assessment like the
ACT. The first activity, which has two parts, has
students perform routine one-operation computation
with whole numbers and decimals as they look forpatterns. The students are then asked to draw a
conclusion about or describe the pattern(s) they
discovered. Two Student Activity Sheets and two
Rating Scale Checklists are included that could be
used by the teacher to assess student learning. Also
included is a Math Journal Checklist that could be
used either by the teacher or student to evaluate
entries in a math journal. The second activity focuses
on solving algebraic equations. Students are asked to
identify and explain/justify the proper sequence of
steps leading to the solution for each equation
included in their group’s assigned envelope. A simple
Algebraic Scoring Rubric is included, along with a
Group Questionnaire and suggestions for other types
of assessments that could be used to evaluate the
students’ learning. Both sets of activities provide
suggestions for related investigations that would
enable the teacher to extend and build on the original
ideas in order to reinforce and strengthen student
learning.

8/20/2019 Connect CRS to Classroom MATH.pdf
http://slidepdf.com/reader/full/connect-crs-to-classroom-mathpdf 51/83
47
HOW ARE THE ACTIVITIES
ORGANIZED?
For each activity, the primary strand or strands are
displayed across the top of the page. (The strand
name “Probability, Statistics, & Data Analysis” is
abbreviated “Data Analysis.”) Next is a box thatcontains Guiding Principles —statements about
instruction, assessment, thinking skills, student
learning, and other educationally relevant topics.
(The bibliography at the end of this guide includes the
source for each statement referenced.) Following the
Guiding Principles box is the title of the activity,
followed by the relevant College Readiness
Standards, then the Description of the Instructional
Activity. Each description is followed by Suggestions
for Assessment, the applicable Ideas for Progress,
and Suggested Strategies/Activities.
■ The College Readiness Standards section lists theskill statements tied directly to the strand or
strands that will be focused on in the activity.
■ The Description of the Instructional Activity section
provides suggestions for engaging students in the
activity, and, where applicable, gives a list of
related topics or tasks. The activities address a
range of objectives and modes of instruction,
but they emphasize providing students with
experiences that focus on reasoning and making
connections, use community resources and real-
life learning techniques, and encourage students
to ask questions—questions leading to analysis,
reflection, and further study and to individual
construction of meanings and interpretations.
■ The Suggestions for Assessment section offers
ideas for documenting and recording students’
learning during an instructional activity.
■ The Ideas for Progress section providesstatements that suggest learning experiences
that are connected to the Suggested
Strategies/Activities.
■ The Suggested Strategies/Activities section
provides an elaboration on the central activity or
ideas for investigating related topics or issues.
The suggestions are connected to one or more
ideas for progress.
These teacher-developed activities provide
suggestions, not prescriptions. You are the best judge
of what is necessary and relevant for your students.Therefore, we encourage you to review the activities,
modifying and using those suggestions that apply,
and disregarding those that are not appropriate for
your students. As you select, modify, and revise the
activities, you can be guided by the statements that
appear in the Guiding Principles box at the beginning
of each activity.

8/20/2019 Connect CRS to Classroom MATH.pdf
http://slidepdf.com/reader/full/connect-crs-to-classroom-mathpdf 52/83
48
R ECOGNIZING P ATTERNS
College Readiness Standards
■ Exhibit knowledge of elementary number
concepts including rounding, the ordering of
decimals, pattern identification, absolute value,
primes, and greatest common factor
■ Perform one-operation computation with whole
numbers and decimals
■ Solve routine one-step arithmetic problems
(using whole numbers, fractions, and decimals)
such as single-step percent
Description of the Instructional Activity
Students need opportunities to explore basic
operations and applications by performing a series of
activities that lead them to recognize patterns. Many
such activities are available to teachers. Here are two
examples of repetitive, pattern-developing activities
that could be used with students who struggle with
the basic concepts (adapted from materials created
by Marilyn Stor, educational consultant for Alameda
High School, Jefferson County, Colorado, 2001).
Activity A: Fraction Patterns
Give each student a Looking for Patterns
worksheet (see pages 51–52). Have students
complete the first column by converting the fraction to
a decimal. Give them an opportunity to experience
some success by allowing them to complete the
fraction conversions they already know. Each student
can then pair with another student to finish converting
the remaining fractions to decimals. Next have them
convert each decimal to a percent. As the students fill
in the decimal columns they should begin to discover
patterns. For example, in the fraction group with a
denominator of 9, the fraction 1/9 becomes a decimal
of .111…, the fraction 2/9 becomes a decimal
of .222…, and students can start to see a pattern
that 3/9 would be .333…. Again, it is the patterns that
you are trying to help them recognize. Give them
ample time to complete the entire sheet. Ideally, theyshould complete this activity without using a
calculator.
Guiding Principles
■ “The need to understand and be able to
use mathematics in everyday life and in the
workplace has never been greater and will
continue to increase.” (National Council of
Teachers of Mathematics [NCTM], 2000, p. 4)
■ “Students learn to communicate in a variety
of ways by actively relating physical
materials, pictures, and diagrams to
mathematical ideas, by reflecting upon and
clarifying their own thinking, by relating
everyday language to mathematical ideas
and symbols, and by discussing
mathematical ideas with peers.”
(Zemelman, Daniels, & Hyde, 1993, p. 75)
■ “To ensure deep, high-quality learning for all
students, assessment and instruction must
be integrated so that assessment becomes
a routine part of the ongoing classroom
activity rather than an interruption.”
(NCTM, 2000, p. 23)
Linking Instruction and AssessmentStrands: Numbers: Concepts and Properties; Basic Operations & Applications

8/20/2019 Connect CRS to Classroom MATH.pdf
http://slidepdf.com/reader/full/connect-crs-to-classroom-mathpdf 53/83
49
Activity B: Rule of 70
This activity also allows students to develop a
mathematical concept by recognizing patterns. The
activity relates to compound interest in a very
hands-on manner by having students measure out a
length of paper tape to represent money that is saved
or invested, allowing them to see how money grows
over a period of time. Depending upon the students’
prior knowledge and experience, pre-activities
dealing with the relationship between a meter and a
centimeter and how to change percents to decimals
on a calculator might be needed.
Each small group (3–4 students) should be
provided with a cash register tape (approximately
2.5 meters long), a meter stick, tape, scissors, and a
calculator. Each student should receive a worksheetto record their group’s results (see sample “Double
Your Money” Student Activity Sheet on page 53).
Have each group cut off a piece of their cash register
tape 1 meter long. This piece represents $100.
Assign an interest rate to each group (e.g., 5%, 6%,
7%, 8%, 9%, 10%, 12%, 14%).
Have the groups use their assigned percentage
rate to calculate the amount of money earned in
interest during the first year of savings and record it
on each student’s worksheet within the group. Each
group should then measure and cut a second piece
of cash register tape that appropriately represents themoney earned during the first year of savings and
tape it end-to-end to the $100 paper tape. Have the
students record their tape’s new length, which
represents the dollar value, into their table. Have the
groups repeat these steps using their assigned
interest rate until each group has doubled their $100.
After all the groups have completed the activity
and doubled their money, collect the group data to
display on an overhead transparency (see page 54).
Ask the students to describe the pattern(s) they see in
the table. Recognizing an inverse relationship (column
two decreases as column one increases) is a good
conclusion. Allow the students to discover that the
Rule of 70 means that your money is doubled whenthe product of the number of years times the interest
rate is 70 (e.g., the product of the R and T from the
continuous compounding formula Q = Q 0 e RT is
approximately 0.70 when Q = 2Q 0 ).
Suggestions for Assessment
Anecdotal Notes —Students could be observed
as they complete the activity worksheets. The teacher
could note whether students are actively participating
in the mathematical calculations and accurately
modeling their results.
Math Journal Checklist —Students could be asked
to keep a journal to document the various types of
problems they encounter. Among the entries students
could record in their journal are sample problems with
written explanations of the process(es) used to solve
them or to draw an appropriate conclusion. A Math
Journal Checklist could be used to evaluate students’
entries in the Math Journal. The teacher and/or
students could generate the criteria for the checklist.
The checklist may be developed in various ways: it
may cover a wide range of skills and understandings,
it may cover a specific set of skills and understanding
or it may change as the unit unfolds to reflect newskills and understandings being learned. The
checklist on page 55, for example, assesses such
broad skills as students’ mathematical
understandings, use of mathematical language, and
mathematical reasoning or argumentation. It also
assesses the students’ abilities to make inferences
and generalizations, to ask thoughtful questions, and
to reflect on their own thinking processes. The math
journal could continue throughout the entire unit.
Linking Instruction and AssessmentStrands: Numbers: Concepts and Properties; Basic Operations & Applications
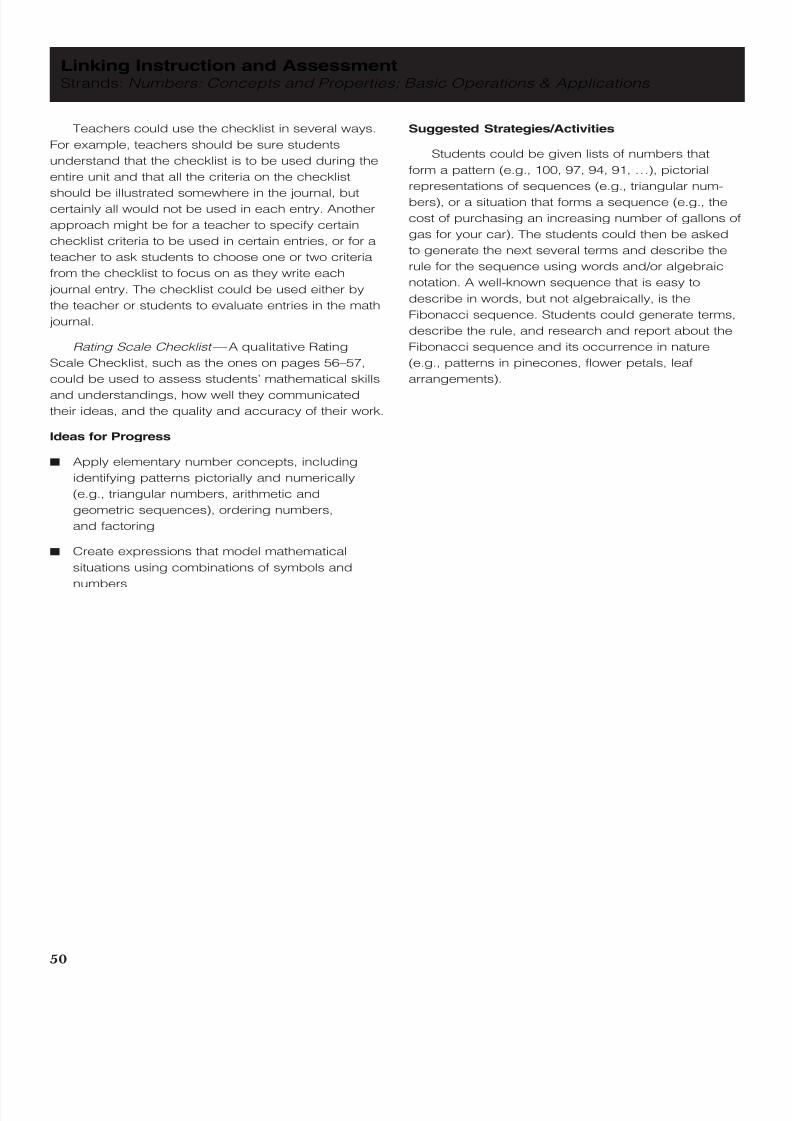
8/20/2019 Connect CRS to Classroom MATH.pdf
http://slidepdf.com/reader/full/connect-crs-to-classroom-mathpdf 54/83
50
Teachers could use the checklist in several ways.
For example, teachers should be sure students
understand that the checklist is to be used during the
entire unit and that all the criteria on the checklist
should be illustrated somewhere in the journal, butcertainly all would not be used in each entry. Another
approach might be for a teacher to specify certain
checklist criteria to be used in certain entries, or for a
teacher to ask students to choose one or two criteria
from the checklist to focus on as they write each
journal entry. The checklist could be used either by
the teacher or students to evaluate entries in the math
journal.
Rating Scale Checklist —A qualitative Rating
Scale Checklist, such as the ones on pages 56–57,
could be used to assess students’ mathematical skills
and understandings, how well they communicated
their ideas, and the quality and accuracy of their work.
Ideas for Progress
■ Apply elementary number concepts, including
identifying patterns pictorially and numerically
(e.g., triangular numbers, arithmetic and
geometric sequences), ordering numbers,
and factoring
■ Create expressions that model mathematical
situations using combinations of symbols and
numbers
Suggested Strategies/Activities
Students could be given lists of numbers that
form a pattern (e.g., 100, 97, 94, 91, …), pictorial
representations of sequences (e.g., triangular num-
bers), or a situation that forms a sequence (e.g., the
cost of purchasing an increasing number of gallons of
gas for your car). The students could then be asked
to generate the next several terms and describe the
rule for the sequence using words and/or algebraic
notation. A well-known sequence that is easy to
describe in words, but not algebraically, is the
Fibonacci sequence. Students could generate terms,
describe the rule, and research and report about the
Fibonacci sequence and its occurrence in nature
(e.g., patterns in pinecones, flower petals, leaf
arrangements).
Linking Instruction and AssessmentStrands: Numbers: Concepts and Properties; Basic Operations & Applications

8/20/2019 Connect CRS to Classroom MATH.pdf
http://slidepdf.com/reader/full/connect-crs-to-classroom-mathpdf 55/83
Fraction Decimal Percent Fraction Decimal Percent Fraction Decimal Percent Fraction Decimal Percent
51
Looking for Patterns Student Activity Sheet
Name: ______________________________________________ Period:_________________ Date:_________________
Scenario: You have recently acquired part ownership in a company. To determine the per-
cent of profit you and your partners have made thus far, change the indicated fractions todecimals and %. When you find a pattern for a group such as the 1/9ths, describe it on the
lines provided at the end of this worksheet. Circle the ones that you filled in from memory.
Highlight the ones you filled in once you discovered a pattern. Attach your work.
1__1
1__2
1__3
1__4
2__1
2__2
2__3
2__4
3__1
3__2
3__3
3__4
4__1
4__2
4__3
4__4
5__1
5__2
5__3
5__4
6__1
6__2
6__3
6__4
7__1
7__2
7__3
7__4
8__1
8__2
8__3
8__4
Fraction Decimal Percent Fraction Decimal Percent Fraction Decimal Percent Fraction Decimal Percent
1__5
1__6
1__7
1__8
2__5
2__6
2__7
2__8
3__5
3__6
3__7
3__8
4__5
4__6
4__7
4__8
5__5
5__6
5__7
5__8
6__5 6__6 6__7 6__8
7__5
7__6
7__7
7__8
8__5
9__5
8__6
9__6
8__7
9__7
8__8
9__8

8/20/2019 Connect CRS to Classroom MATH.pdf
http://slidepdf.com/reader/full/connect-crs-to-classroom-mathpdf 56/83
52
Give a rule or describe the pattern you discovered for each fraction “family.”
__________________________________________________________________________________________
__________________________________________________________________________________________
__________________________________________________________________________________________
__________________________________________________________________________________________
__________________________________________________________________________________________
__________________________________________________________________________________________
__________________________________________________________________________________________
__________________________________________________________________________________________
__________________________________________________________________________________________
__________________________________________________________________________________________
__________________________________________________________________________________________
__________________________________________________________________________________________
__________________________________________________________________________________________
__________________________________________________________________________________________
Fraction Decimal Percent Fraction Decimal Percent Fraction Decimal Percent Fraction Decimal Percent
1__9
1__10
1__11
1__12
2__9
2__10
2__11
2__12
3__9
3__10
3__11
3__12
4__9
4__10
4__11
4__12
5__9
5__10
5__11
5__12
6__9
6__10
6__11
6__12
7__9
7__10
7__11
7__12
8__9
9__9
10__9
11__9
12__9
9__10
10__10
11__10
12__10
9__11
10__11
11__11
12__11
9__12
10__12
11__12
12__12
8__10
8__11
8__12
Looking for Patterns Student Activity Sheet (continued)
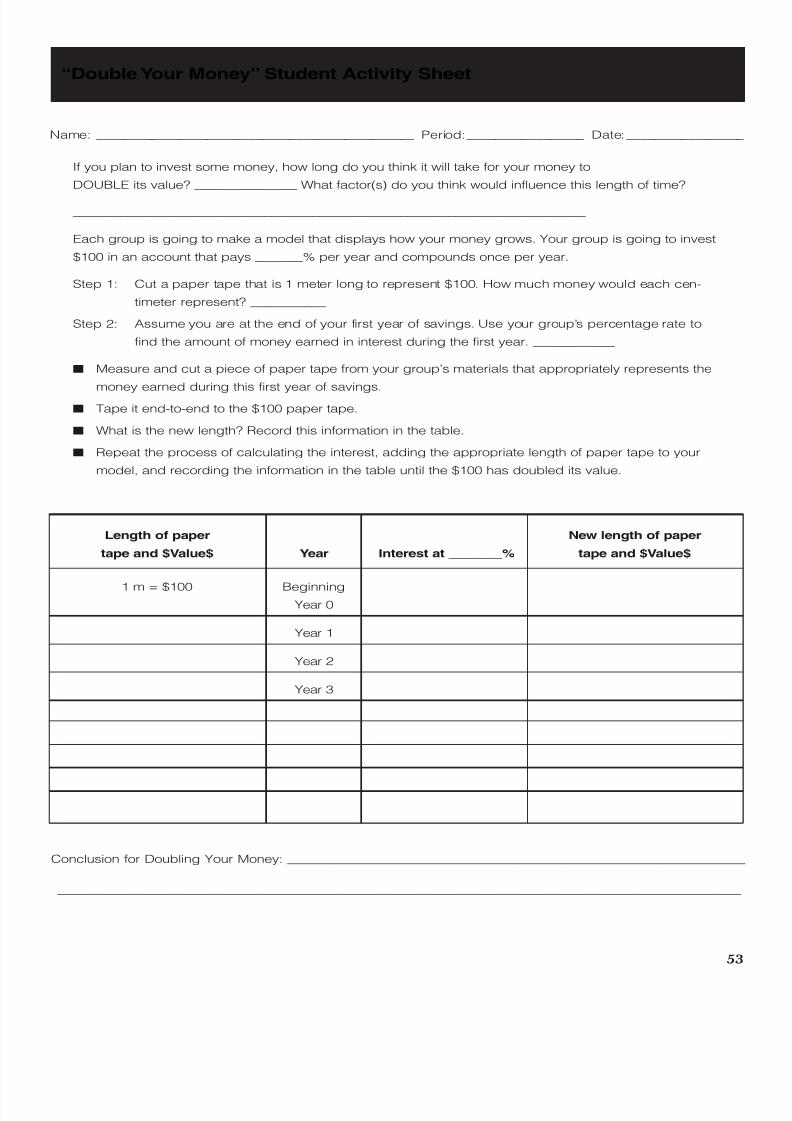
8/20/2019 Connect CRS to Classroom MATH.pdf
http://slidepdf.com/reader/full/connect-crs-to-classroom-mathpdf 57/83
53
Length of paper New length of paper
tape and $Value$ Year Interest at _______% tape and $Value$
1 m = $100 BeginningYear 0
Year 1
Year 2
Year 3
“Double Your Money” Student Activity Sheet
Name: ______________________________________________ Period:_________________ Date:_________________
If you plan to invest some money, how long do you think it will take for your money to
DOUBLE its value? _______________ What factor(s) do you think would influence this length of time?
___________________________________________________________________________
Each group is going to make a model that displays how your money grows. Your group is going to invest
$100 in an account that pays _______% per year and compounds once per year.
Step 1: Cut a paper tape that is 1 meter long to represent $100. How much money would each cen-
timeter represent? ___________
Step 2: Assume you are at the end of your first year of savings. Use your group’s percentage rate to
find the amount of money earned in interest during the first year. ____________
■ Measure and cut a piece of paper tape from your group’s materials that appropriately represents the
money earned during this first year of savings.■ Tape it end-to-end to the $100 paper tape.
■ What is the new length? Record this information in the table.
■ Repeat the process of calculating the interest, adding the appropriate length of paper tape to your
model, and recording the information in the table until the $100 has doubled its value.
Conclusion for Doubling Your Money: ___________________________________________________________________
____________________________________________________________________________________________________

8/20/2019 Connect CRS to Classroom MATH.pdf
http://slidepdf.com/reader/full/connect-crs-to-classroom-mathpdf 58/83
54
Group Data Table
Time to double
Rate (%) (in years) Rate • Time Rate + Time
5%
6%
7%
8%
9%
10%
12%
14%
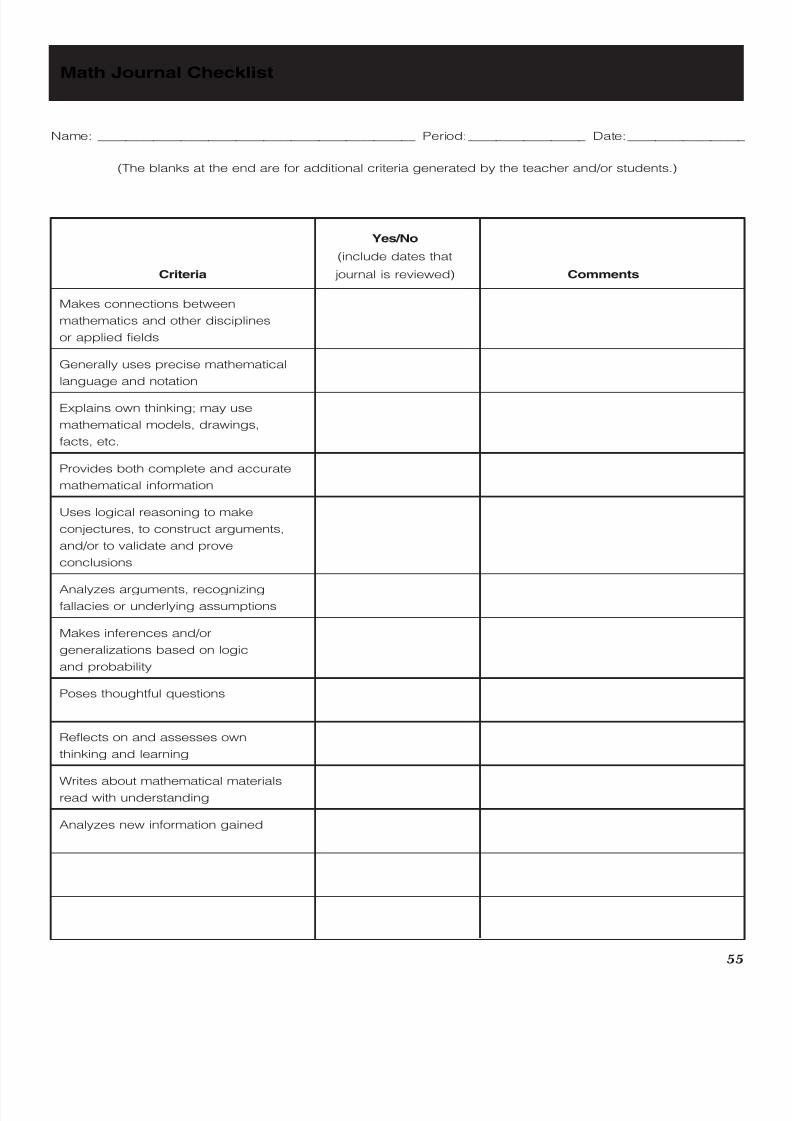
8/20/2019 Connect CRS to Classroom MATH.pdf
http://slidepdf.com/reader/full/connect-crs-to-classroom-mathpdf 59/83
55
Math Journal Checklist
Name: ______________________________________________ Period:_________________ Date:_________________
(The blanks at the end are for additional criteria generated by the teacher and/or students.)
Yes/No
(include dates that
Criteria journal is reviewed) Comments
Makes connections between
mathematics and other disciplines
or applied fields
Generally uses precise mathematical
language and notation
Explains own thinking; may use
mathematical models, drawings,
facts, etc.
Provides both complete and accurate
mathematical information
Uses logical reasoning to make
conjectures, to construct arguments,
and/or to validate and prove
conclusions
Analyzes arguments, recognizingfallacies or underlying assumptions
Makes inferences and/or
generalizations based on logic
and probability
Poses thoughtful questions
Reflects on and assesses own
thinking and learning
Writes about mathematical materialsread with understanding
Analyzes new information gained
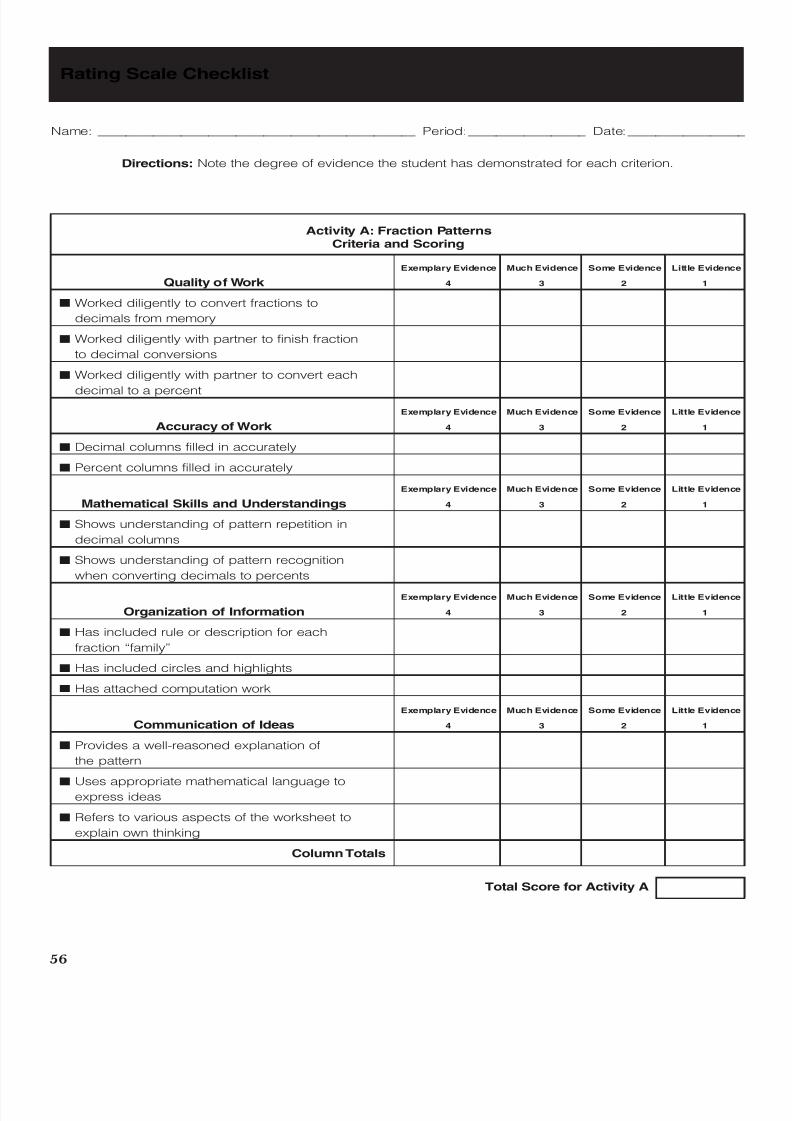
8/20/2019 Connect CRS to Classroom MATH.pdf
http://slidepdf.com/reader/full/connect-crs-to-classroom-mathpdf 60/83
56
Name: ______________________________________________ Period:_________________ Date:_________________
Directions: Note the degree of evidence the student has demonstrated for each criterion.
Activity A: Fraction PatternsCriteria and Scoring
Exemplary Evidence Much Evidence Some Evidence Little Evidence
Quality of Work 4 3 2 1
■ Worked diligently to convert fractions to
decimals from memory
■ Worked diligently with partner to finish fraction
to decimal conversions
■ Worked diligently with partner to convert each
decimal to a percentExemplary Evidence Much Evidence Some Evidence Little Evidence
Accuracy of Work 4 3 2 1
■ Decimal columns filled in accurately
■ Percent columns filled in accurately
Exemplary Evidence Much Evidence Some Evidence Little Evidence
Mathematical Skills and Understandings 4 3 2 1
■ Shows understanding of pattern repetition in
decimal columns
■ Shows understanding of pattern recognition
when converting decimals to percents
Exemplary Evidence Much Evidence Some Evidence Little Evidence
Organization of Information 4 3 2 1
■ Has included rule or description for each
fraction “family”
■ Has included circles and highlights
■ Has attached computation work
Exemplary Evidence Much Evidence Some Evidence Little Evidence
Communication of Ideas 4 3 2 1
■ Provides a well-reasoned explanation of
the pattern
■Uses appropriate mathematical language toexpress ideas
■ Refers to various aspects of the worksheet to
explain own thinking
Column Totals
Total Score for Activity A
Rating Scale Checklist

8/20/2019 Connect CRS to Classroom MATH.pdf
http://slidepdf.com/reader/full/connect-crs-to-classroom-mathpdf 61/83
57
Name: ______________________________________________ Period:_________________ Date:_________________
Directions: Note the degree of evidence the student has demonstrated for each criterion.
Activity B: Rule of 70Criteria and Scoring
Exemplary Evidence Much Evidence Some Evidence Little Evidence
Quality of Work 4 3 2 1
■ Performed individual assigned duty on the team
■ Worked diligently with team to complete “Double
Your Money” Student Activity Sheet
Exemplary Evidence Much Evidence Some Evidence Little Evidence
Accuracy of Work 4 3 2 1
■ Interest column filled in accurately
■ New $Value$ column filled in accurately
Exemplary Evidence Much Evidence Some Evidence Little Evidence
Mathematical Skills and Understandings 4 3 2 1
■ Shows understanding of % as an interest rate
■ Shows understanding of growth (amount of
money earned in interest)
■ Shows understanding of the relationship between
the length of the paper tape and the $Value$
Exemplary Evidence Much Evidence Some Evidence Little Evidence
Organization of Information 4 3 2 1
■ Has completed the Student Activity Sheet with
the results obtained by the group
■ Has included conclusion(s) after discussion
about the group data recorded on the
overhead transparency
Exemplary Evidence Much Evidence Some Evidence Little Evidence
Communication of Ideas 4 3 2 1
■ Provides a well-reasoned explanation of
the conclusion/pattern
■ Uses appropriate mathematical language to
express ideas
■ Refers to various aspects of the worksheet to
explain own thinking
Column Totals
Total Score for Activity B
Rating Scale Checklist

8/20/2019 Connect CRS to Classroom MATH.pdf
http://slidepdf.com/reader/full/connect-crs-to-classroom-mathpdf 62/83
58
ALGEBRAIC EQUATIONS
College Readiness Standards
■ Combine like terms (e.g., 2x + 5x )
■ Solve equations in the form x + a = b, where a
and b are whole numbers or decimals
■ Solve one-step equations having integer or
decimal answers
■ Solve routine first-degree equations
Description of the Instructional Activity
The activity is designed to give students guided
practice in solving multistep equations, providing
reinforcement of mathematical concepts through
additional peer instruction time while working in a
group setting. Depending upon the students’ prior
knowledge and experience, pre-activities that have
students combine like terms and perform
computations where integers and fractions are
used as inverses might be needed before startingthis activity.
On a sheet of paper, write out several algebraic
first-degree equations and the step-by-step solution o
each equation. Be sure to use a different variable for
each equation.
Example 1: 3x = 3
x = 1
Example 2: 4p + 7 = 47
4p = 40
p = 10
Make a copy of the equations sheet for each
group. Cut the equations and their step-by-step
solution into strips, shuffle them, and place them in an
envelope. Distribute an envelope to each group.
The task for students, working in their groups, is
to sort the steps on the strips of paper into the proper
sequence to solve the equation. The teacher’s task is
to circulate through the room and observe the
interaction within the groups; check on each student’s
participation and understanding; and provide
guidance and instruction as needed.
When the teacher has verified that the groups
have performed the task of putting all of the steps in
the proper sequence for each equation, the next task
is for the students to write down each equation and its
proper sequence of steps leading to the solution. To
reinforce the process, have each student write an
explanation or justification for each step (e.g., whatoperation or property was used to get from one step
to the next). A list of the property names with an
example for each property could be provided for
each group to aid students with their explanations.
After all the groups have completed the activity,
each student could be given a new set of equations
to solve independently. (This activity is adapted from
Rubenstein et al., Integrated Mathematics 1, 1995,
p. 251)
Guiding Principles
■ “All students should have the opportunity and
the support necessary to learn significant
mathematics with depth and understanding.”
(NCTM, 2000, p. 5)
■ “Understanding develops as students con-
struct new relationships among ideas, as they
strengthen existing relationships among those
ideas, and as they reorganize their ideas.”
(Secada, 1997, p. 8)
■ “Assessment should support the learning of
important mathematics and furnish useful
information to both teachers and students.”
(NCTM, 2000, p. 22)
Linking Instruction and AssessmentStrands: Expressions, Equations, & Inequalities
8/20/2019 Connect CRS to Classroom MATH.pdf
http://slidepdf.com/reader/full/connect-crs-to-classroom-mathpdf 63/83
59
Suggestions for Assessment
Group Questionnaire —As a group, the students
could complete a questionnaire designed to
encourage cooperative working relationships and to
help them develop an effective plan of action for
working with the equations (see sample questionnaire
on page 60).
Anecdotal Notes —The teacher can observe the
students, noting those who are and are not actively
participating in the ordering of the steps for the
solution to each equation.
Pencil-and-Paper Tasks —To evaluate each
student’s level of understanding, students could be
given a set of equations as a quiz/test and asked to
match the property or operation that would justify
each step.
Rubric —A rubric could be used to assess student
participation within a group, student performance of
the key steps involved in the equation-sequencing-
and-justification task, and demonstration of mastery
of the process on a test (see rubric on page 61).
Ideas for Progress
■ Evaluate algebraic expressions and solve
multistep first-degree equations
■ Use the inverse relationships for the four basic
operations, exponentiation, and root extractions to
determine unknown quantities
■ Create and solve linear equations and inequalities
that model real-world situations
Suggested Strategies/Activities
Students could redo the activity with the same
algebraic equations or with several new algebraic
equations where each equation uses the same
variable.
Give each group several equations and have the
students classify the equations as solvable with only
addition/subtraction, solvable with only
multiplication/division, or requiring both operations.
After separating the equations into the three
categories, the students could decide what
operation(s) need(s) to be performed and then write
and explain or justify each step leading to the correct
solution.
The teacher could have each group create their
own equations, identifying the order of the steps that
lead to the correct solution. They could distribute their
packet of equations to each of the other groups and
challenge them to see which group could correctly
order the steps in the shortest amount of time.
Students could also be given expressions or
equations and asked to write a real-world problem
that the expression or equation could be modeling.
Teachers could extend the real-world concept even
further by giving students equations or inequalities
found in a break-even business situation that might
include fixed costs and variable costs.
Linking Instruction and AssessmentStrands: Expressions, Equations, & Inequalities

8/20/2019 Connect CRS to Classroom MATH.pdf
http://slidepdf.com/reader/full/connect-crs-to-classroom-mathpdf 64/83
60
Names/Group: __________________________________________________________________ Period: _____________
This questionnaire is designed to be used by all the members of a group to guide their
planning and development of an effective plan of action and to reflect on their
problem-solving strategies and decision-making skills.
Directions: 1. As a group, carefully read each question.
2. Place a “✓” and a date in the scoring box that applies.
3. Discuss each question with the members of your group
and write a group response.
Scoring Questions Responses
Yes Not quite Can you explain the tasks(s) and its key Task(s):elements?
Yes Not quite Have you thought about and discussed Best Solution:
possible plans for completing the task(s)?
Yes Not quite Can you list steps for completing Steps in process:
the task(s)?
Yes Not quite Did you use an appropriate strategy for Strategies used:
each step and sub-step?
Yes Not quite Explain how this task is similar to other Explanation:
tasks you have encountered.
Yes Not quite Did the strategies your group chose and Reasons:the decisions your group made work?
Group Questionnaire
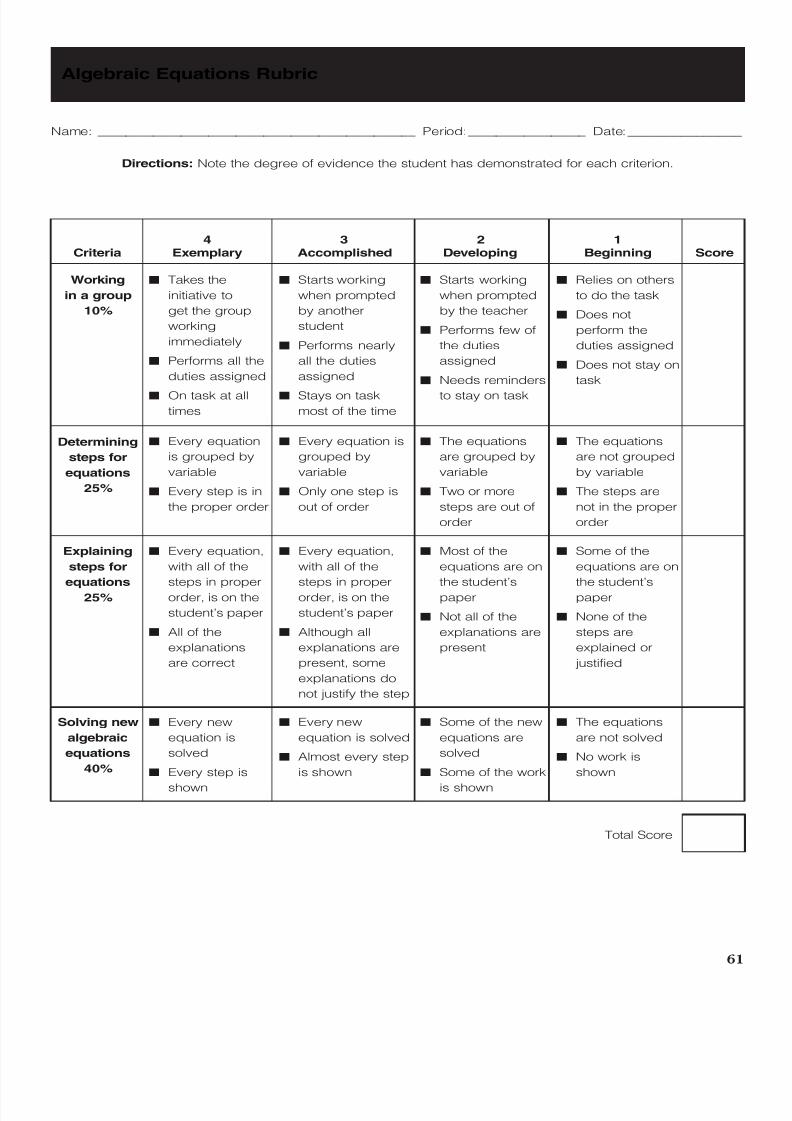
8/20/2019 Connect CRS to Classroom MATH.pdf
http://slidepdf.com/reader/full/connect-crs-to-classroom-mathpdf 65/83
61
Name: ______________________________________________ Period:_________________ Date: _______________
Directions: Note the degree of evidence the student has demonstrated for each criterion.
4 3 2 1Criteria Exemplary Accomplished Developing Beginning Score
Working
in a group
10%
Determining
steps for
equations
25%
Explaining
steps for
equations
25%
Solving new
algebraic
equations
40%
■ Takes the
initiative to
get the group
working
immediately
■ Performs all the
duties assigned
■ On task at all
times
■ Starts working
when prompted
by another
student
■ Performs nearly
all the duties
assigned
■ Stays on task
most of the time
■ Starts working
when prompted
by the teacher
■ Performs few of
the duties
assigned
■ Needs reminders
to stay on task
■ Relies on others
to do the task
■ Does not
perform the
duties assigned
■ Does not stay on
task
■ Every equation
is grouped by
variable
■ Every step is in
the proper order
■ Every equation is
grouped by
variable
■ Only one step is
out of order
■ The equations
are grouped by
variable
■ Two or more
steps are out of
order
■ The equations
are not grouped
by variable
■ The steps are
not in the proper
order
■ Every equation,
with all of the
steps in proper
order, is on the
student’s paper
■ All of the
explanations
are correct
■ Every equation,
with all of the
steps in proper
order, is on the
student’s paper
■ Although all
explanations are
present, some
explanations do
not justify the step
■ Most of the
equations are on
the student’s
paper
■ Not all of the
explanations are
present
■ Some of the
equations are on
the student’s
paper
■ None of the
steps are
explained or
justified
■ Every new
equation is
solved
■ Every step is
shown
■ Every new
equation is solved
■ Almost every step
is shown
■ Some of the new
equations are
solved
■ Some of the work
is shown
■ The equations
are not solved
■ No work is
shown
Total Score
Algebraic Equations Rubric

8/20/2019 Connect CRS to Classroom MATH.pdf
http://slidepdf.com/reader/full/connect-crs-to-classroom-mathpdf 66/83
8/20/2019 Connect CRS to Classroom MATH.pdf
http://slidepdf.com/reader/full/connect-crs-to-classroom-mathpdf 67/83
63
INSTRUCTIONAL ACTIVITIES
FOR ACT MATHEMATICS
WHY ARE ADDITIONAL
INSTRUCTIONAL ACTIVITIES
INCLUDED?
The set of instructional activities that begins on
page 64 was developed to illustrate the link between
classroom-based activities and the skills and
understandings embedded in the ACT Mathematics
Test questions. The activities are provided asexamples of how classroom instruction and
assessment, linked with an emphasis on reasoning,
can help students practice skills and understandings
they will need in the classroom and in their lives
beyond the classroom. It is these skills and
understandings that are represented on the ACT
Mathematics Test.
A variety of thought-provoking activities, such as
applying mathematics, making connections within
mathematics and to other areas, small- and large-
group discussions, and both independent and
collaborative activities, are included to help studentsdevelop and refine their skills in many types of
situations.
The instructional activities that follow have the
same organizational structure as the ones in the
previous section. Like the other activities, these
activities were not developed to be a ready-to-use set
of instructional strategies. ACT’s main purpose is to
illustrate how the skills and understandings
embedded in the ACT Mathematics Test questions
can be incorporated into classroom activities.
For the purpose of this part of the guide, we have
tried to paint a picture of the ways in which the
activities could work in the classroom. We left room
for you to envision how the activities might best work
for you and your students. We recognize that as you
determine how best to serve your students, you take
into consideration your teaching style as well as the
academic needs of your students; state, district, and
school standards; and available curricular materials.
The instructional activities are not intended to
help drill students in skills measured by the ACT
Mathematics Test. It is never desirable for test scores
or test content to become the sole focus of classroom
instruction. However, considered with information from
a variety of other sources, the results of standardized
tests can help you identify areas of strength and
weakness. The activities that follow are examples of
sound educational practices and imaginative,
integrated learning experiences. As part of a carefully
designed instructional program, these activities may
result in improved performance on the ACTMathematics Test—not because they show how to
drill students in specific, isolated skills but because
they encourage thinking and integrated learning.
These activities can help because they encourage the
kind of thinking processes and strategies the ACT
Mathematics Test requires.
8/20/2019 Connect CRS to Classroom MATH.pdf
http://slidepdf.com/reader/full/connect-crs-to-classroom-mathpdf 68/83
64
USING SAMPLING TECHNIQUES
College Readiness Standards
■ Solve some routine two-step arithmetic problems
■ Exhibit knowledge of simple counting techniques
■ Compute a probability when the event and/or
sample space are not given or obvious
■ Exhibit knowledge of conditional and joint
probability
■ Calculate the average of a list of numbers
■ Use Venn diagrams in counting
■ Distinguish between mean, median, and mode for
a list of numbers
Description of the Instructional Activity
During a class discussion, students could review
the concepts of probability and relative frequency,
applying the concepts to real-world situations
(e.g., rolling a die).
Working in small groups, students could then
design and perform an experiment to determine the
distribution of colors or varieties of similar objects in a
container (e.g., M&M’s, marbles, or buttons). After
predicting the distribution based on the results of their
experiment, the students could look in the container
and compare their predicted distribution with the
actual distribution.
Each group could report on their experiment, the
number of trials, the relative frequencies, and the
actual distribution. Students could use that information
to plan and perform a series of similar experiments to
determine the optimal number of trials needed to
accurately predict the distribution.
Depending on the students’ knowledge of
probability, students could also design experiments
based on conditional probability (e.g., taking out two
or three objects before replacing them). Students
could also use a computer program to model these
experiments.
Suggestions for Assessment
Performance Task —Students could be given a
different situation (e.g., a container with an unknown
number of M&M’s or a container of 50 marbles with an
unknown number of colors). Using the knowledge
they gained from their other experiments, students
could design another experiment, including a written
rationale. The teacher could use a rubric to evaluate
the design and a set of criteria to evaluate the
rationale.
Guiding Principles
■ “Students learn more when they are offered
opportunities for active application of skills
and abilities and time for contemplation.”
(American Association for Higher Education
[AAHE], American College Personnel
Association, & Association of Student
Personnel Administrators, 1998, p. 5)
■ “An effective . . . mathematics program
engages students in a variety of learning
experiences designed to promote
mathematical exploration and reasoning.”
(Pechman, 1991, p. 35)
■ “In order for assessment to support student
learning, it must include teachers in all stagesof the process and be embedded in
curriculum and teaching activities.”
(Darling-Hammond, 1994, p. 25)
Linking Instruction and AssessmentStrands: Data Analysis; Basic Operations & Applications

8/20/2019 Connect CRS to Classroom MATH.pdf
http://slidepdf.com/reader/full/connect-crs-to-classroom-mathpdf 69/83
65
Ideas for Progress
■ Model and solve real-world problems that involve
a combination of rates, proportions, and/or
percents
■ Construct and analyze Venn diagrams to help
determine simple probabilities
■ Design and conduct probability investigations
(e.g., how the margin of error is determined) and
then determine, analyze, and communicate the
results
Suggested Strategies/Activities
Students could be introduced to measures of
central tendency as different methods of interpreting
data for use in decision making. Students could then
inquire about how data is organized, displayed, and
summarized for reports in industry or politics.
Students could investigate how sampling is used
in industry or politics. Topics might include how the
margin of error is determined (e.g., poll results that
are accurate within 3%) and how political candidates
are declared winners by the major networks when a
very small percentage of the votes are in. They could
explore how different companies or groups in the
community choose the number of members to use in
a sample from the population. Students could learn
about and discuss ways industries and groups usevarious sampling techniques so that the sample is
random and not biased in some way.
Linking Instruction and AssessmentStrands: Data Analysis; Basic Operations & Applications

8/20/2019 Connect CRS to Classroom MATH.pdf
http://slidepdf.com/reader/full/connect-crs-to-classroom-mathpdf 70/83
66
P ASCAL’S TRIANGLE
College Readiness Standards
■ Compute a probability when the event and/or
sample space are not given or obvious
■ Draw conclusions based on number concepts,
algebraic properties, and/or relationships between
expressions and numbers
■ Write expressions that require planning and/or
manipulating to accurately model a situation
■ Evaluate polynomial functions, expressed in
function notation, at integer values
■ Manipulate expressions and equations
Description of the Instructional Activity
Students could be given the first few rows of
Pascal’s triangle and asked to determine the next
several lines. Students could provide assistance to apeer by giving hints (e.g., providing a particular entry
or suggesting a strategy).
Working in groups, students could identify other
sequences that are involved in the triangle (e.g.,
Fibonacci sequence and triangular numbers).
Students could define those sequences algebraically,
recursively, or by position in the triangle.
As an algebraic application, students could
be asked to expand binomials raised to powers
(e.g., (x + y )3) and compare the coefficients with
entries in Pascal’s triangle. The discussion could beexpanded to include the binomial coefficient notation
and formula. Also, students could explore binomials in
the form (ax r + by s )t .
For certain events (e.g., flipping a coin three
times), students could list all the combinations,
determine the number of occurrences, and compute
their probabilities. Students could investigate the
connection with Pascal’s triangle for determining the
numbers of combinations and probability. Students
could also explore how (ax r + by s )t is related to
flipping coins.
Suggestions for Assessment
Pencil-and-Paper Tasks —Students could be
given Pascal’s triangle and a series of constructed-
response or multiple-choice questions that use entries
in the triangle. Students could also explain how
Pascal’s triangle would aid them or others in
expanding binomials or computing probabilities.
The teacher could assess the accuracy of the
mathematics, the communication of ideas and con-
cepts, and the application of reasoning skills that the
students demonstrate.
Guiding Principles
■ “Students . . . should learn mathematics as a
process of constructing and interpreting
patterns, of discovering strategies for solving
problems, and of exploring the beauty and
applications of mathematics.” (Mathematical
Sciences Education Board, Board on
Mathematical Sciences, & National Research
Council, 1989, p. 66)
■ “Learning involves the ability of individuals to
monitor their own learning, to understand how
knowledge is acquired, to develop strategies
for learning based on discerning their
capacities and limitations, and to be aware of
their own ways of knowing in approachingnew bodies of knowledge and disciplinary
frameworks.” (AAHE et al., 1998, p. 14)
■ “Assessment of learning should encompass
all aspects of the educational experience.”
(AAHE et al., 1998, p. 7)
Linking Instruction and AssessmentStrands: Numbers: Concepts & Properties; Data Analysis; Expressions, Equations, &
Inequalities; Functions

8/20/2019 Connect CRS to Classroom MATH.pdf
http://slidepdf.com/reader/full/connect-crs-to-classroom-mathpdf 71/83
67
Ideas for Progress
■ Gather, organize, display, and analyze data in a
variety of ways to use in problem solving
■ Find the probability of simple events, disjoint
events, compound events, and independent
events in a variety of settings using a variety of
counting techniques
■ Create expressions that model mathematical
situations using combinations of symbols and
numbers
■ Make generalizations, arrive at conclusions based
on conditional statements, and offer solutions for
new situations that involve connecting
mathematics with other content areas
Suggested Strategies/Activities
Students could conduct a survey to determine
whether people (e.g., fellow students, neighbors, local
merchants) regularly, occasionally, or never buy lotterytickets, displaying the data in an appropriate format
(e.g., circle graph, bar graph). As a group students
could then analyze the data, drawing conclusions
about people’s buying habits with regard to lottery
tickets. They could contact a lottery commission and
research the way the odds are computed and then
use the information obtained to actually calculate the
odds of winning. Students could also be asked to
investigate and explore situations or conditions that
might change the odds of winning. They could
investigate the expected value (gain or loss) of
someone who buys $x worth of lottery tickets over
a set period of time versus someone who spends
$y over the same period of time.
Linking Instruction and AssessmentStrands: Numbers: Concepts & Properties; Data Analysis; Expressions, Equations, &
Inequalities; Functions
8/20/2019 Connect CRS to Classroom MATH.pdf
http://slidepdf.com/reader/full/connect-crs-to-classroom-mathpdf 72/83
68
TRIGONOMETRIC GRAPHS
College Readiness Standards
■ Analyze and draw conclusions based on
information from graphs in the coordinate plane
■ Write equations and inequalities that require
planning, manipulating, and/or solving
■ Locate points in the coordinate plane
■ Match graphs of basic trigonometric functions
with their equations
Description of the Instructional Activity
Students could make a table of common
trigonometric values based on their experience with
right triangles (e.g., cos 30° or sin 45°). The studentscould predict the shape of the sine and cosine graphs
using those values. Using a graphing calculator, the
teacher could then demonstrate how to graph
y = sin x and y = cos x . Using the table or trace
feature on the calculator, students could compare
their table of values with the graphs and extend their
table to include values for larger angles. Using the
tables and graphs, students could look for patterns
and identify relationships between the two functions
(e.g., values for complementary angles or translation
of graphs).
Students could explore graphing equations in
the form y = sin(x + C ) to obtain an equation that
has the same graph as y = cos x . Working in small
groups, students could then explore, discover
patterns, and make predictions of the effect on the
graph when each of the parameters in the equation
y = A sin(Bx + C ) + D is changed. They could
complete a teacher-produced worksheet designed to
help them focus their exploration and to be more
methodical, depending on their experience
(Caughlan, Myers, & Forrest, n.d.).
Afterward, the class could discuss the effect of
parameter changes and the appropriate mathematica
terminology. They could practice translating between
the different representations: mathematical
terminology, graphical, and algebraic.
Guiding Principles
■ “Student understanding develops as a result
of students’ building on prior knowledge viapurposeful engagement in problem solving
and substantive discussions with other
students and teachers in classrooms.”
(National Center for Improving Student
Learning and Achievement in Mathematics
and Science, 1997, p. 14)
■ “A major purpose of evaluation is to help
teachers better understand what students
know and make meaningful decisions about
teaching and learning activities.” (Zemelman,
Daniels, & Hyde, 1993, p. 77)
■ “As students realize that their performances
are being recognized and assessed
reasonably, their performances will improve.”
(Association for Supervision and Curriculum
Development [ASCD], 1999, p. 11)
Linking Instruction and AssessmentStrands: Data Analysis; Functions; Graphical Representations;
Expressions, Equations, & Inequalities
8/20/2019 Connect CRS to Classroom MATH.pdf
http://slidepdf.com/reader/full/connect-crs-to-classroom-mathpdf 73/83
69
Suggestions for Assessment
Checklist —The teacher could observe students’
learning by asking them leading and focusing
questions (e.g., “How can you reflect the graph aboutthe x -axis?” or “How did you reach that conclusion?”).
Observed knowledge and understandings could be
recorded along with comments regarding partial
understandings or misconceptions.
Pencil-and-Paper Tasks —Students could be
given a set of equations and asked either to sketch
their graphs without using a calculator or to describe,
using appropriate mathematical terminology, how
each graph would differ from the basic graph,
y = sin x or y = cos x . They could also be given a
graph and asked to determine its equation or to
describe its features mathematically. These questions
could be given in a multiple-choice format.
Ideas for Progress
■ Formulate expressions, equations, and inequalities
that require planning to accurately model real-
world problems (e.g., direct and inverse variation)
■ Make generalizations, arrive at conclusions based
on conditional statements, and offer solutions for
new situations that involve connecting
mathematics with other content areas
■ Explore geometric models where unit circle
trigonometry and basic identities can be used to
solve problems
Suggested Strategies/Activities
Some groups could work with the sine function,
while others work with the cosine function. A
comparison could be made to determine if the variousparameters change the graphs in the same ways. The
activity could also be extended to include the graphs
of the other trigonometric functions. In particular,
students could compare and contrast the effect of
parameter changes on reciprocal functions.
Students could be given real-world situations that
can be modeled using sine waves (e.g., a portion of a
roller-coaster track, depth of tidal waters over time, or
sound waves). Using data they gather, students could
write a modeling equation that approximates the data.
Linking Instruction and AssessmentStrands: Data Analysis; Functions; Graphical Representations;
Expressions, Equations, & Inequalities

8/20/2019 Connect CRS to Classroom MATH.pdf
http://slidepdf.com/reader/full/connect-crs-to-classroom-mathpdf 74/83

8/20/2019 Connect CRS to Classroom MATH.pdf
http://slidepdf.com/reader/full/connect-crs-to-classroom-mathpdf 75/83
71
Linking Instruction and AssessmentStrands: Properties of Plane Figures; Measurement;
Basic Operations & Applications
Suggestions for Assessment
Rating Scale —Students could describe in their
mathematics journal the technique(s) they used to
make their scale models and the conclusions theycame to regarding scale factors for the various solids.
The teacher could rate students’ entries using a scale
of 1 to 4 on such criteria as quality of work, accuracy
of work, mathematical skills and understandings,
organization of information, and communication of
ideas.
Anecdotal Notes —Students could be observed
while working in groups. The teacher could note
whether students are actively participating, correctly
calculating the volume and surface area, and making
and testing their conjectures.
Ideas for Progress
■ Apply a variety of strategies using relationships
between perimeter, area, and volume to calculate
desired measures
■ Explain, solve, and/or draw conclusions for
complex problems using relationships and ele-
mentary number concepts
■ Examine and compare a variety of methods to find
areas of composite figures and construct scale
drawings
Suggested Strategies/Activities
Using either 3-D models or computer software
(e.g., Geometric Supposer ), students could explore
the effect changing only one or two of its dimensionshas on the volume and surface area of a solid. They
could also identify those faces that are similar to the
original solid and describe the distortion of those
faces that are not similar.

8/20/2019 Connect CRS to Classroom MATH.pdf
http://slidepdf.com/reader/full/connect-crs-to-classroom-mathpdf 76/83
LINEAR P ROGRAMMING
College Readiness Standards
■ Analyze and draw conclusions based on
information from graphs in the coordinate plane
■ Find solutions to systems of linear equations
■ Solve problems integrating multiple algebraic
and/or geometric concepts
■ Evaluate polynomial functions, expressed in
function notation, at integer values
Description of the Instructional Activity
The teacher could guide the students through the
process by providing a real-world situation to optimize
(e.g., profit for a company that produces two items
with different profit and production rates, using a fixed
number of employees, machines, and work hours).Using the parameters given, the students would write,
with the teacher’s guidance, a function to model the
profit and translate the constraints into a system of
inequalities.
The students could then graph the feasible region
by graphing the system of inequalities. To find an
optimal solution, students could evaluate the profit
function for each of the vertices of the feasible region,
for three points within the region, and for three points
outside the region.
The class could discuss which point represented
the greatest profit. The teacher could then
demonstrate several other situations and have the
students brainstorm where the point of optimization
lies. The linear programming theorem could be
discussed.
Suggestions for Assessment
Performance Task —Students, either individually
or in small groups, could be given a situation similarto those modeled in class in which they need to
determine decision variables, an optimization function
a system of inequalities for the constraints, the
feasible region, and an optimal solution. Or students
could be given different constraints for a situation
modeled in class and asked to describe the effect of
each constraint on the feasible region and the optimal
solution. The teacher could use a rubric to score
students’ work on such criteria as quality of work,
accuracy of work, mathematical skills and
understandings, organization of information, and
communication of ideas.
Ideas for Progress
■ Gather, organize, display, and analyze data in a
variety of ways to use in problem solving
■ Create and use basic families of functions (which
include linear, absolute value, and quadratic) to
model and solve problems in common settings
■ Represent and interpret relationships defined by
equations and formulas; translate between
representations as ordered pairs, graphs, and
equations; and investigate symmetry andtransformations (e.g., reflections, translations,
rotations)
72
Guiding Principles
■ “Rich learning experiences . . . enable
students to make connections through
curricula integrating ideas and themes within
and across fields of knowledge and (through)
establishing coherence among learning
experiences within and beyond the
classroom.” (AAHE et al., 1998, p. 4)
■ “[Teachers] orchestrate discourse by
deciding when to provide information, when
to clarify an issue, when to model, when to
lead, and when to let a student struggle with
a difficulty.” (NCTM, 1991, p. 35)
■ “Learning requires frequent feedback if it is to
be sustained, practice if it is to be nourished,
and opportunities to use what has been
learned.” (AAHE et al., 1998, p. 10)
Linking Instruction and AssessmentStrands: Data Analysis; Expressions, Equations, & Inequalities;
Graphical Representations; Functions

8/20/2019 Connect CRS to Classroom MATH.pdf
http://slidepdf.com/reader/full/connect-crs-to-classroom-mathpdf 77/83
73
Suggested Strategies/Activities
Students could research and describe
contributions to linear programming by people
such as George Dantzig, Narendra Karmarkar, andL. G. Khachian.
Students could contact local agencies or
businesses in their community to investigate how they
employ linear programming or optimization
procedures. Business applications might include
some type of scheduling (e.g., airline, train, truck) and
routing of information over communication networks.
In some instances of linear programming, it is not an
efficient use of time to test every corner point for
cases that have multiple corner points. Students
could be introduced to simplex and ellipsoid methods
to find the corner point that represents maximum
profit, for instance. Other ideas and lesson plans
are available on the Internet. See, for example,
The Gateway to Educational Materials (GEM) at
http://www.thegateway.org.
Linking Instruction and AssessmentStrands: Data Analysis; Expressions, Equations, & Inequalities;
Graphical Representations; Functions

8/20/2019 Connect CRS to Classroom MATH.pdf
http://slidepdf.com/reader/full/connect-crs-to-classroom-mathpdf 78/83
74
P UTTING THE PIECES TOGETHER
ACT developed this guide to show the link
between the ACT Mathematics Test results and daily
classroom work. The guide serves as a resource for
teachers, curriculum coordinators, and counselors by
explaining what the College Readiness Standards say
about students’ academic progress.
The guide explains how the test questions on the
ACT Mathematics Test are related to the College
Readiness Standards and describes what kinds of
reasoning skills are measured. The sample
instructional activities and classroom assessments
suggest some approaches to take to help students
develop and apply their reasoning skills.
WHERE DO WE GO FROM HERE?
ACT recognizes that teachers are the essential
link between instruction and assessment. We are
committed to providing you with assistance as you
continue your efforts to provide quality instruction.
ACT is always looking for ways to improve its
services. We welcome your comments and questions.
Please send them to:
College Readiness Standards Information Services
Elementary and Secondary School Programs (32)
ACT
P.O. Box 168
Iowa City, IA 52243-0168
WHAT OTHER ACT P RODUCTS AND
SERVICES ARE AVAILABLE?
In addition to the College Readiness Standards
Information Services, ACT offers many products and
services that support school counselors, students and
their parents, and others. Here are some of these
additional resources:
ACT’s Website—www.act.org contains a host of
information and resources for parents, teachers, and
others. Students can visit www.actstudent.org, which
is designed to aid students as they prepare for their
next level of learning.
PLAN—a comprehensive assessment program
designed to improve tenth-grade students’
postsecondary planning and preparation and to
enable schools to assist students and their parents
in this important process.
EXPLORE—an eighth- and ninth-grade assessment
program designed to stimulate career explorations
and facilitate high school planning.
WorkKeys®—a system linking workplace skill areas to
instructional support and specific requirements of
occupations.
ACT Online PrepTM—an online test preparation
program that provides students with real ACT tests
and an interactive learning experience.
The Real ACT Prep Guide —the official print guide to
the ACT, containing three practice ACTs.
DISCOVER®—a computer-based career planning sys-
tem that helps users assess their interests,
abilities, experiences, and values, and provides
instant results for use in investigating educational
and occupational options.
“A mind, stretched to a new idea,never goes back to its original
dimensions.”
— Oliver Wendell Holmes

8/20/2019 Connect CRS to Classroom MATH.pdf
http://slidepdf.com/reader/full/connect-crs-to-classroom-mathpdf 79/83
75
1. GENERAL R EFERENCES
Adams, A. (1973). [Letter to John Quincy Adams,
May 8, 1780]. In L. H. Butterfield & M.
Friedlaender (Eds.), Adams family
correspondence: Vol. 3. April 1778–September
1780 (p. 313). Cambridge, MA: Harvard
University Press.
Airasian, P. W. (1991). Classroom assessment. New
York: McGraw Hill.
American Association for Higher Education, American
College Personnel Association, & National
Association of Student Personnel Administrators.
(1998, June). Powerful partnerships: A shared
responsibility for learning. Retrieved June 3,
2005, from
http://www.aahe.org/assessment/joint.htm
American College Testing Program. (1992). Content
validity of ACT’s educational achievement tests.
Iowa City, IA: Author.
ACT. (1996a). Linking assessment to instruction in your
classroom: Mathematics guide to EXPLORE,
PLAN, and the ACT Assessment. Iowa City, IA:
Author.
ACT. (1996b). Mathematics for a successful transition
to college: The content foundations of the ACT
Assessment. Iowa City, IA: Author.
ACT. (1997). ACT Assessment technical manual. Iowa
City, IA: Author.
ACT. (1998). Maintaining the content validity of ACT’s
educational achievement tests. Iowa City, IA:
Author.
ACT. (2000). Content validity evidence in support of
ACT’s educational achievement tests: ACT’s
1998–1999 national curriculum study. Iowa City,
IA: Author.
ACT. (2003). Content validity evidence in support of
ACT’s educational achievement tests: ACT
National Curriculum Survey 2002–2003 . Iowa
City, IA: Author.
ACT. (2004). Crisis at the core: Preparing all students
for college and work. Iowa City, IA: Author.
ACT. (2005a). ACT user handbook. Iowa City, IA:
Author.
ACT. (2005b). The real ACT prep guide: The only
official prep guide from the makers of the ACT.
[Lawrenceville, NJ:] Thomson Peterson’s.
ACT. (2005c). Your guide to the ACT. Iowa City, IA:
Author.
ACT, & Council of Great City Schools. (1999).
Gateways to success: A report on urban student
achievement and coursetaking. Iowa City, IA:
Authors.
BIBLIOGRAPHY
This bibliography is divided into three sections. The first section lists the
sources used in describing the ACT Program, the College Readiness Standards
for the ACT Mathematics Test, and ACT’s philosophy regarding educational
testing. The second section, which lists the sources used to develop the
instructional activities and assessments, provides suggestions for further reading
in the areas of thinking and reasoning, learning theory, and best practice. The
third section provides a list of resources suggested by classroom teachers.
(Please note that in 1996 the corporate name “The American College Testing
Program” was changed to “ACT.”)

8/20/2019 Connect CRS to Classroom MATH.pdf
http://slidepdf.com/reader/full/connect-crs-to-classroom-mathpdf 80/83
76
ACT, & The Education Trust. (2004). On course for
success: A close look at selected high school
courses that prepare all students for college. Iowa
City, IA: Authors.
Association for Supervision and Curriculum
Development (ASCD) & The Education &
Technology Resource Center. (1999). ASCD
curriculum handbook: Mathematics, A chapter of
the curriculum handbook. Alexandria, VA: Author.
Boykin, A. W., & Bailey, C. T. (2000, April). The role of
cultural factors in school relevant cognitive
functioning: Synthesis of findings on cultural
contexts, cultural orientations, and individual
differences (Center for Research on the
Education of Students Placed At Risk Report
No. 42). Retrieved June 3, 2005, from
http://www.csos.jhu.edu/crespar/techReports/
report42.pdf
Brewer, D. J., Rees, D. I., & Argys, L. M. (1995).
Detracking America’s schools: The reform without
cost? Phi Delta Kappan, 77 (3), 210–214.
Burke, K. (1992). Significant outcomes. In K. Burke
(Ed.), Authentic assessment: A collection
(pp. 201–203). Palatine, IL: IRI/Skylight
Publishing.
Gay, G. (2000). Improving the achievement of
marginalized students of color. In Including
at-risk students in standards-based reform: A
report on McREL’s Diversity Roundtable II
(pp. 3–19). (A research-based paper
presented at the November 1999
roundtable). Retrieved June 3, 2005, from
http://www.mcrel.org/PDF/Diversity/
5007IR_DiversityRT2.pdf
Goodwin, B. (2000, May). Raising the achievement of
low-performing students. Mid-continent Research
for Education and Learning Policy Brief, 1–8.
Aurora, CO: Mid-continent Research for
Education and Learning.
Hixson, J. (1993). At-risk. An excerpt from Redefining
the issues: Who’s at risk and why. Revision of apaper originally presented in 1983 at “Reducing
the Risks,” a workshop presented by the Midwest
Regional Center for Drug-Free Schools and
Communities. Retrieved June 3, 2005, from
http://www.ncrel.org/sdrs/areas/issues/students/
atrisk/at5def.htm
Holmes, O. W. (1960). The autocrat of the breakfast-
table. Everyman’s Library, No. 66. London: J. M.
Dent & Sons. (Original work published 1858)
Ingersoll, R. (1998). The problem of out-of-field
teaching. Phi Delta Kappan, 79 (10), 773–776.
Langer, J., Close, E., Angelis, J., & Preller, P. (2000,
May). Guidelines for teaching middle and junior
high school students to read and write well.
Albany, NY: National Research Center on English
Learning & Achievement.
Lapoint, V., Jordan, W., McPartland, J., & Towns, D. P.
(1996, September). The talent development high
school: Essential components (Center for
Research on the Education of Students Placed At
Risk Report No. 1). Retrieved June 3, 2005, from
http://www.csos.jhu.edu/archivedhtm/cresparold/
tdhigh1.html
Lindquist, E. F. (1958). Some requirements of and
some basic considerations concerning college entrance and college scholarship examinations
(pp. 1–6). Unpublished manuscript.
McCollum, P. (2000). Immigrant students and
standards-based reform: Examining opportunities
to learn. In Including at-risk students in
standards-based reform: A report on McREL’s
Diversity Roundtable II (pp. 20–34). (A research-
based paper presented at the November 1999
roundtable). Retrieved June 3, 2005, from
http://www.mcrel.org/PDF/Diversity/
5007IR_DiversityRT2.pdf
Means, B., & Knapp, M. S. (1991). Introduction:
Rethinking teaching for disadvantaged students.
In B. Means, C. Chelemer, & M. S. Knapp (Eds.),
Teaching advanced skills to
at-risk students: Views from research and
practice (pp. 1–26). San Francisco: Jossey-Bass.
National Assessment Governing Board. (1995?).
Mathematics framework for the 1996 National
Assessment of Educational Progress: NAEP
mathematics consensus project (developed
under Contract No. RN91084001 by The CollegeBoard). Washington, DC: U.S. Government
Printing Office.
Noeth, R. J., & Wimberly, G. L. (2002). Creating
seamless educational transitions for urban African
American and Hispanic students (ACT Policy
Report with the cooperation of the Council of
Great City Schools). Iowa City, IA: ACT, Inc.

8/20/2019 Connect CRS to Classroom MATH.pdf
http://slidepdf.com/reader/full/connect-crs-to-classroom-mathpdf 81/83
Ravitch, D. (1985). The schools we deserve:
Reflections on the educational crisis of our time.
New York: Basic Books.
Sadowski, M. (2001). Closing the gap one school at a
time. Harvard Education Letter, 17 (3), 1–5.
Cambridge, MA: Harvard Graduate School of
Education.
2. R EFERENCES FOR ACTMATHEMATICS INSTRUCTIONAL
ACTIVITIES
Association for Supervision and Curriculum
Development & The Education & Technology
Resource Center. (1995). ASCD curriculum hand-
book. Alexandria, VA: Author.
Caughlan, K., Myers, P., & Forrest, J. (n.d.). Tweaking a
trigonometric function: An exploratory lesson.
Retrieved June 3, 2005, from
http://www.nsa.gov/teachers/hs/trig01.pdf
Darling-Hammond, L. (1994, Spring). Performance-
based assessment and educational equity.
Harvard Educational Review, 64, 5–30. (Reprinted
from Ford Foundation Symposium, Equity and
educational testing and assessment [1993]. Ford
Foundation.)
Davis, K. (1994). Exploring similarity using scale
drawings.
Retrieved June 3, 2005, from www.eduref.org/
cgi-bin/printlessons.cgi/Virtual/Lessons/ Mathematics/Geometry/GEO0003.html
Demana, F., Waits, B. K., & Clemens, S. R. (1994).
Precalculus mathematics: A graphing approach
(3rd ed.). Menlo Park, CA: Addison-Wesley.
Dossey, J. A., Vonder Embse, C. B., Choike, J. R.,
Daniels, D. S., Giles, P. P., Johnson, H. C., &
Yamada, S. M. (1996). Focus on advanced
algebra. Secondary math: An integrated
approach. Menlo Park, CA: Addison-Wesley.
The Gateway to Educational Materials.Retrieved June 3, 2005, from
http://www.thegateway.org
Hoffer, A. R., Koss, R., Beckmann, J. D., Duren, P. E.,
Hernandez, J. L., Schlesinger, B. M., & Wiehe, C.
(1996). Focus on geometry. Secondary math: An
integrated approach. Menlo Park, CA: Addison-
Wesley.
Kendall, J. S., & Marzano, R. J. (1997). Content
knowledge: A compendium of standards and
benchmarks for K–12 education (2nd ed.).
Aurora, CO: Mid-continent Regional Educational
Laboratory.
Lacampagne, C. B. (1993). State of the art:
Transforming ideas for teaching and learning.
Washington, DC: United States Department of
Education. Office of Educational Research andImprovement.
Larson, R. E., Hostetler, R. P., Edwards, B. H., & Heyd,
D. E. (1995). Precalculus with limits: A graphing
approach. Lexington, MA: D. C. Heath and
Company.
Mathematical Sciences Education Board, Board on
Mathematical Sciences, & National Research
Council. (1989). Everybody counts: A report to
the nation on the future of mathematics
education. Washington, DC: National Academy
Press.
Math Forum. (1994–2005). Pascal’s triangle. Ask Dr.
Math: FAQ. Retrieved June 3, 2005, from
http://mathforum.org/dr.math/faq/
faq.pascal.triangle.html
Missouri Department of Elementary and Secondary
Education. (1996). Missouri’s framework for
curriculum development in mathematics K–12.
Jefferson City, MO: Author.
National Center for Improving Student Learning and
Achievement in Mathematics and Science.
(1997). Underlying beliefs. Principled Practice in
Mathematics and Science Education, 1(1), 14.
National Council of Teachers of Mathematics. (1989).
Curriculum and evaluation standards for school
mathematics. Reston, VA: Author.
National Council of Teachers of Mathematics. (1991).
Professional standards for teaching mathematics.
Reston, VA: Author.
National Council of Teachers of Mathematics. (1995).
Assessment standards for school mathematics.
Reston, VA: Author.
National Council of Teachers of Mathematics. (2000).
Principles and standards for school mathematics.
Reston, VA: Author.
Paul, R., Binker, A. J. A., Martin, D., & Adamson, K.
(1995). Critical thinking handbook: High school.
Santa Rosa, CA: Foundation for Critical Thinking.
77
8/20/2019 Connect CRS to Classroom MATH.pdf
http://slidepdf.com/reader/full/connect-crs-to-classroom-mathpdf 82/83
Pechman, E. M. (1991). MAP: Mathematics
assessment process for the middle grades.
User’s manual. Volume I . Raleigh, NC: Center for
Research in Mathematics and Science Education.
(Eric Document Reproduction Service No. ED 359
020).
Peressini, A. L., Epp, S. S., Hollowell, K. A., Brown, S.,
Ellis, W., McConnell, J. W., Sorteberg,
J., Thompson, D. R., Aksoy, D., Birky, G. D.,McRill, G., & Usiskin, Z. (1992). Precalculus and
discrete mathematics. University of Chicago
School Mathematics Project. Glenview, IL: Scott
Foresman.
Psychological Corporation. (1993). A handbook of
performance activities: Mathematics grades 7
through 12. Strategies for Instruction. (San
Antonio, TX): Harcourt Brace Jovanovich.
Rossman, A. J., & von Oehsen, J. B. (1997). Workshop
statistics: Discovery with data and the graphing
calculator. New York: Springer-Verlag New York.
Rubenstein, R. N., Craine, T. V., Butts, T. R., Cantrell,
K., Dritsas, L., Elswick, V. A., Kavanaugh, J.,
Munshin, S. N., Murphy, S. J., Piccolino, A.,
Quezada, S., & Walton, J. C. (1995). Integrated
mathematics 1. Evanston, IL: McDougal
Littell/Houghton Mifflin.
Rubenstein, R. N., Craine, T. V., Butts, T. R., Cantrell,
K., Dritsas, L., Elswick, V. A., Kavanaugh, J.,
Munshin, S. N., Murphy, S. J., Piccolino, A.,
Quezada, S., & Walton, J. C. (1995). Integrated mathematics 2. Evanston, IL: McDougal
Littell/Houghton Mifflin.
Rubenstein, R. N., Craine, T. V., Butts, T. R., Cantrell,
K., Dritsas, L., Elswick, V. A., Kavanaugh, J.,
Munshin, S. N., Murphy, S. J., Piccolino, A.,
Quezada, S., & Walton, J. C. (1995). Integrated
mathematics 3. Evanston, IL: McDougal
Littell/Houghton Mifflin.
Rubenstein, R. N., Schultz, J. E., Senk, S. L.,
Hackworth, M., McConnell, J. W., Viktora, S. S.,
Aksoy, D., Flanders, J., Kissane, B., & Usiskin, Z.(1992). Functions, statistics, and trigonometry.
University of Chicago School Mathematics
Project. Glenview, IL: Scott Foresman.
Schaeffer, R. L., Gnanadesikan, M., Watkins, A., &
Witmer, J. A. (1996). Activity-based statistics:
Student guide. New York: Springer-Verlag
New York.
Secada, W. G. (1997). Understanding in mathematics
& science. Principled Practice in Mathematics
and Science Education, 1(1), 8–9.
Senk, S. L., Thompson, D. R., Vistora, S. S.,
Rubenstein, R., Halvorson, J., Flanders, J.,
Jakucyn, N., Pillsbury, G., & Usiskin, Z. (1993).
Advanced algebra. University of Chicago School
Mathematics Project. Glenview, IL: Scott
Foresman.
Serra, M. (1993). Discovering geometry: An inductive
approach. Berkeley, CA: Key Curriculum Press.
Stenmark, J. K. (Ed.). (1991). Mathematics
assessment: Myths, models, good questions, and
practical suggestions. Reston, VA: National
Council of Teachers of Mathematics.
Usiskin, Z., Hirschhorn, D., Coxford, A., Highstone, V.,
Lewellen, H., Oppong, N., DiBianca, R., & Maeir,
M. (1997). Geometry (2nd ed.). University of
Chicago School Mathematics Project. Glenview,
IL: Scott Foresman/Addison-Wesley.
Weisstein, E. W. (1999). Pascal’s triangle. Retrieved
January 4, 2006, from Mathworld —A Wolfram
Web Resource.
http://mathworld.wolfram.com/PascalsTriangle.htm
Zemelman, S., Daniels, H., & Hyde, A. (1993). Best practice: New standards for teaching and
learning in America’s schools. Portsmouth, NH:
Heinemann.
78

8/20/2019 Connect CRS to Classroom MATH.pdf
http://slidepdf.com/reader/full/connect-crs-to-classroom-mathpdf 83/83
3. R ESOURCES SUGGESTED BY
CLASSROOM TEACHERS
(All retrieved by ACT June 3, 2005.)
bigchalk The Education Network.
http://www.bigchalk.com
Cloudnet. Multicultural Math Activities.
http://www.cloudnet.com/~edrbsass/
edmulticult.htm#math
Educational REALMS: Resources for Engaging Active
Learners in Math and Science.
http://www.stemworks.org/realmshomepage.html
The Educator’s Reference Desk.
http://www.eduref.org
The Gateway to Educational Materials.
http://www.thegateway.org
Johns Hopkins University & Howard University Center
for Research on the Education of Students Placed
at Risk (CRESPAR).
http://www.csos.jhu.edu/crespar/crespar.html
Learning Network.
http://www.teachervision.com
The Math Forum. Math Forum @ Drexel.
http://mathforum.org
Mathematical Association of America (MAA). MAA
Bookstore.
http://www.maa.org/ecomtpro/timssnet/common/
tnt_frontpage.cfm
Minority Student Achievement (MSA) Network.
http://www.eths.k12.il.us/MSA/msanetwork.html
National Council of Teachers of Mathematics.
Illuminations: Principles & Standards for
School Mathematics.
http://illuminations.nctm.org/standards.aspx
Northwest Regional Educational Laboratory. Library in
the Sky.
http://www.nwrel.org/sky/
Northwest Regional Educational Laboratory.
Mathematics and Science Education Center.
http://www.nwrel.org/msec/
PBS TeacherSource – Math.
http://www.pbs.org/teachersource/math.htm
Texas Instruments. EXPLORATIONS™ Curricular
Materials.
http://education.ti.com/us/activity/books/
overview.html
U.S. Department of Education. Education Resource
Organizations Directory.
http://bcol02.ed.gov/Programs/EROD/
org_list.cfm?category_ID=SEA