congress should adopt american families plan’s permanent
TRANSCRIPT

1
May 24, 2021
Congress Should Adopt American Families Plan’s Permanent Expansions of Child Tax Credit and EITC,
Make Additional Provisions Permanent By Chuck Marr, Kris Cox, Stephanie Hingtgen, and Katie Windham
Key tax credit provisions in President Biden’s American Families Plan would provide significant
help to all but the highest-income families with children and to low-paid working adults without children. The plan would extend through 2025 the American Rescue Plan Act’s Child Tax Credit expansion and make permanent the Act’s provision making the full credit available to children whose parents have low or no earnings. It would also make permanent the Act’s expansion of the Earned Income Tax Credit (EITC) for adults not raising children. Congress should adopt these proposed changes, which would result in reductions of child poverty and provide income support for millions of people. And it should go two steps further: it should make all of the Rescue Plan’s Child Tax Credit expansion permanent, as House Ways and Means Chairman Richard Neal recently proposed, and make certain immigrant children who have an Individual Taxpayer Identification Number (ITIN) rather than a Social Security number eligible for the credit.
In 2018 the Child Tax Credit and EITC together lifted more children above the poverty line, 5.5
million, than any other economic support program.1 This level of poverty reduction was achieved through multiple expansions of the EITC and Child Tax Credit since their respective enactments in 1975 and 1997. The American Rescue Plan Act, by making a significant set of changes to the Child Tax Credit, will lift another 4.1 million children above the poverty line, cutting the number of children in poverty by more than 40 percent, we estimate. Permanently enacting these historic provisions — along with the Rescue Plan’s EITC expansion, which will stop the federal tax code from taxing millions of workers without children into or deeper into poverty — would be a landmark achievement, and should be an urgent priority for policymakers in the upcoming recovery bill.
Congress should make the complete set of Rescue Plan Act expansions permanent, including its
provisions that: Make the full Child Tax Credit available to all children except those with the highest
incomes. The Rescue Plan Act makes the full Child Tax Credit available (sometimes called making
1 These credits lifted 5.5 million children above the poverty line in 2018 and 5.1 million children in 2017.
1275 First Street NE, Suite 1200 Washington, DC 20002 Tel: 202-408-1080 Fax: 202-408-1056 [email protected] www.cbpp.org
2
it “fully refundable”) to children whose parents previously would have been eligible for a partial credit or no credit at all because their earnings were too low or they didn’t have earnings in a year. Like all of the Child Tax Credit changes in the Rescue Plan, this change is currently only in place for 2021. The Rescue Plan also increases for one year the credit’s maximum amount to $3,000 per child and $3,600 for children under age 6 and expands the credit to cover 17-year-olds. (The Rescue Plan Act’s increase in the maximum credit amount begins to phase out for single filers making $75,000, heads of households making $112,500, and married couples making $150,000.) The American Families Plan would make permanent the Rescue Plan’s provision making the full Child Tax Credit available and would extend through 2025 the Act’s maximum credit increase and the inclusion of 17-year-olds. Congress should make all of these changes permanent.
Prior to the Rescue Plan some 27 million children — including roughly half of all Black and
Latino children and a similar share of rural children — received less than the then-maximum credit of $2,000 per child because their parents earned too little, even as middle- and higher-income families received the full amount. The Act’s changes will lift roughly 4.1 million children above the poverty line — cutting the number of children in poverty by more than 40 percent. They also will lift about 1.1 million children above half the poverty line (referred to as “deep poverty”). Black and Latino children in particular, whom the prior credit disproportionately left out or left behind, will benefit.
Make an overdue EITC increase for low-paid working adults not raising children in the
home. The EITC is a powerful wage subsidy, but before the Rescue Plan it suffered from a glaring flaw: it largely excluded workers not raising children, providing only a tiny credit to a very small number of these workers. The Families Plan would fix this flaw permanently by extending the Rescue Plan’s one-year provisions raising both the maximum EITC for workers without children from roughly $540 to roughly $1,500, and the income cap for these adults to qualify from about $16,000 to at least $21,000. It would also permanently expand the age range of eligible workers without children to include younger adults aged 19-24 (excluding students under 24 who are attending school at least part time), as well as people aged 65 and over. This expansion would provide income support to over 17 million working adults without children who do important work for low pay. That includes some 5.8 million people aged 19 to 65 whom the federal tax code would otherwise tax into, or deeper into, poverty — the lone group for whom that happens — in large part because their EITC would be too low without an extension of the Rescue Plan’s expanded provisions.2
In addition to making these permanent changes, Congress should permanently make children with
ITINs eligible for the Child Tax Credit. (For tax purposes, non-citizen children who do not have Social Security numbers may use ITINs.) A 2017 tax law change revoked their eligibility; restoring it would help their families meet basic needs and decrease hardship while better positioning these children, and in turn the future economy, for later success.
Expanded Child Tax Credit Would Cause Historic Reduction in Child Poverty
Raising the incomes of children growing up in poverty through policies such as the Child Tax Credit can make an important difference in children’s lives now and in the long term, according to a
2 This estimate excludes full-time students aged 19-23, who under current law can be claimed by their parents as qualifying children for the larger EITC for families with children.

3
congressionally chartered report issued in 2019 by a National Academy of Sciences (NAS) panel on child poverty. “The weight of the causal evidence does indeed indicate that income poverty itself causes negative child outcomes, especially when poverty occurs in early childhood or persists throughout a large portion of childhood,” the panel concluded. The better outcomes that are linked with stronger income assistance include healthier birthweights, lower maternal stress (measured by reduced stress hormone levels in the bloodstream), better childhood nutrition, higher school enrollment, higher reading and math test scores, higher high school graduation rates, less use of drugs and alcohol, and higher rates of college entry. The NAS panel devised two packages of policy proposals aimed at cutting child poverty in half, one of which included as a centerpiece a $2,700-per-child “child allowance” that is very similar to the American Rescue Plan Act’s expanded Child Tax Credit.3 (The NAS plan included several other substantial components, including an EITC expansion, in addition to the Act’s expanded Child Tax Credit.)
The Child Tax Credit expansion in President Biden’s American Families Plan would deliver
significant additional income to low-income children and their families. It would make the full credit available to about 27 million children in families that didn’t qualify for the full credit prior to the Rescue Plan because their parents lacked earnings or had earnings that were too low.4 (See Appendix Table 1 for estimates by state.) That includes roughly half of all Black children and half of all Latino children, whose families (along with other families of color) are overrepresented in low-paid work and face worse employment prospects due to historical and ongoing discrimination in education, housing, employment, and criminal justice that has systematically limited opportunity.5 Similarly, about half of children who live in rural areas would benefit from making the full credit available, which is not surprising because the median yearly wage for year-round workers is lower (by roughly 19 percent) in rural than in metro areas.6 Of the 27 million children who would get the full credit permanently, an estimated 9.9 million are Latino, 8.8 million are white, 5.7 million are Black, and 813,000 are Asian.7 (See Appendix Table 2 for state-specific estimates by race/ethnicity.)
3 National Academies of Sciences, Engineering, and Medicine, A Roadmap to Reducing Child Poverty, National Academies Press, 2019, https://www.nap.edu/read/25246. 4 Robert Greenstein et al., “Improving the Child Tax Credit for Very Low-Income Families,” US Partnership on Mobility from Poverty, April 2018, https://www.mobilitypartnership.org/improving-child-tax-credit-very-low-income-families. 5 Jacob Goldin and Katherine Michelmore, “Who Benefits From the Child Tax Credit?” National Bureau of Economic Research, October 2020, https://www.nber.org/papers/w27940; Danilo Trisi and Matt Saenz, “Economic Security Programs Reduce Overall Poverty, Racial and Ethnic Inequities,” Center on Budget and Policy Priorities, January 28, 2021, https://www.cbpp.org/research/poverty-and-inequality/economic-security-programs-reduce-overall-poverty-racial-and-ethnic. Even in the relatively strong pre-pandemic economy, 1 in 3 Black (33 percent) and Latino (34 percent) workers earned below-poverty wages, as did nearly 1 in 5 white workers (19 percent). Economic Policy Institute, State of Working America Data Library, “Poverty-level wages,” 2019, https://www.epi.org/data/#?subject=povwage.
6 Rural communities are diverse; about one-quarter of rural residents identify as Black, Latino, Asian, American Indian, Alaska Native, Native Hawaiian, or other Pacific Islander, or identify with more than one race. Chuck Marr et al., “Expanding Child Tax Credit and Earned Income Tax Credit Would Benefit More Than 10 Million Rural Residents, Strongly Help Rural Areas,” Center on Budget and Policy Priorities, August 6, 2020, https://www.cbpp.org/research/federal-tax/expanding-child-tax-credit-and-earned-income-tax-credit-would-benefit-more. 7 Racial and ethnic categories in this report do not overlap unless otherwise noted; figures for each racial group such as Black or Asian do not include individuals who identify as multiracial or of Latino ethnicity. Latino includes all people of Hispanic, Latino, or Spanish origin regardless of race. Data are not available for people living in the territories.

4
In addition to making the full credit available to low- and no-income families, the Families Plan’s Child Tax Credit proposal also would increase the amount of the credit to $3,000 per child and $3,600 per child under 6 and make 17-year-olds eligible for the credit. The Administration proposes to make these two changes — the increase in the maximum credit and eligibility for 17-year-olds —through 2025. The full Families Plan’s Child Tax Credit would lift an estimated 4.1 million children above the poverty line, of whom 1.6 million are Latino, 1.2 million are white, 930,000 are Black, and 132,000 are Asian. Black and Latino children would disproportionately benefit due to many of the same barriers mentioned previously that affect their families’ economic security.8 Of the roughly 9.9 million children it would lift above or closer to the poverty line, 3.8 million are Latino, 2.9 million are white, 2.1 million are Black, and 426,000 are Asian.9 These changes would reduce the number of children in poverty by more than 40 percent nationally. (See Appendix Table 3 for state-specific estimates of reductions in child poverty rates by race/ethnicity.)
Restore Credit Eligibility for Children With ITINs
In the upcoming recovery bill Congress should also restore Child Tax Credit eligibility to children with ITINs. A provision in the 2017 tax law denied the credit to such children— even though there is generally broad support to grant legal status or take other steps to encourage them to finish their education and equip them for future success in our communities and economy. The country has a stake in ensuring that these children get the resources they need to realize their potential. And a permanent Child Tax Credit would help up to 675,000 of them and their families meet basic needs and decrease hardship.10
What the Credits Can Mean for Families
All of the Rescue Plan’s Child Tax Credit expanded provisions are central to its historic projected impact on child poverty and should be included in upcoming recovery legislation. The Families Plan would make permanent the crucial provision that makes the full credit available to children whose families lack earnings or have low earnings. But the Rescue Plan’s increase in the maximum credit and inclusion of 17-year-olds are also significant — accounting for roughly half of the Act’s anti-poverty effects, we estimate. In other words, making the Rescue Plan’s complete Child Tax Credit expansion permanent would essentially double the impact of just making the credit fully available on a permanent basis.
8 The credit would lift above the poverty line an estimated 9.4 percent of Black children, 8.5 percent of Latino children, and 3.3 percent of white children. 9 Figures for children identified as American Indian or Alaska Native (AIAN) are particularly sensitive to how the racial category is defined. Among the roughly 1.6 million children identified as AIAN alone or in combination, regardless of Latino ethnicity, 124,000 would be lifted above the poverty line and 280,000 would be lifted above or closer to the poverty line by the Act’s Child Tax Credit expansion. (If we apply the non-overlapping categories this report uses for other groups, only 555,000 children are considered AIAN alone, not Latino; 50,000 of them would be lifted above the poverty line and 112,000 of them would be lifted above or closer to the poverty line by the Child Tax Credit expansion.)
CBPP analysis of the U.S. Census Bureau’s March 2019 Current Population Survey (for national total) allocated by race or ethnicity based on CBPP analysis of American Community Survey (ACS) data for 2016-2018, using 2021 tax parameters and incomes adjusted for inflation to 2021 dollars. These calculations use the Supplemental Poverty Measure, which counts more forms of income than the “official” poverty measure (among other differences). 10 Jeffery Passel and D’Vera Cohn, “U.S. Unauthorized Immigrant Total Dips to Lowest Level in a Decade,” Pew Research Center, November 27, 2018, https://www.pewresearch.org/hispanic/2018/11/27/most-unauthorized-immigrants-live-with-family-members/. Pew estimated that 675,000 non-citizen children lacked legal documentation in 2016 and therefore can only qualify for an ITIN and not a Social Security number.

5
Upcoming recovery legislation should incorporate the Families Plan and make the complete
Rescue Plan expansion permanent to ensure that families continue to receive expanded Child Tax Credits for more than this year. To see what these actions can mean to individual families, consider these examples:
• A single mother of a toddler and a second-grader, who earns $10,000 a year providing in-
home care to older people (with work hours that fluctuate significantly from month to month), received a Child Tax Credit of $1,125 prior to the Rescue Plan. The proposed Families Plan would expand her credit through 2025 — continuing the Rescue Plan’s 2021 expansion — and she would receive $3,600 for her toddler and $3,000 for her second-grader, for a total of $6,600 (a gain of $5,475 relative to 2020). Under the proposed Families Plan, however, her credit amount would fall back to just $2,000 in 2026 (assuming the same annual income), underscoring the urgency for permanence.
• A single mother with a 4-year-old daughter and 8-year-old son, who is out of work for the year due to a health condition, would have received no Child Tax Credit at all prior to the Rescue Plan, adding to the family’s financial insecurity. Under the Rescue Plan, this year she will receive the full Child Tax Credit of $3,600 for her daughter and $3,000 for her son to help with the children’s expenses. The American Families Plan would ensure that this family would permanently receive the full Child Tax Credit. The credit’s maximums would remain at the higher amounts ($3,000 for children age 6-17, $3,600 for children under age 6) if Congress makes all of the Rescue Plan’s provisions permanent, but they would fall back to $2,000 in 2026 under the Families Plan.
• A married couple in which one spouse earns $20,000 as a short-order cook and the other cares for their 3-year-old son and 7-year-old daughter received a credit of $2,625 prior to the Rescue Plan — well below the $4,000 credit that a higher-income family with two children would have received. Under the Rescue Plan, they will receive the full Child Tax Credit of $3,600 for their son and $3,000 for their daughter, for a family gain of $3,975. The Families Plan would extend these gains through 2025, after which their overall credit amount would fall to $2,000 — below the credit they received even before the Rescue Plan’s enactment. (In 2026 the maximum credit per child would revert to the pre-2017-law amount of $1,000.)
• And to look beyond the provisions’ anti-poverty outcomes to their broader effects, where almost 90 percent of children benefit, consider a married couple with combined income of $125,000. (One spouse makes $75,000 as a dental hygienist and the other makes $50,000 as a property manager and they have 8-year-old twin daughters.) This family’s Child Tax Credit rose from $4,000 to $6,000 under the American Rescue Plan. This boost would continue through 2025 under the Families Plan but would fall to a total of $2,000 in 2026, or $4,000 below the proposed levels if the expansion is not made permanent.11
Extending all the provisions in the Rescue Plan would provide important help to people in a myriad of jobs that pay little and often have fluctuating schedules and lack benefits that many others take for granted, such as paid sick days. That includes people caring for those who are elderly, driving buses, cooking and serving meals, and doing many other kinds of work whose importance the pandemic has only further revealed. (See Table 1.)
11 All examples are in 2021 dollars.

6
An estimated 65.6 million children — almost 90 percent of all children — would receive a larger Child Tax Credit under this permanent expansion, which would deliver economic support to large numbers of children in every state, including 31.9 million white children, 17.5 million Latino children, 9.4 million Black children, and 2.8 million Asian children.12 (See Appendix Table 4.) The only two groups that wouldn’t benefit are children in high-income households and children who lack a Social Security number because of their immigration status, a group that often struggles to make ends meet.
TABLE 1
People in Selected Essential Occupations Who Would Benefit Each Year From Permanent Expansion of Child Tax Credit Relative to before American Rescue Plan’s temporary expansion
Occupation Number of workers
who would gain
Workers who would gain as a share of all workers aged 18 and older in occupation
Truck and delivery drivers 1,069,000 27% Cashiers 1,048,000 30% First-line supervisors/managers of retail sales workers 994,000 29%
Nursing, psychiatric, and home health aides 801,000 35% Janitors and building cleaners 682,000 27% Cooks 661,000 29% Personal and home care aides 497,000 31% Child care workers 474,000 36% Miscellaneous agricultural workers 381,000 38% Food preparation workers 315,000 28% Medical assistants 292,000 46% Health practitioner support technicians 219,000 31% Bus drivers 186,000 29% Hand packers and packagers 173,000 26% First-line supervisors/managers of food preparation and serving workers 164,000 26%
All occupations 46,694,000 28% Source: CBPP estimates based on U.S. Census Bureau’s March 2019 Current Population Survey, using 2021 tax parameters and incomes adjusted for inflation to 2021 dollars. Estimates reflect a pre-pandemic economy.
12 Among the roughly 1.6 million children identified as AIAN alone or in combination, regardless of Latino ethnicity, about 1.5 million would benefit from this Child Tax Credit expansion. (If we apply the non-overlapping categories this report uses for other groups, only 555,000 children are considered AIAN alone, not Latino; about 524,000 of them would benefit from this expansion.)
CBPP analysis of the U.S. Census Bureau’s March 2019 Current Population Survey (for national total) allocated by race or ethnicity based on CBPP analysis of American Community Survey (ACS) data for 2016-2018, using 2021 tax parameters and incomes adjusted for inflation to 2021 dollars.
7
A Meaningful EITC for Workers Without Children The American Families Plan would make permanent the American Rescue Plan Act’s expansion
of the EITC for adults not raising children in their homes and who work hard at important, but low-paid, jobs. This permanent expansion would benefit over 17 million of these adults. The EITC is a highly successful wage subsidy that’s earned bipartisan support over the years. But prior to the Rescue Plan, it largely excluded adults who weren’t raising children in their homes, and it completely excluded young workers without children trying to gain a toehold in the labor market.
Adults not raising children were the lone group that the federal tax code actually taxed into, or
deeper into, poverty prior to the Rescue Plan, partly because their EITC was so meager. Some 5.8 million workers aged 19-65 (excluding full-time students aged 19-23) without children — including about 2.7 million white, 1.5 million Latino, 1 million Black, and 253,000 Asian workers — were taxed into or deeper into poverty.13 The shares of such Latino and Black workers are disproportionately high (about 26 percent are Latino and 18 percent are Black, compared to 19 percent and 12 percent of the population, respectively), again reflecting historical barriers to economic opportunity that have led to their overrepresentation in low-paid work.
For workers without children, the Families Plan would make permanent the increase in the
maximum EITC from roughly $540 to roughly $1,500 and raise the income limit to qualify from about $16,000 to at least $21,000. It would also make permanent the expansion in the age range of workers without children eligible for the tax credit to include younger adults aged 19-24 (excluding students under 24 who are attending school at least part time), as well as people 65 and over.14
To see how this would benefit these workers, consider a 25-year-old single woman who works
roughly 30 hours a week throughout 2021 as a cashier at a convenience store and earns about $9 an hour. Her annual earnings of $13,800 are just above the poverty line of $13,745 for a single individual. Prior to the Rescue Plan, federal taxes would have pushed her into poverty:
• Some $1,056 — 7.65 percent of her earnings — is withheld from her paychecks for Social
Security and Medicare payroll taxes.
• When filing income taxes, she can claim the $12,550 standard deduction, which leaves her with $1,250 in taxable income. Since she is in the 10 percent tax bracket, she owes $125 in federal income tax.
• Thus, her combined federal income and payroll tax liability, not counting the EITC, is $1,181. Prior to the Rescue Plan, she would have received a small EITC of $165, so her net federal income and payroll tax liability would have been $1,016.
13 CBPP estimates based on the U.S. Census Bureau’s March 2019 Current Population Survey, using 2021 tax parameters and incomes adjusted for inflation to 2021 dollars. The estimates count all workers aged 19-65 (excluding full-time students aged 19-23) who are pushed below the Census poverty thresholds — or further below them — by their federal income tax liability (if any) and the employee share of the payroll tax. The estimate excludes full-time students aged 19-23 because, under current law, their parents can claim them as qualifying children for the larger EITC for families with children. Poverty status is determined at the level of the tax filing unit. We use the 2020 Census official poverty threshold appropriate for the tax unit based on the number and age of the tax unit members, inflated to 2021 dollars. 14 The Act also extends eligibility to former foster youth and youth experiencing homelessness starting at age 18.

8
• In other words, her earnings were just above the poverty line, but federal taxes would have pushed her income about $961 below the poverty line.
• Under the Rescue Plan, her EITC will grow to $1,164, raising her income after federal income and payroll taxes to $38 above the poverty line. The American Families Plan would make this permanent, keeping her from being taxed into poverty in 2022 and beyond.
TABLE 2 Working Adults Without Children in Selected Essential Occupations Who Would Benefit Each Year From Permanent EITC Expansion in American Families Plan Relative to before American Rescue Plan’s temporary expansion
Occupation Number of workers who would gain
Workers who would gain as a share of all workers
aged 19 and older in occupation
Cashiers 1,074,000 33% Retail salespersons 673,000 20% Cooks 660,000 30% Janitors and building cleaners 537,000 21% Laborers and freight, stock, and material movers, by hand
534,000 24%
Personal and home care aides 468,000 29% Truck and delivery drivers 412,000 10% Nursing, psychiatric, and home health aides
385,000 17%
Stock clerks and order fillers 384,000 26% Food preparation workers 315,000 30% Child care workers 304,000 24% First-line supervisors/managers of retail sales workers
253,000 7%
Hand packers and packagers 204,000 32% Miscellaneous agricultural workers 182,000 19% Dishwashers 105,000 51% Bus drivers 71,000 11% All occupations 17,445,000 11%
Note: Workers without children counted as benefiting from the American Families Plan EITC expansion are those aged 19 and older (excluding students under age 24 attending school at least part time).
Source: CBPP estimates based on U.S. Census Bureau’s March 2019 Current Population Survey, using tax year 2021 tax rules and incomes adjusted for inflation to 2021 dollars. Estimates reflect a pre-pandemic economy.
The Rescue Plan’s EITC expansion will benefit an estimated 17.4 million workers nationwide
without children, including roughly 9.7 million white, 3.6 million Latino, 2.7 million Black, and

9
816,000 Asian working adults.15 The Families Plan would make this crucial EITC expansion permanent. (See Appendix Table 5 for estimates by state and by race/ethnicity.)
The top occupations that would benefit permanently include cashiers, food preparers and servers,
and home health aides. (See Table 2.) Again, the pandemic has helped the nation better understand and appreciate these workers and millions of others who work for low pay and the essential role they play in keeping this economy running. They deserve more than the meager EITC in prior law, and the Families Plan Act would provide concrete, meaningful help.
15 Among the roughly 1.4 million workers aged 19 and over without children (excluding students under age 24 attending school at least part time) who identify as AIAN alone or in combination, regardless of Latino ethnicity, 365,000 would benefit from the EITC expansion in the American Families Plan. (If we apply the non-overlapping categories this report uses for other groups, only 530,000 workers aged 19 and over without children, excluding students under age 24 attending school at least part time, identify as AIAN alone, not Latino; 140,000 of them would benefit from the Families Plan’s EITC expansion.)
CBPP analysis of the U.S. Census Bureau’s March 2019 Current Population Survey (for national total) allocated by race or ethnicity based on CBPP analysis of American Community Survey (ACS) data for 2016-2018, using 2021 tax parameters and incomes adjusted for inflation to 2021 dollars.

10
Appendix
APPENDIX TABLE 1
Estimated Number of Children Who Would Benefit Each Year From Permanent Expansion of Child Tax Credit, by State
Relative to before American Rescue Plan’s temporary expansion
State
Children under 17 previously left
out of full $2,000 credit
who would benefit from permanent expansion
Children under 18 lifted above poverty line by
permanent expansion
Children under 18 lifted above
or closer to poverty line by
permanent expansion
Children under 18 who would benefit from permanent expansion
Share of children under 18 who would benefit
from permanent expansion
Total U.S. 27,000,000 4,120,000 9,894,000 65,560,000 89% Alabama 480,000 76,000 162,000 1,020,000 93% Alaska 53,000 11,000 21,000 166,000 89% Arizona 692,000 109,000 238,000 1,507,000 92% Arkansas 323,000 47,000 94,000 661,000 93% California 3,524,000 582,000 1,690,000 7,844,000 86% Colorado 346,000 56,000 132,000 1,106,000 87% Connecticut 199,000 30,000 80,000 604,000 81% Delaware 67,000 9,000 24,000 181,000 89% District of Columbia 53,000 9,000 25,000 93,000 75% Florida 1,730,000 275,000 700,000 3,833,000 91% Georgia 1,044,000 165,000 353,000 2,269,000 90% Hawai’i 92,000 15,000 44,000 277,000 91% Idaho 153,000 16,000 37,000 410,000 93% Illinois 982,000 150,000 338,000 2,536,000 87% Indiana 558,000 78,000 175,000 1,452,000 92% Iowa 197,000 24,000 49,000 668,000 91% Kansas 218,000 29,000 58,000 651,000 92% Kentucky 422,000 66,000 143,000 929,000 92% Louisiana 530,000 89,000 187,000 1,027,000 92% Maine 75,000 10,000 21,000 229,000 90% Maryland 352,000 56,000 159,000 1,120,000 83% Massachusetts 356,000 57,000 161,000 1,099,000 80% Michigan 810,000 114,000 249,000 1,968,000 90% Minnesota 322,000 43,000 85,000 1,122,000 87% Mississippi 351,000 55,000 115,000 677,000 94% Missouri 502,000 70,000 153,000 1,260,000 91% Montana 78,000 10,000 21,000 209,000 91% Nebraska 141,000 18,000 36,000 434,000 91% Nevada 271,000 38,000 86,000 634,000 92%

11
APPENDIX TABLE 1
Estimated Number of Children Who Would Benefit Each Year From Permanent Expansion of Child Tax Credit, by State
Relative to before American Rescue Plan’s temporary expansion
State
Children under 17 previously left
out of full $2,000 credit
who would benefit from permanent expansion
Children under 18 lifted above poverty line by
permanent expansion
Children under 18 lifted above
or closer to poverty line by
permanent expansion
Children under 18 who would benefit from permanent expansion
Share of children under 18 who would benefit
from permanent expansion
New Hampshire 52,000 8,000 20,000 221,000 85% New Jersey 561,000 93,000 257,000 1,599,000 81% New Mexico 245,000 32,000 71,000 454,000 93% New York 1,552,000 250,000 681,000 3,554,000 86% North Carolina 926,000 135,000 306,000 2,085,000 90% North Dakota 39,000 4,000 10,000 157,000 91% Ohio 950,000 128,000 277,000 2,367,000 91% Oklahoma 398,000 59,000 114,000 894,000 93% Oregon 291,000 40,000 92,000 778,000 89% Pennsylvania 893,000 137,000 310,000 2,363,000 89% Rhode Island 67,000 8,000 23,000 185,000 89% South Carolina 476,000 67,000 151,000 1,025,000 93% South Dakota 67,000 9,000 19,000 196,000 91% Tennessee 635,000 92,000 211,000 1,393,000 92% Texas 3,086,000 489,000 1,078,000 6,686,000 91% Utah 233,000 32,000 69,000 859,000 92% Vermont 30,000 4,000 8,000 104,000 89% Virginia 532,000 89,000 249,000 1,586,000 85% Washington 477,000 66,000 159,000 1,433,000 87% West Virginia 170,000 22,000 50,000 346,000 93% Wisconsin 366,000 45,000 93,000 1,158,000 90% Wyoming 35,000 4,000 11,000 128,000 93%
Notes: Estimates reflect a pre-pandemic economy, using tax year 2021 tax rules and incomes adjusted for inflation to 2021 dollars. Children left out prior to the American Rescue Plan’s temporary Child Tax Credit expansion received less than full $2,000 per child because their parents lacked earnings or had earnings that were too low. Source: For children left out of the full $2,000 Child Tax Credit, Tax Policy Center national estimate allocated by state based on CBPP analysis of American Community Survey (ACS) data for 2016-2018. For remaining columns, CBPP analysis of the March 2019 Current Population Survey (CPS) (for national total) allocated by state based on CBPP analysis of ACS data for 2016-2018. Poverty calculations also use U.S. Census Bureau Supplemental Poverty Measure research files for the ACS.

12
APPENDIX TABLE 2
Estimated Number of Children Under 17 Left Out of Full $2,000 Child Tax Credit Prior to American Rescue Plan’s Temporary Expansion, by State and Race/Ethnicity
State Total White Latino Black Asian
Another race or multiple
races
Total U.S. 27,000,000 8,763,000 9,904,000 5,738,000 813,000 1,782,000 Alabama 480,000 181,000 55,000 220,000 3,000 22,000 Alaska 53,000 15,000 N/A N/A N/A 27,000 Arizona 692,000 153,000 407,000 39,000 8,000 84,000 Arkansas 323,000 157,000 56,000 86,000 N/A 22,000 California 3,524,000 450,000 2,480,000 227,000 221,000 146,000 Colorado 346,000 120,000 176,000 19,000 8,000 22,000 Connecticut 199,000 53,000 92,000 37,000 7,000 10,000 Delaware 67,000 19,000 17,000 26,000 N/A N/A District of Columbia 53,000 N/A 8,000 43,000 N/A N/A
Florida 1,730,000 466,000 657,000 498,000 26,000 84,000 Georgia 1,044,000 273,000 221,000 473,000 21,000 57,000 Hawai’i 92,000 9,000 19,000 N/A 16,000 47,000 Idaho 153,000 95,000 46,000 N/A N/A 10,000 Illinois 982,000 295,000 352,000 265,000 26,000 44,000 Indiana 558,000 307,000 96,000 107,000 11,000 36,000 Iowa 197,000 120,000 32,000 24,000 5,000 16,000 Kansas 218,000 106,000 65,000 23,000 4,000 20,000 Kentucky 422,000 292,000 38,000 59,000 5,000 27,000 Louisiana 530,000 160,000 41,000 296,000 5,000 28,000 Maine 75,000 62,000 N/A N/A N/A 6,000 Maryland 352,000 82,000 85,000 148,000 13,000 24,000 Massachusetts 356,000 119,000 146,000 50,000 21,000 22,000 Michigan 810,000 406,000 97,000 232,000 16,000 60,000 Minnesota 322,000 133,000 57,000 74,000 23,000 36,000 Mississippi 351,000 103,000 16,000 215,000 N/A 15,000 Missouri 502,000 296,000 46,000 112,000 5,000 43,000 Montana 78,000 51,000 N/A N/A N/A 21,000 Nebraska 141,000 65,000 47,000 13,000 5,000 11,000 Nevada 271,000 53,000 142,000 42,000 10,000 23,000 New Hampshire 52,000 40,000 N/A N/A N/A N/A New Jersey 561,000 144,000 252,000 122,000 23,000 20,000 New Mexico 245,000 34,000 166,000 3,000 N/A 42,000 New York 1,552,000 471,000 574,000 316,000 123,000 69,000

13
APPENDIX TABLE 2
Estimated Number of Children Under 17 Left Out of Full $2,000 Child Tax Credit Prior to American Rescue Plan’s Temporary Expansion, by State and Race/Ethnicity
State Total White Latino Black Asian
Another race or multiple
races
North Carolina 926,000 300,000 241,000 300,000 18,000 66,000 North Dakota 39,000 20,000 N/A N/A N/A 12,000 Ohio 950,000 512,000 91,000 249,000 11,000 88,000 Oklahoma 398,000 153,000 100,000 51,000 4,000 90,000 Oregon 291,000 146,000 102,000 10,000 8,000 25,000 Pennsylvania 893,000 428,000 192,000 196,000 25,000 54,000 Rhode Island 67,000 22,000 30,000 8,000 N/A N/A South Carolina 476,000 156,000 66,000 220,000 4,000 30,000 South Dakota 67,000 28,000 6,000 N/A N/A 30,000 Tennessee 635,000 314,000 93,000 188,000 7,000 33,000 Texas 3,086,000 476,000 2,040,000 430,000 60,000 79,000 Utah 233,000 129,000 74,000 N/A 4,000 19,000 Vermont 30,000 26,000 N/A N/A N/A N/A Virginia 532,000 194,000 102,000 179,000 17,000 39,000 Washington 477,000 191,000 173,000 32,000 20,000 61,000 West Virginia 170,000 145,000 4,000 9,000 N/A N/A Wisconsin 366,000 171,000 75,000 73,000 13,000 34,000 Wyoming 35,000 22,000 8,000 N/A N/A 4,000
Notes: Figures are rounded to the nearest 1,000 and may not sum to totals due to rounding. N/A indicates reliable data are not available due to small sample size. Estimates reflect a pre-pandemic economy, using tax year 2021 tax rules and incomes adjusted for inflation to 2021 dollars. Children left out prior to the American Rescue Plan’s temporary Child Tax Credit expansion received less than the full $2,000 per child because their parents lacked earnings or had earnings that were too low. Racial and ethnic categories do not overlap; figures for each racial group such as Black, white, or Asian do not include individuals who identify as multiracial or people of Latino ethnicity. Latino includes all people of Hispanic, Latino, or Spanish origin regardless of race. Due to limitations of the Census data, the figures do not reflect IRS rules that require children to have a Social Security number to qualify for the Child Tax Credit. This omission likely has little effect on most of the estimates shown here; the Latino share of children left out, however, may be somewhat overstated.
Source: Tax Policy Center national estimate allocated by state and by race or ethnicity based on CBPP analysis of American Community Survey (ACS) data for 2016-2018.

14
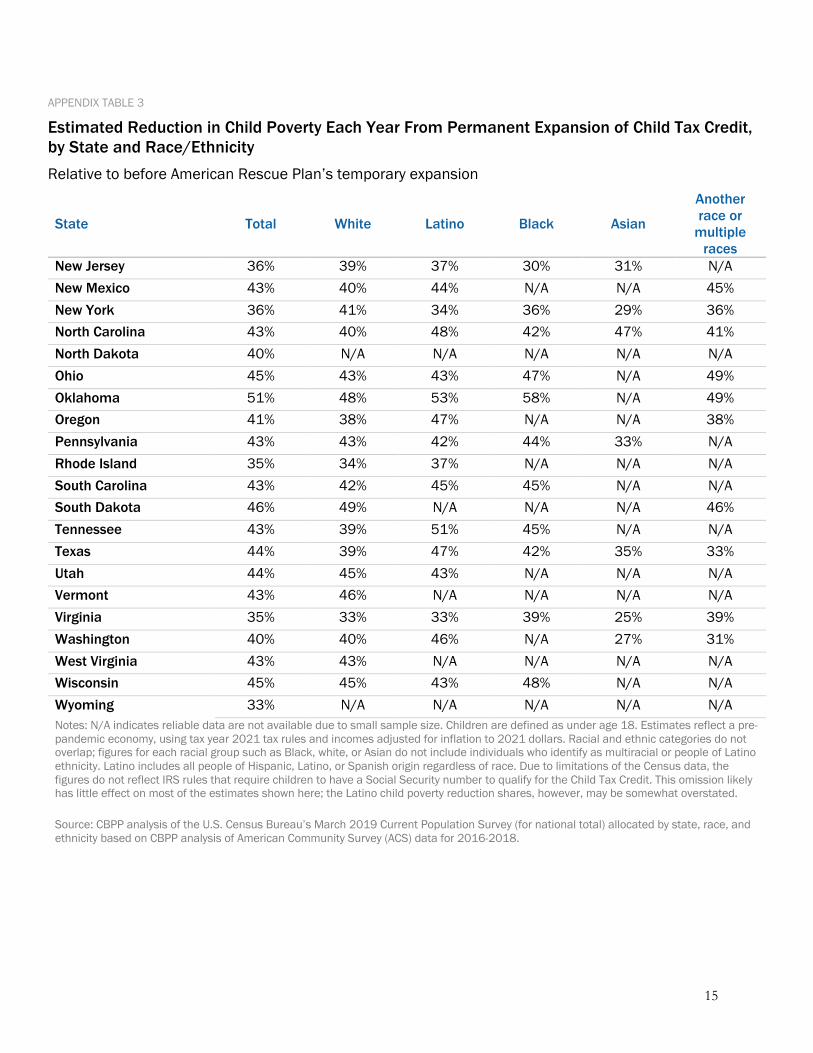
APPENDIX TABLE 3
Estimated Reduction in Child Poverty Each Year From Permanent Expansion of Child Tax Credit, by State and Race/Ethnicity Relative to before American Rescue Plan’s temporary expansion
State Total White Latino Black Asian
Another race or
multiple races
Total U.S. 41% 40% 41% 42% 30% 41%
Alabama 46% 42% 56% 48% N/A N/A Alaska 51% 41% N/A N/A N/A 50% Arizona 45% 38% 47% 51% N/A 45% Arkansas 48% 47% 58% 46% N/A N/A California 34% 30% 35% 33% 26% 32% Colorado 41% 40% 42% N/A N/A N/A Connecticut 36% 40% 33% 42% N/A N/A Delaware 38% 36% N/A N/A N/A N/A District of Columbia 35% N/A N/A 37% N/A N/A Florida 38% 36% 39% 40% 25% 42% Georgia 46% 41% 52% 46% 37% 41% Hawaii 34% N/A N/A N/A N/A 36% Idaho 42% 43% N/A N/A N/A N/A Illinois 43% 42% 45% 44% 38% 42% Indiana 43% 43% 45% 44% N/A N/A Iowa 48% 51% N/A N/A N/A N/A Kansas 47% 44% 51% N/A N/A N/A Kentucky 44% 44% 50% 44% N/A N/A Louisiana 47% 42% 44% 50% N/A N/A Maine 45% 46% N/A N/A N/A N/A Maryland 34% 33% 34% 36% N/A N/A Massachusetts 34% 33% 39% 33% 28% N/A Michigan 44% 43% 52% 43% N/A 46% Minnesota 48% 45% 47% 55% N/A 52% Mississippi 47% 43% N/A 46% N/A N/A Missouri 44% 44% 41% 45% N/A N/A Montana 45% 40% N/A N/A N/A 55% Nebraska 46% 45% 55% N/A N/A N/A Nevada 43% 38% 45% 40% N/A 53% New Hampshire 39% 39% N/A N/A N/A N/A
15
APPENDIX TABLE 3
Estimated Reduction in Child Poverty Each Year From Permanent Expansion of Child Tax Credit, by State and Race/Ethnicity Relative to before American Rescue Plan’s temporary expansion
State Total White Latino Black Asian
Another race or
multiple races
New Jersey 36% 39% 37% 30% 31% N/A New Mexico 43% 40% 44% N/A N/A 45% New York 36% 41% 34% 36% 29% 36% North Carolina 43% 40% 48% 42% 47% 41% North Dakota 40% N/A N/A N/A N/A N/A Ohio 45% 43% 43% 47% N/A 49% Oklahoma 51% 48% 53% 58% N/A 49% Oregon 41% 38% 47% N/A N/A 38% Pennsylvania 43% 43% 42% 44% 33% N/A Rhode Island 35% 34% 37% N/A N/A N/A South Carolina 43% 42% 45% 45% N/A N/A South Dakota 46% 49% N/A N/A N/A 46% Tennessee 43% 39% 51% 45% N/A N/A Texas 44% 39% 47% 42% 35% 33% Utah 44% 45% 43% N/A N/A N/A Vermont 43% 46% N/A N/A N/A N/A Virginia 35% 33% 33% 39% 25% 39% Washington 40% 40% 46% N/A 27% 31% West Virginia 43% 43% N/A N/A N/A N/A Wisconsin 45% 45% 43% 48% N/A N/A Wyoming 33% N/A N/A N/A N/A N/A Notes: N/A indicates reliable data are not available due to small sample size. Children are defined as under age 18. Estimates reflect a pre-pandemic economy, using tax year 2021 tax rules and incomes adjusted for inflation to 2021 dollars. Racial and ethnic categories do not overlap; figures for each racial group such as Black, white, or Asian do not include individuals who identify as multiracial or people of Latino ethnicity. Latino includes all people of Hispanic, Latino, or Spanish origin regardless of race. Due to limitations of the Census data, the figures do not reflect IRS rules that require children to have a Social Security number to qualify for the Child Tax Credit. This omission likely has little effect on most of the estimates shown here; the Latino child poverty reduction shares, however, may be somewhat overstated. Source: CBPP analysis of the U.S. Census Bureau’s March 2019 Current Population Survey (for national total) allocated by state, race, and ethnicity based on CBPP analysis of American Community Survey (ACS) data for 2016-2018.

16
APPENDIX TABLE 4
Estimated Number of Children Under 18 Who Would Benefit Each Year From Permanent Expansion of Child Tax Credit, by State and Race/Ethnicity Relative to before American Rescue Plan’s temporary expansion
State Total White Latino Black Asian
Another race or multiple
races
Total U.S. 65,560,000 31,912,000 17,548,000 9,377,000 2,759,000 3,964,000 Alabama 1,020,000 575,000 78,000 316,000 12,000 39,000 Alaska 166,000 78,000 16,000 4,000 9,000 59,000 Arizona 1,507,000 563,000 695,000 69,000 34,000 146,000 Arkansas 661,000 412,000 84,000 120,000 8,000 38,000 California 7,844,000 1,756,000 4,473,000 411,000 771,000 434,000 Colorado 1,106,000 591,000 377,000 48,000 31,000 59,000 Connecticut 604,000 305,000 166,000 77,000 24,000 32,000 Delaware 181,000 88,000 30,000 48,000 6,000 10,000 District of Columbia 93,000 10,000 15,000 63,000 N/A N/A
Florida 3,833,000 1,536,000 1,227,000 790,000 88,000 193,000 Georgia 2,269,000 942,000 348,000 790,000 73,000 115,000 Hawai’i 277,000 36,000 53,000 3,000 66,000 120,000 Idaho 410,000 307,000 77,000 N/A 4,000 19,000 Illinois 2,536,000 1,231,000 682,000 410,000 106,000 107,000 Indiana 1,452,000 1,025,000 166,000 164,000 27,000 71,000 Iowa 668,000 520,000 69,000 31,000 16,000 33,000 Kansas 651,000 427,000 125,000 39,000 15,000 46,000 Kentucky 929,000 726,000 56,000 86,000 14,000 47,000 Louisiana 1,027,000 502,000 70,000 391,000 13,000 50,000 Maine 229,000 202,000 6,000 7,000 N/A 12,000 Maryland 1,120,000 430,000 187,000 373,000 57,000 73,000 Massachusetts 1,099,000 628,000 236,000 109,000 63,000 62,000 Michigan 1,968,000 1,299,000 168,000 329,000 53,000 119,000 Minnesota 1,122,000 760,000 103,000 115,000 62,000 82,000 Mississippi 677,000 323,000 30,000 296,000 6,000 23,000 Missouri 1,260,000 905,000 86,000 172,000 20,000 78,000 Montana 209,000 163,000 12,000 N/A N/A 33,000 Nebraska 434,000 297,000 79,000 23,000 11,000 24,000 Nevada 634,000 213,000 270,000 63,000 35,000 53,000 New Hampshire 221,000 188,000 15,000 4,000 6,000 8,000 New Jersey 1,599,000 683,000 487,000 241,000 123,000 66,000

17
APPENDIX TABLE 4
Estimated Number of Children Under 18 Who Would Benefit Each Year From Permanent Expansion of Child Tax Credit, by State and Race/Ethnicity Relative to before American Rescue Plan’s temporary expansion
State Total White Latino Black Asian
Another race or multiple
races
New Mexico 454,000 102,000 281,000 5,000 5,000 61,000 New York 3,554,000 1,592,000 955,000 582,000 265,000 160,000 North Carolina 2,085,000 1,047,000 354,000 487,000 55,000 142,000 North Dakota 157,000 122,000 8,000 N/A N/A 19,000 Ohio 2,367,000 1,674,000 146,000 355,000 44,000 148,000 Oklahoma 894,000 465,000 157,000 72,000 15,000 185,000 Oregon 778,000 484,000 185,000 17,000 28,000 64,000 Pennsylvania 2,363,000 1,549,000 303,000 320,000 75,000 116,000 Rhode Island 185,000 102,000 50,000 14,000 6,000 12,000 South Carolina 1,025,000 542,000 96,000 319,000 14,000 54,000 South Dakota 196,000 140,000 11,000 6,000 N/A 37,000 Tennessee 1,393,000 893,000 136,000 274,000 23,000 65,000 Texas 6,686,000 1,939,000 3,488,000 803,000 242,000 215,000 Utah 859,000 629,000 156,000 10,000 13,000 50,000 Vermont 104,000 94,000 N/A N/A N/A N/A Virginia 1,586,000 818,000 230,000 336,000 83,000 119,000 Washington 1,433,000 791,000 332,000 59,000 85,000 165,000 West Virginia 346,000 306,000 8,000 13,000 N/A 17,000 Wisconsin 1,158,000 807,000 143,000 104,000 37,000 67,000 Wyoming 128,000 99,000 19,000 N/A N/A 9,000
Notes: Figures are rounded to the nearest 1,000 and may not sum to totals due to rounding. N/A indicates reliable data are not available due to small sample size. Estimates reflect a pre-pandemic economy, using tax year 2021 tax rules and incomes adjusted for inflation to 2021 dollars. Racial and ethnic categories do not overlap; figures for each racial group such as Black, white, or Asian do not include individuals who identify as multiracial or people of Latino ethnicity. Latino includes all people of Hispanic, Latino, or Spanish origin regardless of race. Due to limitations of the Census data, the figures do not reflect IRS rules that require children to have a Social Security number to qualify for the Child Tax Credit. This omission likely has little effect on most of the estimates shown here; the Latino share of children benefiting, however, may be somewhat overstated. Source: CBPP analysis of the U.S. Census Bureau’s March 2019 Current Population Survey (for national total) allocated by state and by race or ethnicity based on CBPP analysis of American Community Survey (ACS) data for 2016-2018.

18
APPENDIX TABLE 5
Estimated Number of Working Adults Without Children Who Would Benefit Each Year From Permanent EITC Expansion in American Families Plan, by State and Race/Ethnicity Relative to before American Rescue Plan’s temporary expansion
State Total White Latino Black Asian Another race or multiple
races
Total U.S. 17,445,400 9,658,700 3,639,600 2,739,300 815,700 592,100 Alabama 274,300 157,100 15,200 92,000 4,000 6,000 Alaska 38,900 20,400 N/A N/A 3,100 10,500 Arizona 385,200 196,800 130,900 22,700 10,800 24,000 Arkansas 173,700 118,500 12,800 34,200 2,800 5,300 California 2,070,100 668,800 941,300 138,100 247,600 74,300 Colorado 293,300 197,700 61,600 15,200 8,900 10,000 Connecticut 160,900 88,700 37,100 23,800 6,100 5,300 Delaware 46,500 25,500 4,600 13,200 1,500 1,700 District of Columbia 33,200 9,100 4,500 17,300 N/A N/A
Florida 1,323,000 629,200 401,300 232,400 30,500 29,700 Georgia 569,900 261,700 62,700 214,600 18,600 12,300 Hawai’i 71,700 17,100 7,300 N/A 24,100 21,700 Idaho 104,300 86,200 13,100 N/A N/A 3,500 Illinois 620,700 353,100 113,500 113,100 28,800 12,300 Indiana 367,100 273,700 27,100 47,900 8,000 10,500 Iowa 171,400 146,200 9,000 9,400 3,100 3,600 Kansas 163,700 118,900 20,100 15,700 2,900 6,100 Kentucky 256,000 205,600 11,200 30,600 2,900 5,700 Louisiana 281,900 137,600 17,800 115,900 4,900 5,700 Maine 85,300 79,400 N/A N/A N/A 2,400 Maryland 263,300 115,400 36,600 87,600 16,200 7,400 Massachusetts 299,500 197,200 46,500 26,800 19,500 9,500 Michigan 571,000 407,600 33,300 98,900 13,700 17,700 Minnesota 276,300 210,800 17,900 23,100 11,700 12,800 Mississippi 166,500 79,600 6,500 76,400 1,900 2,200 Missouri 338,800 257,400 15,800 50,500 6,500 8,600 Montana 77,900 67,800 2,600 N/A N/A 6,100 Nebraska 101,000 75,900 11,900 7,300 N/A 3,600 Nevada 175,300 78,100 53,500 20,100 14,400 9,100 New Hampshire 66,400 59,900 N/A N/A N/A N/A

19
APPENDIX TABLE 5
Estimated Number of Working Adults Without Children Who Would Benefit Each Year From Permanent EITC Expansion in American Families Plan, by State and Race/Ethnicity Relative to before American Rescue Plan’s temporary expansion
State Total White Latino Black Asian Another race or multiple
races
New Jersey 388,400 168,600 116,700 69,300 25,200 8,700 New Mexico 132,000 48,500 64,100 4,300 1,800 13,300 New York 982,700 463,500 235,500 158,900 98,100 26,600 North Carolina 593,900 334,300 63,800 161,200 13,800 20,700 North Dakota 39,300 29,100 2,900 N/A N/A 3,300 Ohio 651,600 473,900 27,500 119,200 13,000 17,900 Oklahoma 229,200 141,900 26,500 25,100 3,700 32,000 Oregon 255,300 191,100 35,700 6,200 9,900 12,300 Pennsylvania 662,700 475,200 59,000 93,700 21,200 13,500 Rhode Island 47,600 32,300 9,300 2,500 N/A N/A South Carolina 303,300 164,800 21,600 104,600 4,800 7,400 South Dakota 49,800 37,500 N/A N/A N/A 8,200 Tennessee 381,400 262,100 25,100 80,500 6,300 7,400 Texas 1,505,300 532,800 674,800 212,800 55,100 29,700 Utah 142,300 103,600 26,100 N/A 4,700 5,800 Vermont 37,200 34,000 N/A N/A N/A N/A Virginia 415,700 230,000 46,600 105,000 20,900 13,300 Washington 358,300 233,300 54,600 19,500 24,800 26,100 West Virginia 102,900 90,200 2,700 7,300 N/A 1,700 Wisconsin 303,700 240,700 18,500 28,300 6,600 9,600 Wyoming 35,500 30,400 2,900 N/A N/A 1,700
Note: Figures are rounded to the nearest 100 and may not sum to totals due to rounding. N/A indicates reliable data are not available due to small sample size. Estimates reflect a pre-pandemic economy, using tax year 2021 tax rules and incomes adjusted for inflation to 2021 dollars. Workers without children counted as benefiting from the American Families Plan EITC expansion are those aged 19 and older (excluding students under age 24 attending school at least part time). Racial and ethnic categories do not overlap; figures for each racial group such as Black, white, or Asian do not include individuals who identify as multiracial or people of Latino ethnicity. Latino includes all people of Hispanic, Latino, or Spanish origin regardless of race. Due to limitations of the Census data, the figures do not reflect IRS rules that require all EITC family members to have a Social Security number. This omission likely has little effect on most of the estimates shown here; the Latino share of those benefiting, however, may be somewhat overstated. Source: CBPP analysis of the March 2019 Current Population Survey (for national total) allocated by state and by race or ethnicity based on CBPP analysis of American Community Survey (ACS) data for 2016-2018.