confronting the tradeoffs in medicaid cost containment
TRANSCRIPT
Confronting The Tradeoffs In Medicaid Cost Containment
A Report of the Citizens Budget Commission February 2004

Medicaid Draft w i
FOREWORD
Founded in 1932, the Citizens Budget Commission (CBC) is a nonprofit, nonpartisan civic organization devoted to influencing constructive change in the finances and services of New York State and New York City governments. This report was prepared under the auspices of the CBC’s Budget Policy Committee, which we co-chaired in 2003. The other members of the Committee are: Lawrence D. Ackman, Stephen Berger, Lawrence B. Buttenwieser, Karen Daly, Evan A. Davis, Stephen DeGroat, Cheryl Cohen Effron, Roger Einiger, Laurel FitzPatrick, Paul E. Francis, Bud H. Gibbs, Kenneth D. Gibbs, James F. Haddon, Jeffrey Halis, Walter Harris, Fred P. Hochberg, Eugene J. Keilin, Peter C. Kornman, Robert Kurtter, Stephen F. Langowski, Richard A. Levine, Jeffrey Lynford, Donna Lynne, Norman N. Mintz, Robert E. Poll, Lester Pollack, Carol Raphael, Laraine S. Rothenberg, Heather Ruth, Edward L. Sadowsky, William G. Salter, Bart Schwartz, Teddy Selinger, Jonathan Siegfried, Richard J. Sirota, Adam Solomon, Joan Steinberg, Merryl H. Tisch, Leslie Daniels Webster, Stephen H. Weiss, H. Dale Hemmerdinger, ex-officio.
The Budget Policy Committee is responsible for developing the CBC’s recommendations for changes in the budget for the City of New York between the time it is proposed by the Mayor in his January Preliminary Financial Plan and adopted by the City Council in June. Similarly, the Committee develops recommendations for changes in the State budget between the time the Governor releases his Executive Budget in January and the Legislature eventually adopts a budget in the Spring. In 2003, the Commission’s positions were presented in a report on the State budget, Looking Beyond Fiscal Year 2004: Guidelines for Resolving New York State’s Fiscal Crisis, released in March, and a report on the City budget, The City’s Budget Gap Since 9/11: Factors That Caused It, and Plans to Close It, also released in March. A common pressure on the State and City budgets is the rapid growth in spending for Medicaid. For this reason, the Committee asked the CBC staff to explore ways to control Medicaid expenditures. In a series of meetings that reviewed analyses prepared by the staff, the Committee identified the important tradeoffs inherent in trying to curb Medicaid expenditures. This report reflects the Committee’s thinking on how to address these difficult tradeoffs in ways that best reflect the values most important to the future fiscal and economic health of New York City and New York State, including a deep concern for the ability of poorer New Yorkers to have access to needed medial care.
Research for the report was initiated by Elizabeth Lynam, former Director of State Studies. She worked with Sheila Spiezio, a CBC research consultant, and Selma Mustovic, Research Associate, and they completed the data collection and analysis in the fall and winter of 2003-04. The research was conducted under the direction of Charles Brecher, Director of Research and Executive Vice President, and the report was written by Charles Brecher and Sheila Spiezio. Eugene J. Keilin Heather L. Ruth February 20, 2004

ii w Citizens Budget Commission

Medicaid Draft w iii
TABLE OF CONTENTS
FOREWORD........................................................................................................................ I
EXECUTIVE SUMMARY ..................................................................................................V
INTRODUCTION ................................................................................................................1
CATEGORIES AND CONCEPTS .......................................................................................3
CATEGORIES OF ELIGIBILITY................................................................................................3 CATEGORIES OF SERVICES ....................................................................................................8 FINANCING RESPONSIBILITIES ............................................................................................11 COST CONTAINMENT CONCEPTS .........................................................................................11
ELIGIBILITY – LIMITING “MEDICALLY-NEEDY” LOOPHOLES .............................13
RATE SETTING – PAY ONLY FOR COMPETITIVE COSTS.........................................17
HOSPITAL PAYMENTS..........................................................................................................17 NURSING HOME PAYMENTS.................................................................................................20 INTERMEDIATE CARE FACILITIES .......................................................................................21
RATIONALIZING UTILIZATION PATTERNS...............................................................21
MORE MANAGED CARE PARTICIPATION .............................................................................22 LIMITING EXCESSIVE PERSONAL CARE SERVICES ...............................................................23
RETAIN THE CURRENT SCOPE OF BENEFITS ...........................................................25
FISCAL AND OTHER IMPLICATIONS...........................................................................26
FISCAL IMPLICATIONS.........................................................................................................26 OTHER IMPLICATIONS.........................................................................................................29
APPENDIX I ......................................................................................................................32
APPENDIX II.....................................................................................................................37

iv w Citizens Budget Commission
Confronting the Tradeoffs in Medicaid Cost Containment w v
EXECUTIVE SUMMARY
Medicaid is a joint federal-state program intended to help people with limited income obtain medical and related health care services. In New York State, Medicaid is quite successful in achieving this goal. More than 3.4 million New Yorkers benefit directly by receiving a comprehensive range of Medicaid-financed services. In addition, Medicaid payments to hospitals and clinics help enable those institutions to provide care to New Yorkers who do not qualify for Medicaid, but who lack health insurance. While its benefits are clear and widely supported, Medicaid’s costs are far more controversial. In New York, total spending for Medicaid of $36 billion in fiscal year 2003 represented nearly 40 percent of total State expenditures. The portion of the Medicaid program paid for with State-raised revenues (as distinct from federal aid and local government contributions) totaled $12.6 billion or more than one-quarter of all State spending financed with State revenues. Medicaid consumes so large a share of State expenditures because it has been growing at an extraordinary pace. In the last 15 years, Medicaid spending grew at an annual rate of more than 9 percent, compared to total State spending growth of 3.1 percent. If the State’s share of Medicaid funding had grown at the same rate as its total budget, then the State would have had $7.3 billion available in fiscal year 2003 for other purposes such as public school aid and higher education or for tax cuts (rather than recent tax increases).
It is possible to reverse the trend in Medicaid spending and lower Medicaid expenditures by about $4.6 billion annually, without reducing the program’s effectiveness in helping low-income New Yorkers obtain needed care. These significant savings are feasible because New York now spends in ways that are far less efficient than practices followed in other states. New York’s cost per person enrolled in the program, $7,646 annually, is nearly double the national average of $3,936, and is well above second place Maine at $6,820. The Recommendations
The recommended measures to lower Medicaid costs follow three strategies—limiting eligibility, lowering payment rates, and rationalizing utilization patterns. For each strategy, New York’s practices were compared to national norms. The potential gains and sacrifices of bringing New York’s Medicaid program more in line with programs in the rest of the nation are explored in the full report. Estimates of potential savings related to each strategy are summarized below. These estimates are based on federal fiscal year 2000 and are, in fact, likely to be greater in future years. Eligibility – Limiting “Medically Needy” Loopholes. State laws and county administrative practices have created large loopholes in Medicaid eligibility standards that enable many middle-class and wealthier individuals to qualify for Medicaid-financed
vi w Citizens Budget Commission
long-term care including nursing homes and personal care at home. These loose standards include allowing spouses to refuse to contribute to the support of individuals requiring care, and permitting individuals to transfer assets to relatives immediately before seeking home care from Medicaid.
More careful design and better enforcement of eligibility rules for the elderly and disabled will reduce the number of such people receiving Medicaid funded nursing home and home care services by about 24,000 or 8 percent of the current 300,000 individuals in New York State receiving long-term care. Given New York’s high costs for these individuals ($25,137 compared to a national average of $12,647), the savings from fewer such eligibles would reach $608 million annually. Payment Rates – Pay Only for Competitive Costs. New York State pays hospitals and nursing homes substantially more than is required to meet competitive standards for wages and quality of care. For hospitals the excess over an appropriate benchmark is about 13 percent per admission, and for nursing homes it is about 29 percent per day. For a third type of institution, intermediate care facilities for those with disabilities and requiring supervision and care, the differential ranges from 16 to 55 percent depending on the size and type of facility.
Limiting Medicaid provider payments to rates based on competitive costs would save about $2.5 billion annually. Lower hospital rates would account for about $620 million; lower nursing home rates would save about $1.4 billion annually. For the intermediate care facilities the annual savings is estimated at $423 million annually. Rationalize Utilization – More Managed Care Participation. Most states view managed care, when implemented properly, as a “win-win” arrangement under which taxpayers save money and needy clients get better care. As a result, nationally Medicaid managed care participation has risen from 40 percent of all Medicaid eligibles in 1996 to 57 percent in 2002, the latest year for which national figures are available. However, New York was slow to join the managed care movement and in 2002 its participation rate was only 45 percent. In September 2003 the New York rate reached 47 percent, but the national rate also likely was continuing to grow. New York lags national norms because it exempts most elderly and disabled Medicaid enrollees. Efforts should be made to build the capacity among managed care organizations to manage care for these groups effectively. They are the most expensive beneficiaries, and there is strong evidence of ineffective utilization patterns among these groups, particularly for acute care in the form of repeated and unnecessary hospitalizations. A suitable goal would be to enroll about one-third of the elderly and disabled eligibles, or about 350,000 individuals, in a managed care plan. A reasonable estimate is that effective managed care would reduce the acute care costs for this population by 15 percent. This would yield savings of $489 million annually. Rationalize Utilization – Limit Excessive Personal Care Services. New York’s program of personal care for the elderly and disabled living at home pays for many more
Confronting the Tradeoffs in Medicaid Cost Containment w vii
hours of home attendant services for tasks such as housekeeping and shopping than is permitted in any other state. The number of hours of such home care paid for by Medicaid in New York averages 30 per week compared to 11 hours per week in the rest of the country.
Bringing use of personal care services more in line with national norms would save about $1.0 billion annually. This assumes that the average number of hours of personal care authorized for clients, who number more than 69,000, can be reduced from the current average to a figure still 50 percent above the national average; that is, from an average of 30 to 17 hours per week. The Tradeoffs in Medicaid Cost Containment The recommendations for savings are intended to reduce costs significantly while protecting needy New Yorkers from loss of access to medical care. But eliminating over $4.6 billion in Medicaid expenditures would not be painless for everyone. Other constituencies have a stake in this spending, and they would need to make adjustments. The smallest savings result from transferring long-term care costs for nursing homes and home care services from Medicaid to families with adequate means. The changes in policy should be phased in to avoid hardships or abrupt displacement of individuals, but the goal should be clearly set. Medicaid should not be a mechanism for the middle class to avoid family responsibilities or a substitute for private long-term care insurance. The payment rate reductions would present challenges to those who now manage hospitals and nursing homes. They would have to become more innovative and find ways to maintain services with lower revenues, but they would not be asked to do any more than their counterparts in other states already are achieving. Once adjustments are made for differences in regional costs and in case-mix, there is no justification for paying institutions in New York more than those in the rest of the country. The notable qualification to this point is that New York’s hospitals make a case for higher payments based on their greater commitment to graduate medical education. But it makes little or no sense for New Yorkers to underwrite this educational mission with state and local dollars, because the physicians trained in New York practice elsewhere once they complete their residencies. The policy objective to which hospital leaders should adjust is a smaller role for New York hospitals in graduate medical education, rather than continued extra financial support in order to play the bigger educational role. Both the payment rate changes and the utilization changes would lower the total amount spent on health care services in the state. (In contrast, the eligibility changes would shift the sources of the spending from the public to the private sector, but not necessarily lower the amount.) In addition to reducing revenues for institutions, these lower expenditures would also reduce the number of workers needed to provide health care services in the state. The non-eligibility-related savings would translate into employment reductions of about 64,000 jobs statewide. This would be about a 5.5 percent
viii w Citizens Budget Commission
reduction in employment in the state’s health care industry. Careful plans should be made to help affected workers adjust to this change, but the goal should remain getting New York’s health care costs and utilization in line with competitive standards rather than employing people unproductively.
It must be stressed that the $4.6 billion in savings will not disappear from the New York State economy; the money will be available for other public services (or for private spending, if taxes are lowered). The shifted expenditures will create other types of jobs and total employment in the state need not be reduced. One final point should be made about the responses to the proposed Medicaid savings. Because these expenditures are financed one-half by the federal government, half the savings would accrue to the federal budget. This could remove some of the money from the New York economy (depending on the assumptions made about how the federal government uses the money). In order for the adverse impacts of the Medicaid reductions to be minimized, State leaders should negotiate with federal officials to incorporate some “budget neutral” arrangement with the federal government. That is, as with many federal waiver programs, a major cost-cutting initiative in New York should allow New Yorkers to share the benefits obtained by the federal government as a result of the State’s efforts.
Confronting the Tradeoffs in Medicaid Cost Containment w 1
INTRODUCTION
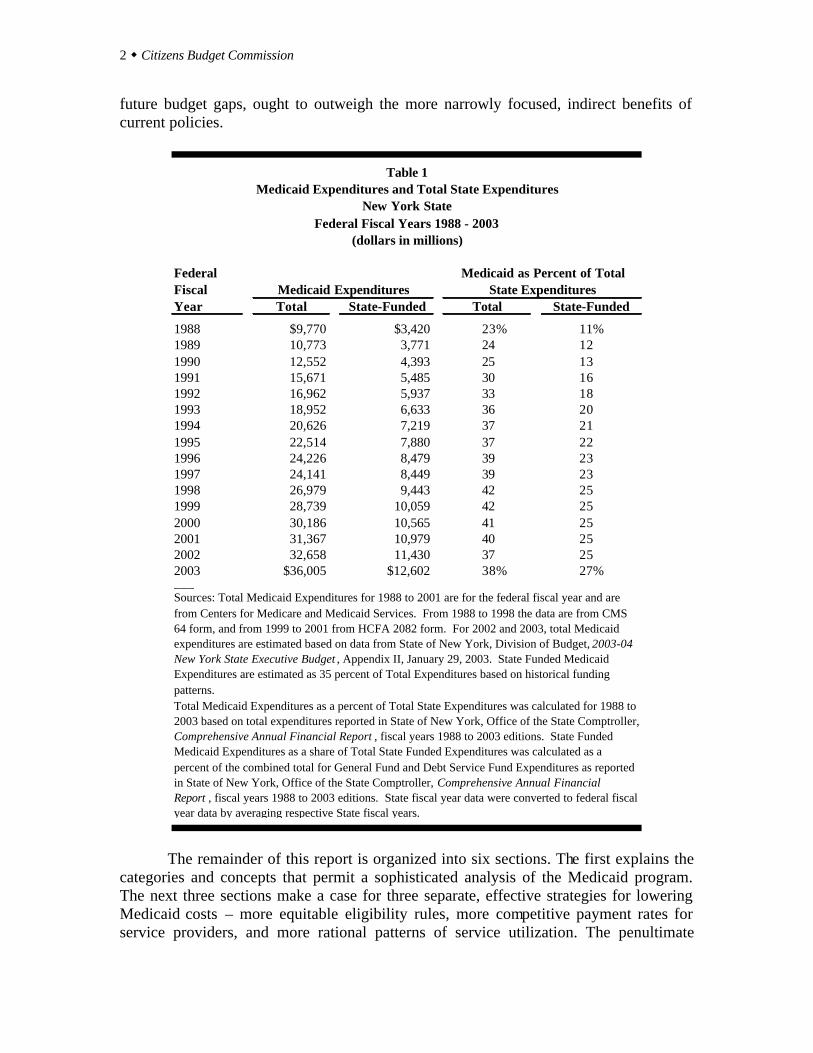
Medicaid is a joint federal-state program intended to help people with limited income obtain medical and related health care services. In New York State, Medicaid is quite successful in achieving this goal. More than 3.4 million New Yorkers benefit directly by receiving a comprehensive range of Medicaid-financed services. In addition, Medicaid payments to hospitals and clinics help enable those institutions to provide care to New Yorkers who do not qualify for Medicaid, but who lack health insurance. While its benefits are clear and widely supported, Medicaid’s costs are far more controversial. In New York, total spending for Medicaid of $36 billion in fiscal year 2003 represented nearly 40 percent of total State expenditures. The portion of the Medicaid program paid for with State-raised revenues (as distinct from federal aid and local government contributions) totaled $12.6 billion or more than one-quarter of all State spending financed with State revenues. (See Table 1.) Medicaid consumes so large a share of State expenditures because it has been growing at an extraordinary pace. In the last 15 years, Medicaid spending grew at an annual rate of more than 9 percent, compared to total State spending growth of 3.1 percent. If the State’s share of Medicaid funding had grown at the same rate as its total budget, then the State would have had $7.3 billion available in fiscal year 2003 for other purposes such as public school aid and higher education or for tax cuts (rather than recent tax increases).
This report makes the case that it is possible to reverse the trend in Medicaid spending and lower Medicaid expenditures by about $4.6 billion annually, without reducing the program’s effectiveness in helping low-income New Yorkers obtain needed care. These significant savings are feasible because New York now spends in ways that are far less efficient than practices followed in other states. New York’s cost per person enrolled in the program, $7,646 annually, is nearly double the national average of $3,936, and is well above second place Maine at $6,820.1
Such savings are desirable because they will free State resources for other uses that will make New York more competitive with other jurisdictions. However, it should be recognized that while those needing care will not be harmed by the proposed cost-saving measures, there are other tradeoffs. Indirect costs will be borne by some workers whose jobs may be eliminated, but they will have other opportunities and the alternative uses of the public funds will generate additional jobs. The managers of the hospitals and nursing homes providing care will have to find ways to operate more efficiently, but they will be asked only to run their institutions as well as their counterparts in other states. The broad benefits of a more cost-effective Medicaid program, which include job growth made possible by more competitive state and local tax burdens and more manageable
1 Expenditure and beneficiary data from Centers for Medicare and Medicaid Services, MSIS Statistical Reports for Federal Fiscal Year 2000, <cms.hhs.gov/medicaid/msis/msis00sr.asp>, (September 02, 2003).
2 w Citizens Budget Commission
future budget gaps, ought to outweigh the more narrowly focused, indirect benefits of current policies.
Federal FiscalYear Total State-Funded Total State-Funded
1988 $9,770 $3,420 23% 11%1989 10,773 3,771 24 121990 12,552 4,393 25 131991 15,671 5,485 30 161992 16,962 5,937 33 181993 18,952 6,633 36 201994 20,626 7,219 37 211995 22,514 7,880 37 221996 24,226 8,479 39 231997 24,141 8,449 39 231998 26,979 9,443 42 251999 28,739 10,059 42 252000 30,186 10,565 41 252001 31,367 10,979 40 252002 32,658 11,430 37 252003 $36,005 $12,602 38% 27%___
Total Medicaid Expenditures as a percent of Total State Expenditures was calculated for 1988 to 2003 based on total expenditures reported in State of New York, Office of the State Comptroller, Comprehensive Annual Financial Report , fiscal years 1988 to 2003 editions. State Funded Medicaid Expenditures as a share of Total State Funded Expenditures was calculated as a percent of the combined total for General Fund and Debt Service Fund Expenditures as reported in State of New York, Office of the State Comptroller, Comprehensive Annual Financial Report , fiscal years 1988 to 2003 editions. State fiscal year data were converted to federal fiscal year data by averaging respective State fiscal years.
Sources: Total Medicaid Expenditures for 1988 to 2001 are for the federal fiscal year and are from Centers for Medicare and Medicaid Services. From 1988 to 1998 the data are from CMS 64 form, and from 1999 to 2001 from HCFA 2082 form. For 2002 and 2003, total Medicaid expenditures are estimated based on data from State of New York, Division of Budget, 2003-04 New York State Executive Budget , Appendix II, January 29, 2003. State Funded Medicaid Expenditures are estimated as 35 percent of Total Expenditures based on historical funding patterns.
Table 1Medicaid Expenditures and Total State Expenditures
New York StateFederal Fiscal Years 1988 - 2003
Medicaid ExpendituresMedicaid as Percent of Total
State Expenditures
(dollars in millions)
The remainder of this report is organized into six sections. The first explains the categories and concepts that permit a sophisticated analysis of the Medicaid program. The next three sections make a case for three separate, effective strategies for lowering Medicaid costs – more equitable eligibility rules, more competitive payment rates for service providers, and more rational patterns of service utilization. The penultimate
Confronting the Tradeoffs in Medicaid Cost Containment w 3
section explains more fully why elimination of some types of benefits is not an appropriate cost-cutting strategy. The concluding section estimates the savings from each of the recommended strategies and considers why these fiscal benefits are worth the associated tradeoffs. An Appendix compares the recommendations in this report to those recently presented by a task force created by the State Senate, a working group established by the Governor and to proposals in the Governor’s Executive Budget for fiscal year 2004-05.
CATEGORIES AND CONCEPTS
Medicaid is not just an exceptionally large program, it also is an extraordinarily complex one. Most analysts examine Medicaid in terms of subgroups based on the type of people served and the type of service provided. The first subsection below describes New York State’s Medicaid program using categories of eligibility; the second uses categories of services; the third subsection describes the financing arrangements for each type of service. The last subsection presents four conceptual approaches to analyzing expenditure changes. Categories of Eligibility Medicaid is a joint federal-state program authorized in 1965. States have the option of whether or not to establish a program; New York has had one since 1967, and all 50 states have had one since 1982. Once a state opts to create a Medicaid program, it must abide by federal rules. These rules relate to who is eligible and what services they must be given. But in each case, the federal rules allow considerable flexibility to the states.
Three categories are widely used to distinguish among those who can be eligible: • Public Assistance - those receiving cash benefits under a public assistance
program. • Poverty-Related - those who do not qualify for cash benefits, but whose incomes
fall below thresholds set by federal guidelines. • Medically-Needy - those with incomes above the federal poverty-related
thresholds, but who incur large medical expenses. Public Assistance Eligibles. Individuals receiving cash benefits under the Supplemental Security Income (SSI) program for the elderly and disabled and under the Temporary Assistance to Needy Families (TANF) program fall in this category. The TANF program, established by federal welfare reform legislation in 1996, replaced the former federal Aid to Families with Dependent Children (AFDC) program and the former New York State Home Relief program. Federal rules require that these groups be Medicaid
4 w Citizens Budget Commission
eligible.2 In New York, as in most states, individuals are automatically enrolled in Medicaid when they are deemed eligible for these cash benefits.
For SSI, eligibility criteria are set by the federal government and apply nationally. An individual may not have income exceeding $572 per month (in 2000) or have assets exceeding $2,000 (if married, the couple’s assets are limited to $3,000). For TANF, families with children can have assets worth no more than $5,650, but the value of an automobile and home are excluded from this limit.3 TANF income limits vary by county to reflect cost of living differences (adjustments are made for shelter costs) and the size of the family. For example, for a family of three living in New York City, monthly income cannot exceed $942 (in 2003).
ExpendituresBasis of Eligibility Expenditures Beneficiaries per Beneficiary
Receiving Cash $12,629,351,119 1,360,022 $9,286Aged 2,435,364,570 161,114 15,116Blind/Disabled 8,591,954,316 493,827 17,399Child 919,668,043 497,414 1,849Adult 682,364,190 207,667 3,286
Poverty-Related $2,390,603,952 574,590 $4,161Aged and Disabled 984,231 67 14,690Child 303,595,187 182,978 1,659Adult 1,698,509,923 317,519 5,349Foster Care Child 387,514,611 74,026 5,235
Medically Needy $10,861,779,521 1,024,945 $10,597Aged 5,116,748,414 179,988 28,428Blind/Disabled 4,031,572,585 124,960 32,263Child 1,082,943,848 503,218 2,152Adult 630,514,674 216,779 2,909
Unknown $265,878,495 460,336 $578
Total a $26,147,613,087 3,419,893 $7,646___
Note: a Excludes Disproportionate Share Hospital Payments.
Source: United States Department of Health and Human Services, Centers for Medicare and Medicaid Services, <cms.hhs.gov/medicaid/msis/00ny.pdf> (September 30, 2003).
Table 2Medicaid Expenditures and Beneficiaries by Basis of Eligibility
New York State, Federal Fiscal Year 2000
2 The exception is that 11 states have more restrictive income and asset tests for the disabled under Medicaid than is the case for federal SSI benefits. United States Congress, Committee on Ways and Means, Green Book 2000, p. 897, <www.frwebgate.access.gov> (September 30, 2003). 3 Asset limits vary according to size of family. The asset limit listed is for a family of three.

Confronting the Tradeoffs in Medicaid Cost Containment w 5
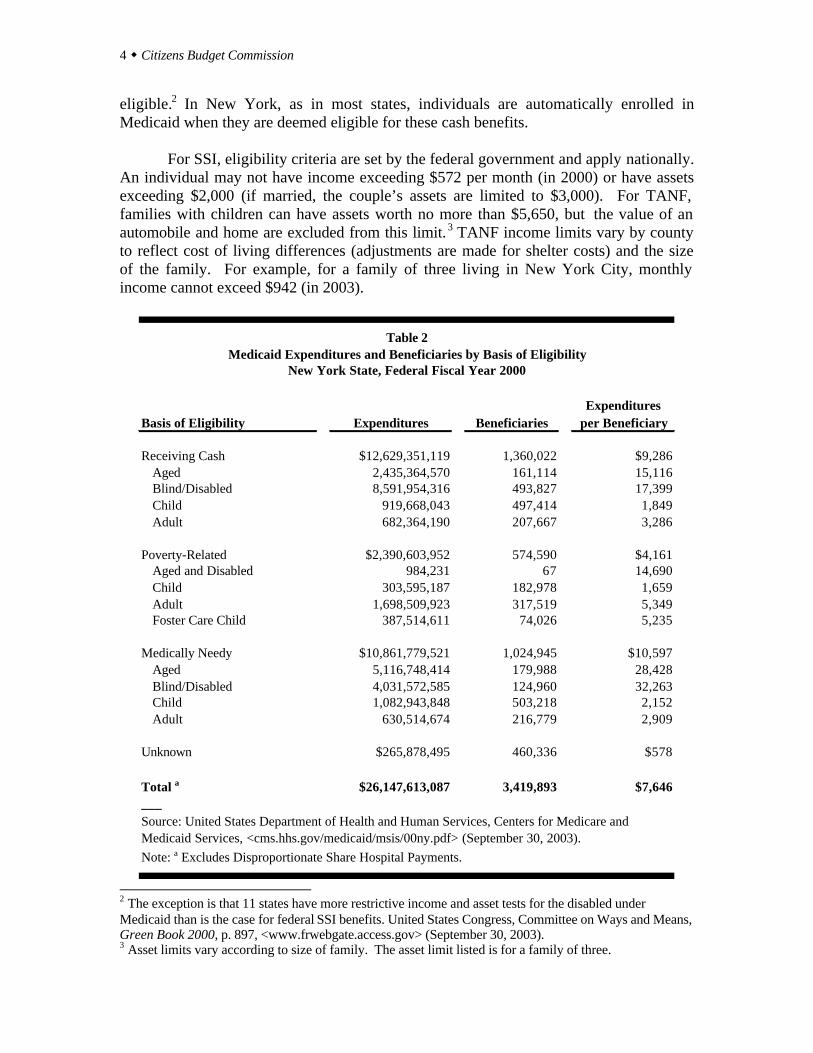
As shown in Table 2, about 1,360,000 individuals in New York State qualified for Medicaid because they were receiving cash benefits. This includes about 650,000 elderly and disabled individuals receiving SSI, and about 200,000 adults and 500,000 children receiving TANF benefits.
Medicaid expenditures on behalf of those receiving public assistance were $12.6
billion in federal fiscal year 2000, or about 48 percent of the total. However, this sum was unequally divided among the subgroups. Average expenditures per beneficiary for the elderly and disabled were about $15,100 and $17,400, respectively. The SSI group accounted for about $11 billion of the $12.6 billion. In contrast, the cost per adult in TANF averaged a much lower $3,300, and the cost per child in TANF was only about $1,800. Medicaid expenditures for the entire TANF population were about $1.6 billion or just 6 percent of the program total. Poverty-Related Eligibles. Poverty-related eligibility is regulated by federal rules that set mandatory minimums, but allow states to set higher thresholds up to federally set maximums. The limits are defined based on a federally set standard, know as the Federal Poverty Level (FPL). The FPL is uniform nationally, but varies by household type and family size. It is updated annually. To illustrate, the FPL is $749 per month or $8,988 annually for a one-person household in 2003. In New York State, individuals not receiving public assistance can enroll in Medicaid, if they meet the following income criteria:
a) Pregnant women and infants (up to age 1) in households with incomes below 200 percent of the FPL.
b) Children ages 1-19 in households with incomes up to 133 percent of the FPL. c) Most parents living with children under age 21 in the same household with
incomes up to 150 percent of the FPL. d) Most adults in households with incomes up to 100 percent of the FPL.4
The assets limits for the poverty-related groups are the same as those described above for cash assistance recipients. In New York State, about 575,000 individuals qualify under the poverty related criteria. Nearly 320,000 are adults, and over 250,000 are children including about 74,000 foster care children. Expenditures for this group were about $2.4 billion, or less than one-tenth the total. Medically-Needy Eligibles. Individuals may qualify for Medicaid because they incur large or “catastrophic” medical care bills. The accrued expenses for medical care may be subtracted from their actual incomes to enable their adjusted incomes to fall below Medicaid eligibility thresholds.5 Once the expenses reach this level, then all medical care expenses may be covered by Medicaid. 4 A moment’s reflection reveals the complexity of administering these rules. In one family, a pregnant mother and infant may be eligible while the father and older children are not. In another family, the children may be eligible while both parents are not. 5 States vary in whether the individual must only accrue the expenses or must actually pay for the accrued expenses. New York State requires only that the expenses be accrued.
6 w Citizens Budget Commission
The federal rules do not require states to let medically-needy individuals qualify
for Medicaid, and 15 states have no provision for this type of eligibility. For states opting for this part of the Medicaid program, the federal rules set limits on the maximum income and assets, and these criteria vary among types of individuals. States also are given latitude in the types of services they may cover for the medically-needy, with the requirements less comprehensive than for the other eligibility categories.
Medically-needy eligibles generally fit one of two broad profiles. The first are people of modest income who lack health insurance and suffer an acute spell of illness or an accident. They require hospitalization or other expensive services, and they may lose their regular source of income while sick. These individuals can, and often do, recover from the illness and return to work. Thus, their “medically-needy” eligibility is limited to a relatively brief time period, but involves substantial expenses.
Individuals becoming medically-needy because of a spell of acute illness are subject to income limits set by the federal government. The income level to which they must “spend down” with medical care expenses is 133 percent of the income limit for the same type of family under the state’s former AFDC program. 6 The asset limit for these individuals is the same as it would be for a similar size family under the former AFDC program.
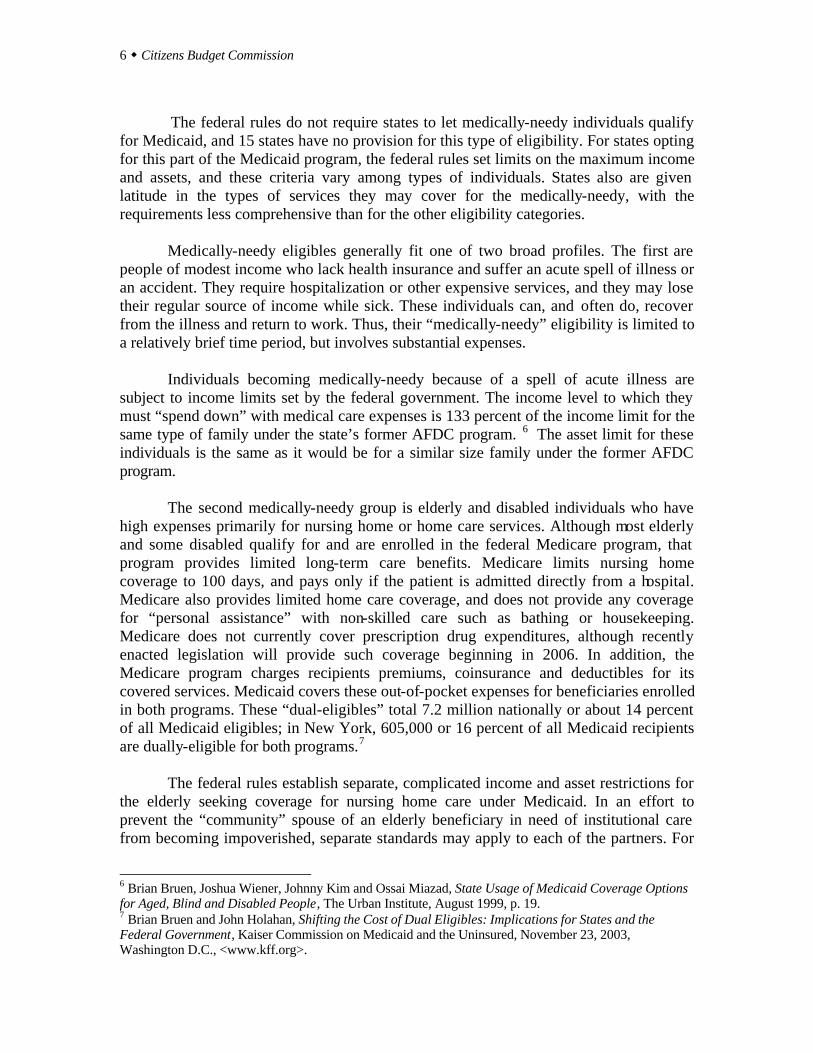
The second medically-needy group is elderly and disabled individuals who have high expenses primarily for nursing home or home care services. Although most elderly and some disabled qualify for and are enrolled in the federal Medicare program, that program provides limited long-term care benefits. Medicare limits nursing home coverage to 100 days, and pays only if the patient is admitted directly from a hospital. Medicare also provides limited home care coverage, and does not provide any coverage for “personal assistance” with non-skilled care such as bathing or housekeeping. Medicare does not currently cover prescription drug expenditures, although recently enacted legislation will provide such coverage beginning in 2006. In addition, the Medicare program charges recipients premiums, coinsurance and deductibles for its covered services. Medicaid covers these out-of-pocket expenses for beneficiaries enrolled in both programs. These “dual-eligibles” total 7.2 million nationally or about 14 percent of all Medicaid eligibles; in New York, 605,000 or 16 percent of all Medicaid recipients are dually-eligible for both programs.7
The federal rules establish separate, complicated income and asset restrictions for the elderly seeking coverage for nursing home care under Medicaid. In an effort to prevent the “community” spouse of an elderly beneficiary in need of institutional care from becoming impoverished, separate standards may apply to each of the partners. For
6 Brian Bruen, Joshua Wiener, Johnny Kim and Ossai Miazad, State Usage of Medicaid Coverage Options for Aged, Blind and Disabled People, The Urban Institute, August 1999, p. 19. 7 Brian Bruen and John Holahan, Shifting the Cost of Dual Eligibles: Implications for States and the Federal Government, Kaiser Commission on Medicaid and the Uninsured, November 23, 2003, Washington D.C., <www.kff.org>.
Confronting the Tradeoffs in Medicaid Cost Containment w 7
those seeking coverage for nursing homes, an institutional resident must contribute income above $50 per month (a personal needs allowance) toward the cost of their care, and a spouse of a nursing home resident is supposed to assume some financial responsibility for the patient’s care. In New York, spouses living in the community should contribute 25 percent of income above $2,267 per month (or $27,204 annually) toward their spouse’s care. For home care, the rules are the same as for regular Medicaid--an individual may have an annual income of $7,700 or a couple may have $11,200.
For a nursing home resident, assets are limited to $3,850 but the value of a home is excluded. The assets of the community spouse in New York are limited to $90,660, the maximum allowed by federal law. For home care clients, the asset limits are the same as for regular Medicaid, $3,850 for a single person, and $5,600 for a couple, also excluding the value of the primary residence.
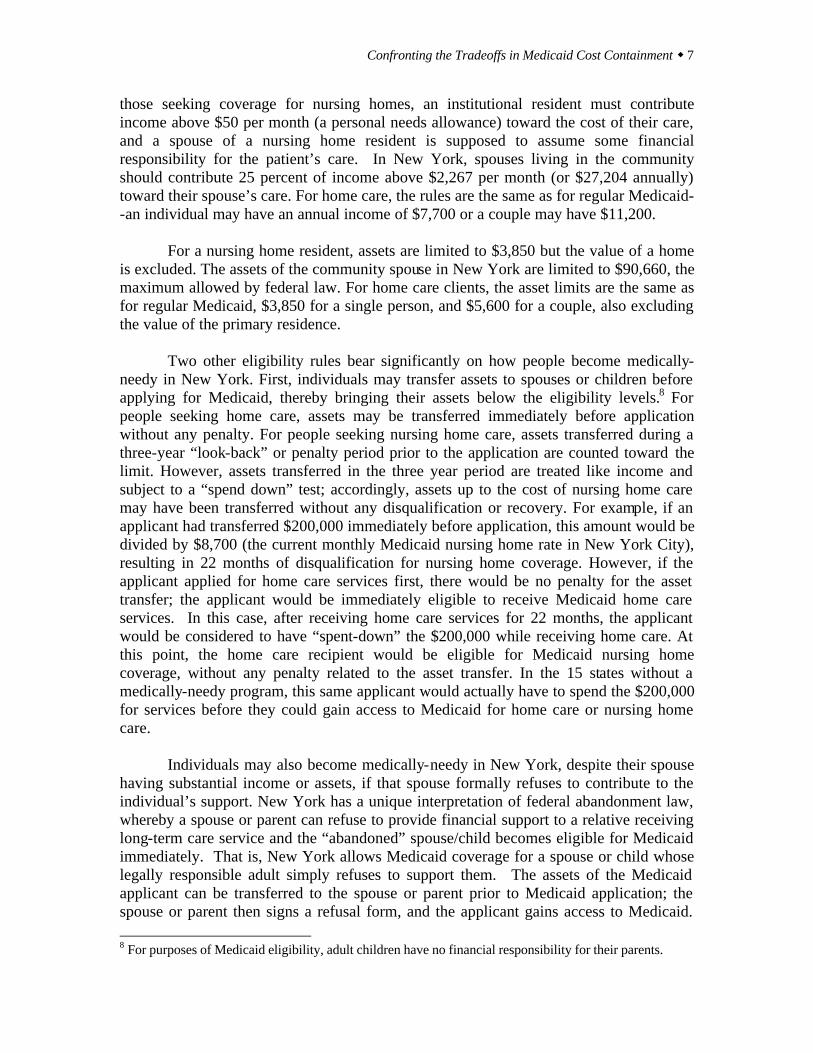
Two other eligibility rules bear significantly on how people become medically- needy in New York. First, individuals may transfer assets to spouses or children before applying for Medicaid, thereby bringing their assets below the eligibility levels.8 For people seeking home care, assets may be transferred immediately before application without any penalty. For people seeking nursing home care, assets transferred during a three-year “look-back” or penalty period prior to the application are counted toward the limit. However, assets transferred in the three year period are treated like income and subject to a “spend down” test; accordingly, assets up to the cost of nursing home care may have been transferred without any disqualification or recovery. For example, if an applicant had transferred $200,000 immediately before application, this amount would be divided by $8,700 (the current monthly Medicaid nursing home rate in New York City), resulting in 22 months of disqualification for nursing home coverage. However, if the applicant applied for home care services first, there would be no penalty for the asset transfer; the applicant would be immediately eligible to receive Medicaid home care services. In this case, after receiving home care services for 22 months, the applicant would be considered to have “spent-down” the $200,000 while receiving home care. At this point, the home care recipient would be eligible for Medicaid nursing home coverage, without any penalty related to the asset transfer. In the 15 states without a medically-needy program, this same applicant would actually have to spend the $200,000 for services before they could gain access to Medicaid for home care or nursing home care.
Individuals may also become medically-needy in New York, despite their spouse
having substantial income or assets, if that spouse formally refuses to contribute to the individual’s support. New York has a unique interpretation of federal abandonment law, whereby a spouse or parent can refuse to provide financial support to a relative receiving long-term care service and the “abandoned” spouse/child becomes eligible for Medicaid immediately. That is, New York allows Medicaid coverage for a spouse or child whose legally responsible adult simply refuses to support them. The assets of the Medicaid applicant can be transferred to the spouse or parent prior to Medicaid application; the spouse or parent then signs a refusal form, and the applicant gains access to Medicaid. 8 For purposes of Medicaid eligibility, adult children have no financial responsibility for their parents.
8 w Citizens Budget Commission
This process effectively nullifies the federal community spouse income and asset limits described above. There has been limited study of the extent of “spousal refusal” in New York. One federally supported study in Nassau County found that approximately 95 percent of spouses remaining in the community had refused to support their spouse at the time of Medicaid application.9 Another study found that in 2000 in New York City, 3,101 Medicaid nursing home residents had spouses who had signed support refusals.10
The aged and disabled who qualify as medically-needy numbered about 305,000 in New York State. The average annual expenditures for the aged were over $28,000 annually and for the disabled about $32,000 annually. This group represented expenditures of more than $9.1 billion or more than one-third the Medicaid total. Categories of Services Two distinctions among types of services are important for understanding Medicaid – mandatory versus optional services, and acute care versus long-term care services. In addition, Medicaid includes a type of payment, called Disproportionate Share (DISH) payments to hospitals, that is not a type of service to individuals, but is a program of institutional subsidies for certain hospitals. Mandatory and Optional Services. Federal law requires that every state’s Medicaid program include certain benefits, known as the mandatory benefits. These include the services typically covered by health insurance policies – inpatient and outpatient hospital care, physician services, laboratory and x-ray services, and skilled nursing care provided at home. When these benefits are provided through an arrangement with a health maintenance organization rather than by discrete providers, the monthly premium or “capitation payment” is a covered service. Also mandated are some long-term care services not typically part of conventional health insurance policies; these include nursing home care for adults, and long-term stays at mental health hospitals for non-elderly adults. (Children are not mandated to be covered, because federal policies encourage alternative locations for their long-term care.) Federal rules also identify 35 optional services. (See Appendix II Table A-1 for a list.) These are services that states may chose to offer; if they do, the federal government will pay the same share of the cost as it does for the mandatory services.11 New York offers 31 of the 35 services. These include prescription dugs, dental care, personal care for the elderly and disabled at home, and care at Intermediate Care Facilities (ICF). An ICF is a residential facility that cares for those with developmental disabilities. In New York, many of these facilities are operated by the State Office of Mental Retardation and
9 Brian Burwell and William H. Crown, Medicaid Estate Planning in the Aftermath of OBRA ’93 (Cambridge, MA: The Medstat Group, August 1995), p. D-6. 10 Testimony of Mark Hoover and Iris Hernandez, before the General Welfare Committee, City Council, City of New York, October 17, 2000. 11 The federal share varies inversely with average per capita income in the state and ranges from 50 percent to 77 percent. In New York, the federal share is 50 percent.
Confronting the Tradeoffs in Medicaid Cost Containment w 9
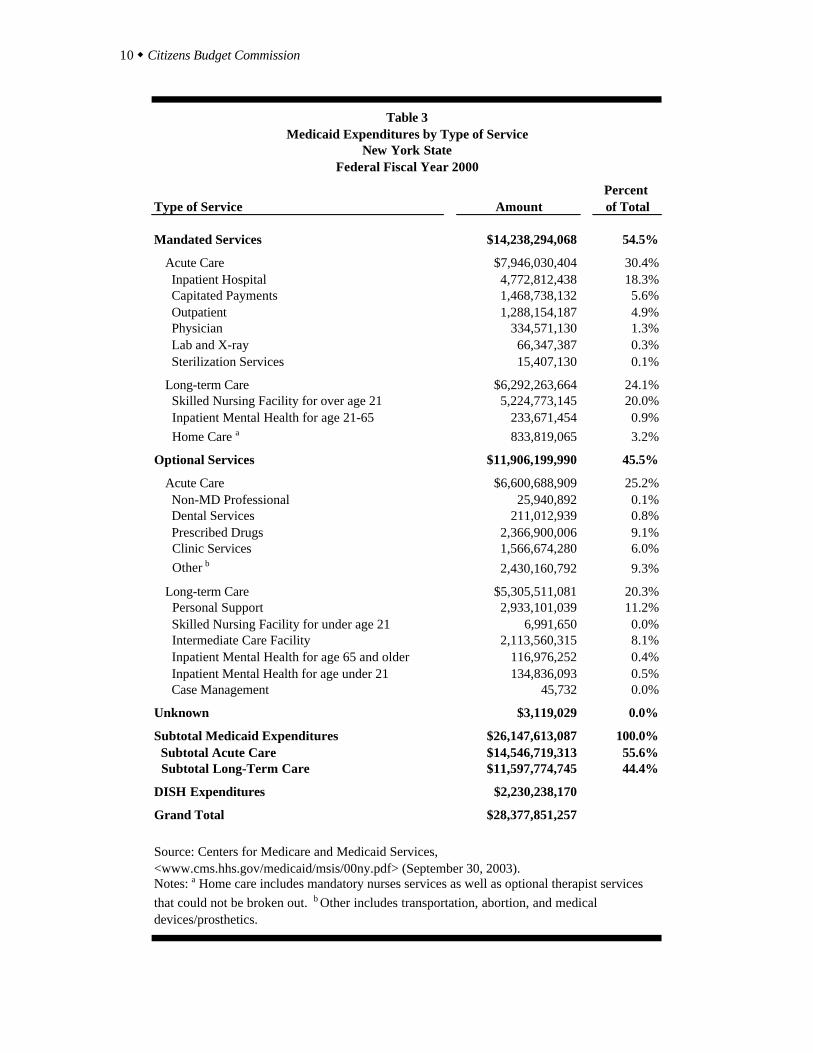
Developmental Disabilities (OMRDD); the State collects the federal Medicaid reimbursements and uses it to offset this department’s operating expenses. As shown in Table 3, in federal fiscal year 2000, the mandatory services accounted for 54 percent of total Medicaid expenditures (excluding DISH). Nursing homes accounted for 20 percent, inpatient hospital care 18 percent and hospital outpatient care 5 percent; physician visits were only about 1 percent. Since the State was moving many Medicaid eligibles into managed care plans, capitation payments approached 6 percent. Among the optional services, the largest types of expenditure were for personal care for elderly and disabled people living at home (11 percent of the total) and for prescription drugs (9 percent). The ICFs represented another 8 percent, while dental care was less than 1 percent. Acute and Long-term Care. Acute care services are oriented toward treating specific medical conditions and are frequently covered in private health insurance plans. Long-term care services include residential facilities such as nursing homes and ICFs, and non-medical care such as home attendants providing personal care services (such as bathing, shopping and assistance with grooming) in individuals’ homes. Long-term care is generally not covered under private health insurance plans.
Acute care services represent about 56 percent of Medicaid expenditures (again, excluding DISH). As noted, the largest items are inpatient hospital care, prescription drugs, and capitation payments. The remaining 44 percent of Medicaid expenditures are for long-term care services. The major items in this category are nursing homes, ICFs, and personal care at home. Disproportionate Share Payments. The DISH payments are not payments for services rendered to Medicaid eligible individuals. They are payments to hospitals that qualify by right of providing services to a greater proportion of indigent patients than do other hospitals. The intent is to provide some fiscal relief to institutions who care for large numbers of uninsured patients. The federal government has paid for a share of these payments under Medicaid since 1990, and New York uses the DISH component of Medicaid to channel funds to local public hospitals and some voluntary hospitals that provide large volumes of care to the uninsured. In federal fiscal year 2000, DISH payments in New York totaled $2.2 billion.
10 w Citizens Budget Commission
Percent Type of Service Amount of Total
Mandated Services $14,238,294,068 54.5%
Acute Care $7,946,030,404 30.4% Inpatient Hospital 4,772,812,438 18.3% Capitated Payments 1,468,738,132 5.6% Outpatient 1,288,154,187 4.9% Physician 334,571,130 1.3% Lab and X-ray 66,347,387 0.3% Sterilization Services 15,407,130 0.1%
Long-term Care $6,292,263,664 24.1% Skilled Nursing Facility for over age 21 5,224,773,145 20.0% Inpatient Mental Health for age 21-65 233,671,454 0.9% Home Care a 833,819,065 3.2%
Optional Services $11,906,199,990 45.5%
Acute Care $6,600,688,909 25.2% Non-MD Professional 25,940,892 0.1% Dental Services 211,012,939 0.8% Prescribed Drugs 2,366,900,006 9.1% Clinic Services 1,566,674,280 6.0% Other b 2,430,160,792 9.3%
Long-term Care $5,305,511,081 20.3% Personal Support 2,933,101,039 11.2% Skilled Nursing Facility for under age 21 6,991,650 0.0% Intermediate Care Facility 2,113,560,315 8.1% Inpatient Mental Health for age 65 and older 116,976,252 0.4% Inpatient Mental Health for age under 21 134,836,093 0.5% Case Management 45,732 0.0%
Unknown $3,119,029 0.0%
Subtotal Medicaid Expenditures $26,147,613,087 100.0% Subtotal Acute Care $14,546,719,313 55.6% Subtotal Long-Term Care $11,597,774,745 44.4%
DISH Expenditures $2,230,238,170
Grand Total $28,377,851,257
Source: Centers for Medicare and Medicaid Services, <www.cms.hhs.gov/medicaid/msis/00ny.pdf> (September 30, 2003).Notes: a Home care includes mandatory nurses services as well as optional therapist services that could not be broken out. b Other includes transportation, abortion, and medical devices/prosthetics.
Table 3Medicaid Expenditures by Type of Service
New York StateFederal Fiscal Year 2000
Confronting the Tradeoffs in Medicaid Cost Containment w 11
Financing Responsibilities
The federal government reimburses state Medicaid expenditures based on a formula that varies inversely with average per capita income in the state. The federal matching rate ranges from 77 percent in poorer states to a minimum of 50 percent, which is New York’s federal matching rate.
Unlike most states, New York requires its localities (57 counties and the City of
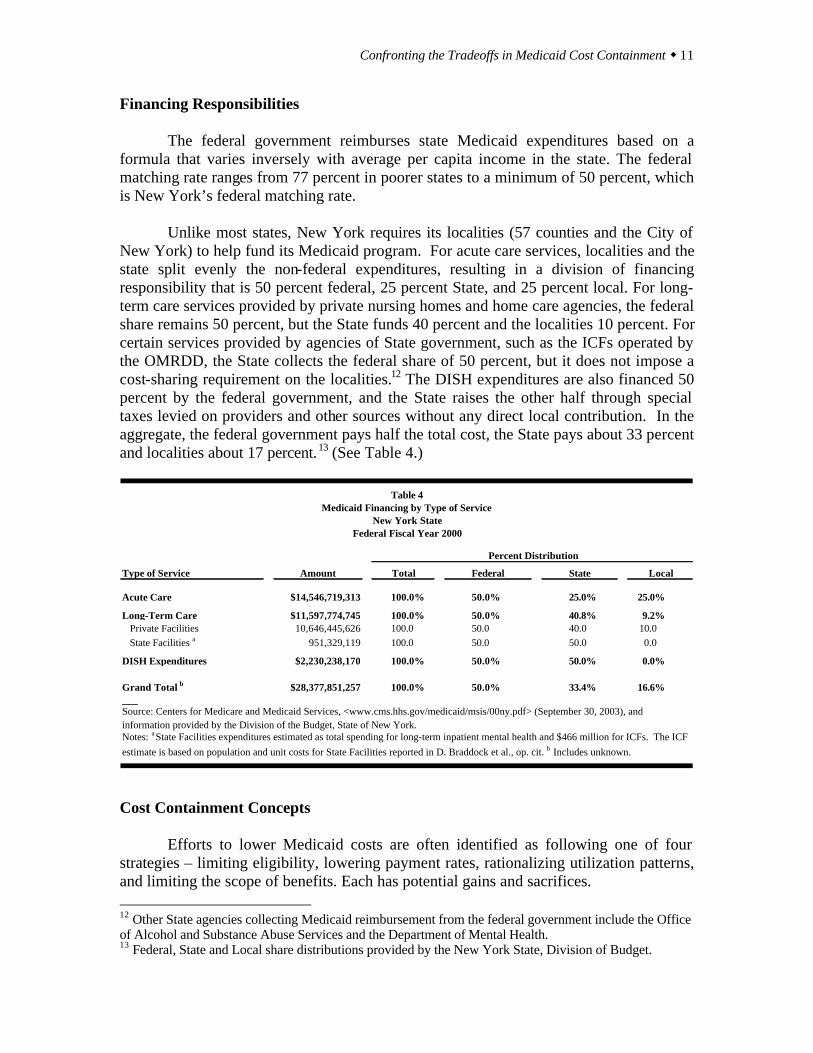
New York) to help fund its Medicaid program. For acute care services, localities and the state split evenly the non-federal expenditures, resulting in a division of financing responsibility that is 50 percent federal, 25 percent State, and 25 percent local. For long-term care services provided by private nursing homes and home care agencies, the federal share remains 50 percent, but the State funds 40 percent and the localities 10 percent. For certain services provided by agencies of State government, such as the ICFs operated by the OMRDD, the State collects the federal share of 50 percent, but it does not impose a cost-sharing requirement on the localities.12 The DISH expenditures are also financed 50 percent by the federal government, and the State raises the other half through special taxes levied on providers and other sources without any direct local contribution. In the aggregate, the federal government pays half the total cost, the State pays about 33 percent and localities about 17 percent.13 (See Table 4.)
Type of Service Amount Total Federal State Local
Acute Care $14,546,719,313 100.0% 50.0% 25.0% 25.0%
Long-Term Care $11,597,774,745 100.0% 50.0% 40.8% 9.2% Private Facilities 10,646,445,626 100.0 50.0 40.0 10.0 State Facilities a 951,329,119 100.0 50.0 50.0 0.0
DISH Expenditures $2,230,238,170 100.0% 50.0% 50.0% 0.0%
Grand Total b $28,377,851,257 100.0% 50.0% 33.4% 16.6%___
Federal Fiscal Year 2000
Source: Centers for Medicare and Medicaid Services, <www.cms.hhs.gov/medicaid/msis/00ny.pdf> (September 30, 2003), and information provided by the Division of the Budget, State of New York.Notes: a State Facilities expenditures estimated as total spending for long-term inpatient mental health and $466 million for ICFs. The ICF estimate is based on population and unit costs for State Facilities reported in D. Braddock et al., op. cit. b Includes unknown.
Table 4
Percent Distribution
Medicaid Financing by Type of ServiceNew York State
Cost Containment Concepts Efforts to lower Medicaid costs are often identified as following one of four strategies – limiting eligibility, lowering payment rates, rationalizing utilization patterns, and limiting the scope of benefits. Each has potential gains and sacrifices. 12 Other State agencies collecting Medicaid reimbursement from the federal government include the Office of Alcohol and Substance Abuse Services and the Department of Mental Health. 13 Federal, State and Local share distributions provided by the New York State, Division of Budget.
12 w Citizens Budget Commission
Limiting Eligibility. If fewer people qualify for the program, then it is likely to require less money to pay for the aggregate services they consume. Efforts to reduce eligibility can take the form of altering statutory requirements, such as lowering income or asset limitations. They also may take the form of administrative practices such as enforcing existing rules more stringently or imposing new procedures such as more frequent verifications or more rigorous job search requirements. Since many people become eligible for Medicaid because they are determined to be eligible for cash assistance, changes in eligibility procedures for cash assistance programs can have an impact on Medicaid eligibility. Eligibility limitations can be desirable when they help reduce fraud or otherwise keep people for whom the program is not intended from becoming eligible. They are undesirable when they keep people who otherwise cannot afford access to medical care from obtaining it. In addition, some administrative “crackdowns” run the risk of unfairly making some people ineligible while others are unaffected. Lowering Payment Rates. Medicaid costs can be reduced if the State is able to purchase services for those enrolled at a lower price. Since under federal law the states have the authority to set the rates at which they pay Medicaid providers with broad discretion, it is possible to lower rates. In New York, the setting of payment rates is overseen and regulated by the Legislature, so legislative approval is generally required to lower payment rates. Lowering rates has the advantage of saving money without reducing the care available to enrollees or lowering the number of enrollees. The risk in this strategy is that: (a) some providers may decide not to participate in the Medicaid program, thereby reducing access to services for enrollees; (b) some providers may curtail the quality of service they provide, because they have fewer resources. Rationalizing Utilization. Medicaid costs can be lowered if the same number of eligible people reduce the rate at which they consume services. If hospital admission rates or annual physician visit rates, for example, can be lowered, then total payments can also be lowered. Similarly, if sources of care can be shifted toward lower cost facilities, expenditures may be reduced. For example, reducing client reliance on emergency rooms in favor of physician offices and replacing inpatient admissions with outpatient treatment can achieve savings. This strategy can be hard to implement, because State actions typically cannot force changes in utilization patterns. Physician and client behavior must be altered indirectly. The most common means for doing this has been to shift from fee-for-service payment arrangements to capitation arrangements with managed care plans. This payment change creates financial incentives for the plans to alter utilization patterns. To work effectively, it also requires effective monitoring and standard setting to prevent the plans from reducing utilization in ways that jeopardize the health of the clients. However, numerous studies of demonstration projects have shown that managed care arrangements,
Confronting the Tradeoffs in Medicaid Cost Containment w 13
if properly supervised and implemented, can achieve savings of about 10 percent in per enrollee costs without lowering standards of care. The savings result primarily from lowering reliance on hospital inpatient care and substituting more outpatient care. Managed care affects utilization patterns for acute care services, but managed care has generally not been applied to long-term care services because the plans have little expertise in controlling utilization of long-term care. However, as will be discussed below, utilization patterns of long-term care services should be subject to review and cost saving strategies. Limiting Benefits. Costs can be cut if clients are offered a narrower range of services. Since many services are “optional” under Medicaid, this strategy can be applied by states within the broad federal rules. In New York, the State legislature controls the scope of benefits, and legislative action is required to narrow it. Eliminating benefits has the potential to save money, and it also makes priority setting (or “rationing”) for medical care explicit. The State of Oregon has gone the farthest in this direction, by setting a priority list for all services and adjusting the scope of benefits to fit annual budget cycles. When funds are constrained (or when a higher priority is to cover more people with fewer benefits), the range of services covered is reduced.14 The negatives to this strategy are twofold. First, some people do not get care and suffer. Second, there is a risk that other services will be substituted for those that are eliminated. This substitution often occurs when optional services such as podiatry or dental care are eliminated, and clients eventually get care for their ailments from physicians or other covered providers who treat the same or similar conditions. For the same reasons, eliminating prescription drugs (an optional service) can be counterproductive, if the clients eventually are hospitalized because they lack proper medication. These four general strategies provide a framework for examining possible measures to lower Medicaid costs in New York State. Significant savings are possible, without harming needy clients, by applying three of the four approaches. Limiting benefits does not appear to be appropriate for New York.
ELIGIBILITY – LIMITING “MEDICALLY-NEEDY” LOOPHOLES
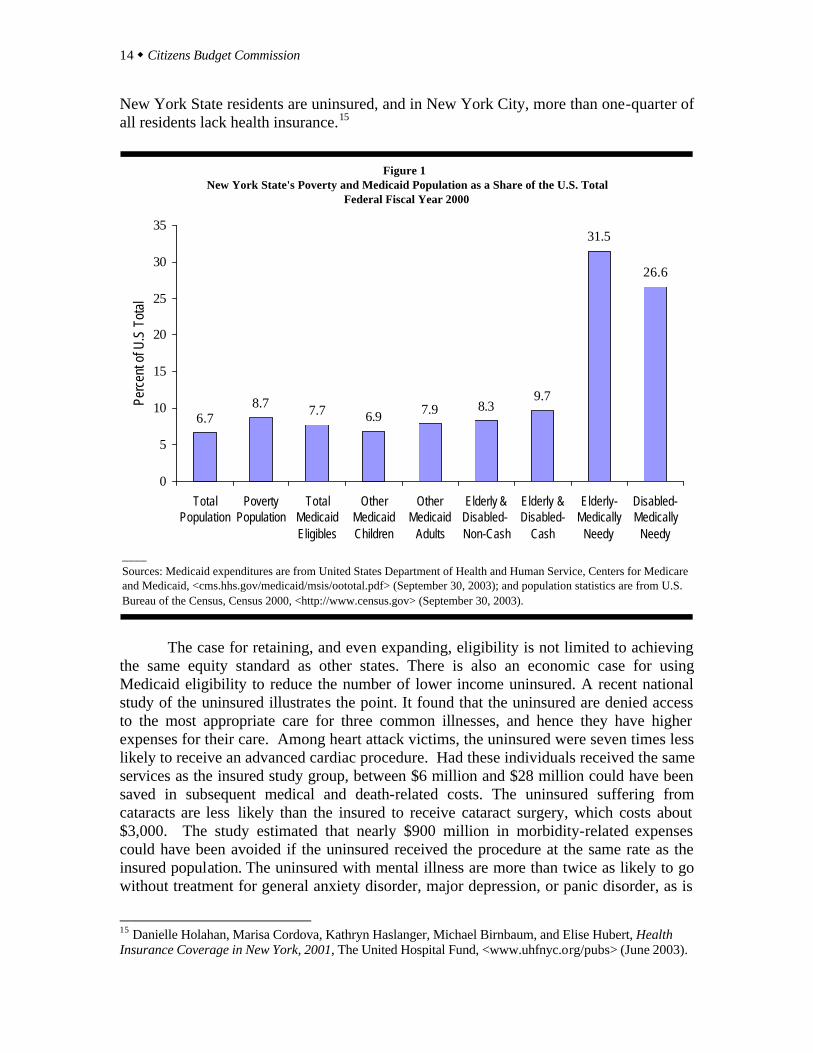
In general, New York’s eligibility standards are not unusually generous. The
evidence for this is summarized in Figure 1. New York State is home to 8.7 percent of the nation’s individuals living below the federal poverty threshold, yet it is home to a lower 7.7 percent of the nation’s Medicaid enrollees. In this sense, relative to need, New York is less generous with respect to eligibility than the rest of the country. Nearly 3 million
14 Vernon Smith et. al., States Respond to Fiscal Pressure: State Medicaid Spending Growth and Cost Containment in Fiscal Years 2003 and 2004, The Kaiser Family Foundation, <http://www.kff.org> (September 30, 2003).
14 w Citizens Budget Commission
New York State residents are uninsured, and in New York City, more than one-quarter of all residents lack health insurance.15
____Sources: Medicaid expenditures are from United States Department of Health and Human Service, Centers for Medicare and Medicaid, <cms.hhs.gov/medicaid/msis/oototal.pdf> (September 30, 2003); and population statistics are from U.S. Bureau of the Census, Census 2000, <http://www.census.gov> (September 30, 2003).
Figure 1 New York State's Poverty and Medicaid Population as a Share of the U.S. Total
Federal Fiscal Year 2000
6.78.7 7.7 6.9 7.9 8.3
9.7
31.5
26.6
0
5
10
15
20
25
30
35
TotalPopulation
PovertyPopulation
TotalMedicaidEligibles
OtherMedicaidChildren
OtherMedicaid
Adults
Elderly &Disabled- Non-Cash
Elderly &Disabled-
Cash
Elderly-Medically
Needy
Disabled-Medically
Needy
Perc
ent o
f U.S
Tot
al
The case for retaining, and even expanding, eligibility is not limited to achieving
the same equity standard as other states. There is also an economic case for using Medicaid eligibility to reduce the number of lower income uninsured. A recent national study of the uninsured illustrates the point. It found that the uninsured are denied access to the most appropriate care for three common illnesses, and hence they have higher expenses for their care. Among heart attack victims, the uninsured were seven times less likely to receive an advanced cardiac procedure. Had these individuals received the same services as the insured study group, between $6 million and $28 million could have been saved in subsequent medical and death-related costs. The uninsured suffering from cataracts are less likely than the insured to receive cataract surgery, which costs about $3,000. The study estimated that nearly $900 million in morbidity-related expenses could have been avoided if the uninsured received the procedure at the same rate as the insured population. The uninsured with mental illness are more than twice as likely to go without treatment for general anxiety disorder, major depression, or panic disorder, as is
15 Danielle Holahan, Marisa Cordova, Kathryn Haslanger, Michael Birnbaum, and Elise Hubert, Health Insurance Coverage in New York, 2001, The United Hospital Fund, <www.uhfnyc.org/pubs> (June 2003).

Confronting the Tradeoffs in Medicaid Cost Containment w 15
the insured population. The study estimated the uninsured accrued $213 million in additional morbidity-related costs due to delayed treatment for these mental health conditions.16 Another study showed that inadequate routine treatment for chronic conditions results in the uninsured having twice the rate of hospitalization for hypertension and three times the rate of hospitalization for diabetes as do privately insured patients.17 A study of the uninsured in New York City found that 58 percent of uninsured women over age 50 did not receive a mammogram, compared to 33 percent of insured women.18 Because they receive mammograms less frequently, women without health insurance are more likely to be diagnosed with breast cancer at a more advanced state of the disease. As a result, uninsured women are 49 percent more likely to die within seven years of their initial diagnosis than are privately insured women. 19 Thus, a sound social and economic case can be made for government programs to help low income people lacking heath insurance. For the non-elderly and non-disabled population, New York is not too generous. Among these children and adults, New York’s share of the nation’s Medicaid enrollees is below its share of the poverty population. For children, New York helps offset this limited coverage through a reasonably generous Child Health Plus (CHP) program that supplements Medicaid. For adults, Medicaid coverage has been expanding since the 2000 data in Figure 1 were collected through a Medicaid waiver program called Family Health Plus. Expansion of enrollment in Medicaid and CHP is desirable to help low-income children and families get access to needed medical care.20
New York also appears to be doing well in reaching the neediest among the elderly and disabled. In these categories, in New York those receiving cash benefits are more than 9 percent of the nation’s Medicaid enrollees, a larger share than among the overall poverty population. Because Medicaid eligibility for this group is linked to a relatively rigorous administrative process enforcing low income limits for cash benefits, abuses are scarce and those receiving benefits are highly likely truly to be in need.
In contrast, New York’s eligibility rules for the elderly and disabled not receiving
cash benefits are not equitably enforced and should be revised to prevent abuse. New York’s shares of the elderly and disabled receiving Medicaid benefits but not cash assistance are 8.5 percent and 8.1 percent, respectively. These shares are above New York’s overall share of Medicaid recipients, but more troubling is the unusual pattern of qualification among these New York enrollees. In the rest of the county, a large majority 16 S. Glied and S. E. Little, “The Uninsured and the Benefits of Medical Progress,” Health Affairs, 22 (July/August 2003): 210-219. 17 J.S. Weisman, C. Gastonis and A.M. Epstein, “Rates of Avoidable Hospitalization by Insurance Status in Massachusetts and Maryland,” Journal of the American Medical Association, 268, (17)2388-94. 18 Louis Harris and Associates, The Commonwealth Fund Survey of Health Care in New York City (The Commonwealth Fund, February, 1998), p. 31. 19 Ayanian, J.Z., B.A. Kohler, T. Abe, and A.M. Epstein, “The Relationship Between Health Insurance Coverage and Clinical Outcomes among Women with Breast Cancer,” New England Journal of Medicine, 329 (5): 326-31. 20 For previous Citizens Budget Commission recommendations to promote this goal see Citizens Budget Commission, Financing Health Care for the Uninsured (March, 1999) and Better Managing New York State’s Health Insurance Subsidy Programs (September, 2001).
16 w Citizens Budget Commission
of elderly and disabled Medicaid enrollees who are not receiving cash assistance qualify under the poverty related rules. That is, they have very limited income and assets. In contrast, the vast majority of elderly and disabled New Yorkers not getting cash assistance qualify for Medicaid under the medically needy provisions; that is, they are seeking assistance for expensive long-term care while having incomes higher than the poverty related standards. Among the elderly and disabled, New York accounts for an extraordinary 32 percent of the elderly medically needy and 27 percent of the disabled medically needy. Unlike the rest of the nation, New York uses its medically needy provisions as the dominant route for helping the elderly and disabled.
This high rate of medically-needy eligibility among the elderly is attributable
largely to the unusual practices in New York of allowing spousal refusal to support spouses in need of nursing home care, of having no “look back” penalty period for asset transfers by people applying for home care, and of applying the “look back” provisions relevant to nursing home applicants in a way that creates relatively small financial penalties rather than disqualification. Similar factors are at work in creating the large medically-needy group among the disabled, for whom parental refusal can be used by parents to avoid financial responsibility for children with intensive long-term care needs. Both adults and minors with living parents can become eligible for Medicaid if they have needs that generate high expenses; Medicaid will pay the bills under the medically-needy provisions without requiring other family members to contribute. The frequent use of these and other provisions to enable families with considerable income and assets to qualify a family member for Medicaid is facilitated in New York by a thriving field of legal practice known as “Medicaid estate planning;” legal help is available to middle class families to aid them in planning asset transfers and other steps that will qualify aging or disabled relatives for Medicaid. Two strategies should be pursued simultaneously to remedy this situation. First, the State’s medically-needy eligibility rules should be tightened. Spousal refusal should be permitted only under limited circumstances, and the three-year look-back provision relating to asset transfers should be applied to home care, be enforced more vigorously, and the financial penalties should be greater. At the same time, more should be done to encourage the purchase of private long-term care insurance among those with sufficient means. New York State already participates in an innovative program called the Partnership for Long Term Care that encourages purchase of private long-term care insurance by having the state provide Medicaid coverage, without any asset test, for people who purchase a qualified private policy (that has three years of nursing home benefits) and then exhaust the benefits. However, the rate of participation in this program has been low, presumably in large part because the option of getting Medicaid coverage without purchasing a private policy is so easily available. If Medicaid eligibility rules were tightened, and more were done to make people aware of the need for and availability of private insurance, then more middle class families are likely to meet their financial responsibilities by purchasing private long-term care insurance. For those unwilling or unable to purchase long-term care insurance (perhaps because they are already in need of services, or because they have already transferred assets and are now

Confronting the Tradeoffs in Medicaid Cost Containment w 17
subject to a new penalty period), a reverse mortgage can help provide cash to fund needed services while allowing the individual or spouse to remain in their home.21
This transfer of financial responsibility among those with sufficient means from
the State to the families should be the goal of new policy initiatives. It should be noted that tightening eligibility will not affect the truly poor; those with limited assets will not be affected.
RATE SETTING – PAY ONLY FOR COMPETITIVE COSTS In most states the debate about Medicaid payment rates is whether they are too low. States typically try to obtain services for the indigent at rates that are below those paid by commercial plans for the privately insured or by the federal Medicare program for the elderly. For many years federal law set a minimum standard relative to the reasonable cost of producing care, but that was eliminated by Congress in the 1990s. States now have great latitude in setting payment rates. In New York, the rates set for physicians, dentists and some other categories of providers have generally been significantly below those prevailing in the private market and those paid by Medicare. However, for the institutions – notably hospitals and nursing homes –this has not been the case. Hospital Payments
For hospitals, the Medicaid program pays rates linked to historical costs that are updated annually to reflect rising prices and other factors. When the State regulated rates of virtually all hospital funders, the Medicaid rates were set to be on a par with those of private companies, helping to secure access for Medicaid enrollees equal to that for others. However, the State has since 1996 deregulated private insurance payments to hospitals, leading to privately negotiated arrangements that most observers believe are lower than the previous, historic-cost related rates. But Medicaid has continued to follow the historic pattern. As a result, many believe Medicaid is now the program with the most favorable rates, and in many cases these rates are above competitive costs. In 2001, the most recent year for which comparative data are available, the mean cost for a hospital admission in New York State was $9,364. Nationwide, the comparable figure was $6,980. Two factors help explain this difference. First, on average, hospitals in New York treat people for conditions that are more complex than is the case elsewhere,
21 A reverse mortgage is an arrangement under which an individual sells his home to a bank, but is permitted to live in the house until his death and receives monthly payments from the bank while living there. At the time of death, the difference between the agreed purchase price and the accumulated monthly payments (with interest adjustments) is paid to the individual’s estate and the bank takes possession of the house.
18 w Citizens Budget Commission
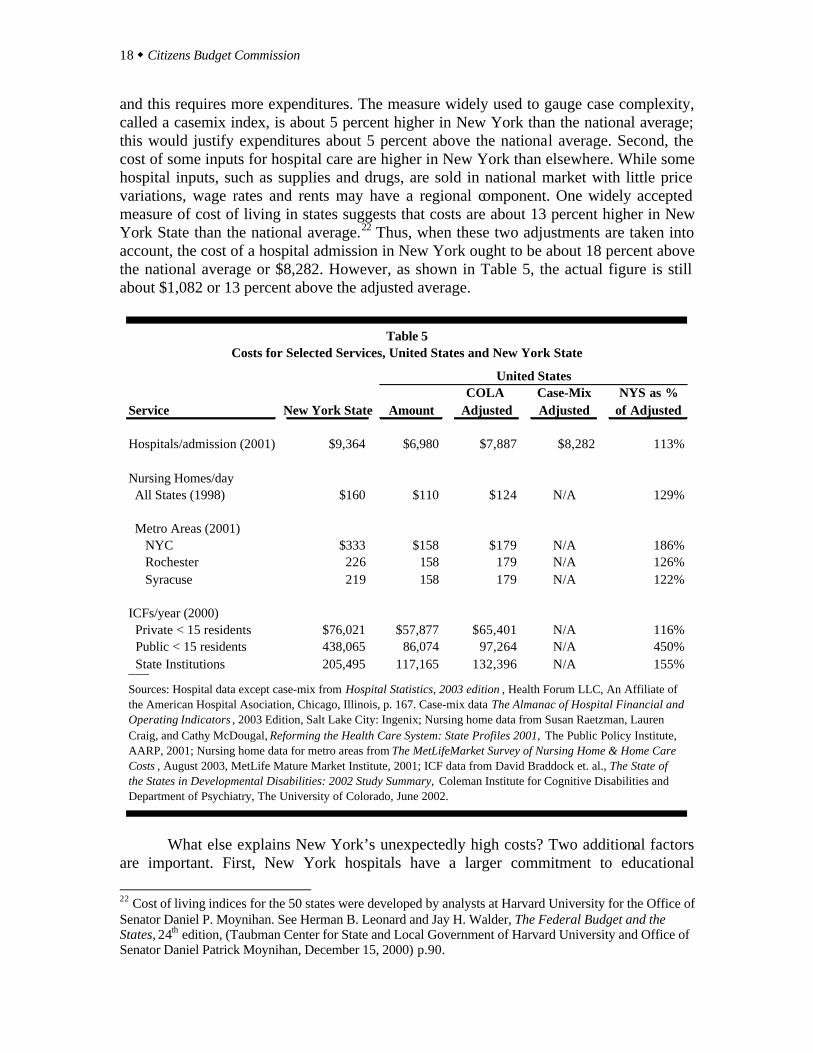
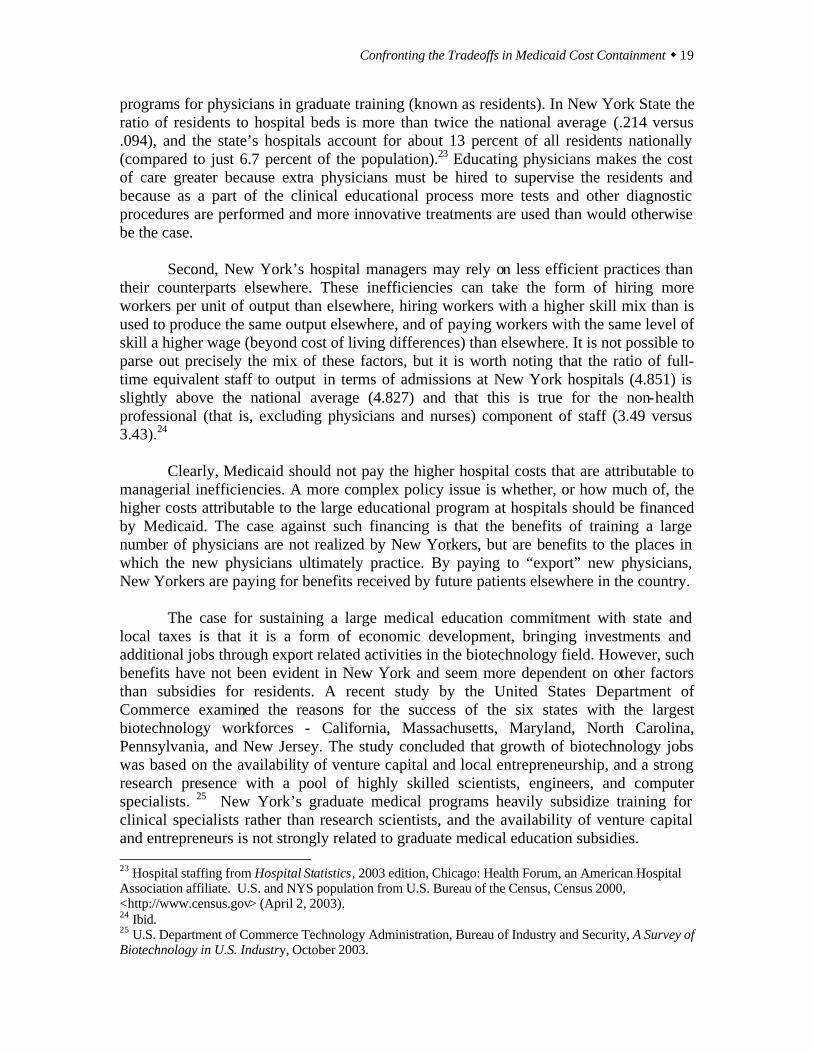
and this requires more expenditures. The measure widely used to gauge case complexity, called a casemix index, is about 5 percent higher in New York than the national average; this would justify expenditures about 5 percent above the national average. Second, the cost of some inputs for hospital care are higher in New York than elsewhere. While some hospital inputs, such as supplies and drugs, are sold in national market with little price variations, wage rates and rents may have a regional component. One widely accepted measure of cost of living in states suggests that costs are about 13 percent higher in New York State than the national average.22 Thus, when these two adjustments are taken into account, the cost of a hospital admission in New York ought to be about 18 percent above the national average or $8,282. However, as shown in Table 5, the actual figure is still about $1,082 or 13 percent above the adjusted average.
COLA Case-Mix NYS as %Service New York State Amount Adjusted Adjusted of Adjusted
Hospitals/admission (2001) $9,364 $6,980 $7,887 $8,282 113%
Nursing Homes/day All States (1998) $160 $110 $124 N/A 129%
Metro Areas (2001) NYC $333 $158 $179 N/A 186% Rochester 226 158 179 N/A 126% Syracuse 219 158 179 N/A 122%
ICFs/year (2000) Private < 15 residents $76,021 $57,877 $65,401 N/A 116% Public < 15 residents 438,065 86,074 97,264 N/A 450% State Institutions 205,495 117,165 132,396 N/A 155%___Sources: Hospital data except case-mix from Hospital Statistics, 2003 edition , Health Forum LLC, An Affiliate of the American Hospital Asociation, Chicago, Illinois, p. 167. Case-mix data The Almanac of Hospital Financial and Operating Indicators , 2003 Edition, Salt Lake City: Ingenix; Nursing home data from Susan Raetzman, Lauren Craig, and Cathy McDougal, Reforming the Health Care System: State Profiles 2001, The Public Policy Institute, AARP, 2001; Nursing home data for metro areas from The MetLifeMarket Survey of Nursing Home & Home Care Costs , August 2003, MetLife Mature Market Institute, 2001; ICF data from David Braddock et. al., The State of the States in Developmental Disabilities: 2002 Study Summary, Coleman Institute for Cognitive Disabilities and Department of Psychiatry, The University of Colorado, June 2002.
United States
Table 5Costs for Selected Services, United States and New York State
What else explains New York’s unexpectedly high costs? Two additional factors
are important. First, New York hospitals have a larger commitment to educational
22 Cost of living indices for the 50 states were developed by analysts at Harvard University for the Office of Senator Daniel P. Moynihan. See Herman B. Leonard and Jay H. Walder, The Federal Budget and the States, 24th edition, (Taubman Center for State and Local Government of Harvard University and Office of Senator Daniel Patrick Moynihan, December 15, 2000) p.90.
Confronting the Tradeoffs in Medicaid Cost Containment w 19
programs for physicians in graduate training (known as residents). In New York State the ratio of residents to hospital beds is more than twice the national average (.214 versus .094), and the state’s hospitals account for about 13 percent of all residents nationally (compared to just 6.7 percent of the population).23 Educating physicians makes the cost of care greater because extra physicians must be hired to supervise the residents and because as a part of the clinical educational process more tests and other diagnostic procedures are performed and more innovative treatments are used than would otherwise be the case.
Second, New York’s hospital managers may rely on less efficient practices than
their counterparts elsewhere. These inefficiencies can take the form of hiring more workers per unit of output than elsewhere, hiring workers with a higher skill mix than is used to produce the same output elsewhere, and of paying workers with the same level of skill a higher wage (beyond cost of living differences) than elsewhere. It is not possible to parse out precisely the mix of these factors, but it is worth noting that the ratio of full-time equivalent staff to output in terms of admissions at New York hospitals (4.851) is slightly above the national average (4.827) and that this is true for the non-health professional (that is, excluding physicians and nurses) component of staff (3.49 versus 3.43).24
Clearly, Medicaid should not pay the higher hospital costs that are attributable to managerial inefficiencies. A more complex policy issue is whether, or how much of, the higher costs attributable to the large educational program at hospitals should be financed by Medicaid. The case against such financing is that the benefits of training a large number of physicians are not realized by New Yorkers, but are benefits to the places in which the new physicians ultimately practice. By paying to “export” new physicians, New Yorkers are paying for benefits received by future patients elsewhere in the country.
The case for sustaining a large medical education commitment with state and local taxes is that it is a form of economic development, bringing investments and additional jobs through export related activities in the biotechnology field. However, such benefits have not been evident in New York and seem more dependent on other factors than subsidies for residents. A recent study by the United States Department of Commerce examined the reasons for the success of the six states with the largest biotechnology workforces - California, Massachusetts, Maryland, North Carolina, Pennsylvania, and New Jersey. The study concluded that growth of biotechnology jobs was based on the availability of venture capital and local entrepreneurship, and a strong research presence with a pool of highly skilled scientists, engineers, and computer specialists. 25 New York’s graduate medical programs heavily subsidize training for clinical specialists rather than research scientists, and the availability of venture capital and entrepreneurs is not strongly related to graduate medical education subsidies. 23 Hospital staffing from Hospital Statistics, 2003 edition, Chicago: Health Forum, an American Hospital Association affiliate. U.S. and NYS population from U.S. Bureau of the Census, Census 2000, <http://www.census.gov> (April 2, 2003). 24 Ibid. 25 U.S. Department of Commerce Technology Administration, Bureau of Industry and Security, A Survey of Biotechnology in U.S. Industry, October 2003.
20 w Citizens Budget Commission
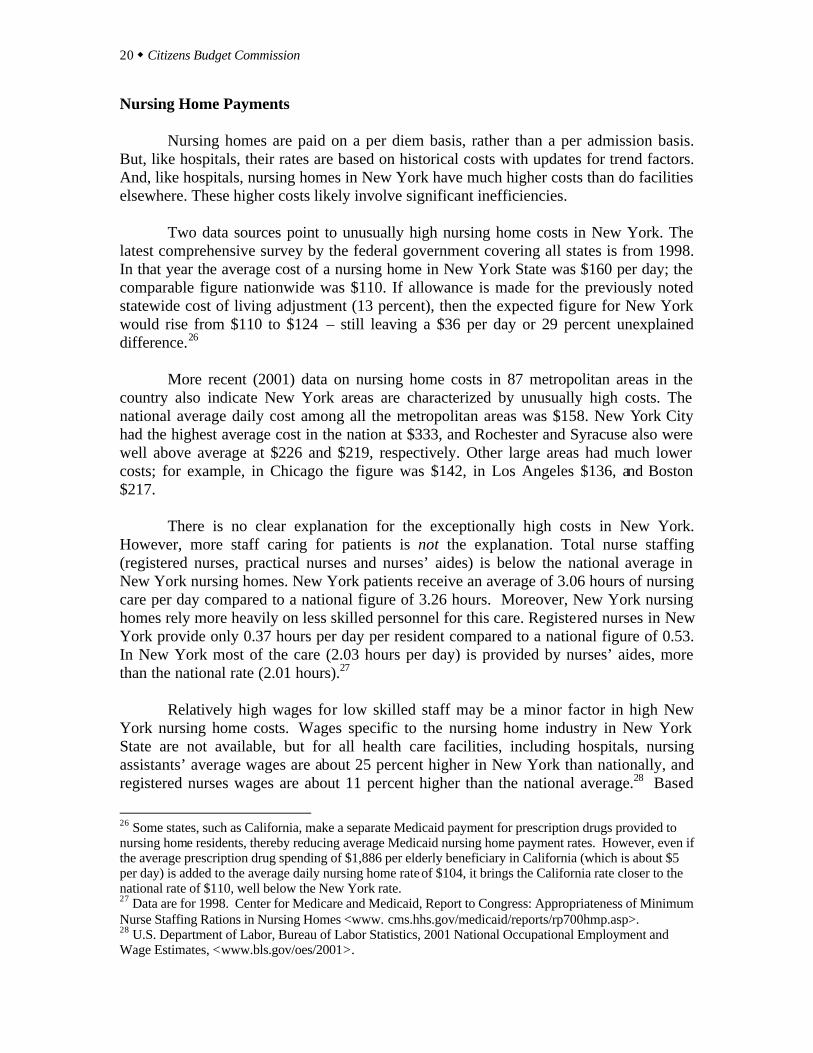
Nursing Home Payments
Nursing homes are paid on a per diem basis, rather than a per admission basis. But, like hospitals, their rates are based on historical costs with updates for trend factors. And, like hospitals, nursing homes in New York have much higher costs than do facilities elsewhere. These higher costs likely involve significant inefficiencies. Two data sources point to unusually high nursing home costs in New York. The latest comprehensive survey by the federal government covering all states is from 1998. In that year the average cost of a nursing home in New York State was $160 per day; the comparable figure nationwide was $110. If allowance is made for the previously noted statewide cost of living adjustment (13 percent), then the expected figure for New York would rise from $110 to $124 – still leaving a $36 per day or 29 percent unexplained difference.26 More recent (2001) data on nursing home costs in 87 metropolitan areas in the country also indicate New York areas are characterized by unusually high costs. The national average daily cost among all the metropolitan areas was $158. New York City had the highest average cost in the nation at $333, and Rochester and Syracuse also were well above average at $226 and $219, respectively. Other large areas had much lower costs; for example, in Chicago the figure was $142, in Los Angeles $136, and Boston $217. There is no clear explanation for the exceptionally high costs in New York. However, more staff caring for patients is not the explanation. Total nurse staffing (registered nurses, practical nurses and nurses’ aides) is below the national average in New York nursing homes. New York patients receive an average of 3.06 hours of nursing care per day compared to a national figure of 3.26 hours. Moreover, New York nursing homes rely more heavily on less skilled personnel for this care. Registered nurses in New York provide only 0.37 hours per day per resident compared to a national figure of 0.53. In New York most of the care (2.03 hours per day) is provided by nurses’ aides, more than the national rate (2.01 hours).27
Relatively high wages for low skilled staff may be a minor factor in high New York nursing home costs. Wages specific to the nursing home industry in New York State are not available, but for all health care facilities, including hospitals, nursing assistants’ average wages are about 25 percent higher in New York than nationally, and registered nurses wages are about 11 percent higher than the national average.28 Based
26 Some states, such as California, make a separate Medicaid payment for prescription drugs provided to nursing home residents, thereby reducing average Medicaid nursing home payment rates. However, even if the average prescription drug spending of $1,886 per elderly beneficiary in California (which is about $5 per day) is added to the average daily nursing home rate of $104, it brings the California rate closer to the national rate of $110, well below the New York rate. 27 Data are for 1998. Center for Medicare and Medicaid, Report to Congress: Appropriateness of Minimum Nurse Staffing Rations in Nursing Homes <www. cms.hhs.gov/medicaid/reports/rp700hmp.asp>. 28 U.S. Department of Labor, Bureau of Labor Statistics, 2001 National Occupational Employment and Wage Estimates, <www.bls.gov/oes/2001>.
Confronting the Tradeoffs in Medicaid Cost Containment w 21
on the previously cited cost of living differences, nursing salaries follow national norms, but nursing aides’ wages are about 12 percent higher than the adjusted national average. It is likely that average wages for aides in nursing homes are actually lower than the industry-wide average. Nevertheless, these higher wages for aides do not account for the higher costs since homes in New York are spending less in total for nurses. Most of the nursing care in New York homes is provided by nursing assistants rather than by registered nurses, whose average wages are more than double those of assistants.
The cost and mix of labor do not account for higher nursing home costs. Other resources are used inefficiently. The Medicaid program need not underwrite such practices by paying rates linked to non-competitive costs. Intermediate Care Facilities
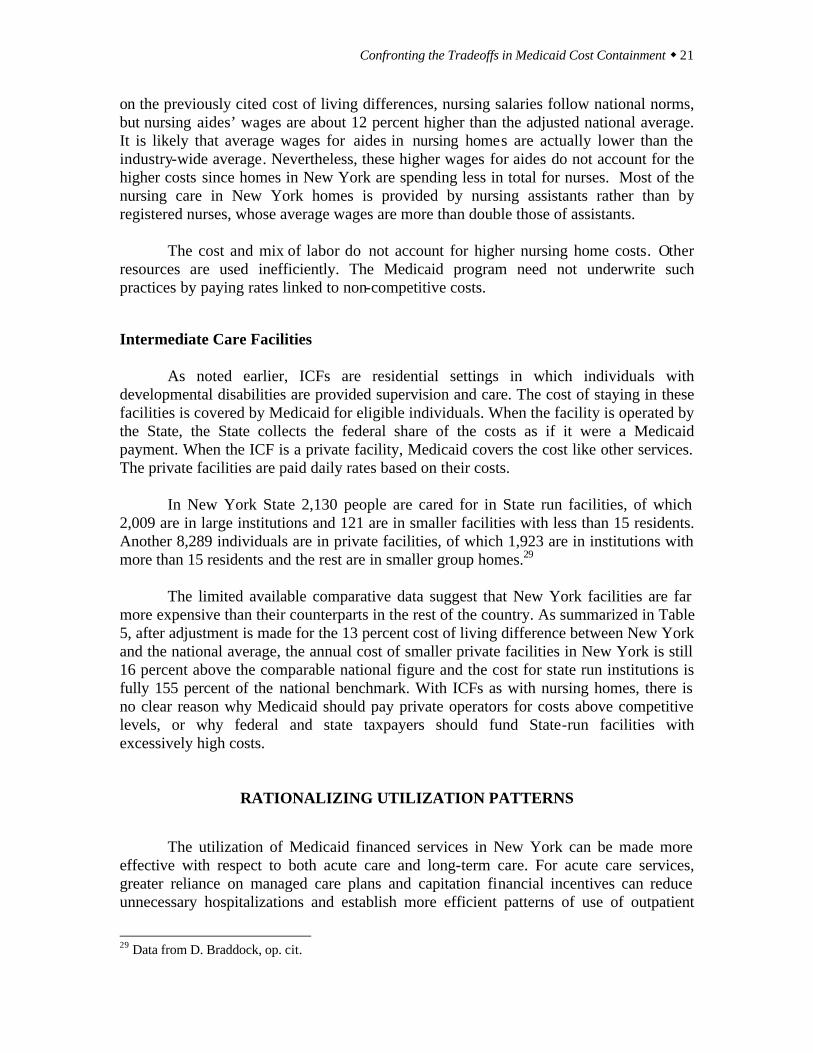
As noted earlier, ICFs are residential settings in which individuals with developmental disabilities are provided supervision and care. The cost of staying in these facilities is covered by Medicaid for eligible individuals. When the facility is operated by the State, the State collects the federal share of the costs as if it were a Medicaid payment. When the ICF is a private facility, Medicaid covers the cost like other services. The private facilities are paid daily rates based on their costs.
In New York State 2,130 people are cared for in State run facilities, of which 2,009 are in large institutions and 121 are in smaller facilities with less than 15 residents. Another 8,289 individuals are in private facilities, of which 1,923 are in institutions with more than 15 residents and the rest are in smaller group homes.29
The limited available comparative data suggest that New York facilities are far more expensive than their counterparts in the rest of the country. As summarized in Table 5, after adjustment is made for the 13 percent cost of living difference between New York and the national average, the annual cost of smaller private facilities in New York is still 16 percent above the comparable national figure and the cost for state run institutions is fully 155 percent of the national benchmark. With ICFs as with nursing homes, there is no clear reason why Medicaid should pay private operators for costs above competitive levels, or why federal and state taxpayers should fund State-run facilities with excessively high costs.
RATIONALIZING UTILIZATION PATTERNS
The utilization of Medicaid financed services in New York can be made more effective with respect to both acute care and long-term care. For acute care services, greater reliance on managed care plans and capitation financial incentives can reduce unnecessary hospitalizations and establish more efficient patterns of use of outpatient
29 Data from D. Braddock, op. cit.
22 w Citizens Budget Commission
care. For long-term care services, the greatest challenge is to reduce an unusually high rate of use of personal care services at home among the elderly and disabled.
Two recent studies highlight the inefficiencies in acute care utilization in New
York, especially for hospital services. A nationwide study of regional variations in Medicare spending found that average spending per beneficiary adjusted for gender, race, age, socioeconomic status and degree of illness for traditional Medicare patients (those not enrolled in a managed care program) ranged from a high of $16,333 in New York City to under $7,900 in the lowest cost regions. The study attributes the higher costs in New York and other high cost regions to the overall quantity of medical services provided. It noted physician practices of using more specialist referrals, diagnostic tests, and hospital-based care. The study also concluded that these practices in higher spending regions showed no evidence of improved functional status, greater satisfaction with care, or survival.30
A second study specific to New York City Medicaid beneficiaries shows that the
lack of management of high-cost, chronically ill patients results in repeated hospitalizations for conditions that could be treated on an outpatient basis. 31 The study also shows that these high-cost cases are readily identifiable and could be better managed either through an insurance product or through direct payments to primary care physicians to monitor the care of chronically ill patients. More Managed Care Participation
Most states have viewed managed care, when properly implemented, as a “win-win” arrangement under which taxpayers save money and needy clients get better care. As a result, Medicaid managed care participation has risen nationwide. In 1996 about 40 percent of Medicaid enrollees were in a managed care plan; by 2002 the figure had grown to 57 percent. 32 New York was relatively slow to join the managed care movement. The State legislature first passed a law with incentives for enrollment in 1991, but a meaningful statewide initiative including mandates for enrollment among most groups was not launched until 1997. By 2002 managed care enrollment in New York comprised 45 percent of the Medicaid population compared to the national average of 57 percent.
30 Elliot Fisher et. al., “The Implications of Regional Variations in Medicare Spending, Part 1: The Content, Quality, and Accessibility of Care and Part 2: Health Outcomes and Satisfaction with Care,” Annals of Internal Medicine, February, 18, 2003, Volume 138, <www.csi/reprint/138/41/288.pdf/> (Number 4, 2003). 31 John Billings, et.al., “Managing High Cost Patients: A Profile of New York City Medicaid High Cost Patients,” presented at the United Hospital Fund Conference, Medicaid and Managed Care, December 10, 2003. 32 Centers for Medicare and Medicaid Services, Medicaid Managed Care Enrollment Report, December 31, 2002, <cms.hhs.gov/medicaid/managedcare/mmcpr02.pdf> (September 30, 2003).
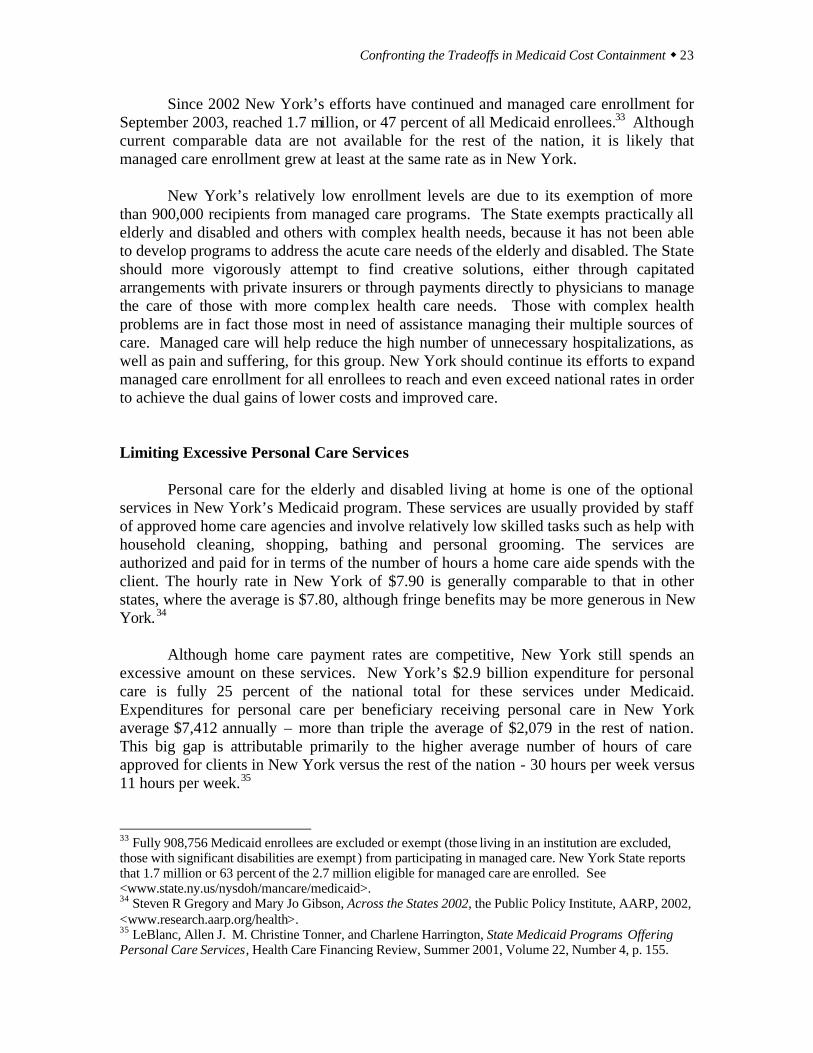
Confronting the Tradeoffs in Medicaid Cost Containment w 23
Since 2002 New York’s efforts have continued and managed care enrollment for September 2003, reached 1.7 million, or 47 percent of all Medicaid enrollees.33 Although current comparable data are not available for the rest of the nation, it is likely that managed care enrollment grew at least at the same rate as in New York.
New York’s relatively low enrollment levels are due to its exemption of more than 900,000 recipients from managed care programs. The State exempts practically all elderly and disabled and others with complex health needs, because it has not been able to develop programs to address the acute care needs of the elderly and disabled. The State should more vigorously attempt to find creative solutions, either through capitated arrangements with private insurers or through payments directly to physicians to manage the care of those with more complex health care needs. Those with complex health problems are in fact those most in need of assistance managing their multiple sources of care. Managed care will help reduce the high number of unnecessary hospitalizations, as well as pain and suffering, for this group. New York should continue its efforts to expand managed care enrollment for all enrollees to reach and even exceed national rates in order to achieve the dual gains of lower costs and improved care. Limiting Excessive Personal Care Services
Personal care for the elderly and disabled living at home is one of the optional services in New York’s Medicaid program. These services are usually provided by staff of approved home care agencies and involve relatively low skilled tasks such as help with household cleaning, shopping, bathing and personal grooming. The services are authorized and paid for in terms of the number of hours a home care aide spends with the client. The hourly rate in New York of $7.90 is generally comparable to that in other states, where the average is $7.80, although fringe benefits may be more generous in New York.34 Although home care payment rates are competitive, New York still spends an excessive amount on these services. New York’s $2.9 billion expenditure for personal care is fully 25 percent of the national total for these services under Medicaid. Expenditures for personal care per beneficiary receiving personal care in New York average $7,412 annually – more than triple the average of $2,079 in the rest of nation. This big gap is attributable primarily to the higher average number of hours of care approved for clients in New York versus the rest of the nation - 30 hours per week versus 11 hours per week.35
33 Fully 908,756 Medicaid enrollees are excluded or exempt (those living in an institution are excluded, those with significant disabilities are exempt) from participating in managed care. New York State reports that 1.7 million or 63 percent of the 2.7 million eligible for managed care are enrolled. See <www.state.ny.us/nysdoh/mancare/medicaid>. 34 Steven R Gregory and Mary Jo Gibson, Across the States 2002, the Public Policy Institute, AARP, 2002, <www.research.aarp.org/health>. 35 LeBlanc, Allen J. M. Christine Tonner, and Charlene Harrington, State Medicaid Programs Offering Personal Care Services, Health Care Financing Review, Summer 2001, Volume 22, Number 4, p. 155.
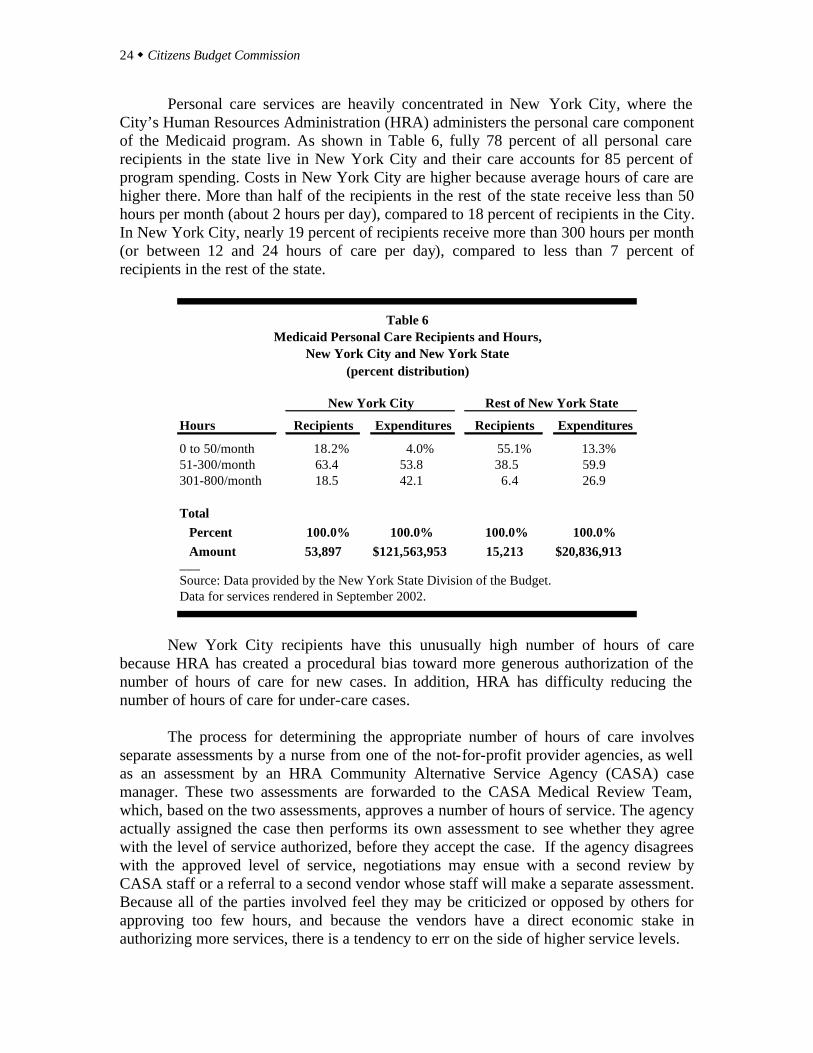
24 w Citizens Budget Commission
Personal care services are heavily concentrated in New York City, where the City’s Human Resources Administration (HRA) administers the personal care component of the Medicaid program. As shown in Table 6, fully 78 percent of all personal care recipients in the state live in New York City and their care accounts for 85 percent of program spending. Costs in New York City are higher because average hours of care are higher there. More than half of the recipients in the rest of the state receive less than 50 hours per month (about 2 hours per day), compared to 18 percent of recipients in the City. In New York City, nearly 19 percent of recipients receive more than 300 hours per month (or between 12 and 24 hours of care per day), compared to less than 7 percent of recipients in the rest of the state.
Hours Recipients Expenditures Recipients Expenditures
0 to 50/month 18.2% 4.0% 55.1% 13.3%51-300/month 63.4 53.8 38.5 59.9301-800/month 18.5 42.1 6.4 26.9
Total Percent 100.0% 100.0% 100.0% 100.0% Amount 53,897 $121,563,953 15,213 $20,836,913___Source: Data provided by the New York State Division of the Budget. Data for services rendered in September 2002.
Rest of New York StateNew York City
Table 6Medicaid Personal Care Recipients and Hours,
New York City and New York State(percent distribution)
New York City recipients have this unusually high number of hours of care
because HRA has created a procedural bias toward more generous authorization of the number of hours of care for new cases. In addition, HRA has difficulty reducing the number of hours of care for under-care cases.
The process for determining the appropriate number of hours of care involves separate assessments by a nurse from one of the not-for-profit provider agencies, as well as an assessment by an HRA Community Alternative Service Agency (CASA) case manager. These two assessments are forwarded to the CASA Medical Review Team, which, based on the two assessments, approves a number of hours of service. The agency actually assigned the case then performs its own assessment to see whether they agree with the level of service authorized, before they accept the case. If the agency disagrees with the approved level of service, negotiations may ensue with a second review by CASA staff or a referral to a second vendor whose staff will make a separate assessment. Because all of the parties involved feel they may be criticized or opposed by others for approving too few hours, and because the vendors have a direct economic stake in authorizing more services, there is a tendency to err on the side of higher service levels.

Confronting the Tradeoffs in Medicaid Cost Containment w 25
For existing cases, especially those initiated after a hospital stay, it is difficult for
HRA to reduce hours when appropriate. A higher level of service is often required shortly after a hospital discharge. However, when reviews are conducted after the patient has recuperated the patient typically feels entitled to the initial level of service. Consequently patients often seek “fair hearings” to prevent service reductions, with the hearing outcomes usually favoring the client.
RETAIN THE CURRENT SCOPE OF BENEFITS The facts that (a) New York State offers many optional benefits and (b) these optional benefits account for about 45 percent of total spending have led some to urge that the scope of benefits be reduced. However, this policy is misguided for two reasons. First, eliminating benefits will not reduced expenditures by as much as the simple facts above would indicate. Many optional benefits meet needs that would lead to alternative, mandatory services, if the optional benefits were not available. In many cases those alternatives are even more expensive than the optional benefits. For example, if care by dentists is replaced by care by oral surgeons, care by opticians by visits to ophthalmologists, and care by podiatrists by visits to orthopedists, then expenditures will be greater not less. Similarly, if elderly receiving home care are obliged to be admitted to nursing homes, then this will increase expenditures. Eliminating the single largest optional acute service, prescription drugs, is likely to lead to greater need for emergency care and hospital admissions, rather than reduce total expenditures. Second, to the extent the elimination of some benefits actually reduces available care, then the consequence also is undesirable. The policies recommended above are each intended to save money without denying people needed care. Eliminating benefits does not meet this standard for a desirable policy. If, for example, fewer people receive routine dental care or some people with a need for glasses cannot obtain them, then the strategy ought to be avoided.
The optional benefit with the greatest cost is prescription drugs. (Refer to Table 3.) Recently enacted federal legislation adds prescription drug coverage to the Medicare program effective in 2006. Of the nearly $2.4 billion spent for prescription drugs for Medicaid enrollees in New York State in 2000, about $1.2 billion was for the “dual eligible” elderly and disabled, who will become eligible for this benefit under Medicare. However, the new Medicare benefit has significant co-payment requirements, and Medicaid may cover those payments. While the likely savings to State taxpayers are difficult to predict precisely, it is likely that Medicaid expenditures for prescription drugs will be reduced due to the new Medicare benefit.
26 w Citizens Budget Commission
FISCAL AND OTHER IMPLICATIONS Implementing the foregoing recommendations would reduce New York State Medicaid expenditures by billions of dollars annually. The general magnitude of the savings associated with each strategy will be estimated below. But like any significant reduction in public expenditures, these changes would have other politically significant implications. These other implications also should be addressed in considering the recommended actions. Fiscal Implications
Table 7 summarizes the general magnitude of the savings associated with each recommendation. The estimates are based on program characteristics in federal fiscal year 2000 and are, in fact, likely to be greater in future years.
Source Total Federal State Local
Eligibility a $608 $304 $241 $63 Reduce medically needy eligibles
Rates $2,484 $1,242 $900 $342 Reduce hospital rates 620 310 155 155 Reduce nursing home rates 1,441 721 576 144 Reduce ICF rates b 423 211 169 43
Utilization $1,529 $765 $538 $226 Increase managed care enrollment 489 245 122 122 Reduce personal care hours 1,040 520 416 104
TOTAL $4,621 $2,311 $1,679 $631___Sources: See text. Notes: ª Allocation of savings based on dual-eligibles' proportion of acute and long term care costs, as reported in B. Bruen and T. Holahan, op.cit. b ICF allocation of savings is not adjusted for State agency expenditures with no local share.
Savings
Table 7Summary of New York State Medicaid Savings
(dollars in millions)
Eligibility. More careful design and better enforcement of eligibility rules for the elderly and disabled medically needy will reduce the number of such people receiving Medicaid funded long-term care. About 300,000 individuals in New York State receive benefits through these provisions. How many would be obliged to pay privately for care if the inequitable loopholes in the rules were closed?
Confronting the Tradeoffs in Medicaid Cost Containment w 27
Some insight into the answer to this question can be gleaned from studies of the “dual eligible” population, defined as those eligible for both Medicaid and Medicare. In the rest of the nation, approximately 85 percent of the dually-eligible qualify for the full Medicaid benefits package; the others receive a narrower range of Medicaid benefits because states have limited the benefits for those with higher incomes or assets. Most states give full Medicaid benefits only to those with incomes up to 100 percent of the FPL; aged individuals with incomes up to 135 percent of the FPL and some working disabled up to 200 percent of the FPL are eligible for the Medicare Savings program, which provides coverage for Medicare premiums and cost sharing, but provides no Medicaid benefits.36 Some dual-eligibles gain broader Medicaid benefits through “waiver” programs. The federal government will “waive” some eligibility criteria to allow states to provide innovative community-based services to groups who are at risk for expensive institutional care. Waiver programs generally place caps on the number of individuals enrolled, the types and amount of services provided, and on total funding for the program.
In New York, the medically-needy program allows those whose incomes and/or assets would disqualify them from eligibility for full benefits in other states to gain access to full Medicaid benefits. As a result, 89 percent of the dual eligibles in New York State have full Medicaid benefits. This 4 percent difference in full Medicaid coverage for dual-eligibles between New York and the rest of the nation is one indicator of the impact of more generous eligibility practices in New York. The 4 percent difference translates into about 24,200 more people getting benefits in New York than if national norms were at work. Given New York’s high costs for these individuals ($25,137 per dual-eligible compared to a national average of $12,647), the savings from fewer such eligibles would reach $608 million annually. Payment Rates. Limiting provider payments to rates based on competitive costs would save about $2.5 billion annually. Lower hospital rates would account for about $620 million, based an a 13 percent reduction in order to bring current rates in line with per admission costs adjusted for intensity of care and regional cost of living. 37
For nursing homes, the reduction to payments after adjusting for cost of living would be 29 percent. (Refer to Table 5.) However, this reduction would not apply to current total nursing home expenditures, because about a 5 percent reduction in the
36 Data in this and the next paragraph are from Brian Bruen and John Holahan, Shifting the Cost of Dual Eligibles: Implications for States and the Federal Government, The Kaiser Commission on Medicaid and the Uninsured. November 2003, <http://www.kff.org>. 37 Total hospital expenditures of $4,773 million from Table 3 reduced by 13 percent based on data in Table 5.
28 w Citizens Budget Commission
nursing home expenditures would result from the eligibility changes described above.38 Thus, the savings attributable to lower rates would be $1.4 billion annually. 39
For ICFs, the limited available data suggested reductions in the range of 16 to 55 percent in order to bring rates in line with competitive costs. (Refer to Table 5.) The calculation in Table 7 assumes an average reduction of 20 percent. It is unlikely that the eligibility reductions above would apply to ICF recipients and thus the savings is assumed to apply to total ICF expenditures. This yields estimated savings of $423 million annually. 40 Rationalizing Utilization. The two initiatives to rationalize utilization would result in savings totaling nearly $1.5 billion. The effort to bring use of personal care services more in line with national norms represents about $1.0 billion annually. This assumes that the average number of hours of personal care authorized for clients can be reduced from the current average to a figure still 50 percent above the national average; that is from an average of 30 to 17 hours per week. The calculation in Table 7 also allows for the change in eligibility, which lowers the number of people receiving personal care under Medicaid.41 For managed care enrollment, New York State lags national norms because it exempts most elderly and disabled Medicaid enrollees. In the future, efforts should be made to build the capacity among managed care organizations to manage care for these groups effectively. They are the most expensive beneficiaries, and there is strong evidence of ineffective utilization patterns among these groups, particularly for acute care in the form of repeated and unnecessary hospitalizations. A suitable goal would be to enroll about one-third of the elderly and disabled eligibles, or about 350,000 individuals, in a managed care plan. A reasonable estimate is that effective managed care would reduce the acute care costs for this population by 15 percent. This would yield savings of $489 million annually.42
It is unlikely that all these recommendations could be implemented in one year. A three-year implementation schedule is more realistic and likely to allow more time for
38 For savings calculations, it is assumed that half of the eligibility reductions will be among nursing home residents and half among home care recipients, or a reduction of 12,100 recipients in each type of service. This represents about 5 percent of nursing home residents and about 17.5 percent of personal care recipients. 39 Total nursing home expenditures from Table 3 are $5,232 million. A 5 percent reduction in eligibility lowers this to $4,970 million. A savings of 29 percent of this sum is $1,441 million. 40 The ICF expenditures in Table 3 total $2,114 million. A 20 percent savings is $423 million. 41 Total personal care expenditures in Table 3 are $2,933 million. The change in eligibility reduces the caseload by 12,100 individuals or 17.5 percent. A proportional reduction in expenditures makes the personal care total $2,419 million. The change in hours from 30 to 17 is a 43 percent reduction. Applying this percent to $2,419 million yields a savings of $1,040 million. 42 Based on data from the Centers for Medicare and Medicaid (See Table 3), acute care spending for the aged and disabled averages $9,685 per beneficiary annually. Of this total, $2,802 is for hospital inpatient care. This hospital spending would be lowered by 13 percent due to the rate changes described above. Adjusting for the rate change lowers the total acute care spending per beneficiary to $9,321. A 15 percent savings on this figure is $1,398. This savings for 350,000 individuals totals $489 million.
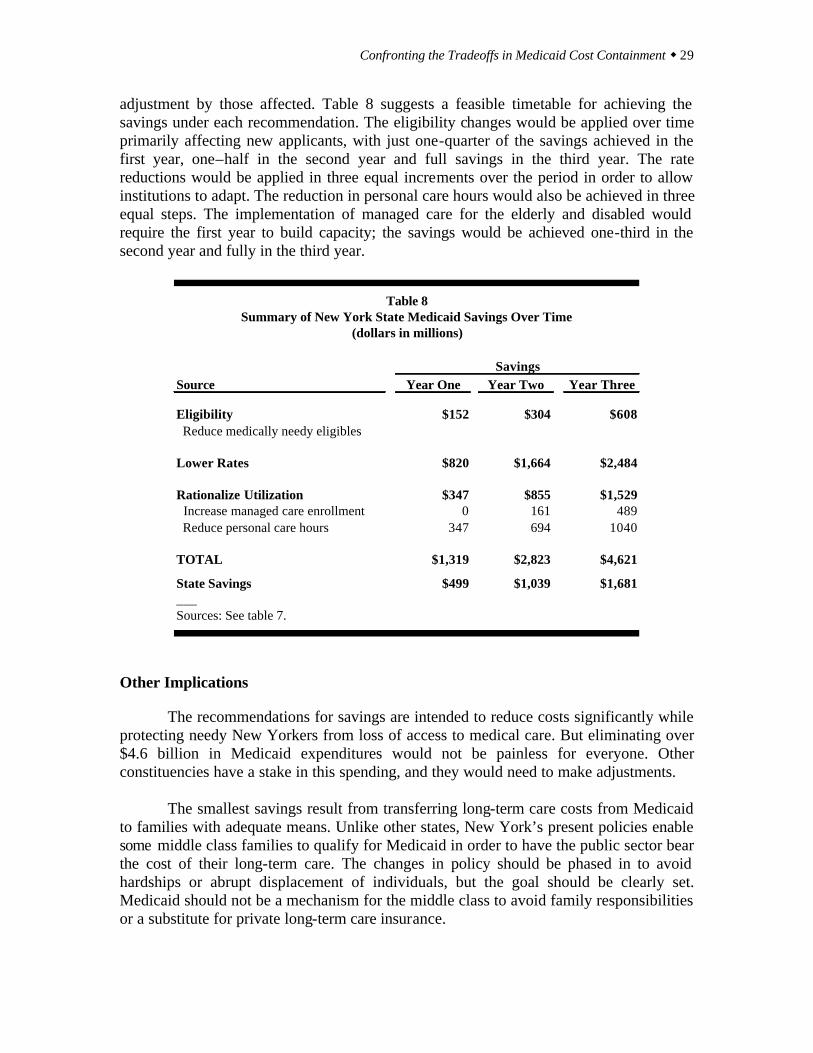
Confronting the Tradeoffs in Medicaid Cost Containment w 29
adjustment by those affected. Table 8 suggests a feasible timetable for achieving the savings under each recommendation. The eligibility changes would be applied over time primarily affecting new applicants, with just one-quarter of the savings achieved in the first year, one–half in the second year and full savings in the third year. The rate reductions would be applied in three equal increments over the period in order to allow institutions to adapt. The reduction in personal care hours would also be achieved in three equal steps. The implementation of managed care for the elderly and disabled would require the first year to build capacity; the savings would be achieved one-third in the second year and fully in the third year.
Source Year One Year Two Year Three
Eligibility $152 $304 $608 Reduce medically needy eligibles
Lower Rates $820 $1,664 $2,484
Rationalize Utilization $347 $855 $1,529 Increase managed care enrollment 0 161 489 Reduce personal care hours 347 694 1040
TOTAL $1,319 $2,823 $4,621
State Savings $499 $1,039 $1,681___Sources: See table 7.
Savings
Table 8Summary of New York State Medicaid Savings Over Time
(dollars in millions)
Other Implications The recommendations for savings are intended to reduce costs significantly while protecting needy New Yorkers from loss of access to medical care. But eliminating over $4.6 billion in Medicaid expenditures would not be painless for everyone. Other constituencies have a stake in this spending, and they would need to make adjustments. The smallest savings result from transferring long-term care costs from Medicaid to families with adequate means. Unlike other states, New York’s present policies enable some middle class families to qualify for Medicaid in order to have the public sector bear the cost of their long-term care. The changes in policy should be phased in to avoid hardships or abrupt displacement of individuals, but the goal should be clearly set. Medicaid should not be a mechanism for the middle class to avoid family responsibilities or a substitute for private long-term care insurance.

30 w Citizens Budget Commission
The payment rate reductions would present challenges to those who now manage hospitals, nursing homes and ICFs. They would have to become more innovative and find ways to maintain services with lower revenues, but they would not be asked to do any more than their counterparts in other states already are achieving. Once adjustments are made for differences in regional costs and in case-mix, there is no justification for paying institutions in New York more than those in the rest of the country. The notable qualification to this point is that New York’s hospitals make a case for higher payments based on their greater commitment to graduate medical education. But it makes little or no sense for New Yorkers to underwrite this educational mission with state and local dollars, because the physicians trained in New York practice elsewhere once they complete their residencies. The policy objective to which hospital leaders should adjust is a smaller role for New York hospitals in graduate medical education, rather than continued extra financial support in order to play the bigger educational role. Both the payment rate changes and the utilization changes would lower the total amount spent on health care services in the state. (In contrast, the eligibility changes would shift the sources of the spending from the public to the private sector, but not necessarily lower the amount.) In addition to reducing revenues for institutions, these lower expenditures would also reduce the number of workers needed to provide health care services in the state. Since compensation averages about $44,000 per worker and compensation averages about 70 percent of total health care expenditures, the non-eligibility-related savings of about $4,013 million would translate into employment reductions of about 64,000 jobs statewide.43 This would be about a 5.5 percent reduction in employment in the state’s health care industry. 44 This reduction should be seen in the context of recent growth in the industry even during a recession period. Between 2000 and 2002 health care and social services added nearly 43,000 jobs while total employment in the state fell nearly 200,000. Careful plans should be made to help affected workers adjust to this change, but the goal should remain getting New York’s health care costs and utilization in line with competitive standards rather than employing people unproductively.
It must be stressed that the $4.6 billion in savings will not disappear from the New York State economy; the money will be available for other public services (or for private spending, if taxes are lowered). The shifted expenditures will create other types of jobs and total employment in the state need not be reduced. People will be obliged to respond to new patterns of demand, but jobs will be available and they will be producing what New Yorkers want.
43 Average wages in the health care and social assistance industry in New York State in 2002 are $34,305, based on the New York State Department of Labor, ES202 series. Assuming fringe benefits average 28 percent of wages, and that total compensation including fringe benefits is 70 percent of total health care expenditures, this brings total expenditures per job to $62,729. Based on this figure, non-eligibility related savings of $4,013 million would be the equivalent of just under 64,000 jobs. 44 Total industry employment is estimated based on reported average annual in 2002 for the health care and social assistance industry of 1,114,490, using New York State Department of Labor ES202 series. In addition, there are affected health care jobs in the government sector including local government public hospitals and State agencies operating hospitals and residential care facilities. An estimated 40,000 jobs are in government sponsored health care facilities, bringing the estimated total to 1,154,490.
Confronting the Tradeoffs in Medicaid Cost Containment w 31
One final point should be made about the responses to the proposed Medicaid savings. Because these expenditures are financed one-half by the federal government, half the savings would accrue to the federal budget. This could remove some of the money from the New York economy (depending on the assumptions made about how the federal government uses the money). In order for the adverse impacts of the Medicaid reductions to be minimized, State leaders should negotiate with federal officials to incorporate some “budget neutral” arrangement with the federal government. That is, as with many federal waiver programs, a major cost-cutting initiative in New York should allow New Yorkers to share the benefits obtained by the federal government as a result of the State’s efforts.
32 w Citizens Budget Commission
Appendix I
Analysis of Additional Medicaid Reform Proposals During the period when the Citizens Budget Commission (CBC) was preparing
this report, three other packages of Medicaid reforms were suggested by State-sponsored groups – the Senate Medicaid Reform Task Force, a panel convened by Governor Pataki called The Health Care Reform Working Group, and the Governor in his Executive Budget. This Appendix reviews each effort and indicates how it relates to the CBC’s recommended strategies.
The Senate Task Force released its report on December 22, 2003. It makes 47
recommendations, categorized under three objectives: to promote cost effectiveness and efficiency; to reform the long-term care system; and to provide fiscal relief to local governments. The report itself includes no estimates of savings from the recommendations, but the press release accompanying the report states the cumulative savings over the next five years would be $2.5 billion. However, at least $1 billion of the “savings” is only a shift of costs from localities to the State. The remaining savings are not allocated to specific recommendations, but the bulk of the savings appear to come from changes in prescription drug benefits and in the Family Health Plus program described below.
The Health Care Reform Working Group released an Interim Report on January
13, 2004. It presents 10 recommendations for reforming two areas of rising Medicaid costs--prescription drugs and long-term care services. The group plans to address acute care issues in a future report. The Executive Summary of the Interim report indicates that the total cumulative savings from the ten recommendations would be $4.2 billon over the next five years, but does not allocate savings to any of the individual measures.
Governor Pataki released his Executive Budget on January 20, 2004. It includes
23 items involving Medicaid, some of which increase costs but most of which are intended to yield savings. The total net savings from the proposals in State fiscal year 2004-05 are estimated at $1.1 billion.
Overall, the ways in which these proposals relate to the CBC’s recommendations
can be summarized as follows.
1. Each report contains recommendations that are consistent with some of the CBC’s recommendations. All three efforts support better utilization for the aged and disabled through managed care or similar arrangements, and they seek to close loopholes in eligibility for long-term care. In addition. the Governor’s Executive Budget proposes significant rate reductions for hospitals and nursing homes through an assessment mechanism.
2. The Senate Task Force report and the Executive Budget contain recommendations
that contradict those of the CBC by calling for eligibility restrictions for acute
Confronting the Tradeoffs in Medicaid Cost Containment w 33
care services and reducing the scope of benefits. The Senate group would reduce eligibility for Family Health Plus by imposing an asset test and cost-sharing. The Executive Budget would oblige some children now eligible for Medicaid to shift to Child Health Plus, which provides fewer benefits. It also would impose an asset test for Family Health Plus and eliminate dental and vision services for that program.
3. All three efforts identify meritorious savings approaches for prescription drug
benefits that are not included in the CBC report. Each report contains similar recommendations for savings on prescription drugs involving establishment of a preferred drug list and prior authorization requirements for some prescriptions.
4. Each report calls for State assumption of some current local Medicaid costs, an
approach that falls short of CBC’s prior, long-standing recommendation for full State assumption of all local Medicaid and public assistance costs. The Senate group calls for State assumption of current local costs for the Family Health Plus program over two years; the Working Group and the Executive Budget call for State assumption of current local long-term care costs, with the Executive Budget specifying a ten-year phase-in. The CBC in previous reports issued in 1992 and 1996 recommends State assumption of all local Medicaid and public assistance costs.
The remainder of this Appendix summarizes the specific recommendations in each report in the context of these four conclusions with some additional observations.
Proposals Consistent with CBC’s Recommendations
Of the Senate Task Force’s 47 recommendations, 24 are consistent with CBC’s recommendations relating to utilization and eligibility. This includes eight recommendations relating to the closing of eligibility loopholes for long-term care. Another four recommendations relate primarily to more rational utilization of acute care services, including the establishment of disease management programs and mandatory managed care in rural areas. Another 12 recommendations are related to utilization controls to develop a seamless long-term care system. The Senate report attaches no savings numbers to these individual proposals.
Of the Working Group’s ten recommendations, seven are consistent with the
CBC’s recommendations relating to utilization and eligibility. Two of these aim at eligibility for long-term care by closing loopholes and by expanding private insurance opportunities. Better utilization of long-term care services is promoted by creating a comprehensive NY ANSWERS program; it involves three of the ten recommendations including creating a single point-of-entry into the long-term care system, “right-sizing” nursing homes, and demonstration projects for home and community-based services. The other two recommendations promoting more rational utilization are to enroll the elderly
34 w Citizens Budget Commission
and disabled populations in managed care plans, consistent with CBC’s proposals. The Working Group did not attached savings estimates to these recommendations.
The Executive Budget calls for three utilization reforms consistent with CBC’s
recommendations to expand managed care. First, the Budget proposes that those dually eligible for Medicare and Medicaid be moved into managed care; savings are estimated at $46 million in State funds, or $115 million total. Second, the Budget calls for the implementation of a case management program for high cost cases for total State savings of $8 million, or a total of $32 million. Third, the Executive Budget calls for moving about 300,000 additional Medicaid enrollees into managed care, with a focus on those currently eligible, rather than the currently exempt disabled population. The Budget does not specify any savings from this proposal.
The Executive Budget includes five measures that are effectively rate reductions.
Three take the form of assessments on hospitals, home care agencies, and nursing homes. The assessments are essentially taxes that reduce the net payments to these facilities, but they protect some of the federal portion of the payment. For hospitals and home care agencies, the assessment is 0.7 percent of revenues; for nursing homes, it is 6 percent. An additional reduction for nursing homes results from eliminating rate “add-ons” for nursing homes attached to hospitals or with more than 300 beds. The Budget also reduces ICF rates by lowering payments to counties for services provided to the mentally disabled in these facilities. The total savings from the rate reductions (about $450 million annually in total) is significantly less than recommended by CBC, but these measures are consistent with the strategy of rate reductions to providers.
Proposals Contradicting CBC’s Recommendations The Senate Task Force and the Executive Budget would change eligibility rules
and benefits in ways inconsistent with the CBC’s recommendations. The Senate Task Force recommends eligibility changes to the Family Health Plus Program by adding an asset test and cost sharing measures; it also recommends modifying the benefit structure in unspecified ways.
The Governor’s Budget proposes two eligibility reductions. One relates to moving
children from Medicaid to the Child Health Plus program (CHP). It would lower the income eligibility level for children between the ages of 6 to 19 from the current 133 percent of the Federal Poverty Level (FPL) to 100 percent of the FPL. The children made ineligible for Medicaid would become eligible for CHP. The Governor is proposing this because the federal matching rate for CHP is 65 percent, versus the 50 percent match for Medicaid. The CHP also requires no local funding. However, this is undesirable, because the CHP program provides children with fewer benefits than does Medicaid.
The Governor’s second eligibility restriction relates to Family Health Plus, for
which an asset test would be imposed. The Executive Budget also calls for benefit
Confronting the Tradeoffs in Medicaid Cost Containment w 35
reductions in Family Health Plus totaling $32 million by eliminating dental and vision services for this group.
Prescription Drug Proposals
Each of the proposals calls for reform of prescription drug benefits. Although CBC recommends waiting to see how the federal Medicare prescription drug benefit is implemented, the pharmacy program recommendations in each of the three proposals are similar and generally consistent with CBC principles for more appropriate utilization of services and for competitive rate structures. Each proposal’s prescription drug recommendations are therefore worthy of exploration.
The Senate Task Force proposes seven utilization and rate related
recommendations for improving the pharmaceutical program. These include establishing a preferred drug list (which would generate pharmaceutical rebates) and a prior authorization program, expanding the use of a federal discount program for outpatient providers, exploring the re-importation of drugs from Canada, expanding the use of generic drugs, varying reimbursement rates to reflect differences in a pharmacy’s acquisition costs, establishing a trial (fourteen day) supply of new prescriptions to ensure the patient responds favorably before a larger supply is ordered, and exploring re-use or return of un-opened drugs. The Senate estimates costs savings on pharmacy related changes would reach a cumulative total of $730 million over five years.
The Working Group and the Executive Budget both recommend the development
of a preferred drug list to generate higher rebates and prior authorization for certain drugs. The Executive Budget also calls for reductions in pharmacy reimbursements. The Executive Budget differs from the two other plans in its call for increased pharmacy co-payments by Medicaid recipients and the implementation of a program to reduce illegal marketing of drugs. The Working Group does not provide specific pharmacy related savings. The Executive Budget estimates these pharmacy changes would save the State $93 million and yield total savings of $382 million in fiscal year 2004-05. State Assumption of Local Medicaid Costs
Each proposal recommends the State assume some portion of local Medicaid
spending. Although this issue is not in the scope of this CBC report, the CBC has a long-standing position in favor of full State assumption of local Medicaid costs.45
The Senate Task Force report has six recommendations to provide fiscal relief to
local governments. The most significant fiscally is a State assumption over a two year period of local Family Health Plus expenditures, saving the counties $398 million annually when fully implemented. The other five measures in this category are to
45 See Citizens Budget Commission, A Plan for State Assumption of Local Income Maintenance and Medicaid Costs (May 1992) and Citizens Budget Commission, Budget 2000: Final Report (December 1996).
36 w Citizens Budget Commission
reallocate a portion of facilitated enrollment funds to counties, authorize local demonstration programs, provide greater financial incentives for counties to pursue asset recovery, provide better local access to State data bases, and work with the federal government to increase the federal share of Medicaid costs.
The Working Group recommends a State takeover of the local share of long-term
care costs. However, it proposes that the takeover be contingent upon the State realizing long-term care savings, presumably from implementation of their relevant recommendations. Since half the savings are realized by the federal government, the Group recommends federal savings be reinvested in the New York (possibly as a permanent increase in federal matching funds for Medicaid). This concept is consistent with CBC’s recommendation that the State negotiate with federal authorities to assure that federal savings that result from the State’s costs savings measures benefit the State.
The Executive Budget, like the Working Group, calls for a State assumption of
local government expenditures for long-term care costs. The Budget spreads the takeover over ten years and makes it contingent upon implementation of the nursing home and home care assessments as well as an estimated $25 million savings from closing eligibility loopholes for long-term care.
Other Proposals
Some proposals in the recent initiatives do not fit neatly into categories related to
the CBC’s strategies or the other concepts discussed above. These “other” proposals cover a variety of topics.
Nine proposals by the Senate Task Force seek to improve the Medicaid program
in diverse ways that are not specified in detail. Most of these recommendations fall under the Task Force’s objective of improving cost effectiveness and efficiency and are consistent with long-held views of the CBC related to promoting government efficiency, such as through maximizing the benefits of information technology. The exception is the proposal to move children from Medicaid to Child Health Plus, which absent eligibility reductions for Medicaid as described in the Executive Budget, would be inconsistent with federal regulations. If the Task Force is proposing reducing eligibility for children for Medicaid, it would be inconsistent with CBC’s views. No savings estimates are made for these proposals. Three proposals in the Executive Budget require further analysis. These are maximizing federal reimbursement for graduate medical education, re-financing capital debt for AIDS facilities, and updating the component of the nursing home rate to improve recruitment and retention of needed workers.

Confronting the Tradeoffs in Medicaid Cost Containment w 37
APPENDIX II
Offered in Number of StatesOptional Service New York Offering this Service a
Podiatrist Yes 27Optometrist Yes 28Chiropractor Yes 20Psychologist Yes 20Medical social worker No 6Nurse anesthetist No 16Private duty nursing Yes 16Clinic Yes 33Dental Yes 26Physical therapy Yes 29Occupational therapy Yes 24Speech, hearing and language disorder Yes 26Prescribed drugs Yes 32Dentures Yes 25Prosthetic devices Yes 31Eyeglasses Yes 27Diagnostic Yes 22Screening Yes 20Preventive Yes 20Rehabilitative Yes 31Services for age 65 and older in mental institutions: Inpatient hospital Yes 21 Skilled nursing facility Yes 17 Intermediate care facility for the mentally retarded No 22Inpatient psychiatric Yes 21Christian Science nurses No 2Christian Science sanitoria No 7Skilled Nursing facility for under age 21 Yes 26Emergency hospital Yes 25Personal care Yes 18Transportation Yes 32Case management Yes 27Hospice Yes 22Respiratory care No 9Tuberculosis related Yes 5___
Note: a Includes territories, data as of October 1996.
Source: US data from United State House of Representatives, Green Book 2000 , <frwebgate.access.gpo.gov/cgi-bin> (December 17, 2002); New York data from New York State Department of Social Services, Office of Management and Budget.
Table A-1Medicaid Optional Services