confocal reference free traction force microscopy - …igl.ethz.ch/projects/dots/ncomms12814.pdf ·...
TRANSCRIPT

ARTICLE
Received 13 Jun 2016 | Accepted 1 Aug 2016 | Published 29 Sep 2016
Confocal reference free traction force microscopyMartin Bergert1,*, Tobias Lendenmann1,*, Manuel Zundel2,*, Alexander E. Ehret2,3, Daniele Panozzo4,5,
Patrizia Richner1, David K. Kim6, Stephan J.P. Kress6, David J. Norris6, Olga Sorkine-Hornung4,
Edoardo Mazza2,3, Dimos Poulikakos1 & Aldo Ferrari1
The mechanical wiring between cells and their surroundings is fundamental to the regulation
of complex biological processes during tissue development, repair or pathology. Traction force
microscopy (TFM) enables determination of the actuating forces. Despite progress, impor-
tant limitations with intrusion effects in low resolution 2D pillar-based methods or disruptive
intermediate steps of cell removal and substrate relaxation in high-resolution continuum TFM
methods need to be overcome. Here we introduce a novel method allowing a one-shot (live)
acquisition of continuous in- and out-of-plane traction fields with high sensitivity. The method
is based on electrohydrodynamic nanodrip-printing of quantum dots into confocal mono-
crystalline arrays, rendering individually identifiable point light sources on compliant
substrates. We demonstrate the undisrupted reference-free acquisition and quantification of
high-resolution continuous force fields, and the simultaneous capability of this method to
correlatively overlap traction forces with spatial localization of proteins revealed using
immunofluorescence methods.
DOI: 10.1038/ncomms12814 OPEN
1 ETH Zurich, Laboratory of Thermodynamics in Emerging Technologies, Sonneggstrasse 3, 8092 Zurich, Switzerland. 2 ETH Zurich, Institute for MechanicalSystems, Leonhardstrasse 21, 8092 Zurich, Switzerland. 3 Empa, Swiss Federal Laboratories for Materials Science and Technology, Uberlandstrasse 129, 8600Dubendorf, Switzerland. 4 ETH Zurich, Institute for Visual Computing, Interactive Geometry Lab, Universitatstrasse 6, 8092 Zurich, Switzerland. 5 CourantInstitute of Mathematical Sciences, New York University, 719 Broadway, New York 10003, USA. 6 ETH Zurich, Optical Materials Engineering Laboratory,Leonhardstrasse 21, 8092 Zurich, Switzerland. * These authors contributed equally to this work. Correspondence and requests for materials should beaddressed to D.P. (email: [email protected]) or to A.F. (email: [email protected]).
NATURE COMMUNICATIONS | 7:12814 | DOI: 10.1038/ncomms12814 | www.nature.com/naturecommunications 1

Cells exert forces on their environment, mainly but notexclusively through the contractile acto-myosin machin-ery. These forces are transmitted to the extracellular
surroundings through integrin-based adhesions (that is, focaladhesions) and enable shape changes and directional migration1.The biological function of this mechanical machinery goesbeyond the simple physical anchoring and conveysenvironmental signals, which cells sense and respond to2.
Traction force microscopy (TFM) provides a powerful tool toexperimentally access cellular forces. In the last two decadesmultiple protocols for the measurement of cell-generatedtractions have been developed, based on the optical detection offorce-dependent deformations of compliant substrates3–5. Ofthese, lower-resolution discrete methods such as arrays of elasticmicro-posts6,7 allow the estimation of forces from a single image,yet carry significant limitations to the detection of out-of-planecomponents of traction forces, as well as artefacts due to theirnon-continuous, structured and intrusive nature5,8–10.Continuum TFM methods exploit elastic substrates containingrandomly dispersed fluorescent beads11–13. These approachesyield high-resolution in- and out-of-plane force maps but requirethe additional acquisition of a reference (load-free) image,typically captured on cell removal and destruction, whichmarkedly complicates experimental procedures and precludespost-processing such as the colocalization with immuno-fluorescence staining. Attempts to bypass these shortcomings,by applying micro-patterning of adhesive islands14,15 orlithographic photoresist into ordered arrays16, are hampered bymajor drawbacks such as the poor spatial resolution or theintroduction of intrusive topographical features. Molecularmethods, such as DNA-based force sensors17, entail very highspatial resolution (about 200 nm) and one-shot force magnitudedetection on flat, non-intrusive surfaces, but are unable to discernany force directionality.
Here we use highly precise electrohydrodynamic nanodrip-printing of quantum dots (QDs)18–21 into monocrystalline,confocal arrays on elastomeric substrates and introduce a high-resolution and reference-free method (called confocal TFM orcTFM), capable of in- and out-of-plane force detection, whichtakes advantage of many assets of previously developedapproaches while significantly advancing the landscape ofreference-free force detection in cell biology and medicine.
ResultsDesign of the cTFM platform. The cTFM set-up in Fig. 1a–c iscomprised of a typical, 170 mm glass coverslip spin-coated with aE30mm thick layer of a highly deformable CY52-276 silicone(Dow Corning)22–25. The CY52-276 silicone is a two-componentelastomer yielding bulk elastic moduli ranging from 1 to 20 kPafor mixing ratios close to 1:1 (Supplementary Fig. 1a). StandardPDMS (Sylgard 184) requires mixing ratios of around 1:60 toyield stiffnesses in the same range26,27. Silicones in general arevery viscous and sticky before curing, and handling smallamounts proves to be difficult. Thus, substrate preparation,especially for the small volumes required for spin-coatingapplications (ml regime), is simpler and more reliable withCY52-276 than for Sylgard 184. CY52-276 has a refractive indexof n632nm¼ 1.403 (ref. 28) and is optically transparent(Supplementary Fig. 1b). The point spread function measuredin standard fluorescence wide-field microscopy is similar to theone obtained with commonly used polyacrylamide gels(Supplementary Fig. 1c–e). A unit of 0.05% poly(dimethyl-siloxane-b-ethylene oxide) is added during silicone fabrication toincrease hydrophilicity29, which aids nanodrip-printingprecision18,19. All cTFM analyses shown in this work use a
CY52-276 mixing ratio of 9:10, which provides an elastic modulusof B12.6 kPa according to our mechanical tests. A nonlinearhyperelastic material model, required for the analysis oflarge deformations of the substrate, is defined based on acomprehensive mechanical characterization of thin-cast samplesin multi-axial mechanical tests30 (Fig. 1d and SupplementaryFig. 1f; for details see Methods). In addition, cyclic uniaxial strainrate sweep tests were performed between 0.3% and 5.2% s� 1 atlarge strains, and showed negligible rate dependence of thematerial response (Supplementary Fig. 1g).
The silicone surface features a monocrystalline array offluorescent nanodiscs, so that the lines connecting nearestneighbours form a grid of equilateral triangles (Fig. 1e). Eachprinted fluorescent nanodisc contains a countable number ofcustom-made QDs20 (Supplementary Movie 1). Individualnanodiscs are about 200 nm in diameter (Fig. 1e) and r30 nmin thickness and thus represent confocal point sources of light,emitting a bright and stable fluorescent signal (SupplementaryFig. 2), without introducing intrusive surface topography31.By varying the size and composition of the QDs (see Methodsfor details), fluorescent nanodiscs with various and well-defined emission spectra can be created (Fig. 1f), comparableand compatible with standard live-cell fluorescent proteins(for example, green fluorescent protein or mCherry). Sequentialnanodrip-printing on a single substrate can interlace multiplearrays to yield a palette of emissions, without crosstalk betweenQDs of different colour (Fig. 1g).
As previously demonstrated, electrohydrodynamic nanodrip-printing allows the generation of ordered nano-structureswith spatial resolution of 100–200 nm on dry surfaces18. As afirst step in the adaptation of this technology to TFM and basedon the requirements of the cases we studied, we printedmonocrystalline nanodisc arrays of custom-made QDdispersions on hydrophilic glass substrates with inter-discspacing ranging from 0.75 to 3 mm. This resulted in apositioning precision of 30–45 nm, which was almostindependent from the inter-disc spacing (SupplementaryFig. 3a). Printing of QDs was subsequently optimized forelastomeric substrates such as CY52-276 and yielded the sameprecision in nanodisc positioning (Fig. 1h). In general,electrohydrodynamic nanodrip-printing is not limited to thisparticular silicone and can be equally applied to other silicones.Moreover, with future optimization of the chemistry to ensurestable binding of QDs to polyacrylamide, a cTFM substrate basedon a hydrogel could be envisioned (Supplementary Fig. 4).
The achieved printing accuracy (Fig. 1h) is a key enabler inomitting cell removal for the acquisition of a referenceimage (Fig. 1b). An in silico analysis based on the definedmaterial model (Fig. 1d) revealed that with a printing error of35 nm the resulting noise in the calculated surface tractionsincreases from 100 to 500 Pa as the inter-disc spacing decreasesfrom 3 to 0.75 mm (Supplementary Fig. 3b,c). We thereforeapplied monochromatic arrays featuring inter-disc spacing of1.5 mm to single cells and of 3 mm to cell monolayers as an idealtrade-off between spatial resolution and force sensitivity.
After coating with fibronectin, adhering cells generatedeformations of the substrate, which are captured as distortionsof the fluorescent nanodisc array. A host of different cell typesincluding, but not limited to, rat embryo fibroblasts (REF-Pax32),HeLa cells, human umbilical vein endothelial cells and MCF10Amammary epithelial cells proved compatible with the cTFMplatform and induce dynamic deformations of the substrate todifferent extents (Figs 2a, 3a and 4b, and Supplementary Movies 2and 3). In addition, the cTFM platform is fully compatible withbiological applications, as no cytotoxicity is detected33
(Supplementary Fig. 5).
ARTICLE NATURE COMMUNICATIONS | DOI: 10.1038/ncomms12814
2 NATURE COMMUNICATIONS | 7:12814 | DOI: 10.1038/ncomms12814 | www.nature.com/naturecommunications
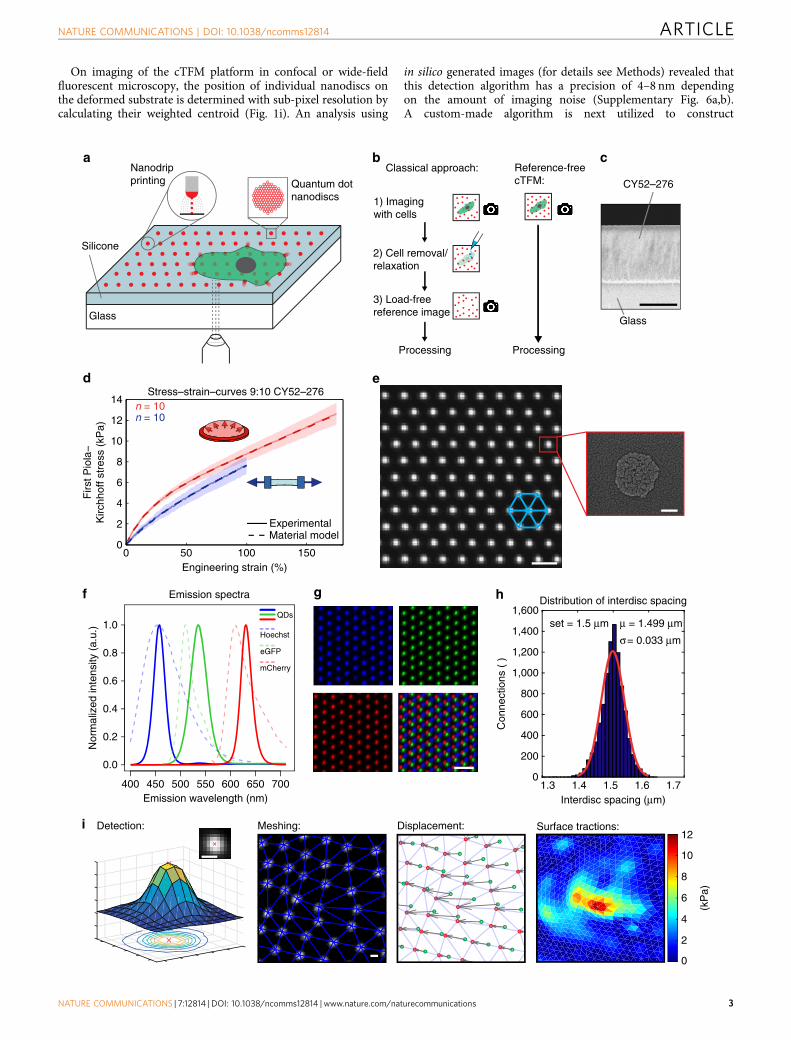
On imaging of the cTFM platform in confocal or wide-fieldfluorescent microscopy, the position of individual nanodiscs onthe deformed substrate is determined with sub-pixel resolution bycalculating their weighted centroid (Fig. 1i). An analysis using
in silico generated images (for details see Methods) revealed thatthis detection algorithm has a precision of 4–8 nm dependingon the amount of imaging noise (Supplementary Fig. 6a,b).A custom-made algorithm is next utilized to construct
Nanodripprinting
Silicone
Glass
Quantum dotnanodiscs
Classical approach: Reference-freecTFM:
1) Imagingwith cells
2) Cell removal/relaxation
3) Load-freereference image
Processing Processing
CY52–276
Glass
Emission spectra
Interdisc spacing (μm)1.3 1.4 1.5 1.6 1.7
Con
nect
ions
( )
0
200
400
600
800
1,000
1,200
1,400
1,600set = 1.5 μm μ = 1.499 μm
σ= 0.033 μm
Distribution of interdisc spacing
Stress–strain–curves 9:10 CY52–276
Detection: Meshing: Displacement: Surface tractions:
(kP
a)
400 450 500 550 600 650 700
0.0
0.2
0.4
0.6
0.8
1.0
Emission wavelength (nm)
Nor
mal
ized
inte
nsity
(a.
u.)
QDs
Hoechst
eGFP
mCherry
0
2
4
6
8
10
12
Firs
t Pio
la−
Kirc
hhof
f str
ess
(kP
a)
Experimental
Engineering strain (%)
Material model
0 50 100 1500
2
4
6
8
10
12
14n = 10n = 10
a b c
d e
f g h
i
NATURE COMMUNICATIONS | DOI: 10.1038/ncomms12814 ARTICLE
NATURE COMMUNICATIONS | 7:12814 | DOI: 10.1038/ncomms12814 | www.nature.com/naturecommunications 3
the triangular mesh by identifying the six original neighbours foreach individual QD nanodisc (Fig. 1i; see Methods andSupplementary Methods for details). The corresponding(load-free) regular arrangement of the disc array is thencomputationally reconstructed by relaxing the triangular meshback to an equilateral configuration (see Methods). Thisprocedure tracks individual nanodiscs and allows to reliablyextract displacement vectors (Fig. 1i, Supplementary Fig. 6c–e,and Supplementary Movies 3 and 4). Analysis of the in silicogenerated images showed that the reconstruction algorithm isprecise, resulting in positioning errors r30 nm (SupplementaryFig. 6b), which are within the limit of our printing precision. Onthe basis of the displacement vectors obtained from thereconstruction algorithm, the kinematic boundary conditions ofeach node on the surface of a finite element mesh are defined bymeans of interpolation with radial basis functions (see Methods).Surface tractions, defined in the deformed configuration (Cauchytractions), are finally obtained using nonlinear finite elementanalysis (FEA, Fig. 1i, for details see Methods). The FEA accountsfor both the nonlinear material properties of the substrate and theinherent geometrical nonlinearity associated with large deforma-tions observed in cTFM experiments, typically with strains largerthan 100%. For a 9:10 CY52-276 mixing ratio, this methodprovides a sensitivity of stress detection of 200 Pa (SupplementaryFig. 7). Owing to the nanometre precision in the printing ofnanodiscs and in the detection of their displacement, thecalculation of generating traction fields does not require aregularization step, circumventing this difficulty present inparticle image velocimetry (PIV)-based TFM procedures. cTFMis thus free from subjective parameterizations, which are prone tothe underestimation of tractions in regions of the substrate wherehigh deformations are detected34,35.
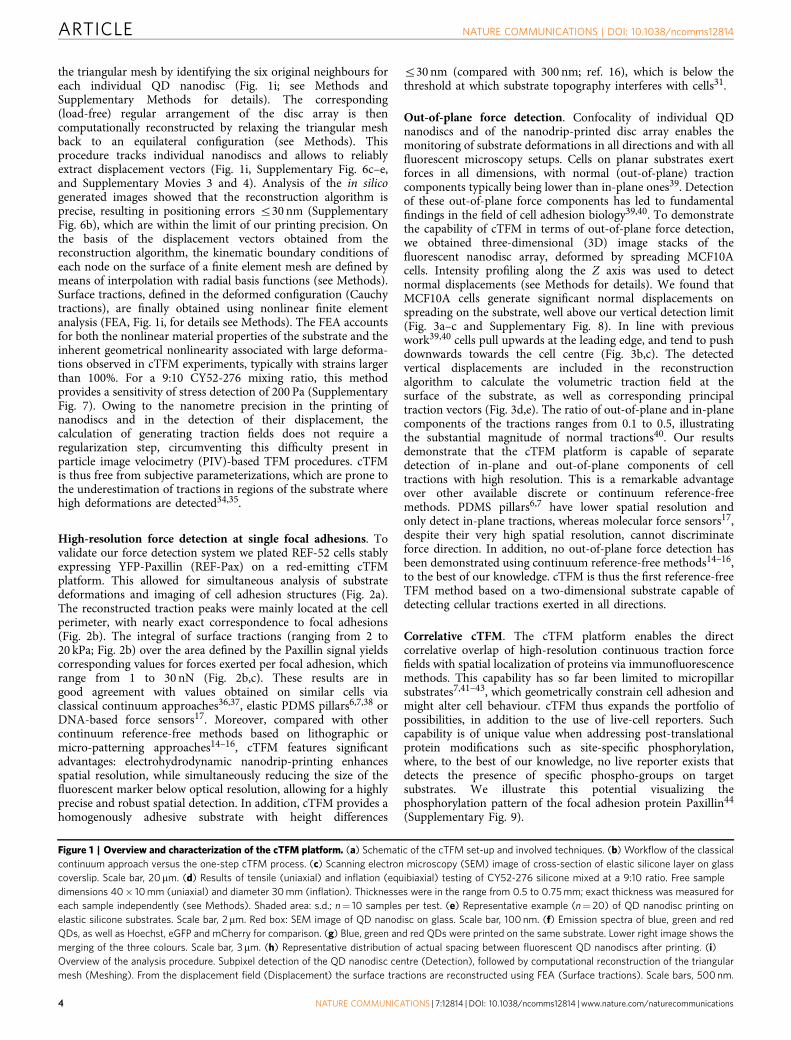
High-resolution force detection at single focal adhesions. Tovalidate our force detection system we plated REF-52 cells stablyexpressing YFP-Paxillin (REF-Pax) on a red-emitting cTFMplatform. This allowed for simultaneous analysis of substratedeformations and imaging of cell adhesion structures (Fig. 2a).The reconstructed traction peaks were mainly located at the cellperimeter, with nearly exact correspondence to focal adhesions(Fig. 2b). The integral of surface tractions (ranging from 2 to20 kPa; Fig. 2b) over the area defined by the Paxillin signal yieldscorresponding values for forces exerted per focal adhesion, whichrange from 1 to 30 nN (Fig. 2b,c). These results are ingood agreement with values obtained on similar cells viaclassical continuum approaches36,37, elastic PDMS pillars6,7,38 orDNA-based force sensors17. Moreover, compared with othercontinuum reference-free methods based on lithographic ormicro-patterning approaches14–16, cTFM features significantadvantages: electrohydrodynamic nanodrip-printing enhancesspatial resolution, while simultaneously reducing the size of thefluorescent marker below optical resolution, allowing for a highlyprecise and robust spatial detection. In addition, cTFM provides ahomogenously adhesive substrate with height differences
r30 nm (compared with 300 nm; ref. 16), which is below thethreshold at which substrate topography interferes with cells31.
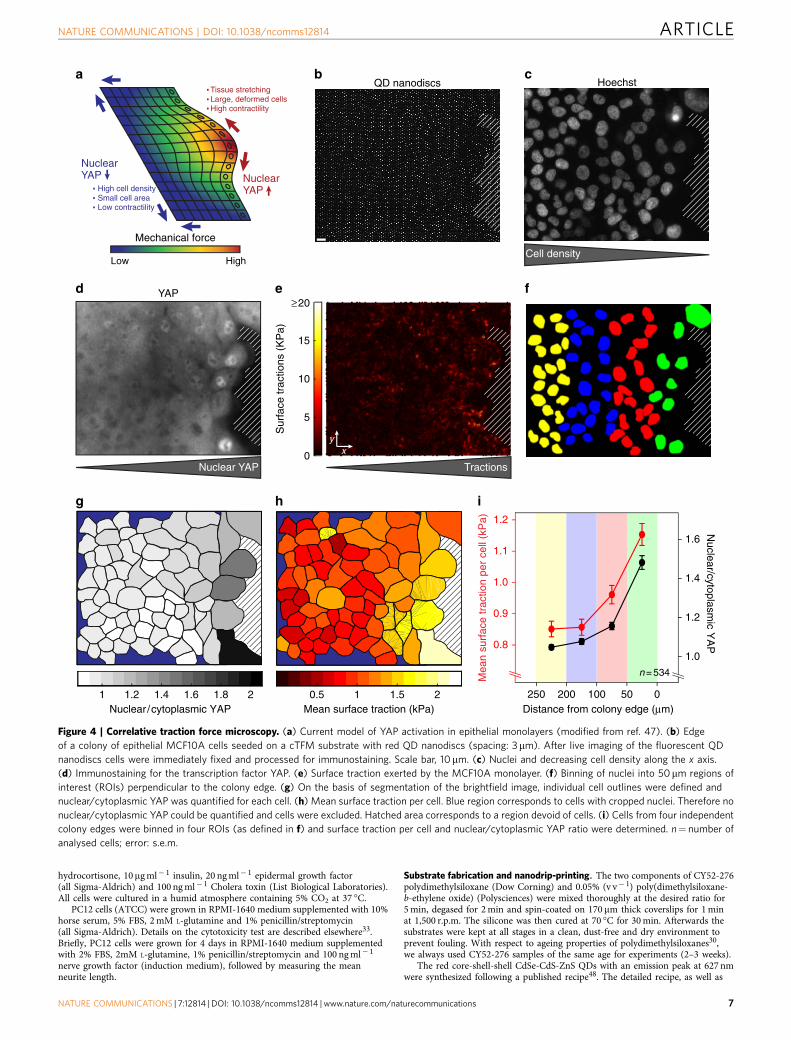
Out-of-plane force detection. Confocality of individual QDnanodiscs and of the nanodrip-printed disc array enables themonitoring of substrate deformations in all directions and with allfluorescent microscopy setups. Cells on planar substrates exertforces in all dimensions, with normal (out-of-plane) tractioncomponents typically being lower than in-plane ones39. Detectionof these out-of-plane force components has led to fundamentalfindings in the field of cell adhesion biology39,40. To demonstratethe capability of cTFM in terms of out-of-plane force detection,we obtained three-dimensional (3D) image stacks of thefluorescent nanodisc array, deformed by spreading MCF10Acells. Intensity profiling along the Z axis was used to detectnormal displacements (see Methods for details). We found thatMCF10A cells generate significant normal displacements onspreading on the substrate, well above our vertical detection limit(Fig. 3a–c and Supplementary Fig. 8). In line with previouswork39,40 cells pull upwards at the leading edge, and tend to pushdownwards towards the cell centre (Fig. 3b,c). The detectedvertical displacements are included in the reconstructionalgorithm to calculate the volumetric traction field at thesurface of the substrate, as well as corresponding principaltraction vectors (Fig. 3d,e). The ratio of out-of-plane and in-planecomponents of the tractions ranges from 0.1 to 0.5, illustratingthe substantial magnitude of normal tractions40. Our resultsdemonstrate that the cTFM platform is capable of separatedetection of in-plane and out-of-plane components of celltractions with high resolution. This is a remarkable advantageover other available discrete or continuum reference-freemethods. PDMS pillars6,7 have lower spatial resolution andonly detect in-plane tractions, whereas molecular force sensors17,despite their very high spatial resolution, cannot discriminateforce direction. In addition, no out-of-plane force detection hasbeen demonstrated using continuum reference-free methods14–16,to the best of our knowledge. cTFM is thus the first reference-freeTFM method based on a two-dimensional substrate capable ofdetecting cellular tractions exerted in all directions.
Correlative cTFM. The cTFM platform enables the directcorrelative overlap of high-resolution continuous traction forcefields with spatial localization of proteins via immunofluorescencemethods. This capability has so far been limited to micropillarsubstrates7,41–43, which geometrically constrain cell adhesion andmight alter cell behaviour. cTFM thus expands the portfolio ofpossibilities, in addition to the use of live-cell reporters. Suchcapability is of unique value when addressing post-translationalprotein modifications such as site-specific phosphorylation,where, to the best of our knowledge, no live reporter exists thatdetects the presence of specific phospho-groups on targetsubstrates. We illustrate this potential visualizing thephosphorylation pattern of the focal adhesion protein Paxillin44
(Supplementary Fig. 9).
Figure 1 | Overview and characterization of the cTFM platform. (a) Schematic of the cTFM set-up and involved techniques. (b) Workflow of the classical
continuum approach versus the one-step cTFM process. (c) Scanning electron microscopy (SEM) image of cross-section of elastic silicone layer on glass
coverslip. Scale bar, 20mm. (d) Results of tensile (uniaxial) and inflation (equibiaxial) testing of CY52-276 silicone mixed at a 9:10 ratio. Free sample
dimensions 40� 10 mm (uniaxial) and diameter 30 mm (inflation). Thicknesses were in the range from 0.5 to 0.75 mm; exact thickness was measured for
each sample independently (see Methods). Shaded area: s.d.; n¼ 10 samples per test. (e) Representative example (n¼ 20) of QD nanodisc printing on
elastic silicone substrates. Scale bar, 2 mm. Red box: SEM image of QD nanodisc on glass. Scale bar, 100 nm. (f) Emission spectra of blue, green and red
QDs, as well as Hoechst, eGFP and mCherry for comparison. (g) Blue, green and red QDs were printed on the same substrate. Lower right image shows the
merging of the three colours. Scale bar, 3mm. (h) Representative distribution of actual spacing between fluorescent QD nanodiscs after printing. (i)
Overview of the analysis procedure. Subpixel detection of the QD nanodisc centre (Detection), followed by computational reconstruction of the triangular
mesh (Meshing). From the displacement field (Displacement) the surface tractions are reconstructed using FEA (Surface tractions). Scale bars, 500 nm.
ARTICLE NATURE COMMUNICATIONS | DOI: 10.1038/ncomms12814
4 NATURE COMMUNICATIONS | 7:12814 | DOI: 10.1038/ncomms12814 | www.nature.com/naturecommunications
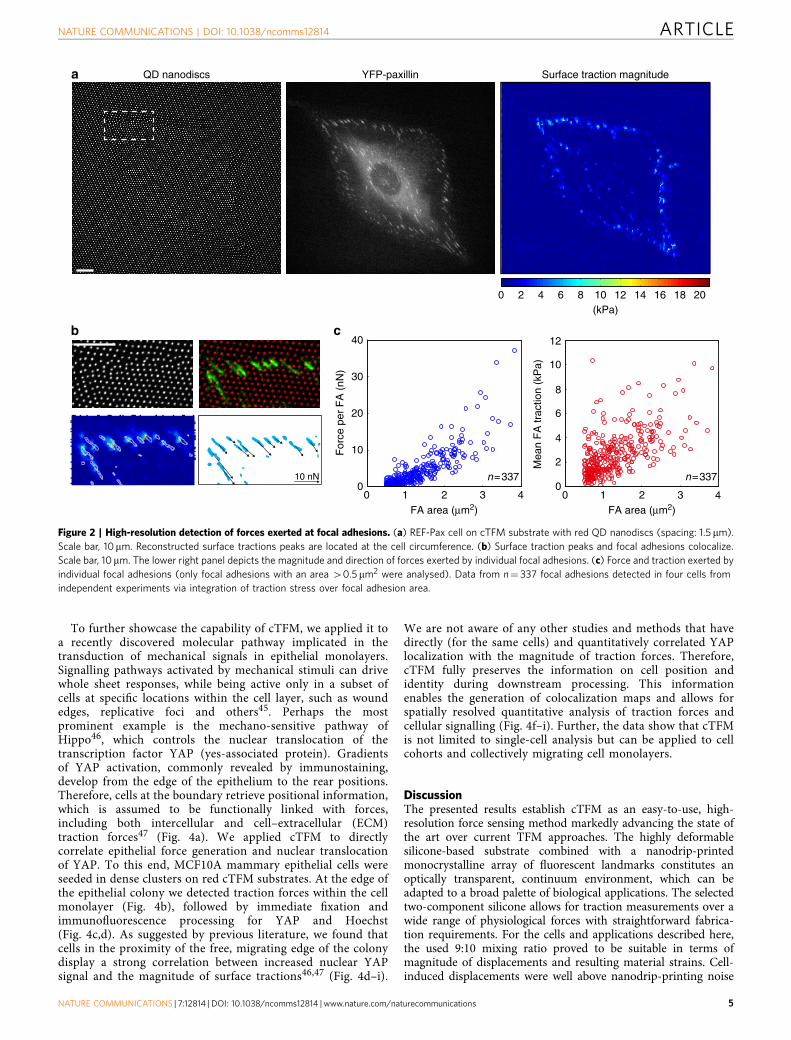
To further showcase the capability of cTFM, we applied it toa recently discovered molecular pathway implicated in thetransduction of mechanical signals in epithelial monolayers.Signalling pathways activated by mechanical stimuli can drivewhole sheet responses, while being active only in a subset ofcells at specific locations within the cell layer, such as woundedges, replicative foci and others45. Perhaps the mostprominent example is the mechano-sensitive pathway ofHippo46, which controls the nuclear translocation of thetranscription factor YAP (yes-associated protein). Gradientsof YAP activation, commonly revealed by immunostaining,develop from the edge of the epithelium to the rear positions.Therefore, cells at the boundary retrieve positional information,which is assumed to be functionally linked with forces,including both intercellular and cell–extracellular (ECM)traction forces47 (Fig. 4a). We applied cTFM to directlycorrelate epithelial force generation and nuclear translocationof YAP. To this end, MCF10A mammary epithelial cells wereseeded in dense clusters on red cTFM substrates. At the edge ofthe epithelial colony we detected traction forces within the cellmonolayer (Fig. 4b), followed by immediate fixation andimmunofluorescence processing for YAP and Hoechst(Fig. 4c,d). As suggested by previous literature, we found thatcells in the proximity of the free, migrating edge of the colonydisplay a strong correlation between increased nuclear YAPsignal and the magnitude of surface tractions46,47 (Fig. 4d–i).
We are not aware of any other studies and methods that havedirectly (for the same cells) and quantitatively correlated YAPlocalization with the magnitude of traction forces. Therefore,cTFM fully preserves the information on cell position andidentity during downstream processing. This informationenables the generation of colocalization maps and allows forspatially resolved quantitative analysis of traction forces andcellular signalling (Fig. 4f–i). Further, the data show that cTFMis not limited to single-cell analysis but can be applied to cellcohorts and collectively migrating cell monolayers.
DiscussionThe presented results establish cTFM as an easy-to-use, high-resolution force sensing method markedly advancing the state ofthe art over current TFM approaches. The highly deformablesilicone-based substrate combined with a nanodrip-printedmonocrystalline array of fluorescent landmarks constitutes anoptically transparent, continuum environment, which can beadapted to a broad palette of biological applications. The selectedtwo-component silicone allows for traction measurements over awide range of physiological forces with straightforward fabrica-tion requirements. For the cells and applications described here,the used 9:10 mixing ratio proved to be suitable in terms ofmagnitude of displacements and resulting material strains. Cell-induced displacements were well above nanodrip-printing noise
YFP-paxillin Surface traction magnitudeQD nanodiscs
(kPa)
For
ce p
er F
A (
nN)
Mea
n F
A tr
actio
n (k
Pa)
10 nN
0 2 3 40
10
20
30
40
n=337 n=337
1FA area (μm2) FA area (μm2)
0 2 3 40
2
4
6
8
10
12
1
0 2 4 6 8 10 12 14 16 18 20
a
b c
Figure 2 | High-resolution detection of forces exerted at focal adhesions. (a) REF-Pax cell on cTFM substrate with red QD nanodiscs (spacing: 1.5 mm).
Scale bar, 10mm. Reconstructed surface tractions peaks are located at the cell circumference. (b) Surface traction peaks and focal adhesions colocalize.
Scale bar, 10mm. The lower right panel depicts the magnitude and direction of forces exerted by individual focal adhesions. (c) Force and traction exerted by
individual focal adhesions (only focal adhesions with an area 40.5 mm2 were analysed). Data from n¼ 337 focal adhesions detected in four cells from
independent experiments via integration of traction stress over focal adhesion area.
NATURE COMMUNICATIONS | DOI: 10.1038/ncomms12814 ARTICLE
NATURE COMMUNICATIONS | 7:12814 | DOI: 10.1038/ncomms12814 | www.nature.com/naturecommunications 5

(E30 nm), while the resulting strains in the substrate were withinthe regime analysed in the mechanical tests (Fig. 1d). For othercells or applications, fabrication and characterization of furtherCY52-276 mixing ratios can expand the force detection range ofthe cTFM platform in the future.
The well-defined and highly stable QD emission is homo-genous across the nanodisc-lattice and can be tailored over a largepalette of colours. Similar to conventional TFM, overlays ofcrystalline array with multiple colours could be used in the futureto further increase spatial resolution of the cTFM platform13. Theuse of the nanodrip-printing technology enables the deploymentof QDs into sub-resolution nanodiscs arranged in a confocal andcrystalline triangular pattern. Therefore, it yields a substrate forcells, which is homogeneously adhesive and devoid of anyintrusive topography. Finally, the corresponding fully nonlinearanalysis enable application of the cTFM platform to highlydeformable substrate materials and large strain problems, beyondthe validity of linear methods3.
The synergistic effect of the above-mentioned technologiesenables a one-step-imaging process, which directly provides all
necessary information to compute the intensity and direction ofin- and out-of-plane traction forces produced by cells.This substantially simplifies the experimental workflow andsupports a rapid and high-throughput analysis. Importantly, itremoves the requirement for cell detachment and acquisition of aload-free reference image, enabling correlative visualization oftraction forces and cellular signalling activity, and renderingcTFM a significant methodological advancement in cell forcedetermination and activity for the biological and medicalcommunities.
MethodsCell culture. HeLa cells (American Type Culture Collection; ATCC) and ratembryonic fibroblasts stably expressing YFP-Paxillin (REF-Pax32) were grown inhigh-glucose Dulbecco’s modified Eagle’s medium (DMEM) supplemented with2 mM L-Glutamine, 10% FBS, 1% penicillin/streptomycin (all Sigma-Aldrich).Human Umbilical Vein Endothelial Cells (HUVECs, Life Technologies)were grown in M200 medium with Low Serum Growth Supplement (all LifeTechnologies). MCF10A cells (G. Scita, IFOM Milan, Italy) were grown inDulbecco’s modified Eagle’s medium /F12 medium (Life Technologies) supple-mented with 10% horse serum, 1% penicillin/streptomycin, 0.5 mg ml� 1
QD nanodiscsBrightfield
Traction field (in-plane magnitude) Traction field (Z-component)
(kPa) (kPa)0 4 8 12 16 20 –8 –4 0 4 8
xy
Cell position
Z-p
ositi
on Q
D n
anod
isc
(μm
)
–0.1
–0.05
0.05
0.1
0.15
0.2
0
Normalized position (a.u.)–0.4 –0.2 0 0.2 0.4 0.6 0.8 1 1.2 1.4
3525
15535
2515
5
0.05
0
–0.05
0.1
Z -
dis
plac
emen
t (μm
)
–0.03
0.06
0.03
0.00
Z (
μm)
Y (μm) X (μm)
a b
c d e
Figure 3 | Detection of out-of-plane forces. (a) Spreading MCF10A cell on cTFM substrate with red QD nanodiscs (spacing: 1.5mm). Scale bar, 10mm.
(b) Smoothed 3D surface plot of the area underneath the cell in a. For traction force reconstruction, the unsmoothed displacements in Z-direction are taken
into account. (c) Z-profile of the substrate obtained from line scans underneath four independent cells. Cell dimensions were normalized so that cell
outlines reach from 0 to 1. (d) Overall traction magnitude of the cell in a. (e) Out-of-plane (Z-) components of the traction field for the cell in a.
ARTICLE NATURE COMMUNICATIONS | DOI: 10.1038/ncomms12814
6 NATURE COMMUNICATIONS | 7:12814 | DOI: 10.1038/ncomms12814 | www.nature.com/naturecommunications
hydrocortisone, 10mg ml� 1 insulin, 20 ng ml� 1 epidermal growth factor(all Sigma-Aldrich) and 100 ng ml� 1 Cholera toxin (List Biological Laboratories).All cells were cultured in a humid atmosphere containing 5% CO2 at 37 �C.
PC12 cells (ATCC) were grown in RPMI-1640 medium supplemented with 10%horse serum, 5% FBS, 2 mM L-glutamine and 1% penicillin/streptomycin(all Sigma-Aldrich). Details on the cytotoxicity test are described elsewhere33.Briefly, PC12 cells were grown for 4 days in RPMI-1640 medium supplementedwith 2% FBS, 2mM L-glutamine, 1% penicillin/streptomycin and 100 ng ml� 1
nerve growth factor (induction medium), followed by measuring the meanneurite length.
Substrate fabrication and nanodrip-printing. The two components of CY52-276polydimethylsiloxane (Dow Corning) and 0.05% (v v� 1) poly(dimethylsiloxane-b-ethylene oxide) (Polysciences) were mixed thoroughly at the desired ratio for5 min, degased for 2 min and spin-coated on 170 mm thick coverslips for 1 minat 1,500 r.p.m. The silicone was then cured at 70 �C for 30 min. Afterwards thesubstrates were kept at all stages in a clean, dust-free and dry environment toprevent fouling. With respect to ageing properties of polydimethylsiloxanes30,we always used CY52-276 samples of the same age for experiments (2–3 weeks).
The red core-shell-shell CdSe-CdS-ZnS QDs with an emission peak at 627 nmwere synthesized following a published recipe48. The detailed recipe, as well as
Nuclear YAP Tractions
Cell density
QD nanodiscs Hoechst
YAPS
urfa
ce tr
actio
ns (
KP
a)
0
5
10
15
≥20
xy
NuclearYAP
NuclearYAP
High cell densitySmall cell areaLow contractility
Tissue stretchingLarge, deformed cellsHigh contractility
Mechanical force
HighLow
1 1.2 1.4 1.6 1.8 2Nuclear/cytoplasmic YAP Mean surface traction (kPa)
0.5 1 1.5 2 100200250 50 0 Distance from colony edge (μm)
Mea
n su
rfac
e tr
actio
n pe
r ce
ll (k
Pa)
Nuclear/cytoplasm
ic YA
P
1.0
1.2
1.4
1.6
0.8
0.9
1.0
1.1
1.2
n= 534
a b c
d e f
g h i
Figure 4 | Correlative traction force microscopy. (a) Current model of YAP activation in epithelial monolayers (modified from ref. 47). (b) Edge
of a colony of epithelial MCF10A cells seeded on a cTFM substrate with red QD nanodiscs (spacing: 3mm). After live imaging of the fluorescent QD
nanodiscs cells were immediately fixed and processed for immunostaining. Scale bar, 10mm. (c) Nuclei and decreasing cell density along the x axis.
(d) Immunostaining for the transcription factor YAP. (e) Surface traction exerted by the MCF10A monolayer. (f) Binning of nuclei into 50mm regions of
interest (ROIs) perpendicular to the colony edge. (g) On the basis of segmentation of the brightfield image, individual cell outlines were defined and
nuclear/cytoplasmic YAP was quantified for each cell. (h) Mean surface traction per cell. Blue region corresponds to cells with cropped nuclei. Therefore no
nuclear/cytoplasmic YAP could be quantified and cells were excluded. Hatched area corresponds to a region devoid of cells. (i) Cells from four independent
colony edges were binned in four ROIs (as defined in f) and surface traction per cell and nuclear/cytoplasmic YAP ratio were determined. n¼ number of
analysed cells; error: s.e.m.
NATURE COMMUNICATIONS | DOI: 10.1038/ncomms12814 ARTICLE
NATURE COMMUNICATIONS | 7:12814 | DOI: 10.1038/ncomms12814 | www.nature.com/naturecommunications 7

recipes for the blue and green QDs can be found in the Supplementary Methods.The QDs were transferred from hexane dispersions to tetradecane for the printingprocess. To ensure a reproducible printing process and reduce clogging at theprinting nozzle, the optical density of the dispersion at the first absorption peakwas adjusted to 0.5 for a 1 mm path and then further diluted 1:1 in tetradecane. Thedeposition precision was further increased by adding 5% vol of octanethiol-cappedgold nanoparticles49 to the QD ink from a tetradecane dispersion with an opticaldensity of 5 for a 1 mm path. These gold nanoparticles enable a more stableprinting process, leading to a reproducible droplet ejection and thus a higherplacement precision, but do not adversely affect the fluorescence.
The QDs were deposited on the substrate by electrohydrodynamic nanodrip-printing, details of which have been published elsewhere18–21. Briefly, the substrateis placed on a conducting grounded plate. A gold-coated glass capillary with anopening diameter of 1–1.5mm is filled with the QD dispersion and brought within5 mm of the substrate using a piezoelectric stage with nanometre precision. Byapplying voltage pulses between the nozzle and the grounded plate, nanoscaledroplets with a diameter of 50–100 nm are rapidly ejected from the apex of a largermeniscus formed at the nozzle exit with frequencies of 100–200 Hz. The dropletsland softly on the substrate (no splashing or sizable spreading) and the tetradecaneevaporates before the arrival of the next droplet, leaving behind only thenanoparticle content. To print one nanodisc of the triangular array, d.c. voltages of200–250 V are applied for 70 ms. In this manner, the QDs of several nanodropletsland at the same location each time and form collectively one brightly emittingdisc at a well-defined position. Arbitrary patterns can be created moving thesubstrate with the piezoelectric stage. Voltage, pulse length and stage positionare controlled using a custom-built control unit. The electrohydrodynamicnanodrip-printing technology is freely available for laboratory research and,in addition, can be commercially obtained through an ETH Zurich spin-offcompany (http://www.scrona.ch).
Mechanical characterization of the substrate. The mechanical properties of thesubstrate were evaluated for thin cast samples loaded in different modes. Uniaxial-tension tests were performed on a tensile testing set-up mounted on a MTS 793testing rig (MTS Systems, Eden Prairie, USA). Equibiaxial deformation behaviourof the material was characterized on a custom-built inflation set-up30. Allmeasurements used for the evaluation of the elastic properties were performed atlow strain rate (_e¼ 0.3% s� 1) and within the range of deformation expected tooccur during cTFM (up to 175% strain). Strain was quantified by tracking opticalfeatures on the sample surface using a CCD (charge-coupled device) camera (Pike100B Allied Vision Technologies GmbH) and a customized tracking algorithm30.The thickness of each sample was determined post testing by optical measurementsof the cross-section of sliced samples in a microscope (LSM 5 PASCAL, Zeiss). Thestress–strain data of the tests were used to fit the parameters of a hyperelasticOgden material50 with two terms (Table 1).
ECM coating and cell seeding. Before coating with the ECM protein fibronectin,substrates were incubated in a custom-built vacuum oven at 90 �C for 1 h, washed1 min in methanol and incubated for another 2 h in the vacuum oven to removeligands and anneal QDs to the silicone. Substrates were then glued in 35 mm Petridishes. For coating 50 mg ml� 1 fibronectin (Life Technologies) in PBS was appliedto the substrates for 1 h at room temperature. Substrates were washed twice withPBS before applying medium and seeding of cells at desired concentrations.
Live-cell imaging. Cells were allowed to spread from at least 3 h till overnightbefore imaging (except otherwise noted) using an inverted Nikon-Ti wide-fieldmicroscope equipped with an Orca R-2 CCD camera (Hamamatsu Photonics,Japan) or an iXon Ultra 888 EMCCD (Andor, UK). Temperature, CO2 andhumidity were controlled during imaging using an incubation chamber (LifeImaging Services, Switzerland). Images were collected using a � 60 Plan Apo l1.40 Oil or and � 60 Plan Apo VC 1.20 water objective. Focal drift during theexperiments was avoided using the autofocus system of the microscope.
Image analysis. The pointspread function of individual 50 nm fluorescent beadson polyacrylamide and CY52-276 silicone was distilled from 3D image stacksacquired with conventional wide-field fluorescent microscopy using Huygenssoftware (Scientific Volume Imaging).
Focal adhesion structures were segmented based on a previously describedmethod51, except that the mathematical exponential step was omitted. Briefly, onbackground subtraction, the local contrast of the image was enhanced via ContrastLimited Adaptive Histogram Equalization. After applying a Laplacian of Gaussian
filter, the image was manually tresholded and particles were analysed. Only focaladhesions with a size 40.5 mm2 were considered for the analysis.
QD nanodisc detection and meshing. Traction evaluation starts with thedetection of the XY positions of the QD nanodiscs. A threshold was applied to theimage and the connected pixel islands were identified as the QD nanodiscs. Theexact position of the QD nanodisc was calculated by taking the weighted centroidof the grey scale value of the connected pixel islands. To evaluate the deformationalong the Z axis, 3D image stacks were acquired (Z30 slices, spacing 100 mm). Thespot detection function of Imaris (Bitplane) was used to detect the Z position of theQD nanodiscs (spot size: XY, 0.717 mm; Z, 1.434 mm). By fitting a plane through allpoints (Matlab, Mathworks) and taking the difference between the plane and themeasured Z coordinates, a tilt correction was applied to filter for skewness betweenthe sample and the focal plane.
The next step in the analysis procedure was the construction of the triangularmesh with a two-step custom-built algorithm, achieved by identifying the originalsix neighbours for each individual QD nanodisc (for a detailed description seeSupplementary Information). Briefly, in a first step the regions of the image with noor low distortion were identified. In the non- or low-deformed configuration eachQD nanodisc has exactly six neighbouring QD nanodiscs at equal distances andforming angles of 60�. Each QD nanodisc is locally checked for this condition andconnected to its six neighbours only if this condition holds, up to a tolerance ofr250 nm and 10� to account for small deformations. At the end of this analysis,the regular parts of the image are meshed, that is, connected to an array oftriangles, whereas the QD nanodiscs in regions with high deformation remainunmeshed, forming voids in the mesh (Supplementary Fig. 10). The boundary ofeach void gives sufficient information to generate a perfect mesh with the samegeometry as the void and has the same number of vertices as there are unconnectedQD nanodiscs in void. The algorithm then computes the optimal assignment ofvertices of the perfect mesh to positions of QD nanodiscs by minimizing the overallmesh distortion.
Reference configuration reconstruction. The regular initial arrangement of theQD nanodiscs permits the reconstruction of the reference configuration withoutacquiring a load-free image, exploiting the fact that the reference distance betweentwo neighbouring nanodiscs is known (L0) and equal for all nanodiscs. For thisprocedure, the QD nanodiscs are idealized as point masses and connected to theirneighbours (identified in the previous step, see paragraph above) with pre-stret-ched springs of reference length L0. Minimization of the potential energy relaxesthe deformed spring-mass network towards the steady-state solution, which cor-responds to the stress-free configuration where all the springs have length L0. Tostabilize the computation an inconsequential damping component is added and thedifferential equation describing the dynamics of the damped mass-spring networkis solved explicitly using a fourth-order Runge–Kutta integration scheme.
Nonlinear FEA-based traction reconstruction. To account for both largedeformations and material nonlinearity, a custom high-resolution nonlinear TFMframework was developed based on Python scripts (Python Software Foundation)and a commercial finite element code (Abaqus, Dassault Systemes). The frameworkcontains three principal steps: (I) model creation and finite element meshing; (II)application of displacement boundary conditions; and (III) computation of thetraction stress field.
In the first step (I), the finite element geometry models a cuboid section of thesubstrate, whose height is equal to the actual substrate. In-plane dimensions arechosen larger than the analysed cell, so that the border zones of the section containundeformed regions. An adaptive meshing algorithm was implemented that selectsthe QD nanodiscs with high displacement magnitude and automatically mesheswith linear hybrid tetrahedral elements the corresponding regions with a fine mesh(elements five times smaller than QD nanodisc interspacing), whereas the otherregions are meshed by elements of increasing size (up to QD nanodisc spacing).Material properties were defined based on the nearly incompressibleimplementation of the Ogden model (Poisson’s ratio 0.49) provided by thesoftware, with parameters given in Table 1 obtained by fitting the experimentaldata (Fig. 1d).
To determine the displacement boundary conditions (II), an interpolation basedon thin-plate spline radial basis functions52 is applied to prescribe the displacementat each node of the finite element mesh on the cell sided surface of the substrate.This is necessary, since image analysis provides the displacements only at theposition of the QDs. To account for the bonding of the substrate to the glasscoverslip and the embedding of the model into a larger portion of the substrate, thedegrees of freedom of nodes on the lateral and bottom sides of the section werefixed.
Finally (III), the implicit FEA solver is used to compute the strain and stressstates in the substrate, taking into account the applied boundary conditions and thenonlinear material behaviour. The computed solution includes reaction forces forall the nodes that are constrained by displacement boundary conditions. Theseforces are subsequently related to the deformed surface area of the elements, finallyproviding the traction field induced by the cell. It is important to note that, as
Table 1 | Ogden material parameters.
l1 (kPa) a1 (� ) l2 (kPa) a2 (� )
4.073 2.132 0.167 �0.600
ARTICLE NATURE COMMUNICATIONS | DOI: 10.1038/ncomms12814
8 NATURE COMMUNICATIONS | 7:12814 | DOI: 10.1038/ncomms12814 | www.nature.com/naturecommunications

required in the case of large deformations, tractions are defined in the deformedconfiguration (Cauchy tractions).
Immunofluorescence. Cells were fixed with 3% paraformaldehyde in PBS for10 min at room temperature and permeabilized via incubation in 3% paraf-ormaldehyde with 0.1% Triton in PBS for 5 min. After blocking with 5% BSA inPBS for 2 h, samples were incubated at 4 �C overnight with a monoclonal primaryantibody against YAP (Cell Signaling (D8H1X), dilution: 1:300) or phosphorylatedPaxillin (Tyr118, Cell Signaling (#2541), dilution: 1:300). Alexa Fluor 647 Chickenanti-Rabbit (Thermofischer (#A-21443)) was used 1:200 as secondary antibody for1 h at room temperature. For staining of nuclei, Hoechst was added at 10 mg ml� 1
during a washing step.
In silico image generation. A synthetic image that simulates a real image acquiredin the microscope was created with the following procedure53. First, the positionsof the QD nanodiscs in perfectly regular arrays and arrays with positioning errorsof 35 nm (recapitulating the printing error) were determined using MATLAB.Then, in some regions these positions were displaced to a maximum of 1.5 mm tosimulate cell tractions. A synthetic image was obtained by creating Gaussians withs.d. of 0.2 mm at the exact positions of the nanodiscs, to simulate the signalconvolution of the microscope. Finally, Gaussian noise with s.d. of 10 was addedto the synthetic image in ImageJ to mimic imaging noise.
Data analysis and statistics. Data were analysed, tested for statistical significance,fitted and visualized using R or MATLAB (The MathWorks). No statistical methodwas used to predetermine sample size. No estimation of variance was performed.The Shapiro–Wilk test was used to test for normality of data. For non-normaldistributed data, Mann–Whitney U-test was performed.
Data availability. cTFM software featuring algorithms for QD nanodisc detection,meshing, reference configuration estimation and displacement reconstruction, andsurface traction evaluation is available as Supplementary Software (cTFM_Pack-age_NatComm.zip and cTFM_Examples_NatComm.zip) at https://dx.doi.org/10.6084/m9.figshare.3493685.v1. cTFM_Package_NatComm.zip contains thesoftware package used to analyse cTFM images (including documentation).cTFM_Examples_NatComm.zip contains example images to be analysed with thecTFM software. Further relevant data are available from corresponding authors onrequest.
References1. Fournier, M. F., Sauser, R., Ambrosi, D., Meister, J. J. & Verkhovsky, A. B.
Force transmission in migrating cells. J. Cell Biol. 188, 287–297 (2010).2. Humphrey, J. D., Dufresne, E. R. & Schwartz, M. A. Mechanotransduction and
extracellular matrix homeostasis. Nat. Rev. Mol. Cell Biol. 15, 802–812 (2014).3. Schwarz, U. S. & Soine, J. R. Traction force microscopy on soft elastic
substrates: a guide to recent computational advances. Biochim. Biophys. Acta1853, 3095–3104 (2015).
4. Ribeiro, A. J., Denisin, A. K., Wilson, R. E. & Pruitt, B. L. For whom the cellspull: hydrogel and micropost devices for measuring traction forces. Methods 94,51–64 (2016).
5. Polacheck, W. J. & Chen, C. S. Measuring cell-generated forces: a guide to theavailable tools. Nat. Methods 13, 415–423 (2016).
6. Fu, J. P. et al. Mechanical regulation of cell function with geometricallymodulated elastomeric substrates. Nat. Methods 7, 733 (2010).
7. Tan, J. L. et al. Cells lying on a bed of microneedles: an approach to isolatemechanical force. Proc. Natl Acad. Sci. USA 100, 1484–1489 (2003).
8. Lehnert, D. et al. Cell behaviour on micropatterned substrata: limits ofextracellular matrix geometry for spreading and adhesion. J. Cell Sci. 117,41–52 (2004).
9. Kim, D. H., Provenzano, P. P., Smith, C. L. & Levchenko, A. Matrixnanotopography as a regulator of cell function. J. Cell Biol. 197, 351–360(2012).
10. Curtis, A. & Wilkinson, C. Topographical control of cells. Biomaterials 18,1573–1583 (1997).
11. Dembo, M., Oliver, T., Ishihara, A. & Jacobson, K. Imaging the traction stressesexerted by locomoting cells with the elastic substratum method. Biophys. J. 70,2008–2022 (1996).
12. Dembo, M. & Wang, Y. L. Stresses at the cell-to-substrate interface duringlocomotion of fibroblasts. Biophys. J. 76, 2307–2316 (1999).
13. Plotnikov, S. V., Sabass, B., Schwarz, U. S. & Waterman, C. M. High-resolutiontraction force microscopy. Methods Cell Biol. 123, 367–394 (2014).
14. Canovic, E. P. et al. Biomechanical imaging of cell stiffness and prestress withsubcellular resolution. Biomech. Model. Mechanobiol. 13, 665–678 (2014).
15. Polio, S. R., Rothenberg, K. E., Stamenovic, D. & Smith, M. L. Amicropatterning and image processing approach to simplify measurement ofcellular traction forces. Acta Biomater. 8, 82–88 (2012).
16. Balaban, N. Q. et al. Force and focal adhesion assembly: a close relationshipstudied using elastic micropatterned substrates. Nat. Cell Biol. 3, 466–472(2001).
17. Blakely, B. L. et al. A DNA-based molecular probe for optically reportingcellular traction forces. Nat. Methods 11, 1229–1232 (2014).
18. Galliker, P. et al. Direct printing of nanostructures by electrostaticautofocussing of ink nanodroplets. Nat. Commun. 3, 890 (2012).
19. Galliker, P., Schneider, J., Ruthemann, L. & Poulikakos, D. Open-atmospheresustenance of highly volatile attoliter-size droplets on surfaces. Proc. Natl Acad.Sci. USA 110, 13255–13260 (2013).
20. Kress, S. J. et al. Near-field light design with colloidal quantum dots forphotonics and plasmonics. Nano Lett. 14, 5827–5833 (2014).
21. Richner, P. et al. Printable nanoscopic metamaterial absorbers and images withdiffraction-limited resolution. ACS Appl. Mater. Interfaces 8, 11690–11697(2016).
22. Style, R. W. et al. Traction force microscopy in physics and biology. Soft Matter10, 4047–4055 (2014).
23. Iwadate, Y. & Yumura, S. Molecular dynamics and forces of a motile cellsimultaneously visualized by TIRF and force microscopies. Biotechniques 44,739–750 (2008).
24. Mertz, A. F. et al. Scaling of traction forces with the size of cohesive cellcolonies. Phys. Rev. Lett. 108, 198101 (2012).
25. Mertz, A. F. et al. Cadherin-based intercellular adhesions organizeepithelial cell-matrix traction forces. Proc. Natl Acad. Sci. USA 110, 842–847(2013).
26. Bartalena, G. et al. A novel method for assessing adherent single-cell stiffness intension: design and testing of a substrate-based live cell functional imagingdevice. Biomed. Microdevices 13, 291–301 (2011).
27. Merkel, R., Kirchgessner, N., Cesa, C. M. & Hoffmann, B. Cell force microscopyon elastic layers of finite thickness. Biophys. J. 93, 3314–3323 (2007).
28. Deguchi, S., Hotta, J., Yokoyama, S. & Matsui, T. S. Viscoelastic and opticalproperties of four different PDMS polymers. J. Micromech. Microeng. 25,097002 (2015).
29. Yao, M. J. & Fang, J. Hydrophilic PEO-PDMS for microfluidic applications.J. Micromech. Microeng. 22, 025012 (2012).
30. Hopf, R. et al. Experimental and theoretical analyses of the age-dependentlarge-strain behavior of Sylgard 184 (10:1) silicone elastomer. J. Mech. Behav.Biomed. Mater. 60, 425–437 (2016).
31. Loesberg, W. A. et al. The threshold at which substrate nanogroove dimensionsmay influence fibroblast alignment and adhesion. Biomaterials 28, 3944–3951(2007).
32. Cavalcanti-Adam, E. A. et al. Cell spreading and focal adhesion dynamics areregulated by spacing of integrin ligands. Biophys. J. 92, 2964–2974 (2007).
33. Schneider, J. et al. A novel 3D integrated platform for the high-resolution studyof cell migration plasticity. Macromol. Biosci. 13, 973–983 (2013).
34. Jorge-Penas, A. et al. Free form deformation-based image registration improvesaccuracy of traction force microscopy. PloS ONE 10, e0144184 (2015).
35. Han, S. J., Oak, Y., Groisman, A. & Danuser, G. Traction microscopy to identifyforce modulation in subresolution adhesions. Nat. Methods 12, 653–656 (2015).
36. Munevar, S., Wang, Y. & Dembo, M. Traction force microscopy of migratingnormal and H-ras transformed 3T3 fibroblasts. Biophys. J. 80, 1744–1757(2001).
37. Legant, W. R. et al. Measurement of mechanical tractions exerted by cells inthree-dimensional matrices. Nat. Methods 7, 969–971 (2010).
38. Trichet, L. et al. Evidence of a large-scale mechanosensing mechanism forcellular adaptation to substrate stiffness. Proc. Natl Acad. Sci. USA 109,6933–6938 (2012).
39. Legant, W. R. et al. Multidimensional traction force microscopy reveals out-of-plane rotational moments about focal adhesions. Proc. Natl Acad. Sci. USA 110,881–886 (2013).
40. Hur, S. S., Zhao, Y. H., Li, Y. S., Botvinick, E. & Chien, S. Live cells exert3-dimensional traction forces on their substrata. Cell Mol. Bioeng. 2, 425–436(2009).
41. Ghassemi, S. et al. Cells test substrate rigidity by local contractions onsubmicrometer pillars. Proc. Natl Acad. Sci. USA 109, 5328–5333 (2012).
42. Dumbauld, D. W. et al. How vinculin regulates force transmission. Proc. NatlAcad. Sci. USA 110, 9788–9793 (2013).
43. Bashour, K. T. et al. CD28 and CD3 have complementary roles in T-celltraction forces. Proc. Natl Acad. Sci. USA 111, 2241–2246 (2014).
44. Pasapera, A. M., Schneider, I. C., Rericha, E., Schlaepfer, D. D. & Waterman, C. M.Myosin II activity regulates vinculin recruitment to focal adhesionsthrough FAK-mediated paxillin phosphorylation. J. Cell Biol. 188, 877–890(2010).
45. Das, T. et al. A molecular mechanotransduction pathway regulates collectivemigration of epithelial cells. Nat. Cell Biol. 17, 276–287 (2015).
46. Zhao, B. et al. Inactivation of YAP oncoprotein by the Hippo pathway isinvolved in cell contact inhibition and tissue growth control. Gene Dev. 21,2747–2761 (2007).
NATURE COMMUNICATIONS | DOI: 10.1038/ncomms12814 ARTICLE
NATURE COMMUNICATIONS | 7:12814 | DOI: 10.1038/ncomms12814 | www.nature.com/naturecommunications 9

47. Aragona, M. et al. A mechanical checkpoint controls multicellular growththrough YAP/TAZ regulation by actin-processing factors. Cell 154, 1047–1059(2013).
48. Kress, S. J. et al. Wedge waveguides and resonators for quantum plasmonics.Nano Lett. 15, 6267–6275 (2015).
49. Richner, P., Kress, S. J., Norris, D. J. & Poulikakos, D. Charge effects andnanoparticle pattern formation in electrohydrodynamic NanoDrip printing ofcolloids. Nanoscale 8, 6028–6034 (2016).
50. Ogden, R. W. Large deformation isotropic elasticity—correlation of theory andexperiment for incompressible rubberlike solids. Proc. R. Soc. Lond. A 326,565–584 (1972).
51. Horzum, U., Ozdil, B. & Pesen-Okvur, D. Step-by-step quantitative analysis offocal adhesions. MethodsX 1, 56–59 (2014).
52. Buhmann, M. D. Radial Basis Functions: Theory And Implementations(Cambridge Univ. Press, 2003).
53. Clark, A. G., Dierkes, K. & Paluch, E. K. Monitoring actin cortex thickness inlive cells. Biophys. J. 105, 570–580 (2013).
AcknowledgementsWe are grateful to Thomas Schutzius for fruitful discussion. We thank C. Hail andC. Hoeller for help with the transparency measurements. This work is part of the ZurichHeart project under the umbrella of ‘University Medicine Zurich/HochschulmedizinZurich’. T.L. was supported by funding from the ETH-grant ETH-12 15–1. P.R. wassupported by funding from the Swiss National Science Foundation under Grant 146180.M.Z. was supported by funding from the Swiss National Science Foundation under GrantSNF 20021–155918. D.K.K., S.J.P.K. and D.J.N. received support from the EuropeanResearch Council under the European Union’s Seventh Framework Programme(FP/2007–2013)/ERC Grant Agreement 339905 (QuaDoPS Advanced Grant).D. Panozzo and O.S.-H. were supported in part by the ERC Starting Grant iModel(StG-2012-306877).
Author contributionsM.B., T.L., D. Poulikakos and A.F. designed the study; M.B. and T.L. developed thesubstrates and performed experiments; P.R. aided with substrate fabrication andnanodrip printing; D.K.K., S.J.P.K. and D.J.N. synthesized the quantum dots; T.L.,D. Panozzo and O.S.-H. developed detection and meshing algorithms; M.Z., A.E.E. andE.M. performed the mechanical substrate characterization, developed the code fordisplacement reconstruction and implemented the FEA-based traction reconstruction;M.B., D. Poulikakos and A.F. wrote the manuscript. All authors gave input at variousstages during writing.
Additional informationSupplementary Information accompanies this paper at http://www.nature.com/naturecommunications
Competing financial interests: The authors declare no competing financial interests.
Reprints and permission information is available online at http://npg.nature.com/reprintsandpermissions/
How to cite this article: Bergert, M. et al. Confocal reference free traction forcemicroscopy. Nat. Commun. 7:12814 doi: 10.1038/ncomms12814 (2016).
This work is licensed under a Creative Commons Attribution 4.0International License. The images or other third party material in this
article are included in the article’s Creative Commons license, unless indicated otherwisein the credit line; if the material is not included under the Creative Commons license,users will need to obtain permission from the license holder to reproduce the material.To view a copy of this license, visit http://creativecommons.org/licenses/by/4.0/
r The Author(s) 2016
ARTICLE NATURE COMMUNICATIONS | DOI: 10.1038/ncomms12814
10 NATURE COMMUNICATIONS | 7:12814 | DOI: 10.1038/ncomms12814 | www.nature.com/naturecommunications