confocal raman microscopy: how to correct depth profiles considering diffraction and refraction...
TRANSCRIPT
JOURNAL OF RAMAN SPECTROSCOPYJ. Raman Spectrosc. 2007; 38: 880–884Published online 2 April 2007 in Wiley InterScience(www.interscience.wiley.com) DOI: 10.1002/jrs.1736
Confocal Raman microscopy: how to correct depthprofiles considering diffraction and refraction effects
Alberto Gallardo,1 Stephen Spells,2 Rodrigo Navarro1 and Helmut Reinecke1∗
1 Instituto de Ciencia y Tecnologıa de Polımeros, CSIC, Juan de la Cierva 3, 28006 Madrid, Spain2 Materials and Engineering Research Institute, Sheffield-Hallam University, City Campus, Sheffield S1 1WB, England
Received 10 November 2006; Accepted 1 February 2007
A new approach to obtain corrected depth profiles by confocal Raman microscopy, which considersdiffraction and refraction effects is presented.
The problem of diffraction effects encountered intrinsically in the confocal configuration can bedescribed using a linear Fredholm integral equation of the first kind, which correlates apparent andtrue Raman intensities with the depth resolution curve of the instrument. Refractive index differencesbetween air and the polymer sample, which cause further errors in the obtained depth profile due to strongaberration effects have been considered. This has been carried out using an empirical variation of thedepth resolution function, which is able to simulate the broadening of the depth of focus with depth andalso the discrepancy between nominal and measured depth scales.
It is shown that considerable differences between apparent and corrected depth profiles exist at thesurface and that these depend on the gradient of the profile and the depth resolution of the Ramanmicroscope. Copyright 2007 John Wiley & Sons, Ltd.
KEYWORDS: diffraction; Raman spectroscopy; confocal microscopy; refraction
INTRODUCTION
In the last 15 years, confocal Raman microspectroscopy hasbeen shown to be a powerful tool for the analysis of modifiedpolymer films, modified in the micrometer range.1 However,depth profiles obtained in a conventional way2 contain anintrinsic error due to the fact that only in the ideal caseof a laser beam with diameter approaching zero, confocalRaman microscopy gives the Raman scattering of a plane. Inthe real case, owing to diffraction phenomena of the opticalsystem, the laser beam has significant intensity up to a certaindistance from the focal plane. Therefore, the technique doesnot measure the Raman intensity scattered from a plane atdepth x, but that of a small volume element V(x) around x. Forthis reason, the measured intensity contains contributionsproceeding from planes in the neighborhood of x. Thesecontributions lead to an erroneous depth profile and make itnecessary to correct the apparent profiles by a mathematicaltreatment in order to obtain the true ones.
In a recent work,3 we have proposed a procedure,which allows one to correct depth profiles, obtained byconfocal Raman microscopy, with respect to the intrinsic
ŁCorrespondence to: Helmut Reinecke, Instituto de Ciencia yTecnologıa de Polımeros, CSIC, Juan de la Cierva 3, 28006 Madrid,Spain. E-mail: [email protected]
error, originated from the diffraction-limited laser focalvolume. This procedure consists of the calculation of thetrue depth profiles using the data of the correspondingapparent profile taking in consideration the depth resolutionof the Raman instrument used. As has been shown,3 theexperimentally determined Raman intensity in each pointx can be described as the sum of the real intensity in thispoint plus the contributions made by the rest of the film tothis point. This problem had been described mathematicallyusing a linear Fredholm integral equation of the first kind,which correlates apparent and true Raman intensities withthe depth resolution curve of the instrument (Eqn (1)).
f �x� D∫ b
0[I�y�H�x, y�]dy �1�
I�y� is the true intensity at each point y and the kernelH�x, y� is a function, which describes the contribution of allplanes in the neighborhood of this point. This function H,which corresponds to the resolution curve is related to theoptical properties of the microscope and the diameter of thelaser beam and depends on the wavelength of the laser andthe numerical aperture and fill factor of the lens. As it hasbeen described in the previous paper,3 the resolution curvesof confocal experiments on a silicon wafer can be fitted with
Copyright 2007 John Wiley & Sons, Ltd.
Depth profile corrections in confocal Raman microscopy 881
good accuracy by a Lorentzian relation:
H�x, y� D A2
4�x � y�2 C A2 �2�
A Lorentzian relationship (originally chosen for physicalreasons) has also been found to be the best adjustable functionI�y� for fitting experimentally determined concentrationgradients of modifier groups created by a wet-chemicaltreatment in solvent/nonsolvent mixtures. Therefore, thefollowing expression has been used for the correction of thediffraction effects:
f �x� D∫ b
0
[k1
k2
4y2 C �k2�2
A2
4�x � y�2 C A2
]dy �3�
The corrected profiles were obtained by fitting theexperimental data with the solution of the FredholmIntegral equation f �x� determining in this way the optimumparameters, which best describe the true intensities.
In that paper, an ideal value (usually 2–3 microns),determined using the signal of a silicon wafer in air had beenused as the depth resolution. Furthermore, this resolutionhad been assumed to be constant throughout the film.However, as has been demonstrated by Everall,4,5 and laterby others,6 – 11 this assumption is not correct because forreasons of the refractive index difference between air andthe polymer sample, the depth resolution curve broadensquickly when penetrating deeper into the film; furthermore,all points within the illuminated region lie below thesurface much deeper than the nominal point. Because ofthese refractive index effects, Everall concluded that ‘opticalsectioning’ by confocal Raman microspectroscopy is not tobe recommended. The alternatives of cutting a sample cross-section and using the higher lateral resolution of the Ramansystem or using an oil-immersion objective were proposed.
In the present paper, we show that optical sectioning byconfocal Raman microscopy is a viable way when the profilesobtained are corrected by calculation of the contributions ofthe Raman radiation that originates from a diffraction-limitedlaser focal volume and by considering also the effect of therefractive index difference between sample and air.
EXPERIMENTAL
Experimental data have been obtained on PVC films, wet-chemically modified with 4-aminothiophenol in water –dimethylformamide (DMF) mixtures. As the reference signal,the C–H bending vibration of the polymer chains at1425 cm�1 were used. The modifier gradient in the film wasdetermined using the intense band at 1596 cm�1, resultingfrom the stretching vibration of the aromatic ring.
The refractive index of the samples had been determinedto be n D 1.45.
Raman spectra were recorded using a Renishaw Ramas-cope 2000 spectrometer, with the 632.8 nm line of a He–Ne
laser for excitation. The instrument makes use of a holo-graphic edge filter to prevent back scattered laser radiationfrom entering the spectrometer, and the stigmatic singlespectrograph is attached to an Olympus BH2 microscope.The entrance slit in the back-focal image plane of the objec-tive lens, in combination with the selection of pixels on thePeltier-cooled CCD detector perpendicular to the slit axis,avoids the use of a true confocal aperture. A 100ð objec-tive, with numerical aperture of 0.95, was used for thesemeasurements. The spectral resolution in this configurationwas approximately 3 cm�1 and the half-width of the confocalprofile for a silicon wafer was determined to be 3.5 µm.
Solutions of Fredholm Integrals were obtained with thehelp of the software Mathcad 7 Professional.
RESULTS AND DISCUSSION
The strategy, which we use here is analogous to thatdescribed in our previous work: one assumes a general typeof a function, which is likely to describe correctly the truedepth profile, considering physical aspects of the performedexperiment. In the next step, the integral of the productof the assumed function and the resolution curve (Eqn (1))has to be solved. In this way, one obtains a mathematicalexpression for f �x�, which is used to fit the experimental data(the apparent depth profile) and obtain the parameters ofthe best fit I�y�, which should describe much better the trueintensity distribution of the modifier.
In the following, this procedure is used to correctdepth profiles, experimentally obtained by confocal Ramanmicroscopy of a wet-chemically modified polymer film.When such a film is analyzed using confocal Ramanspectroscopy, a series of spectra recorded at different depthsare obtained. In order to determine the degree of modificationas a function of depth, two signals are usually analyzed, onethat corresponds to the modifier molecule and a second onethat is not affected by the reaction and should be constant.The conventional way to obtain the (apparent) depth profilefor such a system is to normalize the modifier signal ofeach spectrum by division with the reference band intensityand use a calibration curve (measured on homogeneouslymodified samples), which correlates the calculated ratio ofboth band intensities to the degree of modification. Theapproach, we present here is the following: trying to keepsimplicity at maximum, we have used as the starting functionthe Lorentzian, which was chosen for physical reasonsand which was able to correct the diffraction effects, asshown in the previous paper,3 and we have built a newLorentzian, which empirically incorporates the differenteffects of the refraction, as it will be discussed later indetail. In the first step, we use a reference band with constantconcentration across the film to find the optimum parametersof this empirical function, and in the second step we fitthe experimental data of a modifier band with gradientprofile. The corrected depth profile is obtained by division
Copyright 2007 John Wiley & Sons, Ltd. J. Raman Spectrosc. 2007; 38: 880–884DOI: 10.1002/jrs
882 A. Gallardo et al.
of the corrected intensities using again the above-mentionedcalibration curve.
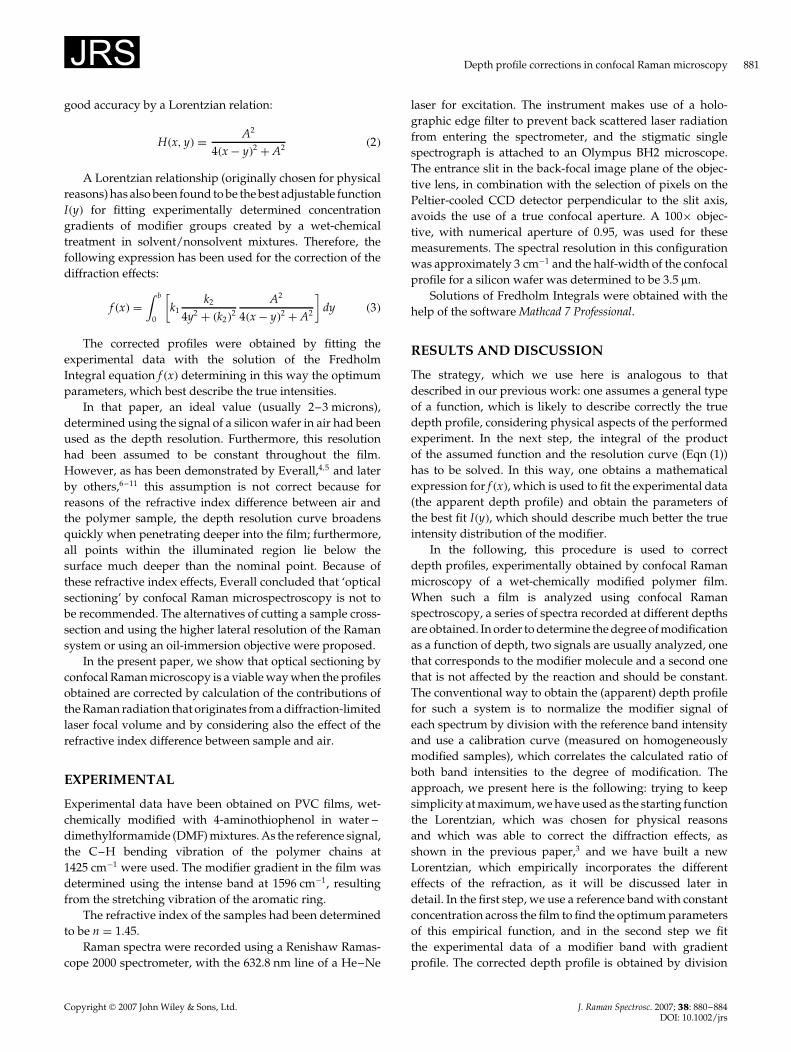
Fitting of the reference signalA typical depth profile of a reference band measured on a70-µm thick polymer film by confocal Raman microscopy isdepicted in Fig. 1. The true depth profile (shown in Fig. 1 asa solid line) is a step function showing a constant Ramansignal in the range between x D 0 and x D 70 µm of the film.Several differences are observed when comparing measuredand true profiles. On the one hand, one observes a hugediscrepancy between the true depth scale and the measuredone being the virtual thickness of the film only around42 µm.
On the other hand, the experimental data show a Ramanresponse outside the boundary of the film being this responseasymmetric for x < 0 and x > 42 µm. Furthermore, alinear decrease of the scattered intensity is observed whenpenetrating deeper into the film. As has been shown byEverall,4,5 all these features can be understood consideringthe influence of two effects on the band intensities: thediffraction of the optical system on the one hand and thedifference between the refractive indices of the polymersample and the environment (air) on the other. The Ramanresponse outside the boundaries of the film and the factthat, near the boundaries of the film, scattered intensitiesare lower than those in the center of the film have beenexplained in our previous work3 to be due to diffractioneffects of the optical system. In addition, the discrepancy inthe depth scale of true and apparent profiles, the asymmetryof the Raman scattering in the regions x < 0 and x > 42 µm,and the decrease of the scattering intensities have theirorigin in the broadening of the depth of focus, caused by therefractive index difference between sample and air (althoughit should be noted that additional beam attenuation canresult from light scattering from objects within the sample).
-10 0 10 20 30 40 50 60 700
500
1000
1500
2000
2500
3000
Ram
an in
tens
ity
depth (m)
true2.surface
virtuell2.surface
1.surface
Figure 1. Experimentally obtained Raman response (°) of thereference band of a 70-µm thick transparent polymer film ofrefractive index n D 1.5 and corresponding fit (solid line) usingthe solution of the Fredholm Integral Eqn (5).
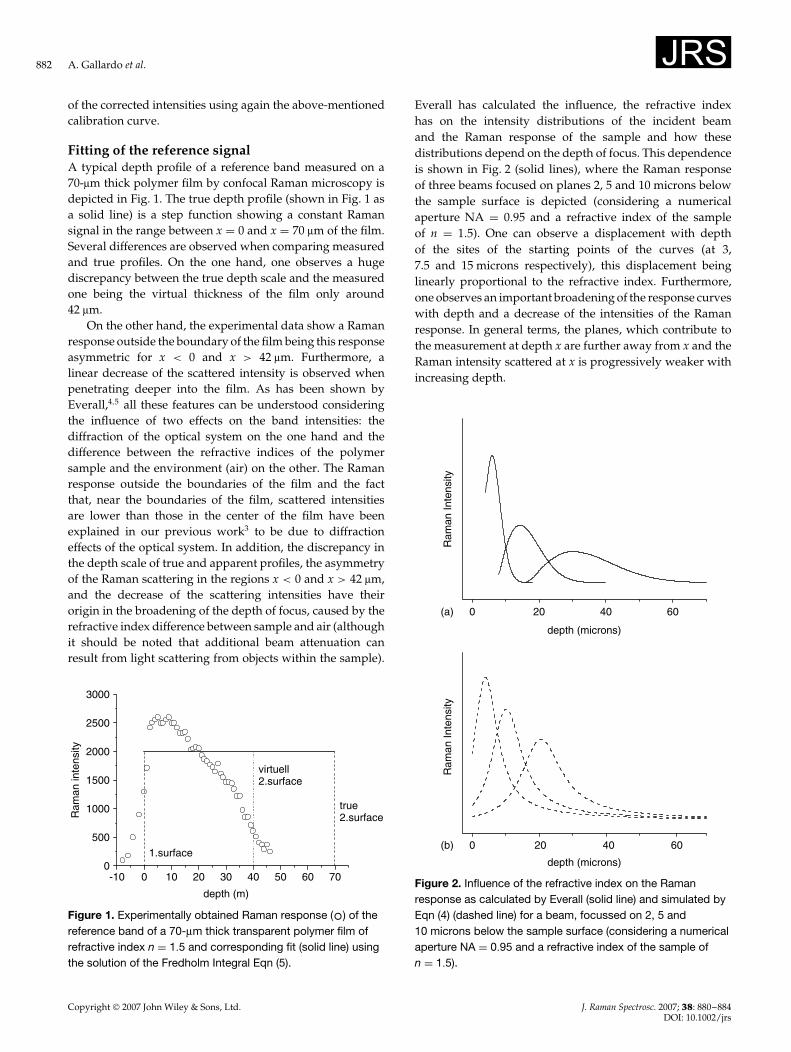
Everall has calculated the influence, the refractive indexhas on the intensity distributions of the incident beamand the Raman response of the sample and how thesedistributions depend on the depth of focus. This dependenceis shown in Fig. 2 (solid lines), where the Raman responseof three beams focused on planes 2, 5 and 10 microns belowthe sample surface is depicted (considering a numericalaperture NA D 0.95 and a refractive index of the sampleof n D 1.5). One can observe a displacement with depthof the sites of the starting points of the curves (at 3,7.5 and 15 microns respectively), this displacement beinglinearly proportional to the refractive index. Furthermore,one observes an important broadening of the response curveswith depth and a decrease of the intensities of the Ramanresponse. In general terms, the planes, which contribute tothe measurement at depth x are further away from x and theRaman intensity scattered at x is progressively weaker withincreasing depth.
0 20 40 60
0 20 40 60
Ram
an In
tens
ity
depth (microns)
(a)
Ram
an In
tens
ity
depth (microns)
(b)
Figure 2. Influence of the refractive index on the Ramanresponse as calculated by Everall (solid line) and simulated byEqn (4) (dashed line) for a beam, focussed on 2, 5 and10 microns below the sample surface (considering a numericalaperture NA D 0.95 and a refractive index of the sample ofn D 1.5).
Copyright 2007 John Wiley & Sons, Ltd. J. Raman Spectrosc. 2007; 38: 880–884DOI: 10.1002/jrs

Depth profile corrections in confocal Raman microscopy 883
In order to account for the refractive index effects, whichare responsible for the displacement of the nominal focalpoint and the broadening of the Raman response profile withdepth as mentioned above, the Lorentzian type function inEqn (2) has been modified empirically in the following way:
H�x, y� D a0a1 C a2y
4�nx � y C nxf �2 C �a1 C a2y�2 �4�
Equation (4) maintains the general form of Eqn (2) butcontains additional parameters, which describe the influenceof the refractive index effect on the resolution curve: n isthe refractive index of the sample, a0 and a1 are parametersof the Lorentzian equation, needed to describe the influenceof diffraction on the resolution curve, a2 is the parameter,which simulates the broadening of the curves and the loss ofintensity with depth and f is the parameter, which simulatesthe displacement of the response curves. When refractioneffects are not taken into account (f D 0, a2 D 0 and n D 1)Eqn (4) becomes identical to Eqn (2). In Fig. 2(b) (dashedlines), the resolution curves obtained using the empiricalEqn (4) are compared with the Raman response profiles,calculated by Everall, to show that they are able to describequalitatively the behavior of the Raman response. It has tobe pointed out that a discrepancy between 2a and 2b couldbe expected as the response profiles, calculated by Everall,consider only the effect of the refractive index, while theempirical Eqn (4) also contains the diffraction effect of theoptical system.
Equation (4) is used in what follows to describe thebehavior of the resolution curve H�x, y� in the FredholmIntegral Eqn (1). With the constant value I�y� D k1 for the truereference signal intensity, the Fredholm integral becomes:
f �x� D∫ b
0k1
[a0
a1 C a2y4�nx � y C nxf �2 C �a1 C a2y�2
]dy �5�
The solution of this expression is calculated using theprogram Mathcad Professional 7 (A detailed derivation canbe obtained from the corresponding author). A least squaresfit of the experimental data of the reference band usingthe solution of Eqn (5) yields as the optimized parametersa2 D 0.52, f D 0.34, a1 D 6.10, a0 D 3.05 for the resolutioncurve H�x, y� and parameter k1 D 811 for the true intensityfunction. In Fig. 3 it is shown that Eqn (5) fits the experimentaldata reasonably well.
Correction of the modifier signalIn Fig. 4, we present the raw data for the modifier signal asobtained from a series of Raman spectra of a polymer film ofthickness d D 70 µm modified simultaneously on both sides.As has been discussed previously,3 for physical reasons, theintensity function of the modifier signal can be supposed tobe of Lorentzian type. Using Eqn (4) for the resolution curveH�x, y� and a Lorentzian dependence for the true symmetricdepth profile, the Fredholm integral equation to be solved is:
0 10 20 30 40 50 60 700
1000
2000
3000
Ram
an In
tens
ity
depth (m)
Figure 3. Experimentally obtained Raman response (°) of thereference band of a 70-µm thick transparent polymer film ofrefractive index n D 1.5 and corresponding fit (solid line) usingthe solution of the Fredholm Integral Eqn (5).
0 10 20 30 40 50 60 700
1000
2000
3000
4000
5000R
aman
Inte
nsity
depth x (m)
Figure 4. Experimentally obtained Raman response (°) of themodifier band of a 70-µm thick transparent polymer film ofrefractive index n D 1.5 and corresponding fit (solid line) usingthe solution of the Fredholm Integral Eqn (6).
f �x� D∫ b
0
[c0
c1
4y2 C c21
C c0c1
4�y � b�2 C c21
]
ð[
a0a1 C a2y
4�nx � y C nxf �2 C �a1 C a2y�2
]dy �6�
The detailed solution of this integral can be obtainedfrom the corresponding author. Applying this solution tofit the experimental data in Fig. 4, one obtains the dashedcurve. The parameters, which correspond to the best fit are:c0 D 27 400, c1 D 7.1
In order to construct the depth profile according to thisprocedure, one has to divide now the calculated intensitiesof the modifier band by the calculated intensities of thereference signal (I�y� D 811) and transform the result intodegrees of modification using a calibration curve. The result
Copyright 2007 John Wiley & Sons, Ltd. J. Raman Spectrosc. 2007; 38: 880–884DOI: 10.1002/jrs

884 A. Gallardo et al.
0 10 20 30 40 50 60 700
1
2
3
degr
ee o
f mod
ifica
tion
(%)
depth (m)
Figure 5. Comparison of depth profiles obtained by (a) simplenormalization (ž) and (b) normalization after correction of thedata (solid line).
of this procedure is shown in Fig. 5, where depth profilesobtained by simple normalization and normalization aftercorrection of the data are compared. Considerable differencescan be observed at the surfaces, where the correctedprofile has higher values than that obtained by simplenormalization. On the other hand, the corrected degreesof modification in the center of the film are lower than themeasured ones. In other words, the corrected profiles exhibitstronger gradients than the measured ones. The differencebetween corrected and uncorrected gradients depends ontwo parameters: the uncorrected gradient itself and the depthresolution curve of the microscope.
CONCLUSIONS
We have shown that depth profiles obtained in a conven-tional way by confocal Raman microspectroscopy contain
intrinsic errors due to diffraction and refraction effects. Thesecan be corrected by a fitting treatment using solutions of anempirically modified Fredholm integral, which relates mea-sured intensities, true intensities and the resolution curveof the confocal configuration. The equation, which describesthe depth resolution is able to simulate the broadening of thedepth of focus with depth and also the discrepancy betweennominal and measured depth scales, which is observed dueto refractive index differences between air and the polymersample.
The major advantage of this treatment is the possibilityto obtain corrected depth profiles from experimental datarecorded with a poor or even nonconfocal depth resolutionusing dry metallurgical objectives. This avoids the necessityof an oil-immersion objective and the problems related tosuch an approach. Furthermore, one can obtain correct resultseven on poor Raman instruments and, as a consequenceof the higher detected count rate in the nonconfocalconfiguration, accumulation times of the spectra can bedrastically shortened.
REFERENCES1. Tabaksblat R, Meier J, Kip BJ. Appl. Spectrosc. 1992; 46: 60.2. Sacristan J, Mijangos C, Spells S, Yarwood J, Reinecke H.
Macromolecules 2000; 33: 6134.3. Gallardo A, Navarro R, Spells S, Reinecke H. Opt. Express 2006;
14-19: 8706.4. Everall NJ. Appl. Spectrosc. 2000; 54: 73.5. Everall NJ. Appl. Spectrosc. 2000; 54: 1515.6. Michielsen J. Appl. Polym. Sci. 2001; 81: 1662.7. Mirabella FM. Appl. Spectrosc. Rev. 1985; 21: 45.8. Baldwin K, Batchelder D. Appl. Spectrosc. 2001; 55: 517.9. Baia L, Gigant K, Posset U, Schottner G, Kiefer W, Popp J. Appl.
Spectrosc. 2002; 56: 536.10. Baia L, Gigant K, Posset U, Petry R, Schottner G, Kiefer W,
Popp J. Vib. Spectrosc. 2002; 29: 245.11. Sourisseau C, Maraval P. Appl. Spectrosc. 2003; 57: 1324.
Copyright 2007 John Wiley & Sons, Ltd. J. Raman Spectrosc. 2007; 38: 880–884DOI: 10.1002/jrs