conducting a user study human-computer interaction
TRANSCRIPT

Conducting a User StudyConducting a User Study
Human-Computer InteractionHuman-Computer Interaction

OverviewOverview Why run a study?Why run a study?
Determine ‘truth’Determine ‘truth’ Evaluate if a statement is trueEvaluate if a statement is true
Ex. The heavier a person weighs, the higher their blood Ex. The heavier a person weighs, the higher their blood pressurepressure Many ways to do this:Many ways to do this:
Look at data from a doctor’s officeLook at data from a doctor’s office Descriptive design: Descriptive design: What’s the pros and cons?What’s the pros and cons? Get a group of people to get weighed and measure their BPGet a group of people to get weighed and measure their BP Analytic design: Analytic design: What’s the pros and cons?What’s the pros and cons? Ideally?Ideally?
Ideal solution: have everyone in the world get weighed and BPIdeal solution: have everyone in the world get weighed and BP Participants are a Participants are a samplesample of the population of the population You should immediately question this!You should immediately question this! Restrict populationRestrict population
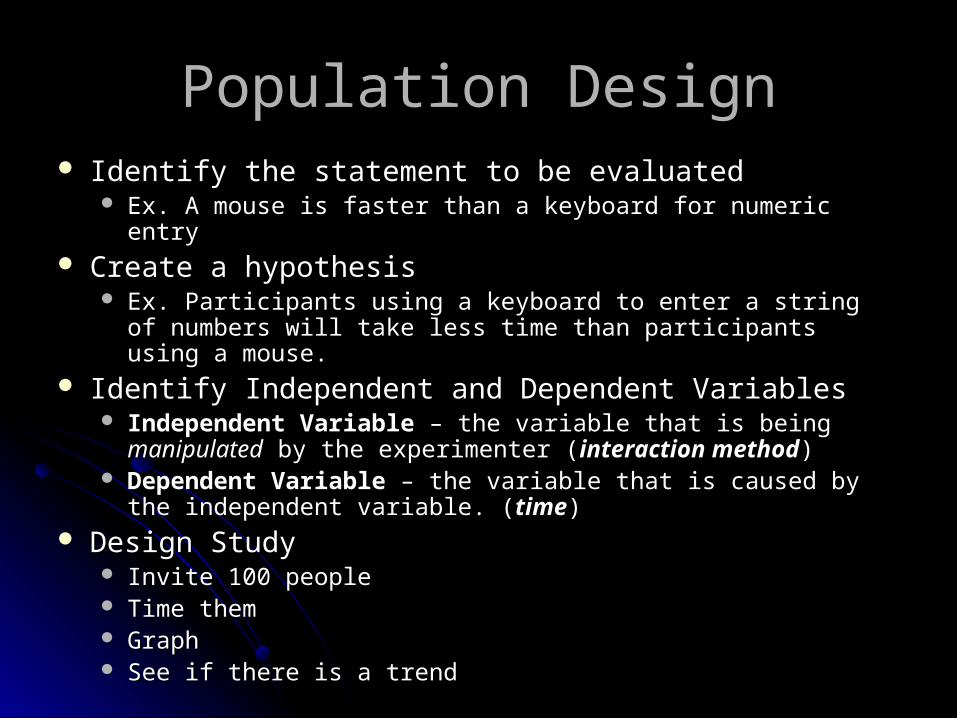
Population DesignPopulation Design Identify the statement to be evaluatedIdentify the statement to be evaluated
Ex. A mouse is faster than a keyboard for numeric entryEx. A mouse is faster than a keyboard for numeric entry Create a hypothesisCreate a hypothesis
Ex. Participants using a keyboard to enter a string of numbers Ex. Participants using a keyboard to enter a string of numbers will take less time than participants using a mouse.will take less time than participants using a mouse.
Identify Independent and Dependent VariablesIdentify Independent and Dependent Variables Independent VariableIndependent Variable – the variable that is being – the variable that is being manipulatedmanipulated
by the experimenter (by the experimenter (interaction methodinteraction method)) Dependent Variable Dependent Variable – the variable that is caused by the – the variable that is caused by the
independent variable. (independent variable. (timetime)) Design StudyDesign Study
Invite 100 peopleInvite 100 people Time themTime them GraphGraph See if there is a trendSee if there is a trend

Two Group DesignTwo Group Design Identify the statement to be evaluatedIdentify the statement to be evaluated
Ex. Shorter people are smarter than taller peopleEx. Shorter people are smarter than taller people Create a hypothesisCreate a hypothesis
Ex. IQ of people shorter than 5’9” > IQ of people 5’9” Ex. IQ of people shorter than 5’9” > IQ of people 5’9” or talleror taller
Design StudyDesign Study Two groups called Two groups called conditionsconditions How many participants?How many participants? Do the groups need the same # of participants?Do the groups need the same # of participants? What’s your design?What’s your design? What is the independent and dependent variables?What is the independent and dependent variables?
Confounding factors Confounding factors – factors that affect – factors that affect outcomes, but are not related to the studyoutcomes, but are not related to the study
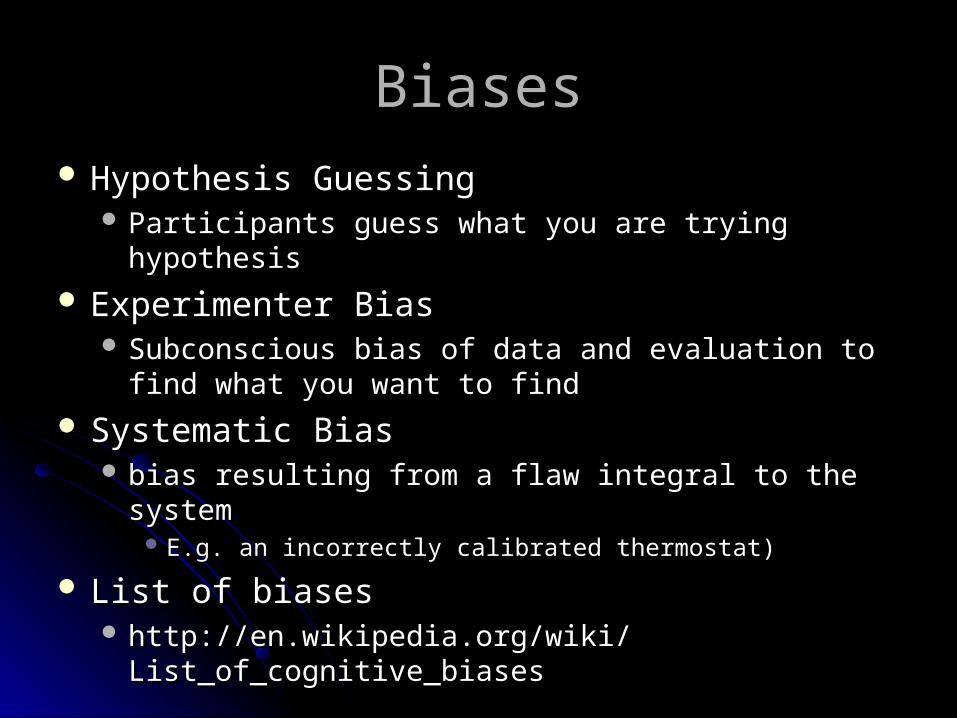
BiasesBiases Hypothesis GuessingHypothesis Guessing
Participants guess what you are trying hypothesisParticipants guess what you are trying hypothesis
Experimenter BiasExperimenter Bias Subconscious bias of data and evaluation to find what Subconscious bias of data and evaluation to find what
you want to findyou want to find
Systematic BiasSystematic Bias bias resulting from a flaw integral to the system bias resulting from a flaw integral to the system
E.g. an incorrectly calibrated thermostat)E.g. an incorrectly calibrated thermostat)
List of biasesList of biases http://en.wikipedia.org/wiki/List_of_cognitive_biaseshttp://en.wikipedia.org/wiki/List_of_cognitive_biases

What does this mean?What does this mean?
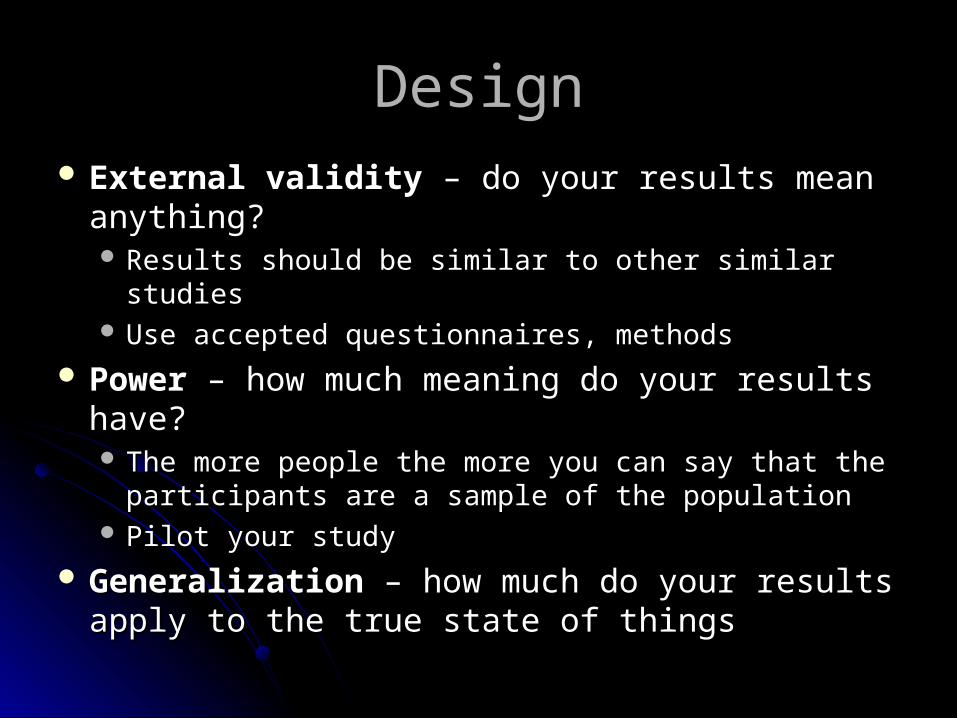
DesignDesign External validity External validity – do your results mean – do your results mean
anything?anything? Results should be similar to other similar studiesResults should be similar to other similar studies Use accepted questionnaires, methodsUse accepted questionnaires, methods
Power Power – how much meaning do your results – how much meaning do your results have?have? The more people the more you can say that the The more people the more you can say that the
participants are a sample of the populationparticipants are a sample of the population Pilot your studyPilot your study
GeneralizationGeneralization – how much do your results – how much do your results apply to the true state of thingsapply to the true state of things

DesignDesignPeople who use a mouse and keyboard People who use a mouse and keyboard
will be faster to fill out a form than will be faster to fill out a form than keyboard alone.keyboard alone.
Let’s create a study designLet’s create a study designHypothesisHypothesisPopulationPopulationProcedureProcedure
Two types:Two types:Between SubjectsBetween SubjectsAcross SubjectsAcross Subjects

ProcedureProcedure
Formally have all participants sign up for a Formally have all participants sign up for a time slot (if individual testing is needed)time slot (if individual testing is needed)
Informed Consent (let’s look at one)Informed Consent (let’s look at one)Execute studyExecute studyQuestionnaires/Debriefing (let’s look at Questionnaires/Debriefing (let’s look at
one)one)
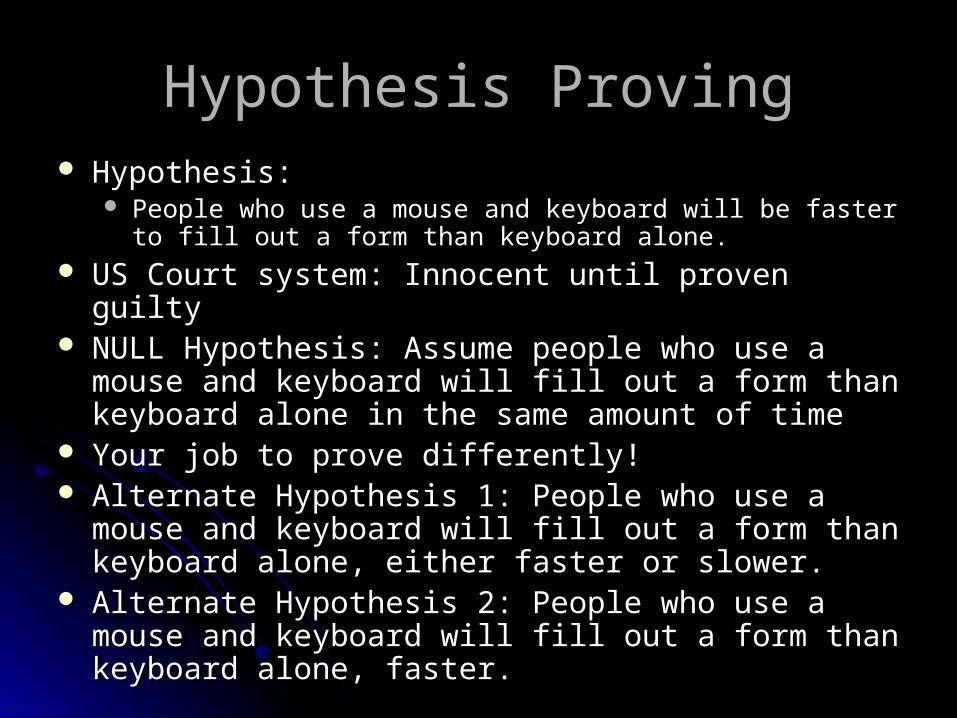
Hypothesis ProvingHypothesis Proving Hypothesis:Hypothesis:
People who use a mouse and keyboard will be faster to fill out a People who use a mouse and keyboard will be faster to fill out a form than keyboard alone.form than keyboard alone.
US Court system: Innocent until proven guiltyUS Court system: Innocent until proven guilty NULL Hypothesis: Assume people who use a mouse and NULL Hypothesis: Assume people who use a mouse and
keyboard will fill out a form than keyboard alone in the keyboard will fill out a form than keyboard alone in the same amount of timesame amount of time
Your job to prove differently!Your job to prove differently! Alternate Hypothesis 1: People who use a mouse and Alternate Hypothesis 1: People who use a mouse and
keyboard will fill out a form than keyboard alone, either keyboard will fill out a form than keyboard alone, either faster or slower.faster or slower.
Alternate Hypothesis 2: People who use a mouse and Alternate Hypothesis 2: People who use a mouse and keyboard will fill out a form than keyboard alone, faster.keyboard will fill out a form than keyboard alone, faster.

AnalysisAnalysis
Most of what we do involves:Most of what we do involves:Normal Distributed ResultsNormal Distributed Results Independent TestingIndependent TestingHomogenous PopulationHomogenous Population

Raw DataRaw Data
Keyboard timesKeyboard timesE.g. 3.4, 4.4, 5.2, 4.8, 10.1, 1.1, 2.2E.g. 3.4, 4.4, 5.2, 4.8, 10.1, 1.1, 2.2Mean = 4.46Mean = 4.46Variance = 7.14 (Excel’s VARP)Variance = 7.14 (Excel’s VARP)Standard deviation = 2.67 (sqrt variance)Standard deviation = 2.67 (sqrt variance)
What do the different statistical data tell What do the different statistical data tell us?us?

What does Raw Data Mean?What does Raw Data Mean?

Roll of ChanceRoll of Chance
How do we know how much is the ‘truth’ How do we know how much is the ‘truth’ and how much is ‘chance’?and how much is ‘chance’?
How much confidence do we have in our How much confidence do we have in our answer?answer?

HypothesisHypothesis We assumed the means are “equal”We assumed the means are “equal” But are they? But are they? Or is the difference due to chance?Or is the difference due to chance?
Small Pattern (seconds) Large Pattern (seconds)
Mean S.D. Mean S.D. Min Max
Condition 1 16.81 6.34 37.24 8.99
Condition 2 47.24 10.43 116.99 32.25
Condition 3 31.68 5.65 86.83 26.80
Condition 4 28.88 7.64 72.31 16.41

T - testT - test
T – test – statistical test used to determine T – test – statistical test used to determine whether two observed means are whether two observed means are statistically differentstatistically different

T-testT-test DistributionsDistributions

T – test T – test
(rule of thumb) Good values of t > 1.96(rule of thumb) Good values of t > 1.96Look at what contributes to tLook at what contributes to thttp://socialresearchmethods.net/kb/http://socialresearchmethods.net/kb/
stat_t.htmstat_t.htm

F statistic, p valuesF statistic, p values F statistic – assesses the extent to which the F statistic – assesses the extent to which the
means of the experimental conditions differ more means of the experimental conditions differ more than would be expected by chancethan would be expected by chance
t is related to F statistict is related to F statistic Look up a table, get the Look up a table, get the pp value. Compare to value. Compare to αα α value – probability of making a Type I error α value – probability of making a Type I error
(rejecting null hypothesis when really true)(rejecting null hypothesis when really true) p p value – statistical likelihood of an observed value – statistical likelihood of an observed
pattern of data, calculated on the basis of the pattern of data, calculated on the basis of the sampling distribution of the statistic. (% chance sampling distribution of the statistic. (% chance it was due to chance)it was due to chance)

T and alpha valuesT and alpha values

Small Pattern Large Pattern
t – testwith unequal
variancep – value
t – testwith unequal variance
p - value
PVE – RSE vs. VFHE – RSE 3.32 0.0026** 4.39 0.00016***
PVE – RSE vs.HE – RSE 2.81 0.0094** 2.45 0.021*
VFHE – RSE vs.HE – RSE 1.02 0.32 2.01 0.055+

SignificanceSignificance What does it mean to be significant?What does it mean to be significant? You have some confidence it was not due to You have some confidence it was not due to
chance.chance. But difference between But difference between statisticalstatistical significance significance
and and meaningfulmeaningful significance significance Always know: Always know:
samples (samples (nn)) p valuep value variance/standard deviationvariance/standard deviation meansmeans
IRBIRB
http://irb.ufl.edu/irb02/index.htmlhttp://irb.ufl.edu/irb02/index.htmlLet’s look at a completed oneLet’s look at a completed oneYou MUST turn one in before you You MUST turn one in before you
complete a studycomplete a studyMust have OKed before running studyMust have OKed before running study