conditional open and delay time histograms of sodium channels
TRANSCRIPT
Biochimica et Biophysica Acta, 942 (1988) 209-212 209 Elsevier
BBA 70564 BBA Report
C o n d i t i o n a l o p e n and de lay t i m e h i s t o g r a m s o f s o d i u m c h a n n e l s
K a r o l y N a g y
I. Physiologisches lnstitut des Universitiit des Saarlandes, Homburg (F. R. G.)
(Received 29 February 1988)
Key words: Single sodium channel; Open time histogram; Delay time histogram; (Neuroblastoma cell)
Currents through single sodium channels were recorded in neuroblastoma cells. Open time histograms were constructed from openings which appeared between 2.0 and 5.0 ms after the onset of the depolarization. Histograms constructed from openings which were not preceded by other openings showed a maximum at t > 0 in contrast to those, which were preceded by other openings. Time constants of delay time histograms fitted by the sum of two exponentials were different for the first, second and third records of runs. The results support the view that sodium channels have multiple open and closed states and the transition probabilities among the states depend on local conditions of the membrane.
Open time histograms constructed for the 0-5 ms range of the depolarization showed a maxi- mum at t > 0 in contrast to those, which were constructed for the 5-40 ms range [1]. Patlak and Ortiz [2] reported that sodium channels can be interconverted into different modes of gating. The present paper reports further changes of open as well as delay time histograms depending on the previous history of the membrane.
Single sodium channel currents were measured in neuroblastoma cells, N I E 115. The experimen- tal technique has been described earlier [1,3]. Single-channel currents were recorded in cell-at- tached configuration [4]. Patches were hyper- polarized by 80 mV (relative to the cells' resting potential of about - 4 0 mV) to remove resting inactivation. 40 ms long depolarizing pulses were applied every second. Pipette and bath solutions contained (in mM): 140 NaC1, 5.0 KC1, 1.8 CaC12,
Correspondence (present address): K. Nag)', Institut fiir Biolo- gie II, Zoologle, RWTH Aachen, Kopernikusstrasse 16, D-5100 Aachen, F.R.G.
0.8 MgC12, 20 Hepes, 20 glucose. The pH was adjusted to 7.3 and the temperature was 8 ° C.
Details of the measuring system were described by Hof [5]. Pulse generation and data acquisition were made by a DEC LSI 11/23 microcomputer. Analog signals were filtered at 2 kHz ( - 3 dB) by a four-pole low-pass filter and digitized at 10 kHz. The dead time of the measuring system was < 0.1 ms [1] and the signal-to-noise ratio was > 8.3. Open times were measured on records which did not display overlapping openings. Experiments with more than 2500 depolarizations were used for the present calculations. Less than 1500 depolari- zations were not sufficient for detailed statistical analysis.
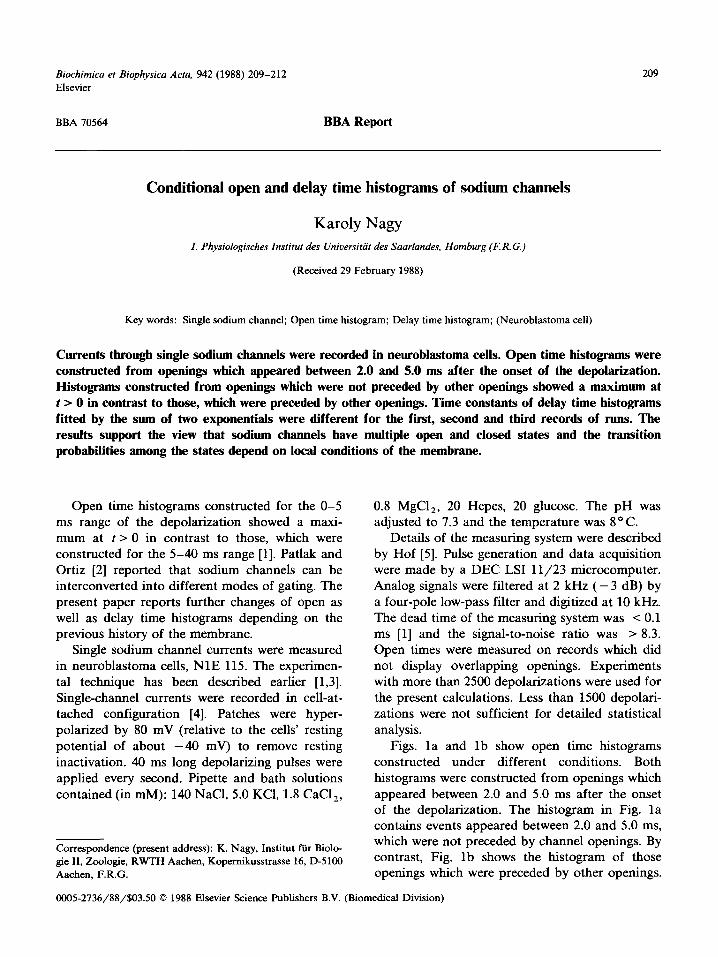
Figs. la and lb show open time histograms constructed under different conditions. Both histograms were constructed from openings which appeared between 2.0 and 5.0 ms after the onset of the depolarization. The histogram in Fig. la contains events appeared between 2.0 and 5.0 ms, which were not preceded by channel openings. By contrast, Fig. lb shows the histogram of those openings which were preceded by other openings.
0005-2736/88/$03.50 © 1988 Elsevier Science Publishers B.V. (Biomedical Division)

210
40
a
20
b
. . ;
1:3 1 t [ms}
0 0 ' u ~ 0 2 4 6 t (ms) 0 2 4 6 t (ms)
Fig. 1. Conditional open time histograms constructed from openings in the 2.0-5.0 ms range of the depolarization. The histograms include events which were not preceded (a) and were preceded (b) by openings at 0-2.0 ms. In (a) the histogram was best fitted by the difference of two exponentials resulting in T 1 = 0.39 ms and $2 = 0.71 ms, chi-square (df) = 18.14 (26), P = 0.87. The histogram in (b) was fitted by a single exponential; r = 1.30 ms, chi-square (df) = 22.86 (18), P = 0.19. The mean open times tOT) and the number
of events tEN) were OT = 1.29 ms, EN = 940 for (a) and OT = 1.32 ms, ZN = 289 for (b). F H = RP- 80 mV, V m = RP.
The intervals for select ion of events (2.0 to 5.0 ms) and for cond i t ion ing (0 to 2.0 ms) were chosen to see a m a x i m u m in the open t ime h is togram [1] and to f ind sufficient events for bo th condi t ions . The two h is tograms are c lear ly different in the ear ly phase. The p lo t in Fig. l a has a m a x i m u m at approx . 0.6 ms s imi lar to the h i s togram repor ted earl ier for this t ime range of the depo la r iza t ion [1]. This h i s togram could be best f i t ted by the dif- ference of two exponent ia ls . The t ime cons tan ts ~'1 = 0.39 ms, ~'2 = 0.71 ms are s imilar to those ob ta ined earl ier for the uncond i t iona l open t ime his tograms, which were ~'1 = 0.34 ms and ~'2 = 0.83 ms for the 2 .0-6 .5 ms t ime range of the depolar i - za t ion (see Table II in Ref. 1). In contras t , the p lo t in Fig. l b does not show a clear charac te r in the ear ly phase. I t was a p p r o x i m a t e d by a single ex- ponen t i a l with r = 1.30 ms.
The difference be tween Figs. l a and l b sug- gests that the open confo rmat ions or the t rans i t ion p robab i l i t i e s be tween the open and closed states (see Ref. 1) m a y be inf luenced by previously opened channels . I t follows that the first, second, etc. openings on a record might have dif ferent open times. The mean open t ime of the i t h open- ing tOT,) ca lcula ted f rom the same exper iment as Fig. 1 was: O T 1 = 1.30 ms (n = 894), O T 2 = 1.43 ms (n = 292), O T 3 = 1.62 ms (n = 91), OT 4 = 1.73 ms (n = 32). A l though the increase of the mean
open t ime with the o rde r n u m b e r is clear, the in te rp re ta t ion is difficult . The larger the o rde r number the longer the de lay of the opening. Therefore, the increase of the open t ime with the order number might be enhanced b y a fac tor due to the t ime dependence of the open t ime [1,6]. (I t is necessary to no te that channels open on ly once dur ing a depo la r i za t ion (see also Ref. 7). Patches con ta ined four to six channels . The p robab i l i t y for reopening was 0.05 ca lcula ted af ter Kunze et al. [8], which value is abou t 10-t imes smal ler than the p robab i l i t y for first open ing of a channel . There- fore, the second, third, etc. open ings on a record are main ly first openings and not reopenings. )
Previous results ind ica ted that the open t ime h is tograms (and so the open conformat ions , or the t rans i t ion probabi l i t i es ) change with increas ing t ime measured f rom the onset of the depo la r i za - t ion [1]. F o r the present analyses it was supposed that cer ta in changes of h i s tograms m a y occur on longer t ime scale, i.e. f rom depo la r i za t ion to de- polar iza t ion , too. I t was shown a l r eady by Pa t lak and Ort iz [2] that sod ium channels can have dif- ferent modes of gat ing and that the modes can be in terchanged. I t was also r epor t ed [9] that con- secutive depo la r iza t ions elicit groups of records with and wi thout openings. The cluster ing of these groups in the presen t exper iments was highly sig- ni f icant (the pa rame te r for clustering, Z > 2.24,
211
P P
1 . 0 ! l .O
0 20 t ( ms )
"~2= 10. 3E~ ms
P
l .O
, ~ 0
20 t [ m s ] 0 20 t [ms ]
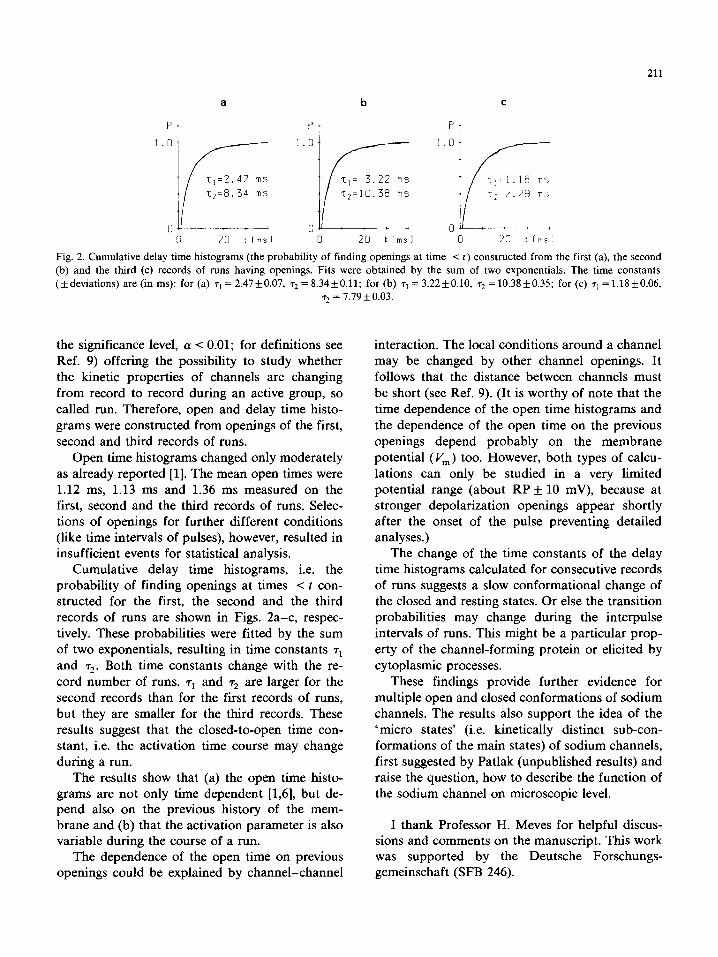
Fig. 2. Cumulative delay time histograms (the probability of finding openings at time < t) constructed from the first (a), the second (b) and the third (c) records of runs having openings. Fits were obtained by the sum of two exponentials. The time constants (+deviat ions) are (in ms): for (a) r I = 2.47+0.07, ~'2 = 8.34+0.11; for (b) ~1 = 3.22+0.10, ~'2 =10.38+0.35; for (c) ~'1 =1 .18+0.06 ,
~'2 = 7.79 + 0.03.
the significance level, a < 0.01; for definitions see Ref. 9) offering the possibility to study whether the kinetic properties of channels are changing from record to record during an active group, so called run. Therefore, open and delay time histo- grams were constructed from openings of the first, second and third records of runs.
Open time histograms changed only moderately as already reported [1]. The mean open times were 1.12 ms, 1.13 ms and 1.36 ms measured on the first, second and the third records of runs. Selec- tions of openings for further different conditions (like time intervals of pulses), however, resulted in insufficient events for statistical analysis.
Cumulative delay time histograms, i.e. the probability of finding openings at times < t con- structed for the first, the second and the third records of runs are shown in Figs. 2a-c, respec- tively. These probabilities were fitted by the sum of two exponentials, resulting in time constants ~'1 and ~'2- Both time constants change with the re- cord number of runs. z 1 and ,i- 2 are larger for the second records than for the first records of runs, but they are smaller for the third records. These results suggest that the closed-to-open time con- stant, i.e. the activation time course may change during a run.
The results show that (a) the open time histo- grams are not only time dependent [1,6], but de- pend also on the previous history of the mem- brane and (b) that the activation parameter is also variable during the course of a run.
The dependence of the open time on previous openings could be explained by channel-channel
interaction. The local conditions around a channel may be changed by other channel openings. It follows that the distance between channels must be short (see Ref. 9). (It is worthy of note that the time dependence of the open time histograms and the dependence of the open time on the previous openings depend probably on the membrane potential (Vm) too. However, both types of calcu- lations can only be studied in a very limited potential range (about RP + 10 mV), because at stronger depolarization openings appear shortly after the onset of the pulse preventing detailed analyses.)
The change of the time constants of the delay time histograms calculated for consecutive records of runs suggests a slow conformational change of the closed and resting states. Or else the transition probabilities may change during the interpulse intervals of runs. This might be a particular prop- erty of the channel-forming protein or elicited by cytoplasmic processes.
These findings provide further evidence for multiple open and closed conformations of sodium channels. The results also support the idea of the 'micro states' (i.e. kinetically distinct sub-con- formations of the main states) of sodium channels, first suggested by Patlak (unpublished results) and raise the question, how to describe the function of the sodium channel on microscopic level.
I thank Professor H. Meves for helpful discus- sions and comments on the manuscript. This work was supported by the Deutsche Forschungs- gemeinschaft (SFB 246).

212
References
1 Nagy, K. (1987) J. Membr. Biol. 96, 251-262. 2 Patlak, J.B. and Ortiz, M. (1986) J. Gen. Physiol. 87, 305-326. 3 Nagy, K., Kiss, T. and Hof, D. (1983) Pfliigers Arch. 399,
302-308. 4 Hamill, O.P., Marty, A., Neher, E., Sakmann, B. and
Sigworth, F. (1981) Pfliigers Arch. 391, 85-100.
5 Hof, D. (1986) Comput. Method. Program. Biomed. 23 309-315.
6 Nagy, K. (1987) Pfliigers Arch. 408, R36. 7 Aldrich, R.W., Corey, D.P. and Stevens, C.F. (1983) Natur~
(London) 306, 436-441. 8 Kunze, P.L., Lacerda, A.E., Wilson, D.L. and Brown, A.M
(1985) J. Gen. Physiol. 86, 691-719. 9 Kiss, T. and Nagy, K. (1985) Eur. Biophys. J. 12, 13-18.