condensed unaudited group results - redefine
TRANSCRIPT

Condensed unaudited Group resultsfor the six months ended 28 February 2021
Massmart, Brackengate 2, Brackenfell
Highlights
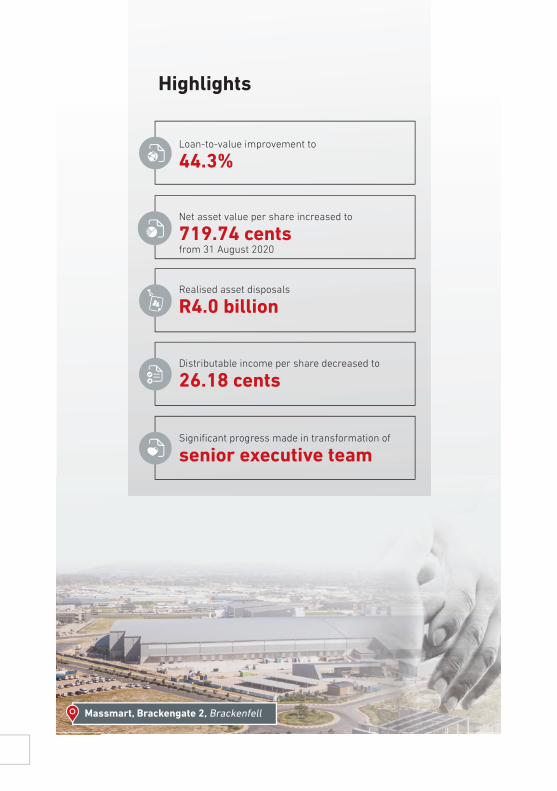
Loan-to-value improvement to
44.3%
Net asset value per share increased to
719.74 centsfrom 31 August 2020
Realised asset disposals
R4.0 billion
Distributable income per share decreased to
26.18 cents
Signifi cant progress made in transformation of
senior executive team

Centurion Mall, Centurion
Commentary1Results SA REIT ratiosCommentary
1
ProfileRedefine is a South African-based Real Estate Investment Trust (REIT), with a sectoral and geographically diversified property asset platform valued at R75.3 billion (FY20: R81.0 billion). Redefine’s portfolio is predominately anchored in local directly held retail, office and industrial properties, which is complemented by retail and logistics property assets in Poland.
Redefine’s purpose is to create and manage spaces in a way that changes lives, which requires more than a business as usual approach: it requires an integrated approach to making strategic choices that will sustain value creation for all stakeholders by focusing on what matters most.
Redefine is listed on the Johannesburg Stock Exchange (JSE) with a market capitalisation of R25.0 billion (FY20: R14.9 billion). By volume, Redefine’s shares are among the most actively traded in the SA REIT sector, making it a highly liquid, single-entry point for investors to gain exposure to the domestic and Polish real estate markets.
Redefine’s local property assets are valued at R63.0 billion (FY20: R65.4 billion). The international real estate investments are valued at R12.3 billion (FY20: R15.6 billion) representing 16.3% (FY20: 19.3%) of the Group’s total property assets, providing geographic diversification to Poland. The decrease in the property assets in the current period is due to disposal activity, Rand appreciation and negative fair value adjustments.
Group loan-to-value (LTV) ratio improvement planRedefine’s top strategic priority during the current reporting period was to continue to reduce the Group’s LTV through the execution of a focused LTV improvement plan. Milestones achieved during the six months ended 28 February 2021, included:
à disposal of local properties to realise R1.2 billion;
à reduced speculative capital expenditure;
à halting of local property acquisitions; and
à the disposal of the Australian student accommodation portfolio. The proceeds of R2.8 billion from the sale of Leicester Street were received during December 2020. The sale of Swanston Street is expected to close during the 2022 financial year once COVID-19 pandemic travel restrictions are lifted.
During the period the LTV reduced by 3.6% to 44.3%. The improvement initiatives and appreciation of the Rand yielded a LTV reduction of 4.6% and 0.8% respectively, while the negative revaluation of assets driven predominantly by the impact of COVID-19, the tax leakage arising from not paying a dividend in respect of the 2020 financial year and necessary capital expenditure increased the LTV by 1.8%. Initiatives are in progress to reduce the LTV further by August 2021, in line with our goal of reducing the LTV to below 40%, which includes further optimisation of the property asset base, as well as the completion of the property asset disposals in progress.
The LTV improvement plan has accelerated Redefine’s transformation of its asset platform to become one that is simplified, focused and significant in its respective sectors and geographies.
2
Financial resultsDistributable income per share for the six months ended 28 February 2021 amounted to 26.18 (HY20: 33.46) cents, a decrease of 21.8% on the previous pre-COVID-19 pandemic comparable period. Total revenue (excluding straight-line rental income) decreased by 13.8% (HY20: growth of 8.5%). The decrease in revenue for the period is largely attributable to the deconsolidation of European Logistics Investment B.V. (ELI) (which is now equity-accounted) during the second half of 2020, the sale of Leicester Street and non-core local properties during the period. In addition, Redefi ne’s local property portfolio performance was impacted by the various lockdown levels and restrictions imposed by the government to curb the spread of the virus. This necessitated negative rental reversions and the granting of further rental relief albeit at a lower level compared to the prior year to support the sustainability of our tenants. During the period, total relief granted to our tenants amounted to R107.3 million (FY20: R318.5 million), made up of rental discounts of R81.5 million and deferred rental payments of R25.8 million. Retail tenants – in particular travel agents and cinemas were the most impacted, with hairdressers and beauty salons still battling to recover. The decrease in revenue accounts for the bulk of the decrease in distributable income.
Due to continued hard lockdown measures adopted by the Polish government to curb the rise in COVID-19 pandemic related hospitalisation, EPP N.V. (EPP) have once again withheld dividends during the period to preserve fi nancial fl exibility and bolster their own liquidity. Given the encouraging progress of the Polish vaccination programme, we expect a strong rebound in the Polish economy which will be supportive of a buoyant retail environment in 2022. The Polish logistics assets have proved to be resilient during the period, maintaining their dividend fl ow with very limited impact to their operations.
The operating cost (including expected credit losses-trade receivables) margin increased to 38.1% (HY20: 36.0%) of contractual rental income (excluding straight-line rental income accrual) due to negative revenue growth. Net of electricity cost and utility recoveries, operating costs were 18.2% (HY20:17.4%) of contractual rental income (excluding straight-line rental income accrual).
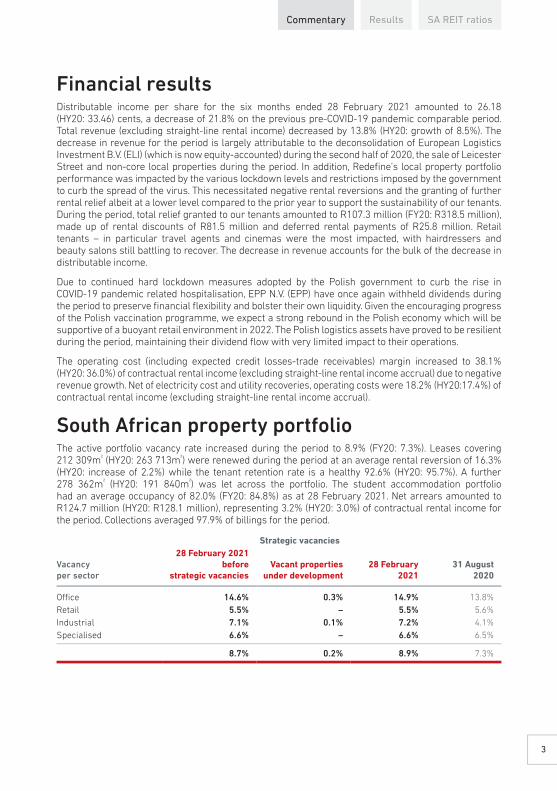
South African property portfolioThe active portfolio vacancy rate increased during the period to 8.9% (FY20: 7.3%). Leases covering 212 309m² (HY20: 263 713m²) were renewed during the period at an average rental reversion of 16.3% (HY20: increase of 2.2%) while the tenant retention rate is a healthy 92.6% (HY20: 95.7%). A further 278 362m² (HY20: 191 840m²) was let across the portfolio. The student accommodation portfolio had an average occupancy of 82.0% (FY20: 84.8%) as at 28 February 2021. Net arrears amounted to R124.7 million (HY20: R128.1 million), representing 3.2% (HY20: 3.0%) of contractual rental income for the period. Collections averaged 97.9% of billings for the period.
Strategic vacancies
Vacancyper sector
28 February 2021before
strategic vacanciesVacant properties
under development28 February
202131 August
2020
Offi ce 14.6% 0.3% 14.9% 13.8%Retail 5.5% – 5.5% 5.6%Industrial 7.1% 0.1% 7.2% 4.1%Specialised 6.6% – 6.6% 6.5%
8.7% 0.2% 8.9% 7.3%
Results SA REIT ratiosCommentary
3
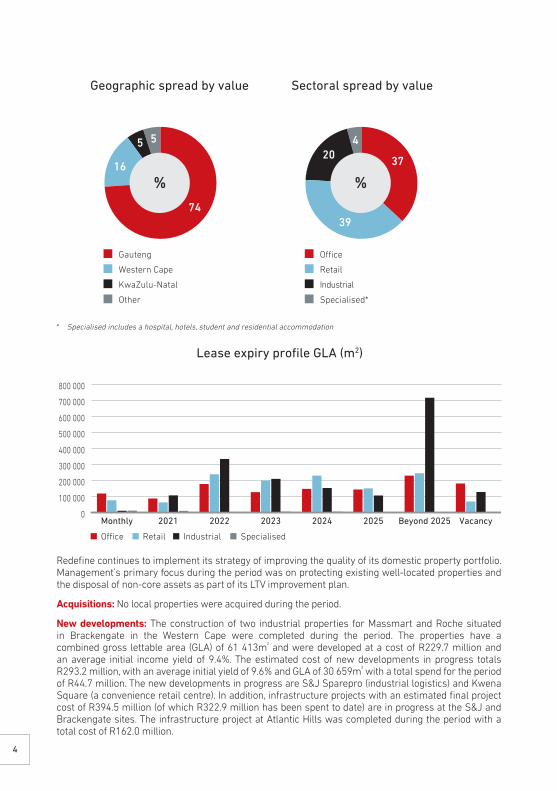
* Specialised includes a hospital, hotels, student and residential accommodation
Redefine continues to implement its strategy of improving the quality of its domestic property portfolio. Management’s primary focus during the period was on protecting existing well-located properties and the disposal of non-core assets as part of its LTV improvement plan.
Acquisitions: No local properties were acquired during the period.
New developments: The construction of two industrial properties for Massmart and Roche situated in Brackengate in the Western Cape were completed during the period. The properties have a combined gross lettable area (GLA) of 61 413m² and were developed at a cost of R229.7 million and an average initial income yield of 9.4%. The estimated cost of new developments in progress totals R293.2 million, with an average initial yield of 9.6% and GLA of 30 659m² with a total spend for the period of R44.7 million. The new developments in progress are S&J Sparepro (industrial logistics) and Kwena Square (a convenience retail centre). In addition, infrastructure projects with an estimated final project cost of R394.5 million (of which R322.9 million has been spent to date) are in progress at the S&J and Brackengate sites. The infrastructure project at Atlantic Hills was completed during the period with a total cost of R162.0 million.
0
100 000
200 000
300 000
400 000
500 000
600 000
700 000
800 000
VacancyBeyond 202520252024202320222021Monthly
O�ce Retail Industrial Specialised
Lease expiry profile GLA (m2)
Geographic spread by value
74
16
5 5
Gauteng
Western Cape
KwaZulu-Natal
Other
Oce
Retail
Industrial
Specialised*
%
Sectoral spread by value
37
39
204
%
4
Held-for-trading: Redefi ne disposed of four units in its Park Central residential development for R8.6 million.
Disposals: During the period, Redefi ne disposed of six properties for an aggregate consideration of R1.2 billion, covering GLA of 93 551m² at an average yield of 10.6%, and one portion of vacant land for a total consideration of R33.0 million. Agreements, subject to the usual conditions precedent, have been concluded to dispose of four properties for an aggregate consideration of R152.2 million at an average yield of 14.7%. Discussions are at an advanced stage to dispose of a number of non-core property-related assets for aggregate proceeds of R2.5 billion.
Sustainability: Redefi ne’s current installed solar capacity is 25.0 MWp. No additional projects were completed for the fi nancial period to date. The sale of Langeberg Mall reduced our total solar installed capacity by 1.39 MWp. New projects at Mifa Industrial Park and Ballyoaks Offi ce Park are currently underway which will increase our total installed solar capacity to 26.1 MWp.
International property portfolioRedefi ne continues to execute its strategy of geographic diversifi cation through expanding its exposure to the Polish logistics sector to reduce risk and benefi t from yield compression arising from development activities.
Europe-ELI: meets the defi nition of a joint venture, with Redefi ne and Madison International Holdings VII LLC (Madison) being the joint venture partners in the Polish logistics assets. Redefi ne and Madison have contractually agreed to the sharing of control of ELI that requires unanimous consent by both parties on decisions about its relevant activities. At inception of the joint venture, Madison committed to a total equity commitment of €150.0 million (R2.7 billion) over fi ve years. After the settlement of the purchase price and allowing for an earn-out fee payable for the developments under construction, Madison’s equity commitment was estimated at €66.3 million (R1.2 billion). Redefi ne agreed to match Madison’s equity commitment. As at 28 February 2021, the equity commitment was adjusted to €76.3 million (R1.4 billion) as a result of an adjustment to the estimated earn-out fees to be paid by Madison for the developments under construction. Redefi ne’s remaining equity commitment amounts to €45.7 million (R836.3 million), with earn-out fees of €14.8 million (R270.8 million) still to be received as the developments are completed.
At 28 February 2021, the carrying value of our 46.5% equity accounted investment in ELI is R1.5 billion (FY20: R1.3 billion). The investment in ELI increased by R193.4 million, mainly due to the capital deployment of R213.2 million and equity accounted profi t of R135.3 million, set off by foreign currency translation losses incurred of R128.2 million as a result of the appreciation of the Rand and dividends received during the period, totalling R26.9 million (FY20: R72.3 million). The year-on-year decrease in the dividend is due to the reduction in Redefi ne’s shareholding in ELI. No impairment indicators were present for ELI at 28 February 2021.
ELI’s active portfolio (based on 100% ownership) generated like-for-like revenue growth of 0.6% on the prior period. At 28 February 2021, the income producing platform has a GLA of 605 812 m² with a vacancy of 7.1% (FY20: 9.9%). During the period, developments with a total GLA of 67 343 m² were completed at a cost of €40.0 million (R746.3 million) resulting in a capital uplift of €12.1 million (R226.3 million). The capital spent on developments for the period totalled €33.2 million (R619.8 million).
Developments under construction at a total estimated cost of €119.9 million (R2.2 billion) will add a further 173 240 m2 to the portfolio.
Europe-EPP: The carrying value of the investment in EPP reduced by R508.2 million. The movement was due to the recognition of the equity accounted loss of R0.6 billion and foreign currency translation losses incurred of R1.0 billion set off by the partial reversal of the impairment raised in the previous fi nancial period of R1.1 billion. The equity accounted loss of EPP was largely driven by the decline in the property valuations. The improvement in the EPP share price, the low Polish unemployment rate as well as the favourable progress of the vaccination programme in Poland were noted as indicators that the impairment loss recognised in the prior period had decreased. The carrying value of EPP was subject to impairment testing in accordance with IAS 36: Impairment of assets. The impairment/reversal of impairment was calculated by comparing the carrying amount to the recoverable amount.
Results SA REIT ratiosCommentary
5
Redefine has an effective shareholding of 45.4% in EPP. To guard against the perception that Redefine may be able to exercise control through voting at general meetings, it has agreed to limit its voting rights exercisable at general meetings by entering a Voting Limitation Deed (the VLD).
In terms of the VLD, the voting rights exercised by Redefine at general meetings of EPP will, while the VLD remains operative, not exceed 40% of the aggregate votes exercised either in favour or against the relevant resolution by all EPP shareholders (including Redefine). Any excess votes attributable to Redefine’s shares in EPP will be reflected as abstentions in relation to the relevant resolution.
Africa-Lango Real Estate Limited: Redefine currently holds a 3.5% share in Lango Real Estate Limited (Lango), previously known as Growthpoint Investec African Properties Limited. The carrying value of the held investment is R175.5 million. Redefine’s intention is to exit this investment as part of its LTV improvement plan.
Australia-Journal Student Accommodation Fund: Proceeds from the Leicester Street disposal were received during December 2020. The disposal of Swanston Street is unconditional, however settlement remains subject to COVID-19 pandemic travel restrictions in relation to persons travelling to Australia with an Australian Student Visa from specified countries being lifted with settlement contractually due during the second quarter of the 2022 financial year.
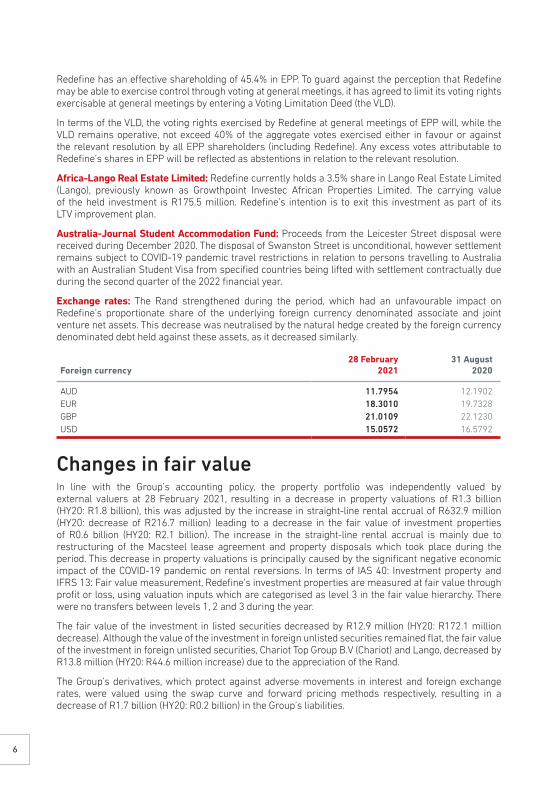
Exchange rates: The Rand strengthened during the period, which had an unfavourable impact on Redefine’s proportionate share of the underlying foreign currency denominated associate and joint venture net assets. This decrease was neutralised by the natural hedge created by the foreign currency denominated debt held against these assets, as it decreased similarly.
Foreign currency28 February
202131 August
2020
AUD 11.7954 12.1902EUR 18.3010 19.7328GBP 21.0109 22.1230USD 15.0572 16.5792
Changes in fair valueIn line with the Group’s accounting policy, the property portfolio was independently valued by external valuers at 28 February 2021, resulting in a decrease in property valuations of R1.3 billion (HY20: R1.8 billion), this was adjusted by the increase in straight-line rental accrual of R632.9 million (HY20: decrease of R216.7 million) leading to a decrease in the fair value of investment properties of R0.6 billion (HY20: R2.1 billion). The increase in the straight-line rental accrual is mainly due to restructuring of the Macsteel lease agreement and property disposals which took place during the period. This decrease in property valuations is principally caused by the significant negative economic impact of the COVID-19 pandemic on rental reversions. In terms of IAS 40: Investment property and IFRS 13: Fair value measurement, Redefine’s investment properties are measured at fair value through profit or loss, using valuation inputs which are categorised as level 3 in the fair value hierarchy. There were no transfers between levels 1, 2 and 3 during the year.
The fair value of the investment in listed securities decreased by R12.9 million (HY20: R172.1 million decrease). Although the value of the investment in foreign unlisted securities remained flat, the fair value of the investment in foreign unlisted securities, Chariot Top Group B.V (Chariot) and Lango, decreased by R13.8 million (HY20: R44.6 million increase) due to the appreciation of the Rand.
The Group’s derivatives, which protect against adverse movements in interest and foreign exchange rates, were valued using the swap curve and forward pricing methods respectively, resulting in a decrease of R1.7 billion (HY20: R0.2 billion) in the Group’s liabilities.
6
Other fi nancial liabilities increased by R481.9 million due to the recognition of the exit fee payable on the Leicester Street disposal, this fee will be paid when the settlement of Swanston Street takes place. Other fi nancial assets increased by R43.5 million due to the rental guarantee estimated to be receivable from the Leicester Street disposal.
Interest-bearing borrowingsRedefi ne’s interest-bearing borrowings (net of cash and cash equivalents and including the mark-to-mark of cross-currency swaps) represented 44.3% (FY20: 47.9%) of the value of its property asset platform at 28 February 2021. The Group’s property asset platform comprises property, listed and unlisted shares, loans receivable, other fi nancial assets and interests in associates and joint ventures. The average cost of Rand-denominated funding is 8.7% (FY20: 8.1%), and interest rates are hedged on 90.6% (FY20: 84.8%) of local borrowings for an average period of 2.4 years (FY20: 2.8 years).
Including foreign currency debt and derivatives, the average cost of debt is 6.4% (FY20: 6.0%). Interest rates are hedged on 86.1% (FY20: 81.4%) of total borrowings for an average period of 2.3 years (FY20: 2.8 years). The interest cover ratio (which includes equity-accounted dividends and listed security income) is 2.4x (FY20: 2.6x).
Redefi ne had unutilised committed bank facilities of R4.3 billion (FY20: R2.6 billion) and cash on hand of R500.6 million (FY20: R232.1 million) at 28 February 2021, which provides assurance that the Group will be able to meet its short-term commitments.
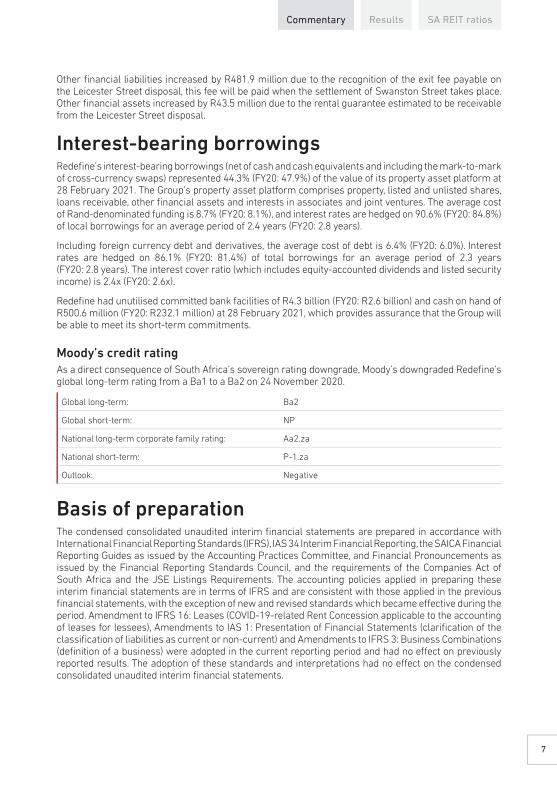
Moody’s credit ratingAs a direct consequence of South Africa’s sovereign rating downgrade, Moody’s downgraded Redefi ne’s global long-term rating from a Ba1 to a Ba2 on 24 November 2020.
Global long-term: Ba2
Global short-term: NP
National long-term corporate family rating: Aa2.za
National short-term: P-1.za
Outlook: Negative
Basis of preparationThe condensed consolidated unaudited interim fi nancial statements are prepared in accordance with International Financial Reporting Standards (IFRS), IAS 34 Interim Financial Reporting, the SAICA Financial Reporting Guides as issued by the Accounting Practices Committee, and Financial Pronouncements as issued by the Financial Reporting Standards Council, and the requirements of the Companies Act of South Africa and the JSE Listings Requirements. The accounting policies applied in preparing these interim fi nancial statements are in terms of IFRS and are consistent with those applied in the previous fi nancial statements, with the exception of new and revised standards which became eff ective during the period. Amendment to IFRS 16: Leases (COVID-19-related Rent Concession applicable to the accounting of leases for lessees), Amendments to IAS 1: Presentation of Financial Statements (clarifi cation of the classifi cation of liabilities as current or non-current) and Amendments to IFRS 3: Business Combinations (defi nition of a business) were adopted in the current reporting period and had no eff ect on previously reported results. The adoption of these standards and interpretations had no eff ect on the condensed consolidated unaudited interim fi nancial statements.
Results SA REIT ratiosCommentary
7
Significant judgement, estimates and assumptionsThe preparation of interim financial statements requires the use of accounting estimates which, by definition, may differ from actual results. Judgement also needs to be exercised in applying the Group’s accounting policies. Estimates and judgements are continually evaluated and are based on historical experience and other factors, including expectations of future events that are believed to be reasonable under the circumstances. The estimates and assumptions that have a significant risk of causing a material adjustment to the carrying amounts of assets and liabilities within the next financial period are set out below:
à Valuation of investment properties and properties under development;
à Valuation of investments in associates and joint ventures;
à Rental concessions;
à Expected credit losses;
à Valuation of the Insurance contract liability;
à Facilities and covenants;
à Significant influence and control assessment; and
à Dividend declaration.
Events after the reporting periodSale of interest in Respublica Student Living Proprietary Limited (RSL) and directly held local student accommodation properties
Redefine holds 53.4% of RSL’s issued ordinary shares (Repurchase shares) and directly owns Hatfield Square, Roscommon House and Yale Village (the Properties) (collectively, the Portfolio).
Redefine, RSL, Bridgehead Real Estate Fund Proprietary Limited and the Management Shareholders (collectively, the Parties) have concluded a suite of agreements to enter into an indivisible transaction with an effective date of 1 March 2021 in terms of which, inter alia, –
à RSL shall repurchase the Repurchase shares from Redefine for R150.5 million less the dividend which would have been declared for the period ended 28 February 2021;
à RSL shall purchase the Properties from Redefine for R934.5 million;
à Redefine shall advance to RSL a Vendor Loan for R280.0 million; and
à Redefine shall guarantee the earnings before interest, tax, depreciation and amortisation (EBITDA) generated by the Portfolio for the 12 months commencing on the effective date for a maximum amount of R50.0 million.
The transaction is subject to the usual conditions precedent applicable to transactions of this nature, finance and Competition Commission approval.
8
Acquisition of M1 Marki in PolandRedefi ne Europe B.V. (Redefi ne’s wholly-owned subsidiary) made an advance payment of €10 million (R183.0 million) in respect of the M1 Marki purchase consideration on 25 March 2021 following the fi nalisation of the agreement related to the third tranche of the acquisition by EPP of four properties from Chariot on 11 March 2021. The advance payment will accrue interest at a rate of 7% and will be paid quarterly.
Going concernThe directors have assessed the Group’s ability to continue as a going concern. The assessment includes solvency and liquidity tests which included, inter alia, a forecast of debt covenants such as the LTV and interest cover ratios. The liquidity test considers expected cash fl ows for the next 12 months including the anticipated proceeds from unconditional disposals and cash fl ows related to funding and development activities of the Group for the next 12 months. As at 28 February 2021, the Group had a substantial positive net asset value and a robust liquidity position with R4.3 billion (FY20: R2.6 billion) of committed undrawn access facilities and cash on hand of R500.6 million (FY20: R231.1 million).
The COVID-19 pandemic impacted and continues to impact the global economy signifi cantly. Measures, such as the prolonged and severe restrictions of movement imposed by governments, to reduce the spread of the virus and the consequential impact on demand for products and services and impact on people’s behaviour have negatively impacted economic performance and prospects globally. Internationally, the vaccination programme remains crucial for the global recovery and was launched in the European Union on 27 December 2020. Locally, the various government-imposed restrictions and slow vaccination roll-out could lead to further adverse economic impact. The COVID-19 pandemic primarily impacted the Group in the fi rst half of the 2021 fi nancial year as follows:
à further reduction of local investment property valuations which adversely aff ected the Group’s LTV ratio;
à stable valuations of the investment in foreign associate and joint venture driven by the roll-out of the vaccination program in Poland and the focus on logistics properties;
à dividends were withheld by EPP to bolster their own liquidity needs which adversely aff ected the Group’s earnings and liquidity;
à rental relief measures granted to tenants to support the sustainability of their businesses which adversely aff ected the Group’s earnings and liquidity; and
à the provision for credit losses increased in response to the heightened risk of tenants failing to meet their rental obligations which adversely impacted the Group’s earnings.
The following uncertainties were considered as part of the going concern assessment:
Access to liquidityStressed market conditions continue to dampen debt funders‘ risk appetite and may limit access to liquidity in the future. Proceeds from the sale of Leicester Street and the disposal of non-core properties totalling R4.0 billion were received during the period. Proceeds from the sale of Swanston Street are expected to be received in the second quarter of the 2022 fi nancial year.
Results SA REIT ratiosCommentary
9
Debt covenantsFinancial covenant (LTV and ICR) reporting is required by lenders within 90 days of each reporting period. To create additional headroom to absorb adverse LTV covenant triggers and to avoid a potential technical breach of our corporate LTV covenant as at 31 August 2020, the Group negotiated a temporary relaxation of the corporate LTV covenant. For the reporting periods ended 31 August 2020 to 28 February 2021, all funders agreed to the temporary relaxation of the LTV covenant limit from 50% to 55%. The minimum ICR covenant is 2x. There have been no debt covenant breaches to date, with the strictest LTV and ICR covenants indicating a headroom of 6.6% and 0.2x respectively. For the reporting periods ending 31 August 2021 and 28 February 2022 it is anticipated that the corporate LTV covenant will be below 50% and the ICR above 2x. All debt covenant projections are proactively monitored to manage and remedy any potential breaches. Refer to the Group LTV improvement plan and the SA REIT LTV for further detailed disclosures.
Profitability
Investment incomeEPP may continue to defer the payment of dividends for a period to preserve liquidity due to the continued uncertainty related to the battle between the virus and the encouraging roll-out of the vaccination programme in Poland.
Rental concessionsAdditional rental concessions may be provided to tenants as the impact of the COVID-19 pandemic persists, locally and beyond. Tenants‘ businesses may further be adversely impacted should the South African government reintroduce restrictions to mitigate against the risk of rising infections.
Provision for credit lossesThe provision for credit losses and write-off of unrecoverable amounts may increase as the adverse impact of the COVID-19 pandemic on tenants‘ businesses persists.
Change to business environmentThe acceleration of the adoption of technologies due to the COVID-19 pandemic, as well as potential changes in the demand for rentable space, particularly within the retail and office sectors, may impact the Group adversely.
Going concern conclusionThe directors have satisfied themselves that the Group is in a sound financial position and that it has access to sufficient liquidity to meet its foreseeable cash requirements. Considering the outcomes of the solvency and liquidity projections, the Group will be solvent and liquid, and the directors are confident in the ability of the Group to continue as a going concern and have no reason to believe that the Group will not be a going concern in the year ahead. The directors have therefore concluded that it is appropriate to adopt the going concern basis in preparing the consolidated interim financial statements.
Capital commitmentsCapital commitments outstanding amount to R0.6 billion (FY20: R1.0 billion). Future commitments will be funded by undrawn committed banking facilities, cash on hand and proceeds from capital recycling activities.
10

Change in directorate and company secretaryLeon Kok succeeded David Rice as Chief Operating Offi cer and Ntobeko Nyawo was appointed to the board as Chief Financial Offi cer with eff ect from 1 February 2021. The board wishes Leon and Ntobeko every success in their respective roles and looks forward to the benefi t of their contributions as Redefi ne embarks on the next phase of its journey to realise its vision to be the best SA REIT.
Bronwyn Baker resigned as company secretary of Redefi ne with eff ect from 31 March 2021, to pursue other interests. Thembekile Dube has been appointed as acting company secretary of Redefi ne with eff ect from 1 April 2021. The board of directors thanks Bronwyn for her contribution to the company and wishes her well in her future endeavours.
Dividend for the period 28 February 2021Having regard to the eff ects of the COVID-19 pandemic, its impact on Redefi ne’s business operations, liquidity and LTV ratio, and the extraordinary uncertainty of its future impact on the Company, the board, as a precautionary measure to provide the Company with additional fl exibility and bolster its liquidity, has resolved to defer its decision on the declaration of an interim dividend until the release of the results for the year ended 31 August 2021, which is expected during November 2021.
Subject to the liquidity and solvency test as required by the Companies Act at the time of the declaration of the dividend, it is anticipated that Redefi ne should be in a position to pay a dividend for the 2021 fi nancial year.
ProspectsAlthough subdued property fundamentals and low growth will remain a persistent theme in 2021 and beyond, the execution of our strategic priorities, by focusing on what matters most and putting our purpose at the heart of what we do, will position Redefi ne for the eventual upward cycle.
The outlook depends not just on the outcome of the battle between the virus and the roll-out of the vaccination programme to stimulate mobility – it also hinges on how eff ectively economic policies are deployed to limit lasting damage from this unprecedented crisis which is imperative to restoring much needed confi dence in the South African economy, which is the cheapest form of economic stimulus.
COVID-19 pandemic has provided us with a unique opportunity to reset every aspect of what we do – a process not confi ned to shifting our thinking to the evolving uses of real estate – but also to adopt enabling technologies, harness the acceleration of digital platform, embrace the need for inclusivity and adapt to the changing workplace and very importantly address the high levels of stress, disconnection, burn out, mental illness and economic injury that are hallmarks of the tail end of the COVID-19 pandemic.
Due to the evolving and highly uncertain environment, we are not in a position to provide guidance on distributable income per share for the 2021 fi nancial year.
To see us through the cycle and make strategic choices today that build tomorrow, we will remain focused on what matters most through collaboration, innovation and diff erentiation.
The directors of Redefi ne take full responsibility for the preparation of this report and that the fi nancial information provided has been correctly extracted from the underlying consolidated interim fi nancial statements. Ntobeko Nyawo, CA(SA), Redefi ne’s Chief fi nancial offi cer, was responsible for supervising the preparation of these condensed consolidated interim fi nancial statements. These condensed consolidated interim fi nancial statements for the period ended 28 February 2021 have not been reviewed or reported on by Redefi ne’s independent external auditors.
17 May 2021
Redefi ne Properties Limited
Results SA REIT ratiosCommentary
11

12

Results2
Knowledge Park III, Century City
Commentary SA REIT ratiosResults
13
Restated*Unaudited Unaudited Audited
28 February 29 February 31 AugustFigures in R‘000 2021 2020 2020
Revenue
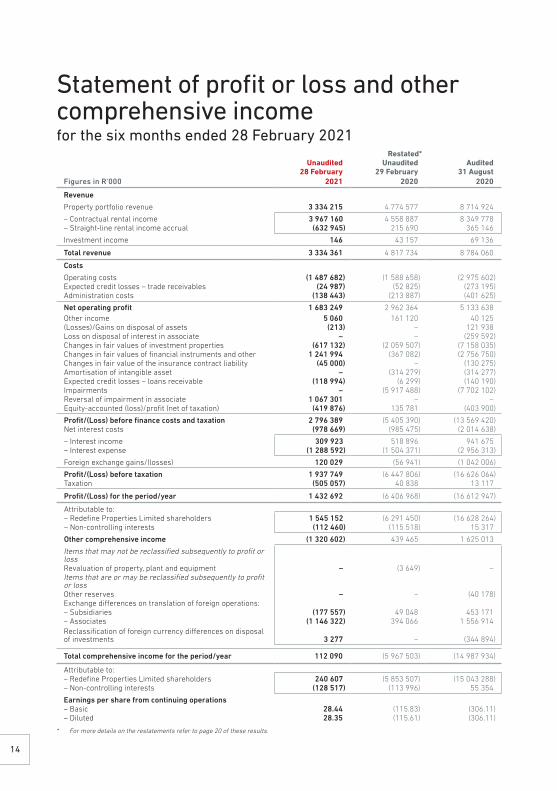
Property portfolio revenue 3 334 215 4 774 577 8 714 924
– Contractual rental income 3 967 160 4 558 887 8 349 778– Straight-line rental income accrual (632 945) 215 690 365 146
Investment income 146 43 157 69 136
Total revenue 3 334 361 4 817 734 8 784 060
Costs
Operating costs (1 487 682) (1 588 658) (2 975 602)Expected credit losses – trade receivables (24 987) (52 825) (273 195)Administration costs (138 443) (213 887) (401 625)
Net operating profit 1 683 249 2 962 364 5 133 638Other income 5 060 161 120 40 125(Losses)/Gains on disposal of assets (213) – 121 938Loss on disposal of interest in associate – – (259 592)Changes in fair values of investment properties (617 132) (2 059 507) (7 158 035)Changes in fair values of financial instruments and other 1 241 994 (367 082) (2 756 750)Changes in fair value of the insurance contract liability (45 000) – (130 275)Amortisation of intangible asset – (314 279) (314 277)Expected credit losses – loans receivable (118 994) (6 299) (140 190)Impairments – (5 917 488) (7 702 102)Reversal of impairment in associate 1 067 301 – –Equity-accounted (loss)/profit (net of taxation) (419 876) 135 781 (403 900)
Profit/(Loss) before finance costs and taxation 2 796 389 (5 405 390) (13 569 420)Net interest costs (978 669) (985 475) (2 014 638)
– Interest income 309 923 518 896 941 675– Interest expense (1 288 592) (1 504 371) (2 956 313)
Foreign exchange gains/(losses) 120 029 (56 941) (1 042 006)
Profit/(Loss) before taxation 1 937 749 (6 447 806) (16 626 064)Taxation (505 057) 40 838 13 117
Profit/(Loss) for the period/year 1 432 692 (6 406 968) (16 612 947)
Attributable to:– Redefine Properties Limited shareholders 1 545 152 (6 291 450) (16 628 264)– Non-controlling interests (112 460) (115 518) 15 317
Other comprehensive income (1 320 602) 439 465 1 625 013
Items that may not be reclassified subsequently to profit or lossRevaluation of property, plant and equipment – (3 649) –Items that are or may be reclassified subsequently to profit or lossOther reserves – – (40 178)Exchange differences on translation of foreign operations:– Subsidiaries (177 557) 49 048 453 171– Associates (1 146 322) 394 066 1 556 914Reclassification of foreign currency differences on disposal of investments 3 277 – (344 894)
Total comprehensive income for the period/year 112 090 (5 967 503) (14 987 934)
Attributable to:– Redefine Properties Limited shareholders 240 607 (5 853 507) (15 043 288)– Non-controlling interests (128 517) (113 996) 55 354
Earnings per share from continuing operations– Basic 28.44 (115.83) (306.11)– Diluted 28.35 (115.61) (306.11)
* For more details on the restatements refer to page 20 of these results.
Statement of profit or loss and other comprehensive incomefor the six months ended 28 February 2021
14
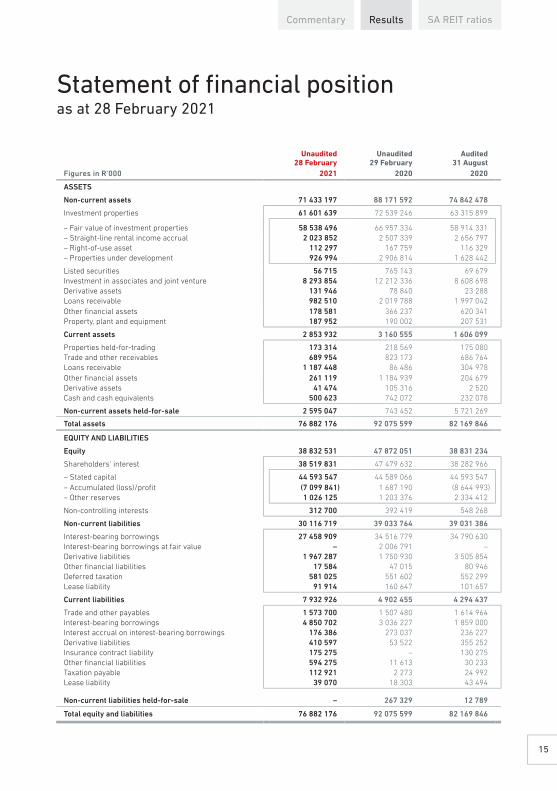
Statement of fi nancial positionas at 28 February 2021
Unaudited Unaudited Audited28 February 29 February 31 August
Figures in R‘000 2021 2020 2020
ASSETS
Non-current assets 71 433 197 88 171 592 74 842 478
Investment properties 61 601 639 72 539 246 63 315 899
– Fair value of investment properties 58 538 496 66 957 334 58 914 331– Straight-line rental income accrual 2 023 852 2 507 339 2 656 797– Right-of-use asset 112 297 167 759 116 329– Properties under development 926 994 2 906 814 1 628 442
Listed securities 56 715 765 143 69 679Investment in associates and joint venture 8 293 854 12 212 336 8 608 698Derivative assets 131 946 78 840 23 288Loans receivable 982 510 2 019 788 1 997 042Other fi nancial assets 178 581 366 237 620 341Property, plant and equipment 187 952 190 002 207 531
Current assets 2 853 932 3 160 555 1 606 099
Properties held-for-trading 173 314 218 569 175 080Trade and other receivables 689 954 823 173 686 764Loans receivable 1 187 448 86 486 304 978Other fi nancial assets 261 119 1 184 939 204 679Derivative assets 41 474 105 316 2 520Cash and cash equivalents 500 623 742 072 232 078
Non-current assets held-for-sale 2 595 047 743 452 5 721 269
Total assets 76 882 176 92 075 599 82 169 846
EQUITY AND LIABILITIES
Equity 38 832 531 47 872 051 38 831 234
Shareholders‘ interest 38 519 831 47 479 632 38 282 966
– Stated capital 44 593 547 44 589 066 44 593 547– Accumulated (loss)/profi t (7 099 841) 1 687 190 (8 644 993)– Other reserves 1 026 125 1 203 376 2 334 412
Non-controlling interests 312 700 392 419 548 268
Non-current liabilities 30 116 719 39 033 764 39 031 386
Interest-bearing borrowings 27 458 909 34 516 779 34 790 630Interest-bearing borrowings at fair value – 2 006 791 –Derivative liabilities 1 967 287 1 750 930 3 505 854Other fi nancial liabilities 17 584 47 015 80 946Deferred taxation 581 025 551 602 552 299Lease liability 91 914 160 647 101 657
Current liabilities 7 932 926 4 902 455 4 294 437
Trade and other payables 1 573 700 1 507 480 1 614 964Interest-bearing borrowings 4 850 702 3 036 227 1 859 000Interest accrual on interest-bearing borrowings 176 386 273 037 236 227Derivative liabilities 410 597 53 522 355 252Insurance contract liability 175 275 – 130 275Other fi nancial liabilities 594 275 11 613 30 233Taxation payable 112 921 2 273 24 992Lease liability 39 070 18 303 43 494
Non-current liabilities held-for-sale – 267 329 12 789
Total equity and liabilities 76 882 176 92 075 599 82 169 846
Commentary SA REIT ratiosResults
15
Figures in R‘000s Stated capitalAccumulated
(losses)/profits
Foreign currency
translation reserve
Share-based payment reserve
Share of associates‘
reservesShareholders‘
interest
Non-controlling interests
(NCI)Total
equity
Balance as at 31 August 2019 44 589 066 10 597 777 668 864 57 179 47 424 55 960 310 609 166 56 569 476
Total comprehensive income for the period – (6 295 099) 441 592 – – (5 853 507) (113 996) (5 967 503)Loss for the period – (6 291 450) – – – (6 291 450) (115 518) (6 406 968)Other comprehensive income for the period – (3 649) 441 592 – – 437 943 1 522 439 465Transactions with owners (contributions and distributions) – (2 615 488) – (30 582) 18 899 (2 627 171) (7 046) (2 634 217)Dividends – (2 614 319) – – – (2 614 319) (7 046) (2 621 365)Recognition of share-based payments – (1 169) – (30 582) – (31 751) – (31 751)Share of post-acquisition change in net assets of associate – – – – 18 899 18 899 – 18 899Transactions with owners (changes in ownership interests) – – – – – – (95 705) (95 705)Disposal of subsidiary with NCI – – – – – – (96 582) (96 582)Change in ownership of subsidiary with NCI – – – – – – 877 877
Balance as at 29 February 2020 44 589 066 1 687 190 1 110 456 26 597 66 323 47 479 632 392 419 47 872 051
Total comprehensive income for the period – (10 333 165) 1 183 562 – (40 178) (9 189 781) 169 349 (9 020 432)Loss for the period – (10 336 814) – – – (10 336 814) 130 835 (10 205 979)Other comprehensive income for the period – 3 649 1 183 562 – (40 178) 1 147 033 38 514 1 185 547Transactions with owners (contributions and distributions) 4 481 982 – 6 513 (18 861) (6 885) (12 621) (19 506)Issue of ordinary shares 4 481 – – – – 4 481 889 5 370Dividends – – – – – – (13 510) (13 510)Recognition of share-based payments – 982 – 6 513 – 7 495 – 7 495Share of post-acquisition change in net assets of associates – – – – (18 861) (18 861) – (18 861)Transactions with owners (changes in ownership interests) – – – – – – (879) (879)Change in ownership of subsidiary with NCI – – – – – – (879) (879)
Balance as at 31 August 2020 44 593 547 (8 644 993) 2 294 018 33 110 7 284 38 282 966 548 268 38 831 234
Total comprehensive income for the year – 1 545 152 (1 304 545) – – 240 607 (128 517) 112 090Profit for the period – 1 545 152 – – – 1 545 152 (112 460) 1 432 692Other comprehensive loss for the period – – (1 304 545) – – (1 304 545) (16 057) (1 320 602)Transactions with owners (contributions and distributions) – – – (1 563) (2 179) (3 742) (107 840) (111 582)Dividends – – – – – – (107 840) (107 840)Recognition of share-based payments – – – (1 563) – (1 563) – (1 563)Share of post-acquisition change in net assets of associates – – – – (2 179) (2 179) – (2 179)Transactions with owners (changes in ownership interests) – – – – – – 789 789Disposal of subsidiary with NCI – – – – – – 789 789
Balance as at 28 February 2021 44 593 547 (7 099 841) 989 473 31 547 5 105 38 519 831 312 700 38 832 531
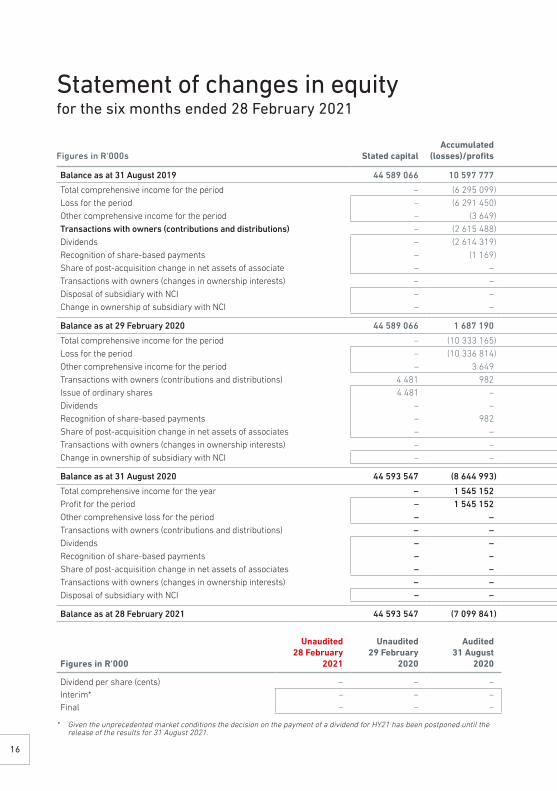
Statement of changes in equityfor the six months ended 28 February 2021
Figures in R‘000
Unaudited28 February
2021
Unaudited29 February
2020
Audited31 August
2020
Dividend per share (cents) – – –Interim* – – –Final – – –
* Given the unprecedented market conditions the decision on the payment of a dividend for HY21 has been postponed until the release of the results for 31 August 2021.
16

Figures in R‘000s Stated capitalAccumulated
(losses)/profi ts
Foreign currency
translation reserve
Share-based payment reserve
Share of associates‘
reservesShareholders‘
interest
Non-controlling interests
(NCI)Total
equity
Balance as at 31 August 2019 44 589 066 10 597 777 668 864 57 179 47 424 55 960 310 609 166 56 569 476
Total comprehensive income for the period – (6 295 099) 441 592 – – (5 853 507) (113 996) (5 967 503)Loss for the period – (6 291 450) – – – (6 291 450) (115 518) (6 406 968)Other comprehensive income for the period – (3 649) 441 592 – – 437 943 1 522 439 465Transactions with owners (contributions and distributions) – (2 615 488) – (30 582) 18 899 (2 627 171) (7 046) (2 634 217)Dividends – (2 614 319) – – – (2 614 319) (7 046) (2 621 365)Recognition of share-based payments – (1 169) – (30 582) – (31 751) – (31 751)Share of post-acquisition change in net assets of associate – – – – 18 899 18 899 – 18 899Transactions with owners (changes in ownership interests) – – – – – – (95 705) (95 705)Disposal of subsidiary with NCI – – – – – – (96 582) (96 582)Change in ownership of subsidiary with NCI – – – – – – 877 877
Balance as at 29 February 2020 44 589 066 1 687 190 1 110 456 26 597 66 323 47 479 632 392 419 47 872 051
Total comprehensive income for the period – (10 333 165) 1 183 562 – (40 178) (9 189 781) 169 349 (9 020 432)Loss for the period – (10 336 814) – – – (10 336 814) 130 835 (10 205 979)Other comprehensive income for the period – 3 649 1 183 562 – (40 178) 1 147 033 38 514 1 185 547Transactions with owners (contributions and distributions) 4 481 982 – 6 513 (18 861) (6 885) (12 621) (19 506)Issue of ordinary shares 4 481 – – – – 4 481 889 5 370Dividends – – – – – – (13 510) (13 510)Recognition of share-based payments – 982 – 6 513 – 7 495 – 7 495Share of post-acquisition change in net assets of associates – – – – (18 861) (18 861) – (18 861)Transactions with owners (changes in ownership interests) – – – – – – (879) (879)Change in ownership of subsidiary with NCI – – – – – – (879) (879)
Balance as at 31 August 2020 44 593 547 (8 644 993) 2 294 018 33 110 7 284 38 282 966 548 268 38 831 234
Total comprehensive income for the year – 1 545 152 (1 304 545) – – 240 607 (128 517) 112 090Profi t for the period – 1 545 152 – – – 1 545 152 (112 460) 1 432 692Other comprehensive loss for the period – – (1 304 545) – – (1 304 545) (16 057) (1 320 602)Transactions with owners (contributions and distributions) – – – (1 563) (2 179) (3 742) (107 840) (111 582)Dividends – – – – – – (107 840) (107 840)Recognition of share-based payments – – – (1 563) – (1 563) – (1 563)Share of post-acquisition change in net assets of associates – – – – (2 179) (2 179) – (2 179)Transactions with owners (changes in ownership interests) – – – – – – 789 789Disposal of subsidiary with NCI – – – – – – 789 789
Balance as at 28 February 2021 44 593 547 (7 099 841) 989 473 31 547 5 105 38 519 831 312 700 38 832 531
Commentary SA REIT ratiosResults
17
Unaudited Unaudited Audited28 February 29 February 31 August
Figures in R‘000 2021 2020 2020
CASH FLOWS FROM OPERATING ACTIVITIESCash generated from operations 2 338 940 2 750 159 4 333 031Interest received 199 047 477 461 822 902Interest paid (1 250 458) (1 582 773) (3 000 846)Taxation paid (393 492) (30 466) (29 178)Dividends and interest received from associatesand joint venture 26 925 520 692 543 408
Net cash inflow from operating activities 920 962 2 135 073 2 669 317
CASH FLOWS FROM INVESTING ACTIVITIESAcquisition and development of investment properties (415 978) (1 895 970) (2 838 774)Acquisition of property, plant and equipment (2 529) (7 774) (14 582)Acquisition of other financial assets – – (3 224)Disposal of a controlling interest in a subsidiary(net of cash disposed) – 248 360 248 360Proceeds on deemed disposal of subsidiary – – 1 105 279Investment in joint venture (213 156) – (196 657)Reclassification of subsidiary to held for sale – – (12 645)Proceeds on disposal of investment properties and non-current assets held-for-sale 3 995 293 718 234 905 475Proceeds on the disposal of property, plant and equipment 95 – –Proceeds on disposal of shares in associate – – 2 262 265Proceeds from other financial assets 69 508 47 228 69 227Other financial liabilities raised 14 457 – –Other financial liabilities repaid (10 388) – –Loans receivables repaid 269 809 162 995 250 642Loans receivables advanced (223 000) (114 855) (327 632)
Net cash inflow/(outflow) from investing activities 3 484 111 (841 782) 1 447 734
CASH FLOWS FROM FINANCING ACTIVITIESDividends paid – (2 614 319) (2 614 319)Shares issued to non-controlling interests – 877 889Dividends paid to non-controlling interests (107 840) (7 046) (20 556)Loans repaid from non-controlling interests – 826 829Loans advanced to non-controlling interests – (257) (257)
Principal elements of lease payments (24 092) (11 982) (51 547)Interest-bearing borrowings at fair value repaid – – (2 812 775)Interest-bearing borrowings raised 2 700 000 5 097 778 5 187 856Interest-bearing borrowings repaid (6 721 222) (3 488 419) (3 913 886)
Net cash outflow from financing activities (4 153 154) (1 022 542) (4 223 766)
Net increase/(decrease) in cash and cash equivalents 251 919 270 749 (106 715)Cash and cash equivalents at the beginning of the year 232 078 406 694 406 694Effect of foreign currency exchange fluctuations 16 626 64 629 (67 900)
Cash and cash equivalents at end of period/year 500 623 742 072 232 078
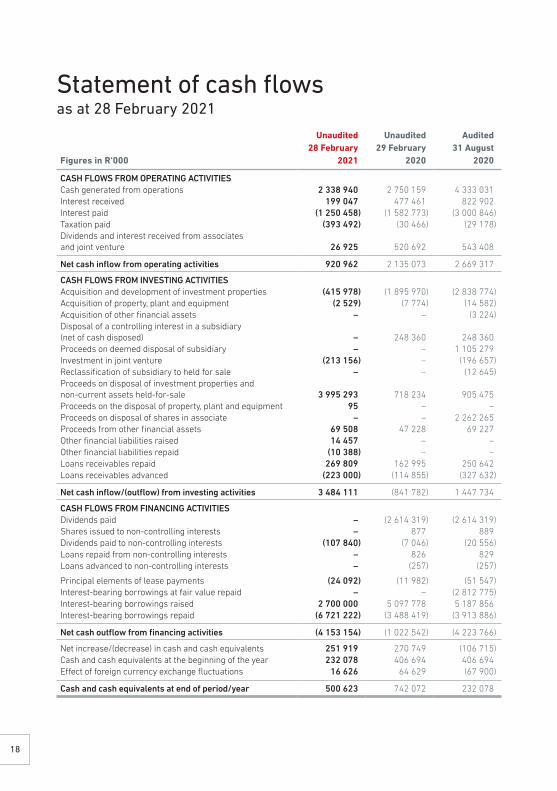
Statement of cash flowsas at 28 February 2021
18
Unaudited Unaudited Audited28 February 29 February 31 August
Figures in R‘000 2021 2020 2020
EARNINGS AND HEADLINE EARNINGS
Reconciliation of basic earnings to headline earningsProfi t/(loss) for the period attributable to Redefi ne shareholders 1 545 152 (6 291 450) (16 628 264)Change in fair value of properties (net of NCI) 695 908 1 991 204 7 164 545
– Change in fair value of properties 617 132 2 059 507 7 158 035– Non-controlling interest 78 776 (68 303) 6 510
Loss/(profi t) on sale of subsidiary 326 (139 855) (139 855)Loss on disposal of interest in associates – – 259 592Profi t on dilution of ownership interest in an associate – – (1 778)Adjustment of measurements, included in equity-accounted earnings of associates (net of tax) (847 700) (258 380) (1 376 053)
– Adjustment of measurements, included in equity-accounted earnings of associates (786 305) (376 666) (1 319 903)
– Tax adjustment (61 395) 118 286 (56 150)
Revaluation of property, plant and equipment 14 189 3 649 28 625Impairments (including expected credit losses – loans receivable) (948 307) 5 923 787 7 842 292Insurance proceeds received (265) – (8 729)
Headline earnings attributable to Redefi ne shareholders 459 303 1 228 955 (2 859 625)
Diluted earnings attributable to Redefi ne shareholders 1 543 976 (6 286 723) (16 624 131)
Profi t/(loss) for the period attributable to Redefi ne shareholders 1 545 152 (6 291 450) (16 628 264)Potential dilutive eff ect of share incentive schemes (1 176) 4 727 4 133
Diluted headline earnings attributable to Redefi ne shareholders 458 127 1 233 682 (2 855 492)
Headline earnings attributable to Redefi ne shareholders 459 303 1 228 955 (2 859 625)Potential dilutive eff ect of share incentive schemes (1 176) 4 727 4 133
Actual number of shares in issue (‘000)* 5 432 630 5 431 786 5 432 630Weighted average number of shares in issue (‘000)* 5 432 630 5 431 786 5 432 191Diluted weighted average number of shares in issue (‘000)* 5 446 291 5 438 326 5 442 415
Weighted average number of shares in issue (‘000)* 5 432 630 5 431 786 5 432 191Potential dilutive eff ect of share incentive schemes (‘000)** 13 661 6 540 10 224
Diluted earnings per share and diluted headline earnings per share are calculated considering the potential dilution that could occur if all share scheme shares vested. The number of shares outstanding is adjusted to show the potential dilution if all share schemes were settled in Redefi ne Properties Limited shares.
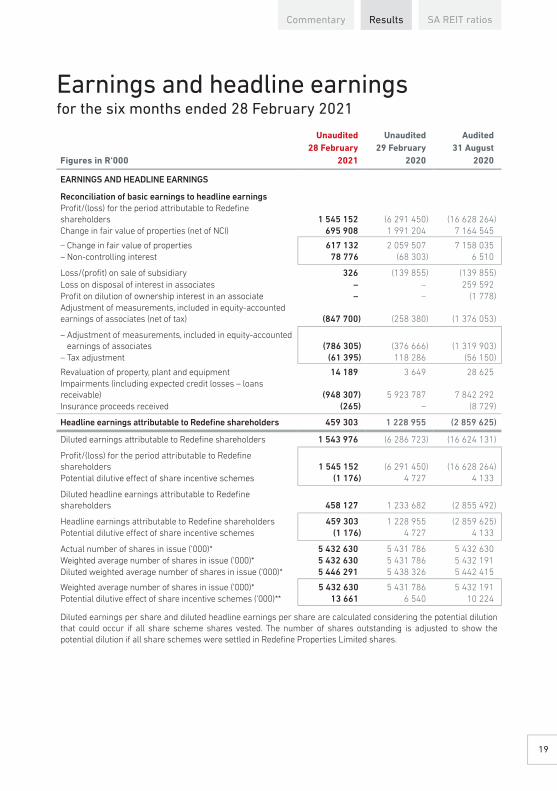
Earnings and headline earningsfor the six months ended 28 February 2021
Commentary SA REIT ratiosResults
19
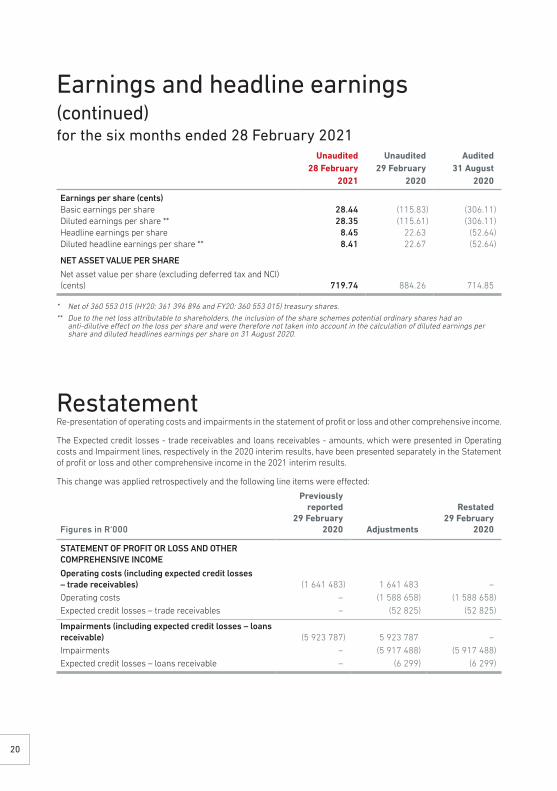
RestatementRe-presentation of operating costs and impairments in the statement of profit or loss and other comprehensive income.
The Expected credit losses - trade receivables and loans receivables - amounts, which were presented in Operating costs and Impairment lines, respectively in the 2020 interim results, have been presented separately in the Statement of profit or loss and other comprehensive income in the 2021 interim results.
This change was applied retrospectively and the following line items were effected:
Figures in R‘000
Previouslyreported
29 February2020 Adjustments
Restated29 February
2020
STATEMENT OF PROFIT OR LOSS AND OTHER COMPREHENSIVE INCOME
Operating costs (including expected credit losses – trade receivables) (1 641 483) 1 641 483 –Operating costs – (1 588 658) (1 588 658)Expected credit losses – trade receivables – (52 825) (52 825)
Impairments (including expected credit losses – loans receivable) (5 923 787) 5 923 787 –Impairments – (5 917 488) (5 917 488)Expected credit losses – loans receivable – (6 299) (6 299)
Unaudited Unaudited Audited28 February 29 February 31 August
2021 2020 2020
Earnings per share (cents)Basic earnings per share 28.44 (115.83) (306.11)Diluted earnings per share ** 28.35 (115.61) (306.11)Headline earnings per share 8.45 22.63 (52.64)Diluted headline earnings per share ** 8.41 22.67 (52.64)
NET ASSET VALUE PER SHARE
Net asset value per share (excluding deferred tax and NCI) (cents) 719.74 884.26 714.85
* Net of 360 553 015 (HY20: 361 396 896 and FY20: 360 553 015) treasury shares.
** Due to the net loss attributable to shareholders, the inclusion of the share schemes potential ordinary shares had an anti-dilutive effect on the loss per share and were therefore not taken into account in the calculation of diluted earnings per share and diluted headlines earnings per share on 31 August 2020.
Earnings and headline earnings (continued)for the six months ended 28 February 2021
20
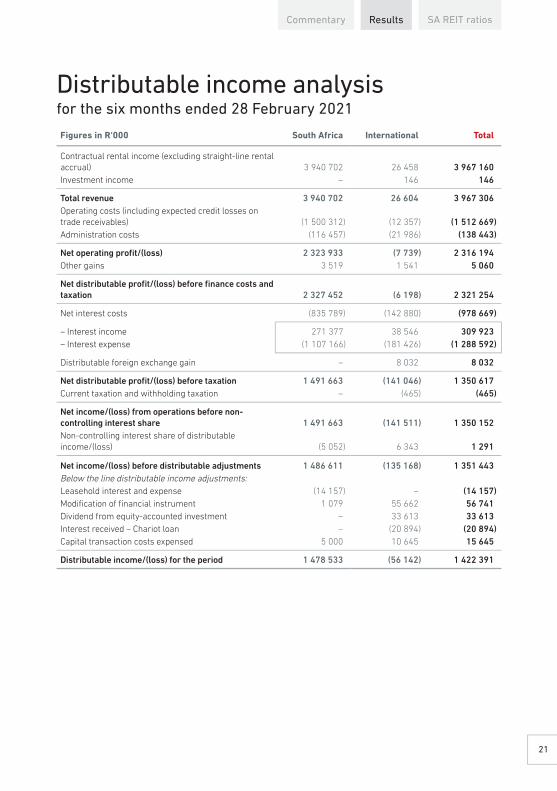
Figures in R‘000 South Africa International Total
Contractual rental income (excluding straight-line rental accrual) 3 940 702 26 458 3 967 160Investment income – 146 146
Total revenue 3 940 702 26 604 3 967 306Operating costs (including expected credit losses on trade receivables) (1 500 312) (12 357) (1 512 669)Administration costs (116 457) (21 986) (138 443)
Net operating profi t/(loss) 2 323 933 (7 739) 2 316 194Other gains 3 519 1 541 5 060
Net distributable profi t/(loss) before fi nance costs and taxation 2 327 452 (6 198) 2 321 254
Net interest costs (835 789) (142 880) (978 669)
– Interest income 271 377 38 546 309 923– Interest expense (1 107 166) (181 426) (1 288 592)
Distributable foreign exchange gain – 8 032 8 032
Net distributable profi t/(loss) before taxation 1 491 663 (141 046) 1 350 617Current taxation and withholding taxation – (465) (465)
Net income/(loss) from operations before non-controlling interest share 1 491 663 (141 511) 1 350 152Non-controlling interest share of distributable income/(loss) (5 052) 6 343 1 291
Net income/(loss) before distributable adjustments 1 486 611 (135 168) 1 351 443Below the line distributable income adjustments:Leasehold interest and expense (14 157) – (14 157)Modifi cation of fi nancial instrument 1 079 55 662 56 741Dividend from equity-accounted investment – 33 613 33 613Interest received – Chariot loan – (20 894) (20 894)Capital transaction costs expensed 5 000 10 645 15 645
Distributable income/(loss) for the period 1 478 533 (56 142) 1 422 391
Distributable income analysisfor the six months ended 28 February 2021
Commentary SA REIT ratiosResults
21
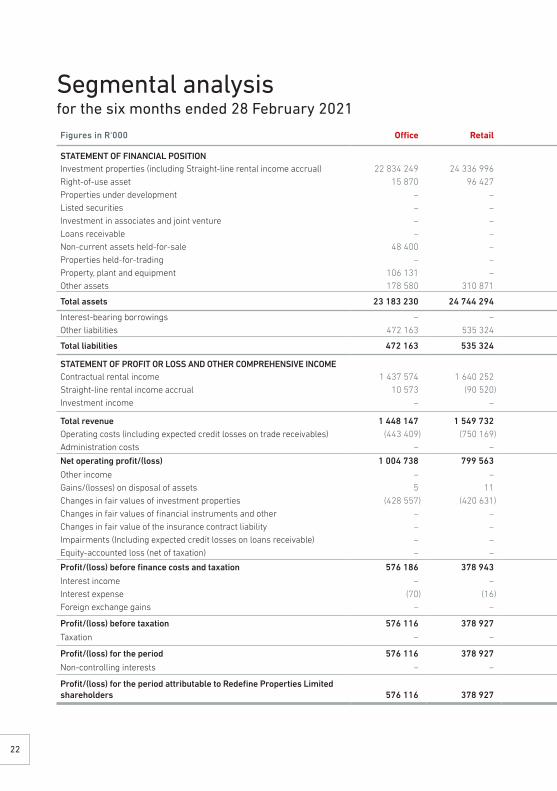
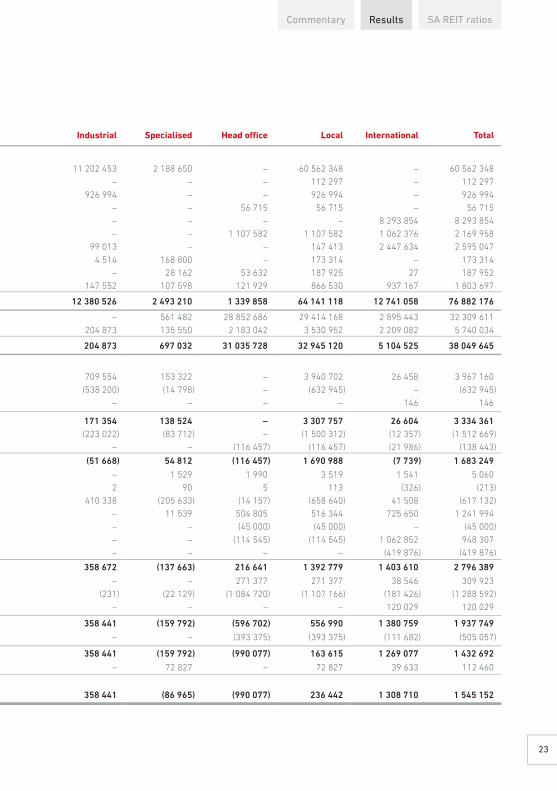
Segmental analysisfor the six months ended 28 February 2021
Figures in R‘000 Office Retail Industrial Specialised Head office Local International Total
STATEMENT OF FINANCIAL POSITIONInvestment properties (including Straight-line rental income accrual) 22 834 249 24 336 996 11 202 453 2 188 650 – 60 562 348 – 60 562 348Right-of-use asset 15 870 96 427 – – – 112 297 – 112 297Properties under development – – 926 994 – – 926 994 – 926 994Listed securities – – – – 56 715 56 715 – 56 715Investment in associates and joint venture – – – – – – 8 293 854 8 293 854Loans receivable – – – – 1 107 582 1 107 582 1 062 376 2 169 958Non-current assets held-for-sale 48 400 – 99 013 – – 147 413 2 447 634 2 595 047Properties held-for-trading – – 4 514 168 800 – 173 314 – 173 314Property, plant and equipment 106 131 – – 28 162 53 632 187 925 27 187 952Other assets 178 580 310 871 147 552 107 598 121 929 866 530 937 167 1 803 697
Total assets 23 183 230 24 744 294 12 380 526 2 493 210 1 339 858 64 141 118 12 741 058 76 882 176
Interest-bearing borrowings – – – 561 482 28 852 686 29 414 168 2 895 443 32 309 611Other liabilities 472 163 535 324 204 873 135 550 2 183 042 3 530 952 2 209 082 5 740 034
Total liabilities 472 163 535 324 204 873 697 032 31 035 728 32 945 120 5 104 525 38 049 645
STATEMENT OF PROFIT OR LOSS AND OTHER COMPREHENSIVE INCOMEContractual rental income 1 437 574 1 640 252 709 554 153 322 – 3 940 702 26 458 3 967 160Straight-line rental income accrual 10 573 (90 520) (538 200) (14 798) – (632 945) – (632 945)Investment income – – – – – – 146 146
Total revenue 1 448 147 1 549 732 171 354 138 524 – 3 307 757 26 604 3 334 361Operating costs (including expected credit losses on trade receivables) (443 409) (750 169) (223 022) (83 712) – (1 500 312) (12 357) (1 512 669)Administration costs – – – – (116 457) (116 457) (21 986) (138 443)
Net operating profit/(loss) 1 004 738 799 563 (51 668) 54 812 (116 457) 1 690 988 (7 739) 1 683 249
Other income – – – 1 529 1 990 3 519 1 541 5 060Gains/(losses) on disposal of assets 5 11 2 90 5 113 (326) (213)Changes in fair values of investment properties (428 557) (420 631) 410 338 (205 633) (14 157) (658 640) 41 508 (617 132)Changes in fair values of financial instruments and other – – – 11 539 504 805 516 344 725 650 1 241 994Changes in fair value of the insurance contract liability – – – – (45 000) (45 000) – (45 000)Impairments (Including expected credit losses on loans receivable) – – – – (114 545) (114 545) 1 062 852 948 307Equity-accounted loss (net of taxation) – – – – – – (419 876) (419 876)
Profit/(loss) before finance costs and taxation 576 186 378 943 358 672 (137 663) 216 641 1 392 779 1 403 610 2 796 389
Interest income – – – – 271 377 271 377 38 546 309 923Interest expense (70) (16) (231) (22 129) (1 084 720) (1 107 166) (181 426) (1 288 592)Foreign exchange gains – – – – – – 120 029 120 029
Profit/(loss) before taxation 576 116 378 927 358 441 (159 792) (596 702) 556 990 1 380 759 1 937 749
Taxation – – – – (393 375) (393 375) (111 682) (505 057)
Profit/(loss) for the period 576 116 378 927 358 441 (159 792) (990 077) 163 615 1 269 077 1 432 692
Non-controlling interests – – – 72 827 – 72 827 39 633 112 460
Profit/(loss) for the period attributable to Redefine Properties Limited shareholders 576 116 378 927 358 441 (86 965) (990 077) 236 442 1 308 710 1 545 152
22
Figures in R‘000 Offi ce Retail Industrial Specialised Head offi ce Local International Total
STATEMENT OF FINANCIAL POSITIONInvestment properties (including Straight-line rental income accrual) 22 834 249 24 336 996 11 202 453 2 188 650 – 60 562 348 – 60 562 348Right-of-use asset 15 870 96 427 – – – 112 297 – 112 297Properties under development – – 926 994 – – 926 994 – 926 994Listed securities – – – – 56 715 56 715 – 56 715Investment in associates and joint venture – – – – – – 8 293 854 8 293 854Loans receivable – – – – 1 107 582 1 107 582 1 062 376 2 169 958Non-current assets held-for-sale 48 400 – 99 013 – – 147 413 2 447 634 2 595 047Properties held-for-trading – – 4 514 168 800 – 173 314 – 173 314Property, plant and equipment 106 131 – – 28 162 53 632 187 925 27 187 952Other assets 178 580 310 871 147 552 107 598 121 929 866 530 937 167 1 803 697
Total assets 23 183 230 24 744 294 12 380 526 2 493 210 1 339 858 64 141 118 12 741 058 76 882 176
Interest-bearing borrowings – – – 561 482 28 852 686 29 414 168 2 895 443 32 309 611Other liabilities 472 163 535 324 204 873 135 550 2 183 042 3 530 952 2 209 082 5 740 034
Total liabilities 472 163 535 324 204 873 697 032 31 035 728 32 945 120 5 104 525 38 049 645
STATEMENT OF PROFIT OR LOSS AND OTHER COMPREHENSIVE INCOMEContractual rental income 1 437 574 1 640 252 709 554 153 322 – 3 940 702 26 458 3 967 160Straight-line rental income accrual 10 573 (90 520) (538 200) (14 798) – (632 945) – (632 945)Investment income – – – – – – 146 146
Total revenue 1 448 147 1 549 732 171 354 138 524 – 3 307 757 26 604 3 334 361Operating costs (including expected credit losses on trade receivables) (443 409) (750 169) (223 022) (83 712) – (1 500 312) (12 357) (1 512 669)Administration costs – – – – (116 457) (116 457) (21 986) (138 443)
Net operating profi t/(loss) 1 004 738 799 563 (51 668) 54 812 (116 457) 1 690 988 (7 739) 1 683 249
Other income – – – 1 529 1 990 3 519 1 541 5 060Gains/(losses) on disposal of assets 5 11 2 90 5 113 (326) (213)Changes in fair values of investment properties (428 557) (420 631) 410 338 (205 633) (14 157) (658 640) 41 508 (617 132)Changes in fair values of fi nancial instruments and other – – – 11 539 504 805 516 344 725 650 1 241 994Changes in fair value of the insurance contract liability – – – – (45 000) (45 000) – (45 000)Impairments (Including expected credit losses on loans receivable) – – – – (114 545) (114 545) 1 062 852 948 307Equity-accounted loss (net of taxation) – – – – – – (419 876) (419 876)
Profi t/(loss) before fi nance costs and taxation 576 186 378 943 358 672 (137 663) 216 641 1 392 779 1 403 610 2 796 389
Interest income – – – – 271 377 271 377 38 546 309 923Interest expense (70) (16) (231) (22 129) (1 084 720) (1 107 166) (181 426) (1 288 592)Foreign exchange gains – – – – – – 120 029 120 029
Profi t/(loss) before taxation 576 116 378 927 358 441 (159 792) (596 702) 556 990 1 380 759 1 937 749
Taxation – – – – (393 375) (393 375) (111 682) (505 057)
Profi t/(loss) for the period 576 116 378 927 358 441 (159 792) (990 077) 163 615 1 269 077 1 432 692
Non-controlling interests – – – 72 827 – 72 827 39 633 112 460
Profi t/(loss) for the period attributable to Redefi ne Properties Limited shareholders 576 116 378 927 358 441 (86 965) (990 077) 236 442 1 308 710 1 545 152
Commentary SA REIT ratiosResults
23
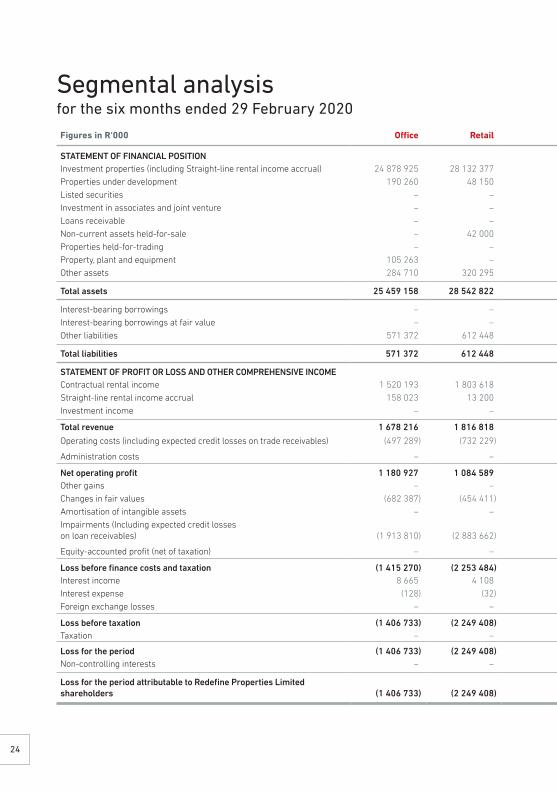
Segmental analysisfor the six months ended 29 February 2020
Figures in R‘000 Office Retail Industrial Specialised Head office Local International Total
STATEMENT OF FINANCIAL POSITIONInvestment properties (including Straight-line rental income accrual) 24 878 925 28 132 377 12 331 164 2 424 959 – 67 767 425 1 865 007 69 632 432Properties under development 190 260 48 150 1 363 791 – – 1 602 201 1 304 613 2 906 814Listed securities – – – – 68 058 68 058 697 085 765 143Investment in associates and joint venture – – – – – – 12 212 336 12 212 336Loans receivable – – – – 1 299 087 1 299 087 807 187 2 106 274Non-current assets held-for-sale – 42 000 31 604 – – 73 604 669 848 743 452Properties held-for-trading – – 9 649 208 920 – 218 569 – 218 569Property, plant and equipment 105 263 – – 29 137 52 021 186 421 3 581 190 002Other assets 284 710 320 295 127 898 102 781 219 787 1 055 471 2 245 106 3 300 577
Total assets 25 459 158 28 542 822 13 864 106 2 765 797 1 638 953 72 270 836 19 804 763 92 075 599
Interest-bearing borrowings – – – 410 512 32 542 770 32 953 282 4 599 724 37 553 006Interest-bearing borrowings at fair value – – – – – – 2 006 791 2 006 791Other liabilities 571 372 612 448 183 917 106 029 1 141 913 2 615 679 2 028 072 4 643 751
Total liabilities 571 372 612 448 183 917 516 541 33 684 683 35 568 961 8 634 587 44 203 548
STATEMENT OF PROFIT OR LOSS AND OTHER COMPREHENSIVE INCOMEContractual rental income 1 520 193 1 803 618 763 372 174 922 419 4 262 524 296 363 4 558 887Straight-line rental income accrual 158 023 13 200 56 172 (11 705) – 215 690 – 215 690Investment income – – – – 19 758 19 758 23 399 43 157
Total revenue 1 678 216 1 816 818 819 544 163 217 20 177 4 497 972 319 762 4 817 734
Operating costs (including expected credit losses on trade receivables) (497 289) (732 229) (227 924) (85 514) – (1 542 956) (98 527) (1 641 483)
Administration costs – – – – (113 861) (113 861) (100 026) (213 887)
Net operating profit 1 180 927 1 084 589 591 620 77 703 (93 684) 2 841 155 121 209 2 962 364Other gains – – 15 216 644 3 773 19 633 141 487 161 120Changes in fair values (682 387) (454 411) (186 256) (613 692) (171 844) (2 108 590) (317 999) (2 426 589)Amortisation of intangible assets – – – – (314 279) (314 279) – (314 279)Impairments (Including expected credit losseson loan receivables) (1 913 810) (2 883 662) (510 710) – (6 299) (5 314 481) (609 306) (5 923 787)
Equity-accounted profit (net of taxation) – – – – – – 135 781 135 781
Loss before finance costs and taxation (1 415 270) (2 253 484) (90 130) (535 345) (582 333) (4 876 562) (528 828) (5 405 390)Interest income 8 665 4 108 2 147 (8 251) 495 675 502 344 16 552 518 896Interest expense (128) (32) (71) (14 849) (1 262 777) (1 277 857) (226 514) (1 504 371)Foreign exchange losses – – – – – – (56 941) (56 941)
Loss before taxation (1 406 733) (2 249 408) (88 054) (558 445) (1 349 435) (5 652 075) (795 731) (6 447 806)Taxation – – – – 61 803 61 803 (20 965) 40 838
Loss for the period (1 406 733) (2 249 408) (88 054) (558 445) (1 287 632) (5 590 272) (816 696) (6 406 968)Non-controlling interests – – – 121 983 – 121 983 (6 465) 115 518
Loss for the period attributable to Redefine Properties Limited shareholders (1 406 733) (2 249 408) (88 054) (436 462) (1 287 632) (5 468 289) (823 161) (6 291 450)
24

Figures in R‘000 Offi ce Retail Industrial Specialised Head offi ce Local International Total
STATEMENT OF FINANCIAL POSITIONInvestment properties (including Straight-line rental income accrual) 24 878 925 28 132 377 12 331 164 2 424 959 – 67 767 425 1 865 007 69 632 432Properties under development 190 260 48 150 1 363 791 – – 1 602 201 1 304 613 2 906 814Listed securities – – – – 68 058 68 058 697 085 765 143Investment in associates and joint venture – – – – – – 12 212 336 12 212 336Loans receivable – – – – 1 299 087 1 299 087 807 187 2 106 274Non-current assets held-for-sale – 42 000 31 604 – – 73 604 669 848 743 452Properties held-for-trading – – 9 649 208 920 – 218 569 – 218 569Property, plant and equipment 105 263 – – 29 137 52 021 186 421 3 581 190 002Other assets 284 710 320 295 127 898 102 781 219 787 1 055 471 2 245 106 3 300 577
Total assets 25 459 158 28 542 822 13 864 106 2 765 797 1 638 953 72 270 836 19 804 763 92 075 599
Interest-bearing borrowings – – – 410 512 32 542 770 32 953 282 4 599 724 37 553 006Interest-bearing borrowings at fair value – – – – – – 2 006 791 2 006 791Other liabilities 571 372 612 448 183 917 106 029 1 141 913 2 615 679 2 028 072 4 643 751
Total liabilities 571 372 612 448 183 917 516 541 33 684 683 35 568 961 8 634 587 44 203 548
STATEMENT OF PROFIT OR LOSS AND OTHER COMPREHENSIVE INCOMEContractual rental income 1 520 193 1 803 618 763 372 174 922 419 4 262 524 296 363 4 558 887Straight-line rental income accrual 158 023 13 200 56 172 (11 705) – 215 690 – 215 690Investment income – – – – 19 758 19 758 23 399 43 157
Total revenue 1 678 216 1 816 818 819 544 163 217 20 177 4 497 972 319 762 4 817 734
Operating costs (including expected credit losses on trade receivables) (497 289) (732 229) (227 924) (85 514) – (1 542 956) (98 527) (1 641 483)
Administration costs – – – – (113 861) (113 861) (100 026) (213 887)
Net operating profi t 1 180 927 1 084 589 591 620 77 703 (93 684) 2 841 155 121 209 2 962 364Other gains – – 15 216 644 3 773 19 633 141 487 161 120Changes in fair values (682 387) (454 411) (186 256) (613 692) (171 844) (2 108 590) (317 999) (2 426 589)Amortisation of intangible assets – – – – (314 279) (314 279) – (314 279)Impairments (Including expected credit losseson loan receivables) (1 913 810) (2 883 662) (510 710) – (6 299) (5 314 481) (609 306) (5 923 787)
Equity-accounted profi t (net of taxation) – – – – – – 135 781 135 781
Loss before fi nance costs and taxation (1 415 270) (2 253 484) (90 130) (535 345) (582 333) (4 876 562) (528 828) (5 405 390)Interest income 8 665 4 108 2 147 (8 251) 495 675 502 344 16 552 518 896Interest expense (128) (32) (71) (14 849) (1 262 777) (1 277 857) (226 514) (1 504 371)Foreign exchange losses – – – – – – (56 941) (56 941)
Loss before taxation (1 406 733) (2 249 408) (88 054) (558 445) (1 349 435) (5 652 075) (795 731) (6 447 806)Taxation – – – – 61 803 61 803 (20 965) 40 838
Loss for the period (1 406 733) (2 249 408) (88 054) (558 445) (1 287 632) (5 590 272) (816 696) (6 406 968)Non-controlling interests – – – 121 983 – 121 983 (6 465) 115 518
Loss for the period attributable to Redefi ne Properties Limited shareholders (1 406 733) (2 249 408) (88 054) (436 462) (1 287 632) (5 468 289) (823 161) (6 291 450)
Commentary SA REIT ratiosResults
25
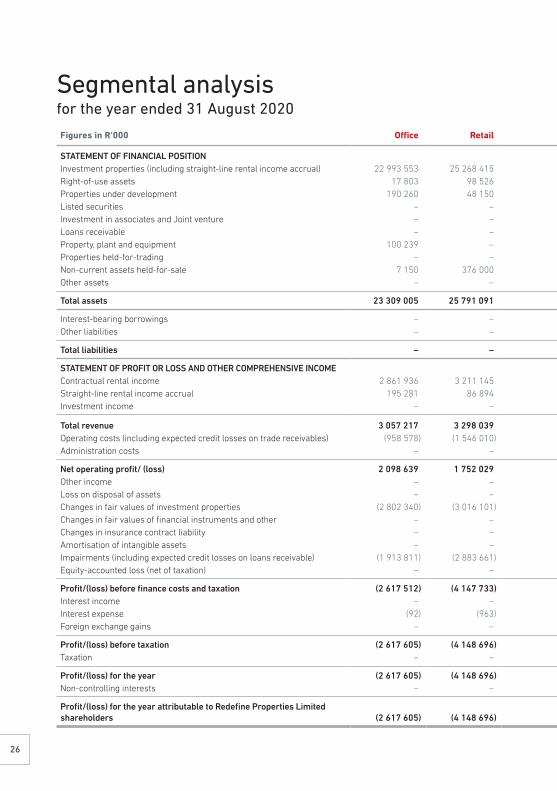
Figures in R‘000 Office Retail Industrial Specialised Head office Local International Total
STATEMENT OF FINANCIAL POSITIONInvestment properties (including straight-line rental income accrual) 22 993 553 25 268 415 10 875 164 2 433 996 – 61 571 128 – 61 571 128Right-of-use assets 17 803 98 526 – – – 116 329 – 116 329Properties under development 190 260 48 150 1 390 032 – – 1 628 442 – 1 628 442Listed securities – – – – 69 679 69 679 – 69 679Investment in associates and Joint venture – – – – – – 8 608 698 8 608 698Loans receivable – – – – 1 316 126 1 316 126 985 894 2 302 020Property, plant and equipment 100 239 – – 26 660 80 600 207 499 32 207 531Properties held-for-trading – – 4 260 170 820 – 175 080 – 175 080Non-current assets held-for-sale 7 150 376 000 158 255 – – 541 405 5 179 864 5 721 269Other assets – – – – 812 295 812 295 957 375 1 769 670
Total assets 23 309 005 25 791 091 12 427 711 2 631 476 2 278 700 66 437 983 15 731 863 82 169 846
Interest-bearing borrowings – – – – 31 845 455 31 845 455 4 804 175 36 649 630Other liabilities – – – – 2 567 820 2 567 820 4 121 162 6 688 982
Total liabilities – – – – 34 413 275 34 413 275 8 925 337 43 338 612
STATEMENT OF PROFIT OR LOSS AND OTHER COMPREHENSIVE INCOMEContractual rental income 2 861 936 3 211 145 1 498 196 392 165 – 7 963 443 386 336 8 349 778Straight-line rental income accrual 195 281 86 894 108 023 (25 052) – 365 146 – 365 146Investment income – – – – 19 757 19 757 49 379 69 136
Total revenue 3 057 217 3 298 039 1 606 219 367 113 19 757 8 348 345 435 715 8 784 060Operating costs (including expected credit losses on trade receivables) (958 578) (1 546 010) (442 951) (179 506) – (3 127 045) (121 752) (3 248 797)Administration costs – – – – (272 334) (272 334) (129 291) (401 625)
Net operating profit/ (loss) 2 098 639 1 752 029 1 163 268 187 607 (252 577) 4 948 966 184 672 5 133 638Other income – – 16 113 10 427 11 100 37 640 2 485 40 125Loss on disposal of assets – – – – – – (137 654) (137 654)Changes in fair values of investment properties (2 802 340) (3 016 101) (1 680 010) (636 675) (10 606) (8 145 732) 987 697 (7 158 035)Changes in fair values of financial instruments and other – – – (40 904) (1 260 629) (1 301 533) (1 455 217) (2 756 750)Changes in insurance contract liability – – – – (130 275) (130 275) – (130 275)Amortisation of intangible assets – – – – (314 277) (314 277) – (314 277)Impairments (including expected credit losses on loans receivable) (1 913 811) (2 883 661) (510 710) – (106 903) (5 415 085) (2 427 207) (7 842 292)Equity-accounted loss (net of taxation) – – – – – – (403 900) (403 900)
Profit/(loss) before finance costs and taxation (2 617 512) (4 147 733) (1 011 339) (479 545) (2 064 167) (10 320 296) (3 249 124) (13 569 420)Interest income – – – – 889 092 889 092 52 583 941 675Interest expense (92) (963) (54) (33 980) (2 470 345) (2 505 435) (450 878) (2 956 313)Foreign exchange gains – – – – – – (1 042 006) (1 042 006)
Profit/(loss) before taxation (2 617 605) (4 148 696) (1 011 393) (513 525) (3 645 420) (11 936 639) (4 689 425) (16 626 064)Taxation – – – – 30 122 30 122 (17 005) 13 117
Profit/(loss) for the year (2 617 605) (4 148 696) (1 011 393) (513 525) (3 615 298) (11 906 517) (4 706 430) (16 612 947)Non-controlling interests – – – 105 165 – 105 165 (120 482) (15 317)
Profit/(loss) for the year attributable to Redefine Properties Limited shareholders (2 617 605) (4 148 696) (1 011 393) (408 360) (3 615 298) (11 801 352) (4 826 912) (16 628 264)
Segmental analysisfor the year ended 31 August 2020
26
Figures in R‘000 Offi ce Retail Industrial Specialised Head offi ce Local International Total
STATEMENT OF FINANCIAL POSITIONInvestment properties (including straight-line rental income accrual) 22 993 553 25 268 415 10 875 164 2 433 996 – 61 571 128 – 61 571 128Right-of-use assets 17 803 98 526 – – – 116 329 – 116 329Properties under development 190 260 48 150 1 390 032 – – 1 628 442 – 1 628 442Listed securities – – – – 69 679 69 679 – 69 679Investment in associates and Joint venture – – – – – – 8 608 698 8 608 698Loans receivable – – – – 1 316 126 1 316 126 985 894 2 302 020Property, plant and equipment 100 239 – – 26 660 80 600 207 499 32 207 531Properties held-for-trading – – 4 260 170 820 – 175 080 – 175 080Non-current assets held-for-sale 7 150 376 000 158 255 – – 541 405 5 179 864 5 721 269Other assets – – – – 812 295 812 295 957 375 1 769 670
Total assets 23 309 005 25 791 091 12 427 711 2 631 476 2 278 700 66 437 983 15 731 863 82 169 846
Interest-bearing borrowings – – – – 31 845 455 31 845 455 4 804 175 36 649 630Other liabilities – – – – 2 567 820 2 567 820 4 121 162 6 688 982
Total liabilities – – – – 34 413 275 34 413 275 8 925 337 43 338 612
STATEMENT OF PROFIT OR LOSS AND OTHER COMPREHENSIVE INCOMEContractual rental income 2 861 936 3 211 145 1 498 196 392 165 – 7 963 443 386 336 8 349 778Straight-line rental income accrual 195 281 86 894 108 023 (25 052) – 365 146 – 365 146Investment income – – – – 19 757 19 757 49 379 69 136
Total revenue 3 057 217 3 298 039 1 606 219 367 113 19 757 8 348 345 435 715 8 784 060Operating costs (including expected credit losses on trade receivables) (958 578) (1 546 010) (442 951) (179 506) – (3 127 045) (121 752) (3 248 797)Administration costs – – – – (272 334) (272 334) (129 291) (401 625)
Net operating profi t/ (loss) 2 098 639 1 752 029 1 163 268 187 607 (252 577) 4 948 966 184 672 5 133 638Other income – – 16 113 10 427 11 100 37 640 2 485 40 125Loss on disposal of assets – – – – – – (137 654) (137 654)Changes in fair values of investment properties (2 802 340) (3 016 101) (1 680 010) (636 675) (10 606) (8 145 732) 987 697 (7 158 035)Changes in fair values of fi nancial instruments and other – – – (40 904) (1 260 629) (1 301 533) (1 455 217) (2 756 750)Changes in insurance contract liability – – – – (130 275) (130 275) – (130 275)Amortisation of intangible assets – – – – (314 277) (314 277) – (314 277)Impairments (including expected credit losses on loans receivable) (1 913 811) (2 883 661) (510 710) – (106 903) (5 415 085) (2 427 207) (7 842 292)Equity-accounted loss (net of taxation) – – – – – – (403 900) (403 900)
Profi t/(loss) before fi nance costs and taxation (2 617 512) (4 147 733) (1 011 339) (479 545) (2 064 167) (10 320 296) (3 249 124) (13 569 420)Interest income – – – – 889 092 889 092 52 583 941 675Interest expense (92) (963) (54) (33 980) (2 470 345) (2 505 435) (450 878) (2 956 313)Foreign exchange gains – – – – – – (1 042 006) (1 042 006)
Profi t/(loss) before taxation (2 617 605) (4 148 696) (1 011 393) (513 525) (3 645 420) (11 936 639) (4 689 425) (16 626 064)Taxation – – – – 30 122 30 122 (17 005) 13 117
Profi t/(loss) for the year (2 617 605) (4 148 696) (1 011 393) (513 525) (3 615 298) (11 906 517) (4 706 430) (16 612 947)Non-controlling interests – – – 105 165 – 105 165 (120 482) (15 317)
Profi t/(loss) for the year attributable to Redefi ne Properties Limited shareholders (2 617 605) (4 148 696) (1 011 393) (408 360) (3 615 298) (11 801 352) (4 826 912) (16 628 264)
Commentary SA REIT ratiosResults
27
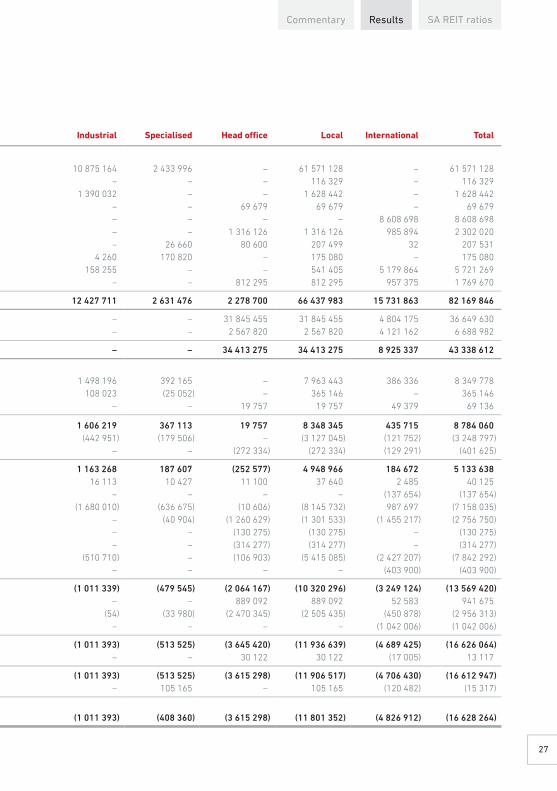
Categories of financial instruments Unaudited 28 February 2021 Unaudited 29 February 2020 Audited 31 August 2020
Financial assets
Figures in R‘000 At amortised
cost
At fair value through profit
or loss Total At amortised
cost
At fair value through profit
or loss Total At amortised
cost
At fair value through profit
or loss Total
Listed securities – 56 715 56 715 – 765 143 765 143 – 69 679 69 679 Derivative assets – 173 420 173 420 – 184 156 184 156 – 25 808 25 808 Loans receivable 2 169 958 – 2 169 958 2 106 274 – 2 106 274 2 302 020 – 2 302 020 Other financial assets – 439 700 439 700 1 184 939 366 237 1 551 176 – 825 020 825 020 Trade and other receivables 617 621 – 617 621 733 091 – 733 091 637 178 – 637 178 Cash and cash equivalents 500 623 – 500 623 742 072 – 742 072 232 078 – 232 078
3 288 202 669 835 3 958 037 4 766 376 1 315 536 6 081 912 3 171 276 920 507 4 091 783
Financial liabilities
Figures in R‘000 At amortised
cost
At fair value through profit
or loss Total At amortised
cost
At fair value through profit
or loss Total At amortised
cost
At fair value through profit
or loss Total
Interest-bearing borrowings 32 309 611 – 32 309 611 37 553 006 – 37 553 006 36 649 630 – 36 649 630 Interest-bearing borrowings at fair value – – – – 2 006 791 2 006 791 – – –Interest accrual on interest-bearing borrowings 176 386 – 176 386 259 017 14 020 273 037 236 227 – 236 227 Derivative liabilities – 2 377 884 2 377 884 – 1 804 452 1 804 452 – 3 861 106 3 861 106 Other financial liabilities 529 095 82 764 611 859 13 803 44 825 58 628 14 537 96 642 111 179 Trade and other payables 1 306 666 – 1 306 666 1 184 510 – 1 184 510 1 347 090 – 1 347 090
34 321 758 2 460 648 36 782 406 39 010 336 3 870 088 42 880 424 38 247 484 3 957 748 42 205 232
For all financial instruments carried at amortised cost, interest is market related and, therefore, the amortised cost reasonably approximates the fair value.
Financial instruments and investment property fair value disclosure
28

Categories of fi nancial instruments Unaudited 28 February 2021 Unaudited 29 February 2020 Audited 31 August 2020
Financial assets
Figures in R‘000 At amortised
cost
At fair value through profi t
or loss Total At amortised
cost
At fair value through profi t
or loss Total At amortised
cost
At fair value through profi t
or loss Total
Listed securities – 56 715 56 715 – 765 143 765 143 – 69 679 69 679 Derivative assets – 173 420 173 420 – 184 156 184 156 – 25 808 25 808 Loans receivable 2 169 958 – 2 169 958 2 106 274 – 2 106 274 2 302 020 – 2 302 020 Other fi nancial assets – 439 700 439 700 1 184 939 366 237 1 551 176 – 825 020 825 020 Trade and other receivables 617 621 – 617 621 733 091 – 733 091 637 178 – 637 178 Cash and cash equivalents 500 623 – 500 623 742 072 – 742 072 232 078 – 232 078
3 288 202 669 835 3 958 037 4 766 376 1 315 536 6 081 912 3 171 276 920 507 4 091 783
Financial liabilities
Figures in R‘000 At amortised
cost
At fair value through profi t
or loss Total At amortised
cost
At fair value through profi t
or loss Total At amortised
cost
At fair value through profi t
or loss Total
Interest-bearing borrowings 32 309 611 – 32 309 611 37 553 006 – 37 553 006 36 649 630 – 36 649 630 Interest-bearing borrowings at fair value – – – – 2 006 791 2 006 791 – – –Interest accrual on interest-bearing borrowings 176 386 – 176 386 259 017 14 020 273 037 236 227 – 236 227 Derivative liabilities – 2 377 884 2 377 884 – 1 804 452 1 804 452 – 3 861 106 3 861 106 Other fi nancial liabilities 529 095 82 764 611 859 13 803 44 825 58 628 14 537 96 642 111 179 Trade and other payables 1 306 666 – 1 306 666 1 184 510 – 1 184 510 1 347 090 – 1 347 090
34 321 758 2 460 648 36 782 406 39 010 336 3 870 088 42 880 424 38 247 484 3 957 748 42 205 232
For all fi nancial instruments carried at amortised cost, interest is market related and, therefore, the amortised cost reasonably approximates the fair value.
Commentary SA REIT ratiosResults
29

Financial instruments and investment property fair value disclosure (continued)Fair value hierarchy for financial instruments and investment propertyIFRS 13 requires that an entity discloses for each class of financial instruments and investment property measured at fair value, the level in the fair value hierarchy into which the fair value measurements are categorised in their entirety.
The fair value hierarchy reflects the significance of the inputs used in making fair value measurements.
The level in the fair value hierarchy within which the fair value measurement is categorised in its entirety shall be determined on the basis of the lowest level input that is significant to the fair value measurement in its entirety.
The fair value hierarchy has the following levels:
Level 1 – quoted prices (unadjusted) in active markets for identical assets or liabilities.
Level 2 – inputs other than quoted prices included within level 1 that are observable for the asset or liability, either directly (i.e. as prices) or indirectly (i.e. derived from prices).
Level 3 – inputs for the asset or liability that are not based on observable market data (unobservable inputs).
There have been no transfers between level 1, level 2 and level 3 during the period under review.
30

The table below analyses fi nancial instruments and investment property carried at fair value.
Fair value hierarchy for financial instruments and investment propertyUnaudited 28 February 2021
Figures in R‘000 Fair value Level 1 Level 2 Level 3
AssetsInvestment properties* 64 196 686 – – 64 196 686Listed securities 56 715 56 715 – –Derivative assets 173 420 – 173 420 –Other fi nancial assets 439 700 – – 439 700
64 866 521 56 715 173 420 64 636 386
LiabilitiesDerivative liabilities 2 377 884 – 2 377 884 –Other fi nancial liabilities 82 764 – – 82 764
2 460 648 – 2 377 884 82 764
Unaudited 29 February 2020Figures in R‘000 Fair value Level 1 Level 2 Level 3
AssetsInvestment properties* 72 612 850 – – 72 612 850Listed securities 765 143 765 143 – –Derivative assets 184 156 – 184 156 –Other fi nancial assets 366 237 – – 366 237
73 928 386 765 143 184 156 72 979 087
LiabilitiesInterest-bearing borrowings at fair value 2 006 791 2 006 791 – –Derivative liabilities 1 804 452 – 1 769 598 7 854Other fi nancial liabilities 44 825 – – 44 825Interest accrual on interest-bearing borrowings 14 020 14 020 – –
3 870 088 2 020 811 1 769 598 52 679
Audited 31 August 2020
Figures in R‘000 Fair value Level 1 Level 2 Level 3
AssetsInvestment properties* 69 024 379 – – 69 024 379Listed securities 69 679 69 679 – –Derivative assets 25 808 – 25 808 –Other fi nancial assets 825 020 – – 825 020
69 944 886 69 679 25 808 69 849 399
LiabilitiesDerivative liabilities 3 861 106 – 3 861 106 –Other fi nancial liabilities 96 642 – – 96 642
3 957 748 – 3 861 106 96 642
* Includes properties under development, right-of-use assets and non-current assets (properties) held-for-sale.
Commentary SA REIT ratiosResults
31

Financial instruments and investment property fair value disclosure (continued)Transfers between level 1, level 2 and level 3There have been no transfers between level 1, level 2 and level 3 during the period under review.
Level 3 reconciliationUnaudited 28 February 2021
Figures in R‘000
Balance at beginning of
yearAcquisitions/
(disposals)
Gain/(loss) in profit or loss for
the periodBalance at end
of the period
Investment properties 61 571 128 128 846 (1 137 626) 60 562 348Properties under development 1 628 442 (520 857) (180 591) 926 994Right-of-use asset 116 329 (10) (4 022) 112 297Investment property held-for-sale 5 708 480 (3 175 817) 62 384 2 595 047Other financial assets 825 020 (407 708) 22 388 439 700Other financial liabilities (96 642) 13 789 89 (82 764)
69 752 757 (3 961 757) (1 237 378) 64 553 622
Unaudited 29 February 2020
Figures in R‘000
Balance at beginning of
year Acquisitions/
(disposals)
Gain/(loss) in profit or loss for
the period Balance at end
of the period
Investment properties 75 086 504 (4 314 352) (1 139 720) 69 632 432 Properties under development 3 553 678 (596 491) (50 373) 2 906 814 Investment property held-for-sale 645 461 (571 760) (97) 73 604 Loans receivable 112 032 (112 032) – –Other financial assets 373 387 – (7 150) 366 237 Derivative liabilities (7 854) – – (7 854)Other financial liabilities (46 921) – 2 096 (44 825)
79 716 287 (5 594 635) (1 195 244) 72 926 408
Audited 31 August 2020
Figures in R‘000
Balance at beginning of
year Acquisitions/
(disposals)
Gain/(loss) in profit or loss for
the year Balance at end
of year
Investment properties 75 086 504 (6 678 067) (6 837 309) 61 571 128 Properties under development 3 553 678 (2 074 794) 149 558 1 628 442 Right-of-use asset – – 116 329 116 329 Investment property held-for-sale 645 461 5 329 087 (266 068) 5 708 480 Other financial assets 373 387 406 849 44 784 825 020 Loans receivable 112 032 (112 032) – –Derivative liabilities (7 854) – 7 854 –Other financial liabilities (46 921) (41 721) (8 000) (96 642)
79 716 287 (3 170 678) (6 792 852) 69 752 757
The fair value gains and losses are included in the changes in fair values Investment properties and changes in fair value of financial instruments.
32

Details of valuation techniquesThe valuation techniques used in measuring fair values at 28 February 2021 for fi nancial instruments and investment property measured at fair value in the statement of fi nancial position, as well as the signifi cant unobservable inputs used are disclosed below. There has been no signifi cant changes in valuation techniques and inputs since 31 August 2020.
Investment propertyA panel of independent external valuers are appointed to conduct the Group’s February 2021 property valuations. The Group provided the valuers with property and other information required in the valuation of the properties. Among other inputs, the independent valuers applied current market-related assumptions to the risks in rental streams of properties. Once the valuations have been completed by the independent valuers, it was reviewed internally and presented at diff erent forums within the Group. The investment committee, a sub-committee of the board of directors, provides fi nal approval of the valuations. All the valuers are registered valuers in terms of Section 19 of the Property Valuers Professional Act (Act No 47 of 2000). The independent valuers are as follows:
à Real Insight T Behrens NDip (Prop Val), professional valuer
à Broll J Weiner Dip Real Estate (P.V.) MIV(SA), professional valuer
à Eris Property Group C Everatt BSc (Hons) Estate management, MRICS, MIV (SA), professional valuer
à Sterling Valuation Specialists A Smith BSc, MIV (SA), professional valuer
à Jones Lang LaSalle J Karg BSc, MRICS, MIV (SA), professional valuer
à Jones Lang LaSalle S Crous BSc, MRICS, MIV (SA), professional valuer
à Knight Frank A Arbee NDip (Prop Val), professional valuer
à Mills Fitchet Cape S Wolff NDip (Prop Val), professional associated valuer
Unobservable inputs (% unless otherwise stated)
Unaudited 28 February 2021
Unaudited 29 February 2020
Audited 31 August 2020
Expected market rental growth 3.00 – 6.00 3.00 – 6.00 3.00 – 5.50Expected expense growth 5.50 – 8.00 6.50 – 8.00 6.00 – 8.00Occupancy rate 91,00 94,55 91,89Vacancy periods 0 – 12 months 0 – 12 months 0 – 12 monthsRent-free periods 0 – 6 months 0 – 6 months 0 – 9 months
Offi ce sectorDiscount rate 10.50 – 16.50 12.00 – 17.00 12.00 – 16.50Exit capitalisation rate 8.00–12.50 7.75 – 13.75 8.00 – 12.50Bulk rate R1 500 – R3 000 p/m2 R2 000 – R4 725 p/m2 R1 500 – R3 000 p/m2
Retail sectorDiscount rate 10.50 –16.75 11.25 – 17.00 10.50 –16.75Exit capitalisation rate 7.25 – 13.50 7.25 – 12.00 7.25 – 13.50Bulk rate R175 – R2 500 p/m2 R330 – R4 000 p/m2 R175 – R1 600 p/m2
Industrial sectorDiscount rate 13.00 – 15.50 13.00 – 16.00 12.50 – 15.50Exit capitalisation rate 8.00 –11.00 8.00 – 12.00 8.00 – 11.00Bulk rate R450 – R1 700 p/m2 R400 – R1 850 p/m2 R450 – R1 800 p/m2
Specialised sectorDiscount rate 14.50 – 15.00 14.00 – 14.50 14.50 – 15.00 Exit capitalisation rate 9.50 – 9.75 9.50 – 10.50 9.50 – 10.50
International sectorDiscount rate – 7.00 – 9.00 –Exit capitalisation rate – 6.50 – 7.25 –Bulk rate – R398 – R403 p/m2 –
Commentary SA REIT ratiosResults
33
Financial instruments and investment property fair value disclosure (continued)Measurement of fair valueValuation techniquesValuations were completed using the following methods of valuation:
Investment propertiesInvestment property – Discounted cash flow methodThe valuation model generates a net present value for each property by discounting forecasted future cash flows and a residual value at the end of the cash flow projection period by the discount rate of each property. The residual value is calculated by capitalising the net income forecasted for the 12-month period immediately following the final year of the cash flow at the exit capitalisation rate. The discount rate applied by each valuator is determined by adding a growth rate per property, based on forecasted market related rental increases, to the determined capitalisation rate per property. The discount rate is then tested for reasonableness by benchmarking the rate against recent comparable sales and surveys prepared by the MSCI/South African Property Owners Association (SAPOA). The capitalisation rate is dependent on a number of factors, such as location and condition of the property, current market conditions, the lease covenants and the risk inherent in the property and is also tested for reasonableness by benchmarking against comparable recent sales and surveys prepared by MSCI/SAPOA.
Sensitivity of fair values to changes in unobservable inputsValuation of investment properties are sensitive to changes in inputs used in determining its fair value. The table below illustrates the sensitivity in fair value to changes in unobservable inputs, whilst holding the other inputs constant.
As at 28 February 2021 Change in exit capitalisation rate Change in discount rate
SectorValuation
R‘000
Weighted averageexit cap
rate
Weighted average discount
rate
Decrease 50bps R‘000 %
Increase 50bps R‘000 %
Decrease 50bps R‘000 %
Increase 50bps R‘000 %
Industrial 10 959 050 9.23% 13.90% 387 624 3.54% (351 640) (3.21%) 195 797 1.79% (195 750) (1.79%)Retail 24 254 190 8.36% 12.47% 1 035 590 4.27% (902 970) (3.72%) 453 460 1.87% (428 263) (1.77%)Office 22 715 062 8.83% 12.99% 903 711 3.98% (805 953) (3.55%) 413 829 1.82% (405 342) (1.78%)
57 928 302*
* Excludes right-of-use assets, properties under development and land, inclusive of buildings classified as property, plant and equipment.
Properties under development – Comparable sales methodProperties under development comprise of the cost of land and development, and are measured at fair value. Fair value is based on the costs incurred up to the date of valuation. Undeveloped land is valued in terms of the internationally accepted and preferred method of comparison. This involves the use of recent comparable transactions as a basis for the valuation. Bulk rates are determined for the land that has been zoned.
The fair value measurement for investment properties of R58.5 billion (FY2020: R58.9 billion) and properties under development of R0.9 billion (FY2020: R1.6 billion) has been categorised as level 3 under the fair value hierarchy based on the inputs to the valuation technique.
34
Financial instrumentsListed securitiesThe fair value is determined using the closing market price on the relevant exchange.
Derivate assets and liabilitiesForeign exchange optionsThe fair value is determined using quoted forward exchange rates at the reporting date and present value calculations based on high credit quality yield curves in the respective currencies.
Interest rate swapsThe fair value is calculated as the present value of the estimated future cash fl ows. Estimates of the future fl oating-rate cash fl ows are based on quoted swap rates, futures prices and interbank borrowing rates. Estimated cash fl ows are discounted using a yield curve constructed from similar sources, which refl ects the relevant benchmark interbank rate used by market participants for this purpose when pricing interest rate swaps. The fair value estimate is subject to a credit risk adjustment that refl ects the credit risk of the Group and of the counterparty. This is calculated based on credit spreads derived from current credit default swap or bond prices.
Cross-currency interest rate swapsThe fair value is calculated by discounting the future cash fl ows using the swap curve of the respective currencies at the dates when the cash fl ows will take place.
Other fi nancial assets and liabilitiesUnlisted securitiesThe adjusted net asset value method is used to determine the fair value, i.e. the fair value is measured based on the fair value of the investee’s assets and liabilities.
Profi t participation liabilityThe adjusted net asset value method is used to determine the fair value of the liability, i.e. the fair value is measured based on 5% of the underlying Chariot investment.
Rental guaranteeThe rental guarantee entered into with the buyer, guarantees a certain level of rental income in which the rental guarantee is determined. The fair value of the rental guarantee is calculated based on unobservable inputs, i.e. occupancy levels.
Madison earn-outThe Madison earn-out arising from the sale of ELI relates to the assets in the ELI portfolio that were still under construction on transfer date. The fair value is based on unobservable inputs of the asset under construction estimated as at the expected date of completion, i.e. NOI, debt outstanding, outstanding rent reductions, vacancies and working capital.
Commentary SA REIT ratiosResults
35
SA REIT ratios3
300 Middel Street, Brooklyn36
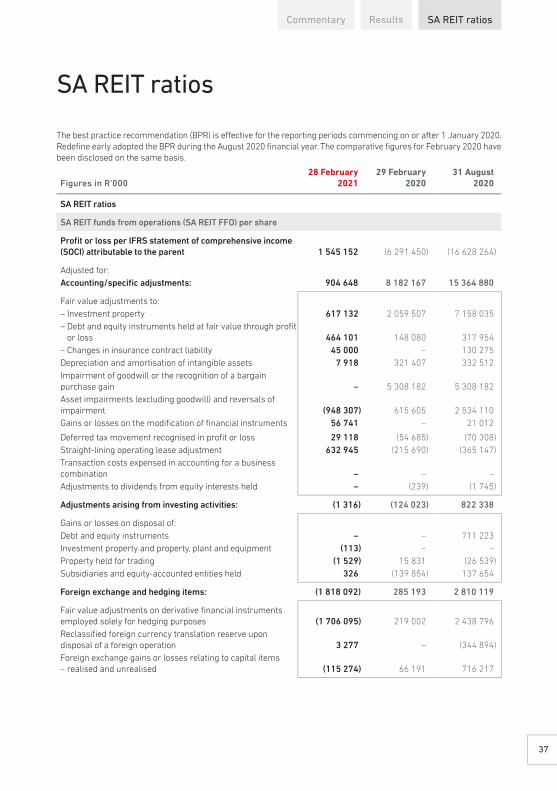
SA REIT ratios
The best practice recommendation (BPR) is eff ective for the reporting periods commencing on or after 1 January 2020. Redefi ne early adopted the BPR during the August 2020 fi nancial year. The comparative fi gures for February 2020 have been disclosed on the same basis.
Figures in R‘00028 February
202129 February
202031 August
2020
SA REIT ratios
SA REIT funds from operations (SA REIT FFO) per share
Profi t or loss per IFRS statement of comprehensive income (SOCI) attributable to the parent 1 545 152 (6 291 450) (16 628 264)
Adjusted for:Accounting/specifi c adjustments: 904 648 8 182 167 15 364 880
Fair value adjustments to:– Investment property 617 132 2 059 507 7 158 035– Debt and equity instruments held at fair value through profi t
or loss 464 101 148 080 317 954– Changes in insurance contract liability 45 000 – 130 275Depreciation and amortisation of intangible assets 7 918 321 407 332 512Impairment of goodwill or the recognition of a bargain purchase gain – 5 308 182 5 308 182Asset impairments (excluding goodwill) and reversals of impairment (948 307) 615 605 2 534 110Gains or losses on the modifi cation of fi nancial instruments 56 741 – 21 012
Deferred tax movement recognised in profi t or loss 29 118 (54 685) (70 308)Straight-lining operating lease adjustment 632 945 (215 690) (365 147)Transaction costs expensed in accounting for a business combination – – –Adjustments to dividends from equity interests held – (239) (1 745)
Adjustments arising from investing activities: (1 316) (124 023) 822 338
Gains or losses on disposal of:Debt and equity instruments – – 711 223Investment property and property, plant and equipment (113) – –Property held for trading (1 529) 15 831 (26 539)Subsidiaries and equity-accounted entities held 326 (139 854) 137 654
Foreign exchange and hedging items: (1 818 092) 285 193 2 810 119
Fair value adjustments on derivative fi nancial instruments employed solely for hedging purposes (1 706 095) 219 002 2 438 796Reclassifi ed foreign currency translation reserve upon disposal of a foreign operation 3 277 – (344 894)Foreign exchange gains or losses relating to capital items – realised and unrealised (115 274) 66 191 716 217
Commentary Results SA REIT ratios
37
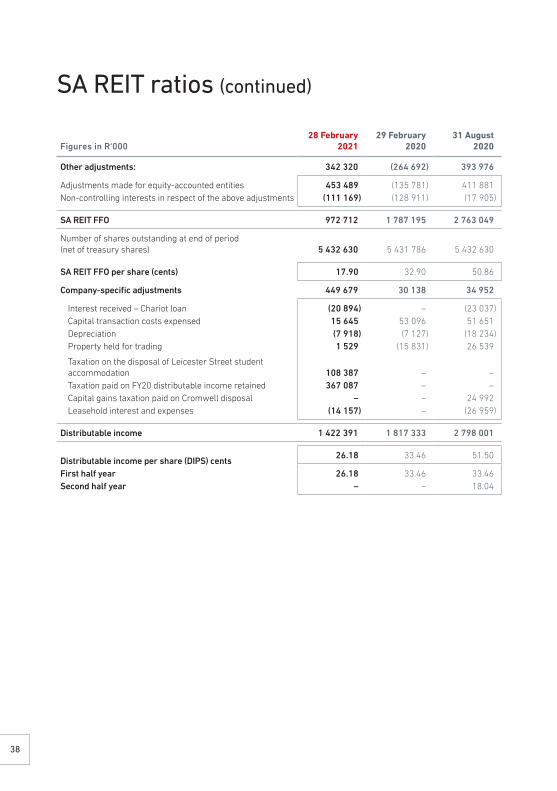
SA REIT ratios (continued)
Figures in R‘00028 February
202129 February
202031 August
2020
Other adjustments: 342 320 (264 692) 393 976
Adjustments made for equity-accounted entities 453 489 (135 781) 411 881Non-controlling interests in respect of the above adjustments (111 169) (128 911) (17 905)
SA REIT FFO 972 712 1 787 195 2 763 049
Number of shares outstanding at end of period (net of treasury shares) 5 432 630 5 431 786 5 432 630
SA REIT FFO per share (cents) 17.90 32.90 50.86
Company-specific adjustments 449 679 30 138 34 952
Interest received – Chariot loan (20 894) – (23 037)Capital transaction costs expensed 15 645 53 096 51 651Depreciation (7 918) (7 127) (18 234)Property held for trading 1 529 (15 831) 26 539
Taxation on the disposal of Leicester Street student accommodation 108 387 – –Taxation paid on FY20 distributable income retained 367 087 – –Capital gains taxation paid on Cromwell disposal – – 24 992Leasehold interest and expenses (14 157) – (26 959)
Distributable income 1 422 391 1 817 333 2 798 001
Distributable income per share (DIPS) cents26.18 33.46 51.50
First half year 26.18 33.46 33.46Second half year – – 18.04
38
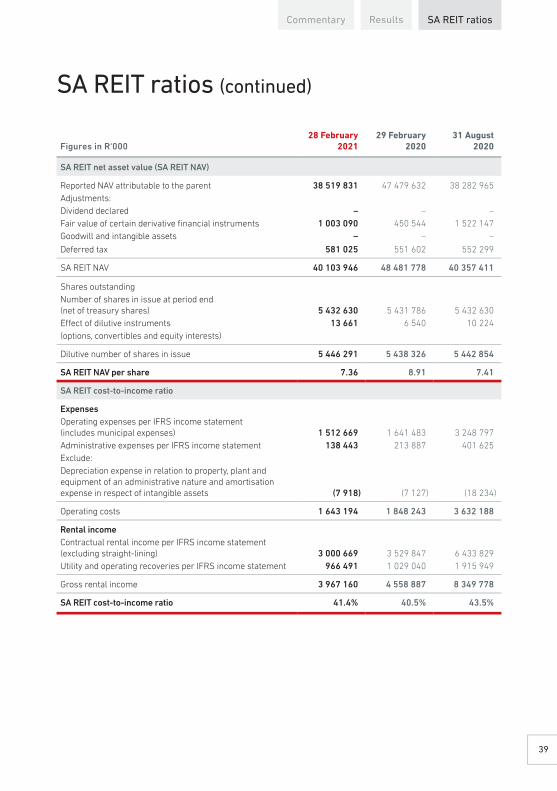
SA REIT ratios (continued)
Figures in R‘00028 February
202129 February
202031 August
2020
SA REIT net asset value (SA REIT NAV)
Reported NAV attributable to the parent 38 519 831 47 479 632 38 282 965Adjustments:Dividend declared – – –Fair value of certain derivative fi nancial instruments 1 003 090 450 544 1 522 147Goodwill and intangible assets – – –
Deferred tax 581 025 551 602 552 299
SA REIT NAV 40 103 946 48 481 778 40 357 411
Shares outstandingNumber of shares in issue at period end (net of treasury shares) 5 432 630 5 431 786 5 432 630Eff ect of dilutive instruments 13 661 6 540 10 224(options, convertibles and equity interests)
Dilutive number of shares in issue 5 446 291 5 438 326 5 442 854
SA REIT NAV per share 7.36 8.91 7.41
SA REIT cost-to-income ratio
ExpensesOperating expenses per IFRS income statement (includes municipal expenses) 1 512 669 1 641 483 3 248 797Administrative expenses per IFRS income statement 138 443 213 887 401 625Exclude:Depreciation expense in relation to property, plant and equipment of an administrative nature and amortisation expense in respect of intangible assets (7 918) (7 127) (18 234)
Operating costs 1 643 194 1 848 243 3 632 188
Rental incomeContractual rental income per IFRS income statement (excluding straight-lining) 3 000 669 3 529 847 6 433 829Utility and operating recoveries per IFRS income statement 966 491 1 029 040 1 915 949
Gross rental income 3 967 160 4 558 887 8 349 778
SA REIT cost-to-income ratio 41.4% 40.5% 43.5%
Commentary Results SA REIT ratios
39
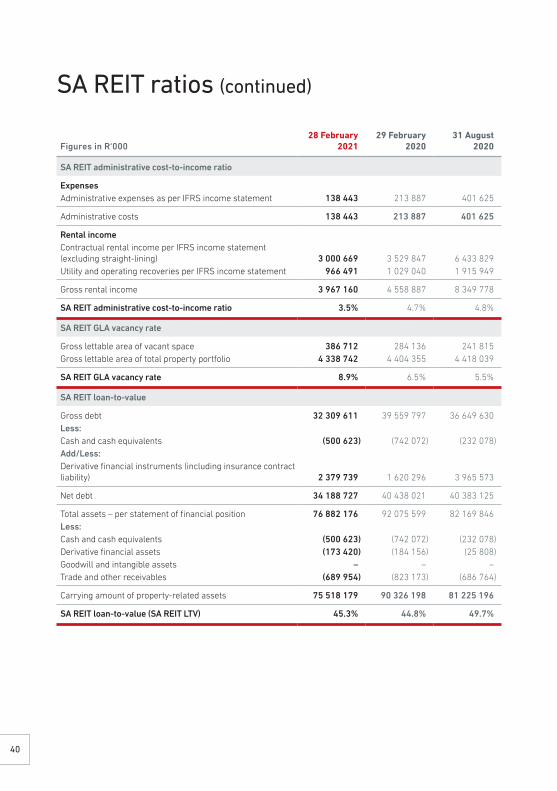
SA REIT ratios (continued)
Figures in R‘00028 February
202129 February
202031 August
2020
SA REIT administrative cost-to-income ratio
ExpensesAdministrative expenses as per IFRS income statement 138 443 213 887 401 625
Administrative costs 138 443 213 887 401 625
Rental incomeContractual rental income per IFRS income statement (excluding straight-lining) 3 000 669 3 529 847 6 433 829Utility and operating recoveries per IFRS income statement 966 491 1 029 040 1 915 949
Gross rental income 3 967 160 4 558 887 8 349 778
SA REIT administrative cost-to-income ratio 3.5% 4.7% 4.8%
SA REIT GLA vacancy rate
Gross lettable area of vacant space 386 712 284 136 241 815Gross lettable area of total property portfolio 4 338 742 4 404 355 4 418 039
SA REIT GLA vacancy rate 8.9% 6.5% 5.5%
SA REIT loan-to-value
Gross debt 32 309 611 39 559 797 36 649 630Less:Cash and cash equivalents (500 623) (742 072) (232 078)Add/Less:Derivative financial instruments (including insurance contract liability) 2 379 739 1 620 296 3 965 573
Net debt 34 188 727 40 438 021 40 383 125
Total assets – per statement of financial position 76 882 176 92 075 599 82 169 846Less:Cash and cash equivalents (500 623) (742 072) (232 078)Derivative financial assets (173 420) (184 156) (25 808)Goodwill and intangible assets – – –Trade and other receivables (689 954) (823 173) (686 764)
Carrying amount of property-related assets 75 518 179 90 326 198 81 225 196
SA REIT loan-to-value (SA REIT LTV) 45.3% 44.8% 49.7%
40
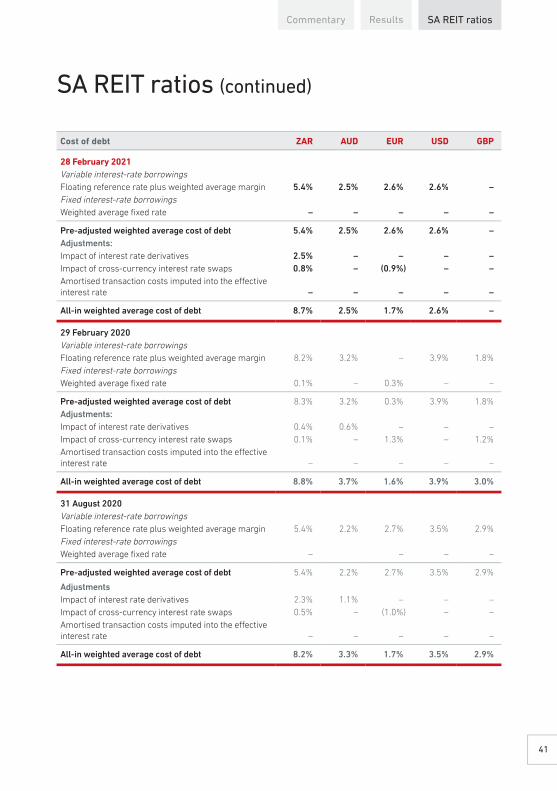
SA REIT ratios (continued)
Cost of debt ZAR AUD EUR USD GBP
28 February 2021Variable interest-rate borrowingsFloating reference rate plus weighted average margin 5.4% 2.5% 2.6% 2.6% –Fixed interest-rate borrowingsWeighted average fi xed rate – – – – –
Pre-adjusted weighted average cost of debt 5.4% 2.5% 2.6% 2.6% –Adjustments:Impact of interest rate derivatives 2.5% – – – –Impact of cross-currency interest rate swaps 0.8% – (0.9%) – –Amortised transaction costs imputed into the eff ective interest rate – – – – –
All-in weighted average cost of debt 8.7% 2.5% 1.7% 2.6% –
29 February 2020Variable interest-rate borrowingsFloating reference rate plus weighted average margin 8.2% 3.2% – 3.9% 1.8%Fixed interest-rate borrowingsWeighted average fi xed rate 0.1% – 0.3% – –
Pre-adjusted weighted average cost of debt 8.3% 3.2% 0.3% 3.9% 1.8%Adjustments:Impact of interest rate derivatives 0.4% 0.6% – – –Impact of cross-currency interest rate swaps 0.1% – 1.3% – 1.2%Amortised transaction costs imputed into the eff ective interest rate – – – – –
All-in weighted average cost of debt 8.8% 3.7% 1.6% 3.9% 3.0%
31 August 2020Variable interest-rate borrowingsFloating reference rate plus weighted average margin 5.4% 2.2% 2.7% 3.5% 2.9%Fixed interest-rate borrowingsWeighted average fi xed rate – – – –
Pre-adjusted weighted average cost of debt 5.4% 2.2% 2.7% 3.5% 2.9%
AdjustmentsImpact of interest rate derivatives 2.3% 1.1% – – –Impact of cross-currency interest rate swaps 0.5% – (1.0%) – –Amortised transaction costs imputed into the eff ective interest rate – – – – –
All-in weighted average cost of debt 8.2% 3.3% 1.7% 3.5% 2.9%
Commentary Results SA REIT ratios
41

Notes
42

Notes
SA REIT ratiosCommentary Results
43

Notes
44

Redefine Properties Limited(Incorporated in the Republic of South Africa) Registration number: 1999/018591/06JSE share code: RDF ISIN: ZAE000190252Debt company code: BIRDF(Redefine or the company or the Group) (Approved as a REIT by the JSE)
Independent non-executive directorsSM Pityana (Chairperson)B Mathews (Lead independent)ASP DambuzaD NaidooD RadleyLJ SenneloM BarkhuysenNB Langa-Royds
Executive directorsAJ König (Chief Executive Officer)LC Kok (Chief Operating Officer)NG Nyawo (Chief Financial Officer)
Registered officeRosebank Towers, Office Level 5, 19 Biermann Avenue, Rosebank 2196 (PO Box 1731, Parklands 2121)
Transfer secretariesComputershare Investor Services Proprietary Limited
SponsorJava Capital
Acting company secretaryT Dube
Independent auditorsPricewaterhouseCoopers Inc.
Date of publication17 May 2021
COVID-19 disclaimerRedefine Properties supports all COVID-19 health protocols, including the wearing of masks, sanitising of hands, and social distancing practices. Should, in any example of our marketing/advertising material, a person be depicted without a mask of touching another person's hands, this should be considered in light of the fact that the person is simply portraying a scenario which may not necessarily be during a state of lockdown, and that Redefine's support of, and adherence to, all COVID-19 health protocols at all times remains.

www.redefine.co.za