condensed interim statement of financial position
TRANSCRIPT

Pakistan Reinsurance Company Limited
Condensed Interim Statement of Financial Position (Unaudited)
As at 31 March 2021
31 March 31 Decenber
2021 2020
Unaudited Audited
ASSETS Note Rupees Rupees
Property and equipment 6 61,657,923 65,702,538
Assest relating to Bangladesh - -
Investment property 7 25,177,306 25,496,671
Investments
Equity securities 8 3,624,095,839 3,763,247,842
Debt securities 9 8,671,627,233 8,271,505,868
Loans and other receivables 10 2,859,290,579 2,879,141,999
Insurance / Reinsurance receivables 11 9,335,877,428 8,141,085,867
Reinsurance recoveries against outstanding claims 4,519,891,413 5,603,808,031
Deferred Commission Expense / Acquisition cost 641,762,070 708,870,616
Taxation - payments less provision - 181,407,606
Prepayments 3,653,973,351 4,144,875,197
Cash & Bank 12 1,039,497,498 1,570,505,178
Total assets from Window Takaful Operations - OPF 433,148,244 409,366,837
Total Assets 34,865,998,884 35,765,014,250
EQUITY AND LIABILITIES
Capital and reserves attributable to Company's equity holders
Ordinary share capital 3,000,000,000 3,000,000,000
Reserves 13 7,649,641,105 7,241,544,195
Total Equity 10,649,641,105 10,241,544,195
Liabilities
Underwriting Provisions
- Outstanding claims including IBNR 9,578,694,797 10,475,734,890
- Unearned premium reserves 6,365,447,892 6,513,672,434
- Unearned Reisurance Commission 244,952,220 338,532,613
Retirement benefit obligations 3,137,098,570 3,188,627,998
Deferred taxation 116,933,390 116,933,390
Insurance / Reinsurance Payables 14 4,394,608,936 4,550,351,723
Taxation - payments less provision 34,922,166 -
Lease liabilities 26,778,855 26,778,855
Unclaimed Dividend 15 155,208,129 155,208,129
Other Creditors and Accruals 15 76,402,462 88,202,370
Total Liabilities 24,131,047,417 25,454,042,402
Total liabilities from Window Takaful Operations - OPF 85,310,363 69,427,654
Total Equity and Liabilities 34,865,998,885 35,765,014,251
Contingency(ies) and commitment(s)
The annexed notes 1 to 28 form an integral part of this condensed interim financial information.
CFO CEO DIRECTOR DIRECTOR CHAIRMAN

Pakistan Reinsurance Company LimitedCondensed Interim Statement of Profit and Loss Account (Unaudited)
For the period ended March 31, 2021
2021 2020
Note
Net insurance premium 17 1,549,669,769 1,764,073,526
Net Insurance claims 18 648,506,966 651,848,751
Net Commission and other acquistion costs 19 234,191,980 274,095,781
Insurance claims and acquisition expenses 882,698,946 925,944,532
Management Expenses 103,898,881 110,575,214
Underwriting results 563,071,942 727,553,780
Investment income 217,154,903 236,655,012
Rental income 23,181,435 20,384,996
Other income 20 4,096,882 14,132,334
Other expenses (901,224) (238,911)
Results of operating activities 806,603,938 998,487,211
Profit before tax from general operations 806,603,938 998,487,211
Profit from Window Retakaful Operations 7,725,894 9,240,868
Profit before tax 814,329,832 1,007,728,079
Income tax expense (263,379,153) (339,305,623)
Profit after tax 550,950,679 668,422,456
Earnings (after tax) per share - Rupees 1.84 2.23
The annexed notes 1 to 28 form an integral part of this condensed interim financial information.
3 months ended 31 Mar
CFO CEO DIRECTOR DIRECTOR CHAIRMAN

Pakistan Reinsurance Company Limited
Condensed Interim Statement Of Total Comprehensive Income (Unaudited)
For the period ended March 31, 2021
31 Mar 31 Mar
2021 2020
Unaudited Unaudited
----------------- Rupees -------------
Profit for the Period 550,950,679 668,422,455
Other comprehensive income / (loss)
Items that may not be reclassified subsequently to profit and loss account
Unrealized loss on available for sale investments - net (143,026,573) -
Other Comprehensive Income Window Retakaful Operations
Transfer to profit and loss account on disposal of available 172,804 -
(142,853,769) -
Items that will not be reclassified subsequently to profit and loss account
Other comprehensive income for the period (142,853,769) -
Total comprehensive income / (loss) for the period 408,096,910 668,422,455
Profit and loss appropriation account
Balance at the commencement of year 10,241,544,195 6,871,489,376
Total comprehensive income for the Period 408,096,910 668,422,455
Balance of unappropriated profit at the end of the period 10,649,641,105 7,539,911,831
The annexed notes 1 to 28 form an integral part of this condensed interim financial information.
CFO CEO DIRECTOR DIRECTOR CHAIRMAN

Pakistan Reinsurance Company Limited
Condensed Interim Statement of Changes in Equity (Unaudited)For the period ended March 31, 2021
Share capital ReservesIssued Revenue reserves
------------------------------------------------------------------------- Rupees --------------------------------------------------------------
Balance as at January 01, 2020 3,000,000,000 281,000,000 1,652,641,179 1,777,419,085 3,117,737,411 6,828,797,675 9,828,797,675
Total Comprehensive income for the period ended March
31, 2020 - - - 668,422,455 668,422,455 668,422,455
Transactions with owners - - - - 668,422,455 668,422,455 668,422,455
Balance as at March 31, 2020 3,000,000,000 281,000,000 1,652,641,179 1,777,419,085 3,786,159,866 7,497,220,130 10,497,220,130
Balance as at January 01, 2021 3,000,000,000 281,000,000 1,440,831,468 1,777,419,085 3,742,293,642 7,241,544,195 10,241,544,195
Total Comprehensive income for the period ended March
31, 2021 - - - 550,950,679 550,950,679 550,950,679
- - -
Remeasurement of defined benefit obligations - net (142,853,769) (142,853,769) (142,853,769)
Transactions with owners - - (142,853,769) - 550,950,679 408,096,910 408,096,910
Effect of change in accounting policy - note - - - - - -
Balance as at March 31, 2021 3,000,000,000 281,000,000 1,297,977,699 1,777,419,085 4,293,244,321 7,649,641,105 10,649,641,105
The annexed notes 1 to 28 form an integral part of this condensed interim financial information.
Total
subscribed and
paid-up
General reserve Retained
earnings
Total reservesReserve for
exceptional
losses
Unrealized
gain on
available for
sale
investment
CFO CEO DIRECTOR DIRECTOR CHAIRMAN

Pakistan Reinsurance Company Limited
Condensed Interim Statement of Cash Flows (Unaudited)For the period ended March 31, 2021
2021 2020
(Rupees) (Rupees)
Operating Cash Flows:
Underwriting activities:-
Premium received 2,438,940,124 2,992,665,957
Reinsurance premium paid (1,912,391,303) (2,143,964,565)
Claims paid (1,581,064,956) (516,122,968)
Reinsurance and other recoveries received 1,119,434,515 -
Commission paid (351,906,471) (281,515,610)
Commission received 91,242,643 98,625,562
Premium and claim reserves retained from
retrocessionaires/withheld by ceding companies 14,312,108 -
Other underwriting payments (management expenses) (99,875,003) (108,511,991)
Net cash flows generated from underwriting activities (281,308,343) 41,176,385
Other Operating Activities
Income tax paid (47,049,381) (187,065,041)
General management expenses paid (356,156) (238,911)
Payment unders defined benefit obligations
Other operating (payments) / receipts (63,867,547) (47,166,414)
Advances to employees 7,342,267 8,012,887
Net cash used in other operating activities (103,930,817) (226,457,479)
Total cash flow generated from all operating activities (385,239,160) (185,281,094)
Investment activities
Fixed Capital expenditure (87,411) (5,230,267)
Acquisition of investments (4,340,301,873) (2,157,309,969)
Rental income received - net of expenses (2,427,460) (4,378,127)
Dividend income received 38,636,940 34,868,421
Interest income on bank deposits 84,784,447 105,987,988
Investment income received - net of expenses 141,241,714 211,659,656
Proceeds on sale/ maturity of investments 3,932,385,123 1,695,943,074
Total cash used in investing activities (145,768,520) (118,459,224)
Financing activities
Surplus paid - -
Dividend paid - (80,253)
Payments of finance leases - -
Total cash generated used in financing activities - (80,253)
Net cash generated from all activities (531,007,680) (303,820,571)
Cash at beginning of the period 1,570,505,178 815,678,747
Cash at end of the period 1,039,497,498 511,858,176
The annexed notes 1 to 28 form an integral part of this condensed interim financial information.
CFO CEO DIRECTOR DIRECTOR CHAIRMAN

2021 2020
(Rupees) (Rupees)
Reconciliation to profit and loss account
Operating cash flows (385,239,160) (185,281,094)
Depreciation expense
-Fixed assets (4,451,391) (1,366,391)
-Investment property - (696,832)
Exchange gain (545,068) 5,712,474
Rental income 23,558,515 20,384,996
Reinsurance recoveries against outstanding claims (1,083,916,618) 1,882,331
Provision for outstanding claims 891,923,333 (137,608,114)
Provision for unearned premium 148,224,541 1,660,354,785
Prepaid reinsurance (490,495,118) (1,160,366,726)
Provision for employee benefits 51,529,428 46,409,759
Dividend income 47,980,350 34,868,421
Investment income (14,268,679) (67,204,570)
Interest income 181,187,365 243,473,527
Amortization of premium 6,319,723 7,139,278
Gain on sale of investment - 18,378,357
(Decrease)/Increase in operating assets other than cash 1,198,182,172 (321,042,744)
(Decrease)/(Increase) in operating liabilities 196,914,990 637,992,208
766,904,383 803,029,665
Other adjustments:
Income tax paid 47,049,381 187,065,041
47,049,381 187,065,041
Profit/(Loss) before taxation 813,953,764 990,094,706
Provision for taxation (263,379,153) (339,305,623)
Profit/(Loss) after taxation 550,574,611 650,789,083
Definition of cash
Cash comprises of cash in hand, policy stamps, postage stamps, revenue stamp, bank balances and other
deposits which are readily convertible to cash in hand and which are used in the cash management function on a
day-to-day basis.
Cash for the purpose of the statement of cash flow consist of:
Cash and cash equivalents:
Cash and other equivalent 101,929 121,638
Current and other accounts 1,039,395,569 811,736,538
Rupees 1,039,497,498 811,858,176
The annexed notes 1 to 28 form an integral part of this condensed interim financial information.
CFO CEO DIRECTOR DIRECTOR CHAIRMAN

PAKISTAN REINSURANCE COMPANY LIMITED
NOTES TO THE FINANCIAL STATEMENTS
FOR THE PERIOD ENDED MARCH 31, 2021
1 STATUS AND NATURE OF BUSINESS
1.1
2 GEOGRAPHICAL LOCATION AND ADDRESSES OF BUSINESS UNITS
3 BASIS OF MEASUREMENT
3.1
3.2
3.3 Statement of compliance
Pakistan Reinsurance Company Limited (the Company) was incorporated in Pakistan as a public limited
company on March 30, 2000. The Company is engaged in providing of reinsurance and other insurance business.
The shares of the Company are quoted on Pakistan Stock Exchange Limited.
With effect from February 15, 2001, the Company took over all the assets and liabilities of former Pakistan
Insurance Corporation (PIC) vide SRO No.98(1)/2000 dated February 14, 2001 of the Ministry of Commerce
issued in terms of Pakistan Insurance Corporation Reorganization) Ordinance, 2000 to provide for conversion of
Pakistan Insurance Corporation into Pakistan Reinsurance Company Limited which was established in 1952 as
Pakistan Insurance Corporation (PIC) under PIC Act 1952. Accordingly, PIC has been dissolved and ceased to
exist and the operations and undertakings of PIC are being carried out by the Company.
The registered office of the Company is situated at PRC Towers, 32-A, Lalazar Drive, Maulvi Tamizuddin Khan
Road, Karachi. The zonal office of the Company is located at 1st Floor, 15-A, Davis Road, State Life Building,
Lahore, Pakistan.
This condensed interim financial information has been prepared under the historical cost convention, except that
‘held to maturity’ investments are stated at amortised cost and Investment ‘at fair value through profit or loss –
held for trading’ are stated at fair value and vailable for sale at market value.
This condensed interim financial information has been prepared following accrual basis of accounting except for
cash flow information.
Functional and presentation currency
This condensed interim financial information has been prepared and presented in Pakistan Rupees, which is the
Company’s functional and presentation currency.
This condensed interim financial information is unaudited and is being submitted to the shareholders as required under
section 237 of the Companies Act, 2017 and the listing regulations of the Pakistan Stock Exchange.
This condensed interim financial information does not include all the information and disclosures required for full
annual financial statements and should be read in conjunction with the annual financial statements of the Company as at
and for the year ended December 31, 2019 which have been prepared in accordance with approved accounting standards
as applicable to insurance companies in Pakistan.
This condensed interim financial information of the Company for the quarter ended March 31, 2020 has been prepared
in accordance with the requirements of the International Accounting Standard 34 – (IAS 34): Interim Financial
Reporting, provisions of and directives issued under the Companies Act, 2017, the Insurance Ordinance, 2000 and the
SEC (Insurance) Rules, 2017. In case where requirements differ, the provisions of or directives issued under the
Companies Act, 2017, the Insurance Ordinance, 2000 and the SEC (Insurance) Rules, 2017 have been followed.

PAKISTAN REINSURANCE COMPANY LIMITED
NOTES TO THE FINANCIAL STATEMENTS
FOR THE PERIOD ENDED MARCH 31, 2021
4 USE OF ESTIMATES AND JUDGMENTS
5
6
Mar. 31, 2021 Dec. 31, 2020
Rupees Rupees
Opening balance as at 65,702,538 63,881,050
Additions during the period
Furniture, fixtures and office equipments 291,290
Motor vehicles (owned) -
Right-of-use Asset(Leasehold land)
Capital work in process(Compurter equipment) 72511 727,752
Leasehold improvements
72,511 1,019,042
65,775,049 64,900,092
Less:
transferred (8,474,169)
Deprecation charge for the period 4,117,126 7,671,723
61,657,923 65,702,538
7 INVESTMENT PROPERTIES
Mar. 31, 2021 Dec. 31, 2020
Rupees Rupees
Cost 158,716,140 158,716,140
Depreciation (133,219,469) (131,866,547)
Balance at beginning of year 25,496,671 26,849,593
Depreciation for the period/year (319,365) (1,352,922)
25,177,306 25,496,671
25,177,306 25,496,671
Actual results may differ from these estimates. The estimates and underlying assumptions are reviewed on ongoing
basis. Revisions to accounting estimates are recognized in the period in which the estimate is revised, if the revision
affects only that period, or in the period of the revision and future periods if the revision affects both current and future
periods.
In preparing this condensed interim financial information, the significant judgments made by management in applying
the Company's accounting policies and the key sources of estimating uncertainty were the same as those applied to the
financial statements of the Company for the year ended December 31, 2020.
SIGNIFICANT ACCOUNTING POLICIES
The accounting policies and method of computation adopted by the Company in the preparation of this
condensed interim financial information are the same as those applied in the preparation of the preceding annual
audited financial statements of the Company as at and for the year ended December 31, 2020 .
Amendments to certain existing standards and new standards and interpretations on approved accounting
standards became effective during the period either were not relevant to the Company's operations or did not
have any significant impact on the accounting policies of the Company
PROPERTY AND EQUIPMENT
Carrying Value
The market value of investment properties is Rs.1.229.30 million, as per valuation carried out by an independent valuer
as at December 31, 2020.
The preparation of condensed interim financial information in conformity with the requirements of approved accounting
standards as applicable in Pakistan requires management to make judgments / estimates and associated assumptions that
affect the application of policies and reported amounts of assets and liabilities, income and expenses. The judgments /
estimates and associated assumptions are based on historical experience, current trends and various other factors that
are believed to be reasonable under the circumstances, the result of which form the basis of making the estimate about
carrying values of assets and liabilities that are not readily apparent from other sources.
The comparative statement of financial position presented in this condensed interim financial information has been
extracted from the annual audited financial statements of the Company for the year ended December 31, 2020, whereas
the comparative condensed interim profit and loss accounts, condensed interim statement of comprehensive income,
condensed interim statement of cash flows and condensed interim statement of changes in equity are extracted from the
unaudited condensed interim financial information for the quarter ended March 31, 2021.

8 INVESTMENT IN EQUITY SECURITIES
8.1 Investments - Held For Trading
Cost Unrealized Gain /
LossCarrying Value Cost
Impairment /
provision
Unrealized Gain /
LossCarrying Value
Listed Share 174,704,867 (10,240,539) 164,464,328 192,711,620 (18,006,753) 174,704,867
Total of Held For Trading 174,704,867 (10,240,539) 164,464,328 192,711,620 (18,006,753) 174,704,867
8.2 Investments - Available For Sale
Cost Unrealized Gain /
LossCarrying Value Cost
Impairment /
provision
Unrealized Gain /
LossCarrying Value
Listed shares 373,163,266 1,619,935,713 1,993,098,979 373,163,266 - 1,781,322,761 2,154,486,027
Unlisted Shares 2,608,104 1,990,492 617,613 2,608,104 1,990,491 - 617,613
Mutual Funds 1,592,488,809 307,657,758 (434,231,648) 1,465,914,919 1,592,488,810 307,657,758 (466,707,233) 1,433,439,335
Total Available For Sale 1,968,260,179 309,648,250 1,185,704,065 3,459,631,511 1,968,260,180 309,648,249 1,314,615,528 3,588,542,975
Total Equity Securities 2,142,965,046 309,648,250 1,175,463,526 3,624,095,839 2,160,971,800 309,648,249 1,296,608,775 3,763,247,842
3624219210
###########
########### 123,371.00
1,863,706 123,371
###########
###########
########### 123,371.00
123,371
Rupees Rupees
March 31,2020 (Uaudited) Dec 31,2020
Rupees Rupees
March 31,2020 (Uaudited) Dec 31,2020

9 Investments in Debt Securities
9.1 Pakistan Investment Bond - Held To Maturity
Amortized cost Carrying Value Amortized cost as at Carrying Value
Rupees
1 Pakistan Investment Bonds - Fixed 2,024,018,163 2,024,018,163 2,024,018,163 2,017,569,742
2 Pakistan Investment Bonds - Float 551,325,992 551,325,992 551,691,150 551,454,689
3 Term Finance Certificate 99,920,000 99,920,000 99,920,000 99,920,000
4 Treasury Bills 5,374,516,775 5,374,516,775 4,973,013,535 4,973,013,535
Total 8,049,780,930 8,049,780,930 7,648,642,848 7,641,957,966
9.2 Pakistan Investment Bond - Available For Sale
Amortized cost Carrying Value Amortized cost as at Carrying Value
Rupees
1 Pakistan Investment Bonds 592,727,736 621,846,295 553,208,750 629,547,902
Total
Grand Total Debt Securities 8,642,508,666 8,671,627,225 8,201,851,598 8,271,505,868
Rupees
March 31,2021 (Uaudited) 31-Dec-20
Rupees
March 31,2021 (Uaudited) 31-Dec-20
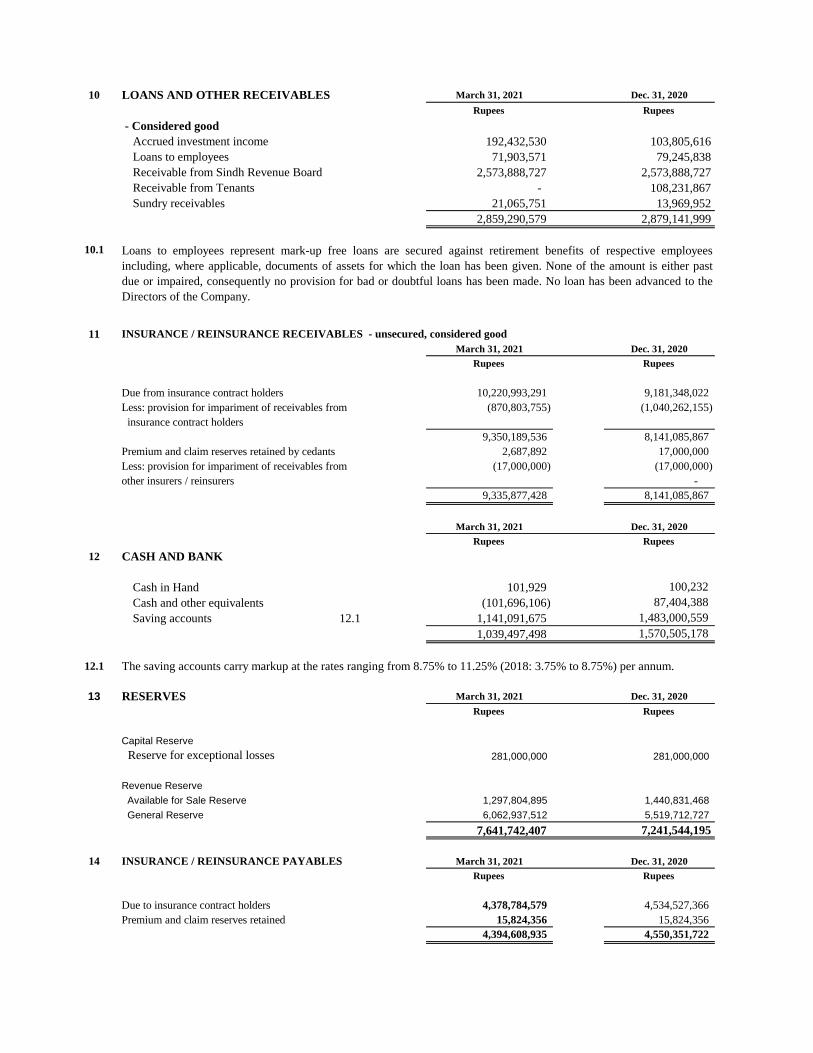
10 LOANS AND OTHER RECEIVABLES March 31, 2021 Dec. 31, 2020
Rupees Rupees
- Considered good
Accrued investment income 192,432,530
Loans to employees 71,903,571
Receivable from Sindh Revenue Board 2,573,888,727
Receivable from Tenants - 108,231,867
Sundry receivables 21,065,751
2,859,290,579
10.1
11 INSURANCE / REINSURANCE RECEIVABLES - unsecured, considered good
March 31, 2021 Dec. 31, 2020
Rupees Rupees
10,220,993,291 9,181,348,022
Less: provision for impariment of receivables from (870,803,755) (1,040,262,155)
insurance contract holders
9,350,189,536 8,141,085,867
Premium and claim reserves retained by cedants 2,687,892 17,000,000
Less: provision for impariment of receivables from (17,000,000) (17,000,000)
other insurers / reinsurers -
9,335,877,428 8,141,085,867
March 31, 2021 Dec. 31, 2020
Rupees Rupees
12 CASH AND BANK
Cash in Hand 101,929
Cash and other equivalents (101,696,106)
Saving accounts 12.1 1,141,091,675
1,039,497,498
12.1
13 RESERVES March 31, 2021 Dec. 31, 2020
Rupees Rupees
Capital Reserve
281,000,000
Revenue Reserve
Available for Sale Reserve 1,297,804,895
General Reserve 6,062,937,512
7,641,742,407
14 INSURANCE / REINSURANCE PAYABLES March 31, 2021 Dec. 31, 2020
Rupees Rupees
4,378,784,579 4,534,527,366
15,824,356 15,824,356
4,394,608,935 4,550,351,722
7,241,544,195
Due to insurance contract holders
Premium and claim reserves retained
The saving accounts carry markup at the rates ranging from 8.75% to 11.25% (2018: 3.75% to 8.75%) per annum.
Reserve for exceptional losses 281,000,000
1,440,831,468
5,519,712,727
1,570,505,178
103,805,616
79,245,838
2,573,888,727
13,969,952
2,879,141,999
Loans to employees represent mark-up free loans are secured against retirement benefits of respective employees
including, where applicable, documents of assets for which the loan has been given. None of the amount is either past
due or impaired, consequently no provision for bad or doubtful loans has been made. No loan has been advanced to the
Directors of the Company.
Due from insurance contract holders
100,232
87,404,388
1,483,000,559

15 OTHER CREDITORS AND ACCRUALS March 31, 2021 Dec. 31, 2020
Rupees Rupees
Unpaid and unclaimed dividend 155,208,129 147,891,866
Other Creditors and Accruals 40,982,942 42,119,119
Security Deposits 15.1 19,425,891 20,075,526
Accrued expenses 8,412,844 18,426,940
Surplus profit payable 7,580,785 7,580,785
76,402,462 88,202,370
15.1 This represents deposits received from tenants in connection with letting of PRC Towers and earnest money deposits for
the purpose of securing tenders of suppliers and contractors, which is in the normal course of business and does not carry
any interest or mark-up.

16 CONTINGENCIES AND COMMITMENTS
KPT
SRB
The Company has dispute in respect of the unilateral increase in rentals of its lease hold land by
Karachi Port Trust (KPT) being exorbitant and unreasonable, a view supported by the Company's
legal advisor. The amount not acknowledged in this regard however the Company has recorded
provision in this regard as at December 31, 2019 amounting to Rs. 29.950 million (December 31,
2018: Rs. 26.935 million).
Currently, a stay is operating in favour of the Company and the matter is pending before the
Honourable High Court of Sindh, for the issue and hearing of application. The matter is currently being
contested by both parties and there has been no negotiation to settle the matter out of the Court. Most
likely outcome of the case, may be in accordance with the market rate in the vicinity. The case is
pending in the Honourable High Court of Sindh and a hearing has been fixed on April 09, 2021 and
the matter is still pending.
The Company received a notice from Sindh Revenue Board (SRB) relating to non-filing of Sales Tax
return on services provided by PRCL to Insurance Companies. The Company contested the notice,
however, the decision was made against the Company giving rise to sales tax liability amounting to
Rs. 3,242 million and tax penalty of Rs. 880 million for financial year 2011 and 2012. The Company
filed an appeal with Commissioner of Appeals, Sindh Revenue Board, however, it was rejected. The
Company again filed an appeal with the Appellate Tribunal where the decision was made against the
Company vide order number AT-02/2013/109/2013 dated February 03, 2016. As a result, the
Company filed reference in the Honourable High Court of Sindh against the orders of Appellant
Tribunal.
In the aforementioned tribunal orders, the SRB was directed to reconcile and separate the sales tax
liability on reinsurance premium generated within the province of Sindh and rest of Pakistan.
Subsequently, the Company received two orders in pursuance of Appellate Tribunal (SRB) Order
against Appeal No. AT-02/2013 and AT-109/2015 dated May 23, 2016 from Sindh Revenue Board
(SRB) demanding the amount of sales tax liability on re-insurance services provided / rendered by the
Company in Sindh from the period from July 2011 to November 2011 and for the period from
December 2011 to December 2012 which were worked out and calculated by SRB amounting to Rs.
372.2 million and Rs. 1,118.1 million respectively. The Company has filed reference in the Honourable
High Court of Sindh, dated April 18, 2016 against the Orders of Appellant Tribunal.
Further, the Company has also received a notice from Sindh Revenue Board (SRB) for the period
from January 2013 to December 2013. The Company contested the notice; however, the order was
passed against the Company giving rise to sales tax liability amounting to Rs. 1,385 million and tax
penalty amounting to Rs. 424 million. The Company filed an appeal against the order with
Commissioner of Appeals, Sindh Revenue Board which was decided against the Company. The
Company being aggrieved by the said order has filed an appeal before Appellant Tribunal-SRB which
has been heard and order is awaited. Stay of tax demand has been obtained in this regard which was
valid up to April 05, 2017.
During the year 2017, the Company has paid an amount of Rs. 2,131.464 million under protest
against the principal amount of sales tax liability in respect of above notices issued by SRB for tax
years 2011, 2012 and 2013. The Company has also apprised Ministry of Commerce through letter
dated April 14, 2017, on the matter of disputed sales tax demand raised by SRB. Ministry of
Commerce through letter dated on May 03, 2017, directed to take action as per Board of Directors
decision and also directed that the Company may keep contesting the case in High Court vigorously.

Employee Old Age Benefit Institution The Company has received a notice from the Regional Director of Employee Old Age Benefit
Institution (EOBI) vide letter dated October 31, 2009 that Pakistan Reinsurance Company Limited is
required to be registered with EOBI. The Company is of the view that since it is a statutory body
corporate under the management and control of Ministry of Commerce, Government of Pakistan and
have its own pensioner rules and limitation and therefore provisions of EOBI Act, 1976 are not
applicable. A suit was filed with the Honourable Civil Court in 2011 where the judgment was passed
against the Company.
Further, if the matter is decided against the Company, the charge to accumulated profits would
amount to Rs. 14,042.042 million (approximately) pertaining to the years 2011 to 2020 excluding any
additional penalty or default surcharge. The pending legal proceeding may result in claims that the
Company is unlikely to be able to satisfy. Further, in that case, the overall equity may erode and turn
into negative and the Company would also face liquidity crunch and be unable to meet its solvency
requirements in addition to "going concern assumption" basis of accounting.
Based on the legal opinion of the Company’s legal advisor, management is confident that strong
grounds exist to contest the case and that the eventual resolution of the matter would be in favour of
the Company. Accordingly, no provision for sales tax liability for the years 2011 to 2020 has been
recorded in these financial statements.
After obtaining legal opinion and approval from Board of Directors and Ministry of Commerce, the
Company wrote a letter dated May 17, 2017, to the Commission (SRB) that the Company is in
agreement to make payment of the principal amount of the demand under protest subject to the
condition that SRB will withdraw all notices issued u/s 66 of Sindh Sales Tax Act, 2011, to the clients
and debtors of the Company for the attachment of payables to Company, SRB will not initiate any
further proceedings in relation to the amount of default surcharge and penalty until the liability of tax
on reinsurance services is finally decided by the Honourable High Court of Sindh and SRB will not
initiate any further proceedings against the Company for the tax periods subsequent to these three tax
periods and matter shall be decided after the decision of the Honourable High Court of Sindh.
During previous year, the SECP vide letter No. ID/PRDD/TAXATION/2020/15 dated March 13, 2020
highlighted taxation issues to SRB faced by the insurance industry in Pakistan. SECP highlighted that,
insurance companies obtained reinsurance services to mitigate their risk by sharing it with other
insurance/reinsurance companies, hence, forming part of the overall risk management function of
insurance companies. The imposition of sales tax on reinsurance services through service charge
mechanism, may lead to double taxation on the insurance business, in the context of foreign
reinsurance.
Imposition of sales tax on the reinsurance services would increase the cost of doing business for
insurance companies, which may reflect as an increase in the rates of insurance premiums, making
insurance more costly for the policyholders. As lowering the cost of business is the primary agenda of
the Government of Pakistan and as such, the imposition of sales tax on reinsurance services would
be working at odds with measures taken by the Government of Pakistan for ease of doing business in
Pakistan.
SRB vide letter SRB/TP/57/2016 dated April 26, 2020 advised the Company with the provisions of
Sindh Sales Tax Act, 2011 by issuing tax invoices, e-filing of tax returns and e-depositing the SST
invoice.. The aggregate amount of Rs. 2,573.889 million paid has been recorded as “receivable from
SRB” in the financial statements. Moreover, the Company has not recorded provision against the
orders passed by SRB in pursuance of Appellate Order dated February 01, 2016 in Appeal No. AT-
02/2013 and order dated February 03, 2016 in Appeal No. AT-109/2015.

The Company has received a notice from the Regional Director of Employee Old Age Benefit
Institution (EOBI) vide letter dated October 31, 2009 that Pakistan Reinsurance Company Limited is
required to be registered with EOBI. The Company is of the view that since it is a statutory body
corporate under the management and control of Ministry of Commerce, Government of Pakistan and
have its own pensioner rules and limitation and therefore provisions of EOBI Act, 1976 are not
applicable. A suit was filed with the Honourable Civil Court in 2011 where the judgment was passed
against the Company.
Further, the Company filed an appeal in the Honourable High Court of Sindh against the Civil Court
judgment and there has been no further proceeding in the court but the management expects a
favourable outcome. On the basis of meeting held with EOBI officials, the Company is considering
registration of its contractual employees with EOBI which is pending approval from Ministry of
Federal Excise Duty
Federal Board of Revenue (FBR) has issued show-cause notices dated November 22, 2017, whereby
the Company is required to explain as to why Federal Excise Duty (FED) on aggregate reinsurance
premium revenue has not been paid in respect of tax periods from October 2012 to September 2017.
The Company has submitted its reply against show-cause challenging levy of FED on various legal
grounds. Further, the Company also filed Constitutional Petition against show cause notices in the
Honourable High Court of Sindh and the Honourable High Court of Sindh vide order dated January 29,
2019 has suspended the proceedings initiated through the above show-cause notice.

March 31, 2021 March 31, 2020
Rupees Rupees
17 NET PREMIUM REVENUE
Written gross premium 3,648,043,791 2,683,361,677
Add: Unearned premium reserve opening 6,513,672,434 8,451,658,849
Less: Unearned premium reserve closing 6,365,447,892 6,791,304,063
Premium earned 3,796,268,333 4,343,716,463
Less: Reinsurance premium ceeded 1,756,103,448 1,419,276,212
Add: Prepaid reinusurance premium opening 4,144,132,224 5,453,474,265
Less Prepaid reinusurance premium closing 3,653,637,106 4,293,107,539
Reinsurance expense 2,246,598,566 2,579,642,938
1,549,669,767 1,764,073,525
18 NET INSURANCE CLAIMS
Claims paid 1,581,064,956 516,122,968
Add: Outstanding claims including IBNR closing 9,583,646,797 8,154,207,023
Less: Outstanding claims including IBNR opening 10,480,686,890 8,016,598,909
Claims expense 684,024,863 653,731,082
Less: Reinsurance and other recoveries received 1,119,434,515 -
Add: Reinsurance andother recoveries in
respect of outstanding claims closing 4,519,891,413 3,936,247,052
Less: Reinsurance andother recoveries in
respect of outstanding claims opening 5,603,808,031 3,934,364,721
Reinsurance and other recoveries revenue 35,517,897 1,882,331
648,506,966 651,848,751
19 NET COMMISSION AND OTHER ACQUISTION COSTS
Commission paid or payable 351,906,470 281,515,610
Add: Deferred commission expense opening 708,870,616 918,544,431
Less: Deferred commission expense closing 641,762,070 719,055,375
Net commission 419,015,016 481,004,666
Less: Commission received or recoverable 91,242,643 98,625,562
Add: Unearned reinsurance commission opening 338,532,613 452,020,316
Less: Unearned reinsurance commission closing 244,952,220 343,736,996
Commission from reinsureres 184,823,036 206,908,882
234,191,980 274,095,784
Unaudited
3 months

20
21 TAXATION
For the quarter
Current
The status of orders passed under section 122 of the Income Tax Ordinance, 2001 is as follows:
S. no. Tax year Tax Demand (Rupees)
1 2010 20,748,022
2 2011 97,770,680
3 2012 127,326,208
4 2013 9,342,660
5 2014 412,724,772
6 2015 772,134
7 2016 223,912,913
This pertains to the non deduction of tax on commission and charge id Workers'
Welfare Fund.
This pertains to the disallowance of exchange loss of Rs. 50,578,845 on the ground that
it was notional in nature and a provision without considering that the loss is allowable
as per provisions of the Ordinance. The Company is contesting the gross loss has been
incurred due to following of the mercantile system therefore it is to be allowed and the
Company's has relied on the judgement of the Tribunal reported as 2011 PTD 352 and
unreported judgement in ITA no. 133 KB 2011.
Loss on re-measurement of defined benefit obligations of Rs. 675,584,000 and
Provision for compensated absences of Rs. 60,868,000 was disallowed. The Company
contends that loss is computed by a qualified actuary and is a determined liability. The
above disallowance is found well by the ADCIR. The issue is pending in ATIR,
however same issue have been decided in Company's favour in tax year 2015.
Appeal effect given vide order dated April 6, 2017. Full bench had been formed
due to a conflicting decision of Hon. Tribunal in respect of issue of
Commission, however, hearing of main appeal had not been fixed yet.
Income Tax
Status of the case
CIRA has decided issues against Company which are pending in ATIR.
Tax liability of Rs. 97,770,680 is arising due to unavailability of brought forward
toss relating to TY 2010 due to assessment order passed for the aforesaid tax
year.
Tax liability of Rs. 127,326,208 is arising due to unavailability of loss of Rs.
212,481,202 relating to Tax Year 2010 and tax refund of Rs. 52,957,787 relating
to Tax Year 2011, due to assessment orders passed for these tax years.
Appeal effect order with regard to CIRA & ATIR orders are pending. Tax
liability of Rs. 42,040,463 is arising due to unavailability of tax refunds of Rs.
1,025,968 and Rs. 41,014,495 relating to Tax Years 2010 and 2012 respectively,
due to assessment orders passed for these tax years.
Rupees Rupees
263,379,153 339,305,623
March 31, 2021 March 31, 2020
Return on Deposits 4,096,882 8,392,500
Miscellaneous income - 27,360
Exchange gain - 5,712,474
4,096,882 14,132,334
OTHER INCOME
March 31, 2021 March 31, 2020
Rupees Rupees

S. No. Tax year Tax Demand (Rupees)
1,246,209,535
The status of orders passed under section 161 of the Income Tax Ordinance, 2001 is as follows:
S. no. Tax year Tax Demand (Rupees)
1 2014 260,214,169
2 2015 39,541,845
3 2016 182,699,756
482,455,770
1,728,665,305
Company received various notices in respect of non deducution of with holding tax on
commission paid to ceding companies. CIRA has decided issue of Commission
expense against Company and appeal is pending in ATIR. Full bench had been
formed due to a conflicting decision of Hon. Tribunal in respect of issue of
Commission, however, hearing of main appeal had not been fixed yet.
Grand total
The above matters are pending before various forums. On the basis of the opinion of tax advisor, the Company is confident that the
eventual outcome will be in favour of the Company.
Status of the case
Status of the case
This pertains to the non deduction of tax on commission and the commission expense
has been disallowed. It was clarified to ACIR that reinsurance commission is
reimbursement of expenses and is not in the nature of Commission as also clarified by
SECP. It was further informed to ACIR that the so called commission expense was not
in the nature of commission in terms of section 233 of the Ordinance.
It was further informed to ACIR that the issue is already decided by Tribunal in
Company's favour in respect of Tax years 2008, 2009, 2011 and 2012, which were
required to be followed as per section 124A of the Ordinance. ACIR does not agree
with Company's view and disallowed Commission expense on the ground that the tax
was not withheld on the amount by relying on the decision of Tribunal in the
Company's own case in respect of Tax year 2014/15. The Company has filed an appeal
before CIRA and the matter is still pending.
2018 353,612,146 8

22 FAIR VALUE HIERARCHY
Financial assets and financial liabilities are classified in their entirety into only one of the three levels
The fair value hierarchy has the following levels:
- Level 1 - quoted prices (unadjusted) in active markets for identical assets or liabilities
-
-
As at March 31,
2021 Level 1 Level 2 Level 3
164,464,328 164,464,328.00 - -
1,993,098,979 1,993,098,979 - - 1,465,914,919 1,465,914,919 - -
617613 - - 617,613
2,645,864,458 - 2,645,864,458 -
551,325,992 - 551,325,992 -
5,374,516,775 - 5,374,516,775 -
TFC 99,920,000 99,920,000 -
Available for Sale
Pakistan Investment Bond-Fiexed 621,846,295 - 621,846,295 -
174,704,867.00 174,704,867 - -
2,154,486,027 2,154,486,027 -
1,433,439,335 1,433,439,335 -
617,613 - 617,613
2,647,117,644 - 2,647,117,644
551,454,689 - 551,454,689
4,973,013,535 - 4,973,013,535
TFC 99,920,000 99,920,000
Level 3 - inputs for the asset or liability that are not based on observable market data (unobservable
inputs).
The table below analyses financial instruments measured at the end of the reporting period by the level in the fair
value hierarchy into which the fair value measurement is categorised:
The level in the fair value hierarchy within which the financial asset or financial liability is categorised is determined
on the basis of the lowest level input that is significant to the fair value measurement.
Level 2 - inputs other than quoted prices included within Level 1 that are observable for the asset or
liability, either directly (i.e. as prices) or indirectly (i.e. derived from prices)
Ordinary shares - unlisted
Treasury Bills
-------------------------------------------------Rupees-------------------------------------------------
Investments at fair value through profit or loss - held for trading
Ordinary shares - listed
Investments at fair value- available for sale
Ordinary shares - listed
Mutual fund units
Ordinary shares - unlisted
Investments- held to maturity
Pakistan Investment Bonds-Fixed
Pakistan Investment Bonds
Treasury Bills
Mutual fund units
As at Dec. 31, 2020 Level 1 Level 2 Level 3
-------------------------------------------------Rupees-------------------------------------------------
Investments at fair value through profit or loss - held for trading
Ordinary shares - listed
Investments at fair value - available for sale
Ordinary shares - listed
Investments- held to maturity
Financial assets measured at fair value
Financial assets measured at fair value
Pakistan Investment Bonds Floater
Pakistan Investment Bonds

Pakistan Reinsurance Company Limited
Notes to the Financial Statements
For the period ended March 31, 2021
23 SEGMENT REPORTING
Segment Current Year Fire and
property damage Marine Cargo Marine Hull Accident Aviation Engineering Treaty Prop
Treaty Non-
prop
Gross written premium 355,683,725 7,507,093 55,704,338 50,191,219 74,740,585 1,714,208,067 1,209,105,636 180,903,128 3,648,043,791
Unearned-Opening 566,711,447 7,963,063 93,166,700 44,987,784 236,576,190 3,618,269,871 1,506,408,842 439,588,537 6,513,672,434
Unearned-Closing 655,335,670 9,023,397 3,164,687 53,404,121 190,380,520 3,237,978,329 1,805,106,082 411,055,086 6,365,447,892
Premium Earned 267,059,502 6,446,759 145,706,351 41,774,882 120,936,255 2,094,499,609 910,408,396 209,436,579 3,796,268,333
Reinsurance-Ceded 172,735,265 - 30,680,092 - 29,712,526 1,522,975,565 - - 1,756,103,448
Prepaid Reinsurance-Opening 17,885,008 - 54,446,935 2,938,875 168,543,304 3,465,398,241 336,674,207 98,245,654 4,144,132,224
Prepaid Reinsurance-Closing 244,787,743 - - 1,477,556 116,610,324 3,021,175,314 208,688,353 60,897,816 3,653,637,106
Reinsurance Expenses (54,167,470) - 85,127,027 1,461,319 81,645,506 1,967,198,492 127,985,854 37,347,838 2,246,598,566
Net insurance premium 321,226,972 6,446,759 60,579,324 40,313,563 39,290,749 127,301,117 782,422,542 172,088,741 1,549,669,767
Commission income 4,788,381 - - 147,756 10,323,164 169,556,223 7,512 - 184,823,036
Net underwriting income 326,015,353 6,446,759 60,579,324 40,461,319 49,613,913 296,857,340 782,430,054 172,088,741 1,734,492,803
Insurance claims paid 38,618,335 135,093 59,430 6,508,701 1,035,523,011 10,248,082 397,691,494 92,280,810 1,581,064,956
Outstaning-opening 1,765,854,730 140,719,544 81,818,633 327,965,630 4,220,242,139 1,108,830,004 2,302,231,060 533,025,150 10,480,686,890
Outstaning-closing 1,881,506,089 81,430,547 53,400,530 322,173,580 3,044,657,371 1,199,471,165 2,435,801,274 565,206,241 9,583,646,797
Insurance claims expenses 154,269,694 (59,153,904) (28,358,673) 716,651 (140,061,757) 100,889,243 531,261,708 124,461,901 684,024,863
Reinsurance Recoveries Received - - - - 1,119,434,515 - - - 1,119,434,515
Recovery-opening 245,413,842 66,733,022 29,989,753 - 3,974,870,199 845,050,591 376,534,914 65,215,710 5,603,808,031
Recovery-closing 245,413,842 5,083,022 10,949,753 - 2,929,344,215 906,458,602 360,247,281 62,394,698 4,519,891,413
Insurance claims recovered from reinsuers - (61,650,000) (19,040,000) - 73,908,531 61,408,011 (16,287,633) (2,821,012) 35,517,897
Net claims 154,269,694 2,496,096 (9,318,673) 716,651 (213,970,288) 39,481,232 547,549,341 127,282,913 648,506,966
Commission expense 50,340,193 526,305 9,801,572 3,931,258 4,507,019 115,400,582 233,250,905 1,257,182 419,015,016
Mangement expense 10,130,125 213,807 1,586,499 1,429,482 2,128,665 48,821,865 34,436,188 5,152,250 103,898,881
Preium deficiency expense - - - - - - - - -
Net insurance claims and expenses 214,740,012 3,236,208 2,069,398 6,077,391 (207,334,604) 203,703,679 815,236,434 133,692,345 1,171,420,863
Underwriting results 111,275,341 3,210,551 58,509,926 34,383,928 256,948,517 93,153,661 (32,806,380) 38,396,396 563,071,940
Net investment income 217,154,903
Rental income 23,181,435
General and Admin expenses (901,224)
Other expenses (Emp. Laon) -
Other income 4,096,882
Profit before tax 806,603,936
Segment Assets 326,015,353 6,446,759 60,579,324 40,461,319 49,613,913 296,857,340 782,430,054 172,088,741 1,734,492,803
Unallocated Assets 33,131,506,081
34,865,998,884
Segment Liabilites 214,740,012 3,236,208 2,069,398 6,077,391 (207,334,604) 203,703,679 815,236,434 133,692,345 1,171,420,863
Unallocated Liabilitied 23,044,936,917
24,216,357,780
TOTAL
-----------------------------------------------------------------------------------31 March 2021---------------------------------------------------------------------------------
----------------------------------------------------------------------------------------Rupees-----------------------------------------------------------------------------------------

Segment Prior Year Fire and
property damage Marine Cargo Marine Hull Accident Aviation Engineering Treaty Treaty
Gross written premium 570,271,205 5,739,233 (286,644) 37,374,457 18,447,536 1,000,515,393 900,376,849 150,923,648 2,683,361,677
Unearned-Opening 563,735,480 6,552,853 118,792,816 56,340,140 2,980,344,955 2,670,711,570 1,770,947,012 284,234,023 8,451,658,849
Unearned-Closing 703,037,006 6,796,116 9,265,208 54,085,476 2,214,389,400 1,853,464,345 1,684,814,984 265,451,528 6,791,304,063
Premium Earned 430,969,679 5,495,970 109,240,964 39,629,121 784,403,091 1,817,762,618 986,508,877 169,706,143 4,343,716,463
Reinsurance-Ceded 485,847,437 - (5,633,021) - 28,541,269 903,929,615 6,590,912 - 1,419,276,212
Prepaid Reinsurance-Opening 20,949,844 - 79,508,541 3,272,048 2,501,613,136 2,453,680,257 394,450,439 - 5,453,474,265
Prepaid Reinsurance-Closing 376,524,361 - 3,535,698 1,636,024 1,879,625,358 1,794,137,773 237,648,325 - 4,293,107,539
Reinsurance Expenses 130,272,920 - 70,339,822 1,636,024 650,529,047 1,563,472,099 163,393,026 - 2,579,642,938
Net insurance premium 300,696,759 5,495,970 38,901,142 37,993,097 133,874,044 254,290,519 823,115,851 169,706,143 1,764,073,525
Commission income 7,305,586 - 9,340,481 163,603 64,851,675 125,083,800 163,737 - 206,908,882
Net underwriting income 308,002,345 5,495,970 48,241,623 38,156,700 198,725,719 379,374,319 823,279,588 169,706,143 1,970,982,407
Insurance claims paid 64,628,680 361,103 8,271 680,794 - 480,242 441,789,849 8,174,029 516,122,968
Outstaning-opening 1,317,826,301 105,809,839 62,691,477 305,059,745 1,413,414,449 2,622,625,776 2,149,402,908 39,768,414 8,016,598,909
Outstaning-closing 1,314,758,964 109,105,400 74,489,173 312,257,944 1,416,859,783 2,709,766,952 2,176,695,425 40,273,382 8,154,207,023
Insurance claims expenses 61,561,343 3,656,664 11,805,967 7,878,993 3,445,334 87,621,418 469,082,366 8,678,997 653,731,082
Reinsurance Recoveries Received - - - - - - - - -
Recovery-opening 206,495,743 39,267,000 23,402,252 612,403 1,242,590,061 2,254,192,711 167,804,551 - 3,934,364,721
Recovery-closing 206,495,743 39,267,000 23,402,252 612,403 1,244,472,392 2,254,192,711 167,804,551 - 3,936,247,052
Insurance claims recovered from reinsuers - - - - 1,882,331 - - - 1,882,331
Net claims 61,561,343 3,656,664 11,805,967 7,878,993 1,563,003 87,621,418 469,082,366 8,678,997 651,848,751
Commission expense 51,209,079 502,006 9,647,862 3,557,783 39,024,819 101,206,383 274,178,017 1,678,717 481,004,666
Mangement expense 18,848,199 344,497 2,438,392 2,381,474 8,391,459 15,939,374 53,097,599 9,134,220 110,575,214
Preium deficiency expense - - - - - - - - -
Net insurance claims and expenses 131,618,621 4,503,167 23,892,221 13,818,250 48,979,281 204,767,175 796,357,982 19,491,934 1,243,428,631
Underwriting results 176,383,724 992,803 24,349,402 24,338,450 149,746,438 174,607,144 26,921,606 150,214,209 727,553,775
Net investment income 236,655,012
Rental income 20,384,996
General and Admin expenses (238,911)
Other income 14,132,334
Profit before tax 998,487,206
Segment Assets 308,002,345 5,495,970 48,241,623 38,156,700 198,725,719 379,374,319 823,279,588 169,706,143 1,970,982,407
Unallocated Assets 30,889,747,360
32,860,729,767
Segment Liabilites 131,618,621 4,503,167 23,892,221 13,818,250 48,979,281 204,767,175 796,357,982 19,491,934 1,243,428,631
Unallocated Liabilitied 22,353,399,857
23,596,828,488
----------------------------------------------------------------------------------------Rupees-----------------------------------------------------------------------------------------
TOTAL
-----------------------------------------------------------------------------------31 March 2020---------------------------------------------------------------------------------

24 Transaction with related parties are summarised as follows:
Nature of transaction
Dividend Income
Group Company
Insurance claims paid
Insurance commission paid
Premium due but unpaid
Insurance premium written during period
Premium received
25 EARNINGS PER SHARE - BASIC AND DILUTED
Profit after tax for the period
(Rupees)
Weighted average number
of ordinary shares
Earning per share - basic (Rupees)
26 FINANCIAL RISK MANAGEMENT
27 DATE OF AUTHORIZATION FOR ISSUE
28 GENERAL
All figures have been rounded off to the nearest rupee unless otherwise stated.
This condensed interim financial information has been authorized for issue on 30th April,
2021 by the Board of Directors of the Company.
300,000,000 300,000,000
1.84 2.23
No diluted earnings per share has been presented as the Company has not issued any
instrument which would have an impact on earnings per share when exercised.
The Company's financial risk management objectives and policies are consistent with that disclosed
in the annual financial statements for the year ended December, 31 2020.
550,950,679 668,422,623
1,691,786,605 1,001,638,335
(2,885,873,536) (1,911,820,700)
2,133,133,762 4,462,028,106
Basic earning per share is calculated by dividing the net profit for the period by the weighted
average number of shares outstanding as at the period end as follows:
Three Months ended Three Months ended
2021 2020
1,035,789,687 -
36,692,446 45,262,417
3,327,220,693 5,372,210,471
March 31, 2021 March 31, 2020
Rupees Rupees
31,680,000.00 27,720,000.00
CFO CEO DIRECTOR DIRECTOR CHAIRMAN