condensed consolidated interim financial statements q1
TRANSCRIPT
Q1Condensed Consolidated Interim Financial Statements (Unaudited) for the financial period ended March 31, 2020
Jadestone Energy Inc
(Registration Number: BC 0350583 Canada)
Contents Condensed Consolidated Statement of Profit and Loss and Other Comprehensive Income 2
Condensed Consolidated Statement of Financial Position 3
Condensed Consolidated Statement of Changes in Equity 4
Condensed Consolidated Statement of Cash Flows 5
Notes to the Condensed Consolidated Financial Statements 6 - 23

NOTES
THREE MONTHS ENDEDMARCH 31, 2020
USD'000
THREE MONTHS ENDEDMARCH 31, 2019*
USD'000
Consolidated statement of profit or loss
Revenue 4 74,220 56,366 Production costs 5 (30,553) (22,721)Depletion, depreciation and amortisation 6 (19,582) (11,892)Staff costs 7 (5,607) (4,568)Other expenses 8 (2,901) (2,744)Other income 9 820 303 Finance costs 10 (3,614) (4,547)Other financial gains 11 359 478
Profit before tax 13,142 10,675
Income tax expense 12 (12,810) (2,315)
Profit for the period 332 8,360
Earnings per ordinary shareBasic and diluted (US$) 13 0.00 0.02
Consolidated statement of comprehensive income
Profit for the period 332 8,360
Other comprehensive income/(loss)
Items that may be reclassified subsequently to profit or loss:Gain/(Loss) on unrealised cash flow hedges 23 35,300 (32,796)Hedging gain reclassified to profit or loss 23 (8,162) (5,752)
27,138 (38,548)Tax (expense)/credit relating to components of other comprehensive income/(loss) 12 (8,142) 11,564
Other comprehensive income/(loss) 18,996 (26,984)
Total comprehensive income/(loss) for the period 19,328 (18,624)
Condensed Consolidated Statement of Profit or Loss and Other Comprehensive Income for the financial period ended March 31, 2020
* Certain 2019 comparative information has been restated, as a result of reclassifications between line items. Please refer to Note 37. All comprehensive income is attributable to the equity holders of the parent. The accompanying notes are an integral part of the consolidated financial statements.
Condensed Consolidated Interim Financial Statements2

* Certain 2019 comparative information has been restated, as a result of reclassifications between line items. Please refer to Note 37. The accompanying notes are an integral part of the consolidated financial statements.
NOTESMARCH 31, 2020
USD'000DECEMBER 31, 2019*
USD’000
AssetsNon-current assetsIntangible exploration assets 14 134,040 117,440Oil and gas properties 15 365,328 381,674Plant and equipment 16 1,758 1,780Right-of-use assets 17 55,391 59,787Restricted cash 21 10,000 17,477Deferred tax assets 18 15,719 16,012
Total non-current assets 582,236 594,170
Current assetsInventories 19 31,841 31,411Trade and other receivables 20 24,534 42,283Derivative financial instruments 30 32,411 5,275Restricted cash 21 12,160 6,008Cash and cash equivalents 21 97,244 75,934
Total current assets 198,190 160,911
Total assets 780,426 755,081
Equity and liabilitiesEquityCapital and reservesShare capital 22 466,573 466,573Share-based payments reserve 24 24,233 23,857Hedging reserves 23 22,684 3,688Accumulated losses (268,319) (268,651)
Total equity 245,171 225,467
Non-current liabilitiesProvisions 25 281,562 280,418Borrowings 28 - 7,328Lease liabilities 26 38,649 42,533Other payable 27 - 359Deferred tax liabilities 18 70,605 64,825
Total non-current liabilities 390,816 395,463
Current liabilitiesBorrowings 28 36,566 41,795Lease liabilities 26 19,648 19,739Trade and other payables 29 35,943 27,962Tax liabilities 52,282 44,655
Total current liabilities 144,439 134,151
Total liabilities 535,255 529,614
Total equity and liabilities 780,426 755,081
Condensed Consolidated Statement of Financial Position as at March 31, 2020
3Jadestone Energy

SHARE CAPITALUSD’000
SHARE BASED PAYMENTS
RESERVEUSD’000
HEDGING RESERVES
USD’000
ACCUMULATED LOSSES
USD’000TOTAL
USD’000
As at January 1, 2019 466,562 22,375 35,480 (309,156) 215,261
Profit for the period, representing total comprehensive profit - - - 8,360 8,360Other comprehensive loss for the period - - (26,984) - (26,984)
Total comprehensive (loss)/income for the period - - (26,984) 8,360 (18,624)
Shares issued 11 - - - 11Share-based compensation, representing transaction with owners, recognised directly in equity (Note 24)
- 117 - - 117
As at March 31, 2019 466,573 22,492 8,496 (300,796) 196,765
As at January 1, 2020 466,573 23,857 3,688 (268,651) 225,467
Profit for the period, representing total comprehensive profit - - - 332 332Other comprehensive income for the period - - 18,996 - 18,996
Total comprehensive income/(loss) for the period - - 18,996 332 19,328
Share-based compensation, representing transaction with owners, recognised directly in equity (Note 24) - 376 - - 376
As at March 31, 2020 466,573 24,233 22,684 (268,319) 245,171
Condensed Consolidated Statement of Changes in Equity for the financial period ended March 31, 2020
The accompanying notes are an integral part of the consolidated financial statements.
Condensed Consolidated Interim Financial Statements4

NOTES
THREE MONTHS ENDEDMARCH 31, 2020
USD'000
THREE MONTHS ENDEDMARCH 31, 2019*
USD’000
Operating activities
Profit before tax 13,142 10,675Adjustments for:
Depletion, depreciation and amortisation 6 15,186 9,878Depreciation of right-of-use assets 6 / 17 4,396 2,014Other finance costs 10 2,686 2,539Interest expense 10 928 2,008Share based payments 7 376 117Inventories written down 5 351 -Loss on ineffective hedge recycled to profit or loss 8 2 471Change in Stag FSO provision 9 (443) -Decrease in fair value of Montara contingent payments 11 (359) (478)Interest income 9 (218) (303)Oil and gas properties written off 8 - 533
Operating cash flows before movements in working capital 36,047 27,454
Decrease in trade and other receivables 17,749 16,461Decrease/(Increase) in inventories 1,054 (8,865)Decrease in trade and other payables (7,752) (8,143)
Cash generated from operations 47,098 26,907Interest paid (686) (1,463)Tax refunded - 3,096
Net cash generated from operating activities 46,412 28,540
Investing activitiesPayment for oil and gas properties 15 (569) (6,498)Payment for plant and equipment 16 (84) (94)Payment for intangible exploration assets 14 (8,119) (950)Transfer from debt service reserve account 21 1,325 2,369Interest received 9 218 303
Net cash used in investing activities (7,229) (4,870)
Financing activitiesNet proceeds from issuance of shares - 11Repayment of borrowings 28 (12,830) (15,753)Repayment of lease liabilities (5,043) (2,419)
Net cash used in financing activities (17,873) (18,161)
Net increase in cash and cash equivalents 21,310 5,509
Cash and cash equivalents at beginning of the period 75,934 52,981
Cash and cash equivalents at end of the period 21 97,244 58,490
Condensed Consolidated Statement of Cash Flows for the financial period ended March 31, 2020
* Certain 2019 comparative information has been restated, as a result of reclassifications between line items. Please refer to Note 37. The accompanying notes are an integral part of the consolidated financial statements.
5Jadestone Energy

1 | Corporate InformationJadestone Energy Inc. (the “Company” or “Jadestone”) is an oil and gas company incorporated in Canada.
The Company’s ordinary shares are listed on AIM, a market by the London Stock Exchange. The Company trades under the symbol “JSE”. The Company was listed on the TSX-V, but delisted on March 25, 2020.
The financial statements are expressed in United States Dollars (“US$” or “USD”).
The Company and its subsidiaries (the “Group”) are engaged in production, development, exploration and appraisal activities in Australia, Vietnam and the Philippines. The Company’s current producing assets are in the Vulcan (Montara) and Carnarvon (Stag) basins, offshore Western Australia.
On November 18, 2019, the Group executed a sale and purchase agreement (“SPA”) with Österreichische Mineralölverwaltungs Aktiengesellschaft New Zealand (“OMV New Zealand”) to acquire an operated 69% controlling interest in the Maari project for a total consideration of US$50.0 million, and subject to customary working capital adjustments. The transaction is subject to regulatory approvals and joint venture partners’ acceptance. Following these approvals, the transaction will close and control of the Maari project will transfer to the Group. The economic benefits from January 1, 2019 until the closing date will be adjusted in the final consideration price. The Group anticipates to complete the acquisition in second half of 2020
The Company’s head office is located at 3 Anson Road, #13-01 Springleaf Tower, Singapore 079909. The registered office of the Company is 10th Floor, 595 Howe Street, Vancouver, British Columbia V6C 2T5, Canada.
2 | Summary of Significant Accounting Policies
Statement of ComplianceThese unaudited condensed interim financial statements (the “financial statements”) are prepared in accordance with International Accounting Standard IAS 34 Interim Financial Reporting, on a going concern basis under the historical cost convention. They do not contain all disclosures required by International Financial Reporting Standards (“IFRS”) for annual financial statements and should be read in conjunction with Jadestone’s audited consolidated financial statements for the year ended December 31, 2019.
These financial statements were approved for issuance by the Company’s Board of Directors on May 28, 2020, on the recommendation of the Audit Committee.
Notes to the Condensed Consolidated Interim Financial Statements for the financial period ended March 31, 2020
Condensed Consolidated Interim Financial Statements6

3 | Basis of PreparationThese financial statements have been prepared on an historical cost basis, except for financial instruments classified as financial instruments at fair value, which are stated at their fair values, and operating leases which are stated at the present value of future cash payments.
In addition, these financial statements have been prepared using the accrual basis of accounting.
Adoption of new and revised standards
New and amended IFRS standards that are effective for the current periodThe Group has applied the following standards and amendments for the first time with effect from January 1, 2020.
- Amendments to IFRS 3 Business Combinations;
- Amendments to IAS 1 and IAS 8 Definition of Material; and
- Amendments to References to the Conceptual Framework in IFRS Standards.
All amendments are effective for annual periods beginning on January 1, 2020 and generally require prospective application.
Amendments to IFRS 3 Business CombinationsThe amendments clarify that while businesses usually have outputs, outputs are not required for an integrated set of activities and assets to qualify as a business. To be considered a business, an acquired set of activities and assets must include, at a minimum, an input and a substantive process that together significantly contribute to the ability to create outputs.
Additional guidance is provided that helps to determine whether a substantive process has been acquired. The amendments introduce an optional concentration test that permits a simplified assessment of whether an acquired set of activities and assets is not a business. Under the optional concentration test, the acquired set of activities and assets is not a business, if substantially all of the fair value of the gross assets acquired is concentrated in a single identifiable asset or group of similar assets.
Amendments to IAS 1 and IAS 8 Definition of MaterialThe amendments are intended to make the definition of material in IAS 1 easier to understand and are not intended to alter the underlying concept of materiality in IFRS Standards. The concept of ‘obscuring’ material information with immaterial information has been included as part of the new definition.
The threshold for materiality influencing users has been changed from ‘could influence’ to ‘could reasonably be expected to influence’.
The definition of material in IAS 8 has been replaced by a reference to the definition of material in IAS 1. In addition, the IASB amended other Standards and the Conceptual Framework that contain a definition of material or refer to the term ‘material’ to ensure consistency.
Amendments to References to the Conceptual Framework in IFRS StandardsTogether with the revised Conceptual Framework, which became effective upon publication on March 29, 2018, the IASB has also issued Amendments to References to the Conceptual Framework in IFRS Standards. The document contains amendments to IFRS 2, IFRS 3, IFRS 6, IFRS 14, IAS 1, IAS 8, IAS 34, IAS 37, IAS 38, IFRIC 12, IFRIC 19, IFRIC 20, IFRIC 22, and SIC-32.
Not all amendments, however, update those pronouncements with regard to references to and quotes from the framework so that they refer to the revised Conceptual Framework. Some pronouncements are only updated to indicate which version of the Framework they are referencing to (the IASC Framework adopted by the IASB in 2001, the IASB Framework of 2010, or the new revised Framework of 2018) or to indicate that definitions in the Standard have not been updated with the new definitions developed in the revised Conceptual Framework.
New and revised IFRS’s on issue but not yet effectiveThe Group has not applied the following new and revised IFRS that is relevant to the Group, and was issued, but not effective:
- Amendments to IAS 1 Classification of Liabilities as Current or Non-Current.
The amendment is effective for annual periods beginning on or after January 1, 2022, and generally require prospective application. The Group is currently performing an assessment of the impact of this amendment and does not anticipate a material impact on the financial statements of the Group in future periods.
7Jadestone Energy

4 | RevenueThe Group derives its revenue from contracts with customers for the sale of oil and gas products. Revenue is presented net of royalties.
THREE MONTHS ENDEDMARCH 31, 2020
USD’000
THREE MONTHS ENDEDMARCH 31, 2019
USD’000
Liquids revenue - including hedging
Montara 40,443 44,922Stag 33,777 11,444
Total revenue derived from contracts with customers 74,220 56,366
Notes to the Condensed Consolidated Interim Financial Statementsfor the financial period ended March 31, 2020
5 | Production Costs
THREE MONTHS ENDEDMARCH 31, 2020
USD’000
THREE MONTHS ENDEDMARCH 31, 2019
USD’000
Operating costs 11,660 15,495Workovers 5,252 3,147Logistics 4,552 8,064 Repairs and maintenance 6,408 4,489 Inventories written down 351 -Movement in inventories 2,330 (8,474)
30,553 22,721
6 | Depletion, Depreciation and Amortisation (“DD&A”)
THREE MONTHS ENDEDMARCH 31, 2020
USD’000
THREE MONTHS ENDEDMARCH 31, 2019
USD’000
Depletion and amortisation (Note 15):Montara 14,348 18,038Stag 2,567 1,531
16,915 19,569
Depreciation of plant and equipment (Note 16) 106 94 Right-of-use assets (Note 17) 4,396 2,014 Movement in inventories (1,835) (9,785)
19,582 11,892
8

7 | Staff Costs
THREE MONTHS ENDEDMARCH 31, 2020
USD’000
THREE MONTHS ENDEDMARCH 31, 2019
USD’000
Wages, salaries and fees 4,311 3,844Staff benefits in kind 920 607Share-based compensation 376 117
5,607 4,568
The above staff cost includes director’s and non-executive directors’ salaries and fees.
8 | Other Expenses
THREE MONTHS ENDEDMARCH 31, 2020
USD’000
THREE MONTHS ENDEDMARCH 31, 2019
USD’000
Professional fees/consultancies 984 803Exploration expenses 972 -Office costs 664 520 Travel and entertainment 148 173 Net loss on ineffective oil derivatives 2 471Oil and gas properties written off - 533Net foreign exchange loss - 143Other expenses 131 101
2,901 2,744
9 | Other Income
THREE MONTHS ENDEDMARCH 31, 2020
USD’000
THREE MONTHS ENDEDMARCH 31, 2019
USD’000
Interest income 218 303 Net foreign exchange gain 159 -Change in Stag FSO provision 443 -
820 303
9Jadestone Energy
10 | Finance CostsTHREE MONTHS ENDED
MARCH 31, 2020USD’000
THREE MONTHS ENDEDMARCH 31, 2019
USD’000
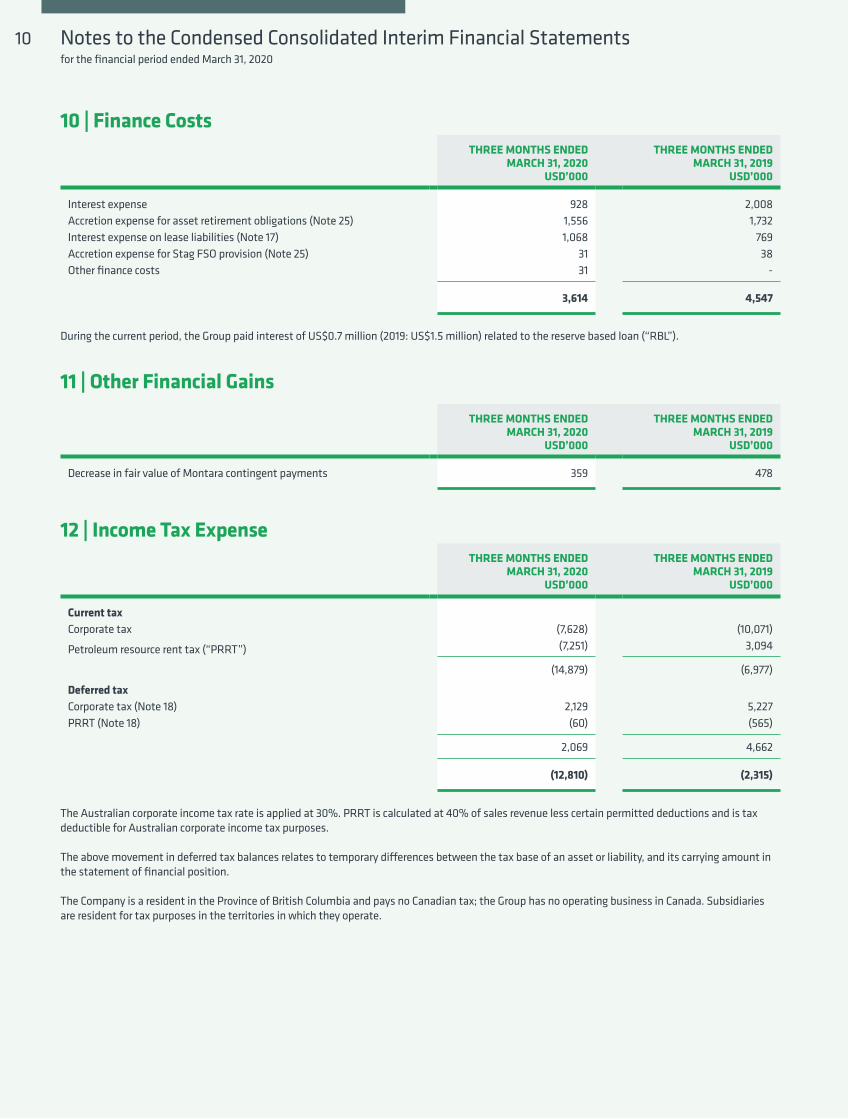
Interest expense 928 2,008Accretion expense for asset retirement obligations (Note 25) 1,556 1,732Interest expense on lease liabilities (Note 17) 1,068 769Accretion expense for Stag FSO provision (Note 25) 31 38Other finance costs 31 -
3,614 4,547
During the current period, the Group paid interest of US$0.7 million (2019: US$1.5 million) related to the reserve based loan (“RBL”).
11 | Other Financial Gains
THREE MONTHS ENDEDMARCH 31, 2020
USD’000
THREE MONTHS ENDEDMARCH 31, 2019
USD’000
Decrease in fair value of Montara contingent payments 359 478
12 | Income Tax ExpenseTHREE MONTHS ENDED
MARCH 31, 2020USD’000
THREE MONTHS ENDEDMARCH 31, 2019
USD’000
Current taxCorporate tax (7,628) (10,071)
Petroleum resource rent tax (“PRRT”) (7,251) 3,094
(14,879) (6,977)
Deferred taxCorporate tax (Note 18) 2,129 5,227PRRT (Note 18) (60) (565)
2,069 4,662
(12,810) (2,315)
The Australian corporate income tax rate is applied at 30%. PRRT is calculated at 40% of sales revenue less certain permitted deductions and is tax deductible for Australian corporate income tax purposes.
The above movement in deferred tax balances relates to temporary differences between the tax base of an asset or liability, and its carrying amount in the statement of financial position.
The Company is a resident in the Province of British Columbia and pays no Canadian tax; the Group has no operating business in Canada. Subsidiaries are resident for tax purposes in the territories in which they operate.
Notes to the Condensed Consolidated Interim Financial Statementsfor the financial period ended March 31, 2020
10

13 | Profit Per Ordinary Share
The tax expense on Group profit differs from the amount that would arise using the standard rates of income tax applicable in the countries of operation as explained below:
The calculation of the basic and diluted profit per share is based on the following data:
The calculation of diluted EPS for the three months ended March 31, 2020 includes 3,622,443 of weighted average dilutive ordinary shares available for exercise from in-the-money vested options (three months ended March 31, 2019: 931,349). Additionally, 656,160 of weighted average potential ordinary shares available for exercise, are excluded as they are out-of-the-money (three months ended March 31, 2019: 607,821).
THREE MONTHS ENDEDMARCH 31, 2020
USD’000
THREE MONTHS ENDEDMARCH 31, 2019
USD’000
Profit before tax 13,142 10,675
Tax calculated at the domestic tax rates applicable to the profit in the respective countries (Australia 30%, Indonesia 48%*, Canada 27% and Singapore 17%) (4,254) (4,110)
Effects of non-deductible expenses (1,245) (733)PRRT tax expense (10,194) (2,512)Effect of PRRT tax benefit 2,883 5,040
Tax expense for the period (12,810) (2,315)
THREE MONTHS ENDEDMARCH 31, 2020
USD’000
THREE MONTHS ENDEDMARCH 31, 2019
USD’000
Profit for the purposes of basic and diluted per share, being the net profit for the period attributable to equity holders of the Company 332 8,360
NUMBER OF SHARES NUMBER OF SHARES
Weighted average number of ordinary shares for the purposes of basic EPS 461,042,811 461,034,663Effect of diluted potential ordinary shares - share options 3,622,443 931,349
Weighted average number of ordinary shares for the purposes of dilutive EPS 464,665,254 461,966,012
EARNINGS PER SHARE (US$)
THREE MONTHS ENDEDMARCH 31, 2020
NUMBER OF SHARES
THREE MONTHS ENDEDMARCH 31, 2019
NUMBER OF SHARES
- Basic 0.00 0.02
- Diluted 0.00 0.02
* The Indonesian tax rate is based on the effective rate after taking into account the corporate tax rate of 35% and the branch profit tax of 20%.
In addition to the amount charged to the profit and loss, the following amounts relating to tax have been recognised in other comprehensive income.
THREE MONTHS ENDEDMARCH 31, 2020
USD’000
THREE MONTHS ENDEDMARCH 31, 2019
USD’000
Other comprehensive income - deferred tax
Income tax (expense)/credit related to carrying amount of cash flow hedges (8,142) 11,564
11Jadestone Energy

14 | Intangible Exploration Assets
TOTALUSD’000
CostAs at January 1, 2020 117,440Additions 16,600
As at March 31, 2020 134,040
ImpairmentAs at January 1, 2020/ March 31, 2020 -
Net book value
As at December 31, 2019 117,440
As at March 31, 2020 134,040
For the purpose of the consolidated statement of cash flows, intangible exploration assets of US$8.4 million remained unpaid as at March 31, 2020 (March 31, 2019: US$1.7 million).
Notes to the Condensed Consolidated Interim Financial Statementsfor the financial period ended March 31, 2020
15 | Oil and Gas PropertiesTOTAL
RestatedUSD’000
CostAs at January 1, 2020 492,985Additions 569
As at March 31, 2020 493,554
Accumulated depletion and amortisationAs at January 1, 2020 111,311Charge for the period (Note 6) 16,915
As at March 31, 2020 128,226
Net book valueAs at December 31, 2019 381,674
As at March 31, 2020 365,328
12

16 | Plant and EquipmentCOMPUTER
EQUIPMENTUSD’000
FIXTURES AND FITTINGSUSD’000
TOTALUSD’000
CostAs at January 1, 2020 2,824 1,315 4,139Additions 9 75 84
As at March 31, 2020 2,833 1,390 4,223
Accumulated depreciationAs at January 1, 2020 1,334 1,025 2,359Charge for the period (Note 6) 90 16 106
As at March 31, 2020 1,424 1,041 2,465
Net book valueAs at December 31, 2019 1,490 290 1,780
As at March 31, 2020 1,409 349 1,758
17 | Right-of-Use Assets
THREE MONTHS ENDED MARCH 31, 2020
USD’000
THREE MONTHS ENDED MARCH 31, 2019
USD’000
Amount recognised in profit or lossDepreciation expense on right-of-use assets (Note 6) 4,396 2,014Interest expense on lease liabilities (Note 10) 1,068 769Expenses relating to short-term leases 6 -*Expense relating to leases of low value assets 3 2
PRODUCTION ASSETS
USD’000
TRANSPORTATION AND LOGISTICS
USD’000BUILDINGS
USD’000TOTAL
USD’000
CostAs at January 1, 2020/March 31, 2020 29,339 42,320 3,004 74,663
Accumulated depreciationAs at January 1, 2020 5,334 8,519 1,023 14,876Charge for the period 1,334 2,815 247 4,396
As at March 31, 2020 6,668 11,334 1,270 19,272
Net book valueAs at December 31, 2019 24,005 33,801 1,981 59,787
As at March 31, 2020 22,671 30,986 1,734 55,391
The Group leases several assets including the Stag FSO, helicopters, a supply boat, logistics facilities for the Montara field, and buildings. The average lease term is 4 years.
* Due to figure rounded to nearest thousand.
13Jadestone Energy

18 | Deferred Tax
The following are the deferred tax liabilities and assets recognised by the Group and movements thereon during the current reporting period.
AUSTRALIAN PRRT
USD’000
TAX DEPRECIATION
USD’000
DERIVATIVES FINANCIAL
INSTRUMENTSUSD’000
TOTALUSD’000
As at January 1, 2020 13,215 (60,445) (1,583) (48,813)(Charged)/Credited to profit or loss (Note 12) (60) 2,129 - 2,069Charged to OCI - - (8,142) (8,142)
As at March 31, 2020 13,155 (58,316) (9,725) (54,886)
Deferred tax assets and liabilities are offset when there is a legally enforceable right to set off current tax assets against current tax liabilities, and when they relate to income taxes levied by the same taxation authority, and the Group intends to settle its current tax assets and liabilities on a net basis. The following is the analysis of the deferred tax balances (after offset) for financial reporting purposes:
MARCH 31, 2020USD’000
DECEMBER 31, 2019USD’000
Deferred tax liabilities (70,605) (64,825)Deferred tax assets 15,719 16,012
(54,886) (48,813)
Notes to the Condensed Consolidated Interim Financial Statementsfor the financial period ended March 31, 2020
19 | InventoriesMARCH 31, 2020
USD’000DECEMBER 31, 2019
USD’000
Materials and spares 10,240 8,964Crude oil inventories 21,601 22,447
31,841 31,411
20 | Trade and Other ReceivablesMARCH 31, 2020
USD’000DECEMBER 31, 2019
USD’000
Trade receivables 12,113 34,007Prepayments 4,398 4,754Other receivables and deposits 6,645 2,311GST/VAT receivables 1,378 1,211
24,534 42,283
14

21 | Cash and Bank BalancesMARCH 31, 2020
USD’000DECEMBER 31, 2019
USD’000
Current assetsCash and bank balances 109,404 81,942Less: restricted cash (12,160) (6,008)
Cash and cash equivalents 97,244 75,934
Non-current assetsCash and bank balances 10,000 17,477Less: restricted cash (10,000) (17,477)
Cash and cash equivalents - -
Cash and cash equivalents in the statement of cash flows 97,244 75,934
As part of the reserve based lending agreement (Note 28), the Group must retain an aggregate amount of principal, interest, fees and costs payable at each quarter-end in the debt service reserve account (“DSRA”). An amount of US$12.2 million (December 31, 2019: US$13.5 million) is deposited in the DSRA as at March 31, 2020. In addition, the Group is required to maintain a minimum cash balance in the Montara cash operating account of US$15.0 million (December 31, 2019: US$15.0 million). The DSRA has been classified as restricted cash given certain restrictions under the loan agreement to withdraw amounts from the DSRA. The scheduled amounts of quarterly principal repayment under the loan, are sculpted, and decline over time, and hence the quantum required under the DSRA will fall, in line with reductions in the principal repayment, all other things being equal. As at March 31, 2020, the whole DSRA balance of US$12.2 million (December 31, 2019: US$6.0 million) has been recognised as current/able to be released within 12 months. As at December 31, 2019, US$7.5 million was treated as non-current/able to be released in 2021.
22 | Share Capital
NO. OF SHARES USD’000
Issued and fully paidAs at January 1, 2020/ March 31, 2020 461,042,811 466,573
Authorised share capitalUnlimited number of ordinary voting shares with no par value.
The Company has one class of ordinary share. Fully paid ordinary shares carry one vote per share, without restriction, and carry a right to dividends as and when declared by the Company.
23 | Hedging ReservesTOTAL
USD’000
As at January 1, 2020 (3,688)Gain arising on changes in fair value of hedging instruments during the period (35,300)Income tax related to gain recognised in other comprehensive income 10,590Net gain reclassified to profit or loss 8,162Income tax related to amounts reclassified to profit or loss (2,448)
As at March 31, 2020 (22,684)
15Jadestone Energy

24 | Share-Based Payments Reserve
The total expense arising from share based payments recognised for the period ended March 31, 2020 was US$0.4 million (March 31, 2019: US$0.1 million).
The Black-Scholes option-pricing model, with the following assumptions, was used to estimate the fair value of the options at the date of grant.
OPTIONS GRANTED ONDECEMBER 3, 2019 MARCH 28, 2019
Risk-free rate 1.47% to 1.47% 1.46% to 1.47%Expected life 5.5 to 6.5 years 5.5 to 6.5 yearsExpected volatility 40.1% to 42.8% 39.9% to 42.3%Share price C$1.17 C$0.85Exercise price C$1.17 C$0.85Expected dividends Nil Nil
The following table summarises the share options outstanding and exercisable as at March 31, 2020:
SHARE OPTIONS
NUMBER OF OPTIONS
WEIGHTED AVERAGE EXERCISE
PRICE C$
WEIGHTED AVERAGEREMAINING
CONTRACT LIFE
NUMBER OF OPTIONS
EXERCISABLE
As at January 1, 2020 19,867,842 0.68 8.21 7,019,480Vested during the period 0.66 8.11 5,478,339Cancelled during the period (100,000) 0.85 - -
As at March 31, 2020 19,767,842 0.68 7.84 12,497,819
Notes to the Condensed Consolidated Interim Financial Statementsfor the financial period ended March 31, 2020
25 | ProvisionsPROVISION FOR
ASSET RESTORATION OBLIGATIONS
USD’000
STAG FSO PROVISION
USD’000TOTAL
USD’000
As at January 1, 2020 275,422 4,996 280,418Accretion expense (Note 10) 1,556 31 1,587Changes in discount rate and FX assumptions and estimates (Note 9) - (443) (443)
As at March 31, 2020 276,978 4,584 281,562
The Group’s asset restoration obligations (“ARO”) result from the future estimated costs to decommission each of the Stag and Montara assets.
The carrying value of the provision comprises the discounted present value of the estimated future costs. Current estimated costs of the ARO for each of the Stag and Montara assets have been escalated to the estimated date at which the expenditure would be incurred, at an assumed blended inflation rate of 2.06% and 2.10% respectively, unchanged from the rate as at December 31, 2019. The estimates are a blend of assumed US and Australian inflation rates to reflect the underlying mix of US dollar and Australian dollar denominated expenditures. The present value of the future estimated ARO for each of the Stag and Montara assets has then been calculated based on blended risk-free rates of 2.24% and 2.31% respectively, unchanged from the rate as at December 31, 2019.
Management expects decommissioning expenditures to be incurred from 2033 and 2036 onwards for Montara and Stag, respectively.
The Stag FSO provision represents the fair value of amounts payable to the crew of the FSO on termination of the lease.
16

26 | Lease LiabilitiesMARCH 31, 2020
USD’000DECEMBER 31, 2019
USD’000
Analysed as:Non-current 38,649 42,533Current 19,648 19,739
58,297 62,272
27 | Other PayableMARCH 31, 2020
USD’000DECEMBER 31, 2019
USD’000
Montara contingent payments - 359
28 | BorrowingsMARCH 31, 2020
USD’000DECEMBER 31, 2019
USD’000
Non-current secured borrowingsReserve based lending facility - 7,328
Current secured borrowingsReserve based lending facility 36,566 41,795
36,566 49,123
During the period, the Group made principal repayment and interest service costs of US$12.8 million and US$0.7 million respectively.
29 | Trade and Other PayablesMARCH 31, 2020
USD’000DECEMBER 31, 2019
USD’000
Trade payables 8,425 9,192Other payables 16,163 14,355Provision for long service leave 796 851Other provisions 3,232 3,460PRRT payable 7,251 -GST/VAT payables 76 104
35,943 27,962
These amounts are non-interest bearing. The Group believes that the carrying amount of trade payables approximates their fair value.
17Jadestone Energy
30 | Derivative Financial Instruments
MARCH 31, 2020USD’000
DECEMBER 31, 2019USD’000
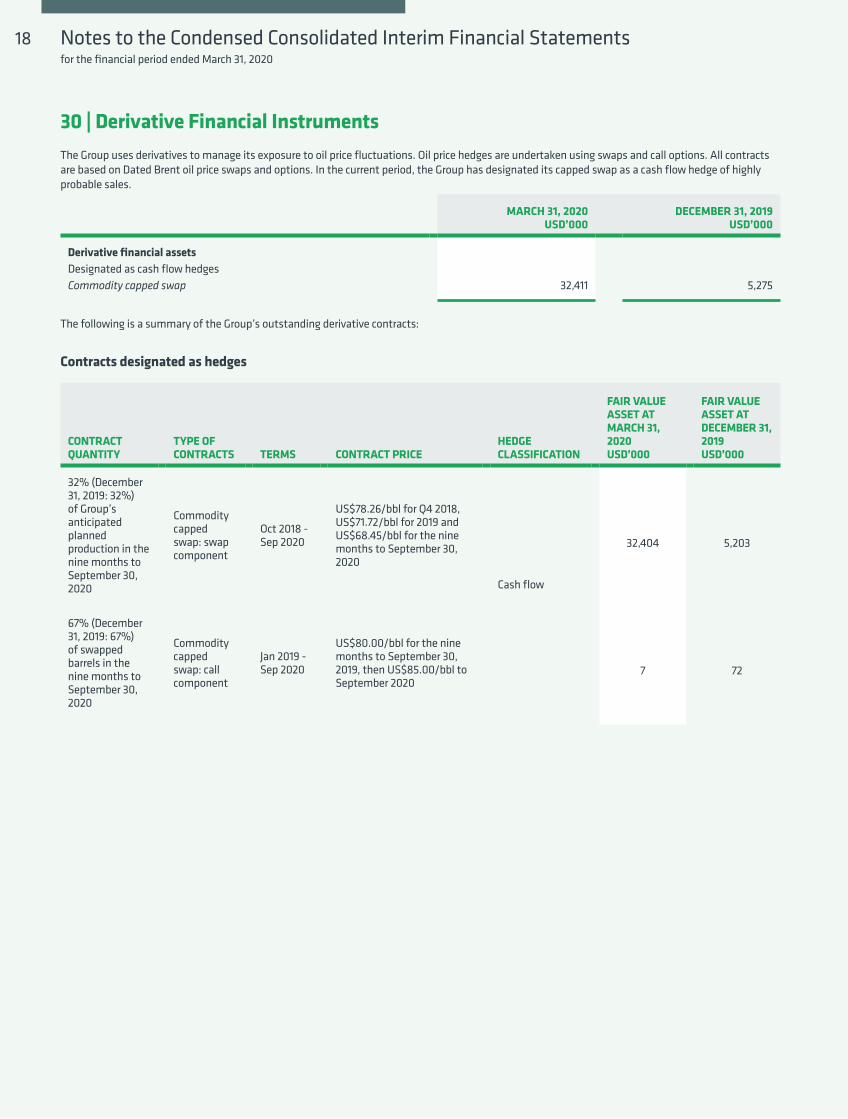
Derivative financial assetsDesignated as cash flow hedgesCommodity capped swap 32,411 5,275
The Group uses derivatives to manage its exposure to oil price fluctuations. Oil price hedges are undertaken using swaps and call options. All contracts are based on Dated Brent oil price swaps and options. In the current period, the Group has designated its capped swap as a cash flow hedge of highly probable sales.
The following is a summary of the Group’s outstanding derivative contracts:
Contracts designated as hedges
CONTRACT QUANTITY
TYPE OF CONTRACTS TERMS CONTRACT PRICE
HEDGE CLASSIFICATION
FAIR VALUE ASSET AT MARCH 31, 2020USD’000
FAIR VALUE ASSET AT DECEMBER 31, 2019USD’000
32% (December 31, 2019: 32%) of Group’s anticipated planned production in the nine months to September 30, 2020
Commodity capped swap: swap component
Oct 2018 - Sep 2020
US$78.26/bbl for Q4 2018, US$71.72/bbl for 2019 and US$68.45/bbl for the nine months to September 30, 2020
Cash flow
32,404 5,203
67% (December 31, 2019: 67%) of swapped barrels in the nine months to September 30, 2020
Commodity capped swap: call component
Jan 2019 - Sep 2020
US$80.00/bbl for the nine months to September 30, 2019, then US$85.00/bbl to September 2020
7 72
Notes to the Condensed Consolidated Interim Financial Statementsfor the financial period ended March 31, 2020
18

The following tables detail the commodity swap contracts outstanding at the end of the reporting period, as well as information regarding their related hedged items. Commodity swap contract assets are included in the “derivative financial instruments” line item in the consolidated statement of financial position.
Hedging instruments - outstanding contracts
OIL VOLUMESBBLS
NOTIONAL VALUEUSD’000
CHANGE IN FAIR VALUE USED FOR
CALCULATING HEDGE INEFFECTIVENESS
USD’000
FAIR VALUE ASSETS
USD’000
March 31, 2020Cash flow hedges Commodity swap component 716,100 48,515 2 32,404Commodity call component 358,050 30,434 - 7
2 32,411
December 31, 2019Cash flow hedges Commodity swap component 1,136,940 77,829 633 5,203Commodity call component 568,470 48,320 - 72
633 5,275
CHANGE IN VALUE USED FOR CALCULATING HEDGE
INEFFECTIVENESSUSD’000
BALANCE IN CASH FLOW HEDGE RESERVE FOR CONTINUING HEDGES
USD’000
BALANCE IN CASH FLOW HEDGE RESERVE ARISING FROM HEDGING
RELATIONSHIPS FOR WHICH HEDGE ACCOUNTING IS NO LONGER APPLIED
USD’000
March 31, 2020Cash flow hedges Forecast sales 2 22,684 -
December 31, 2019Cash flow hedges Forecast sales 633 3,688 -
Hedged items
The following table details the effectiveness of the hedging relationships and the amounts reclassified from hedging reserve to profit or loss:
CURRENT PERIOD HEDGING
(LOSS)/GAIN RECOGNISED
IN OCIUSD’000
AMOUNT OF HEDGE
INEFFECTIVENESS RECOGNISED IN PROFIT OR LOSS
USD’000
LINE ITEM IN PROFIT OR LOSS IN WHICH HEDGE
INEFFECTIVENESS IS INCLUDED
USD’000
AMOUNT RECLASSIFIED TO PROFIT OR LOSS DUE TO HEDGED ITEM AFFECTING PROFIT OR LOSS
USD’000
LINE ITEM IN PROFIT OR
LOSS IN WHICH RECLASSIFICATION
ADJUSTMENT IS INCLUDED
March 31, 2020Cash flow hedges Forecast sales 24,710 2 Other expenses 8,160 Revenue
December 31, 2019Cash flow hedges Forecast sales (21,380) 633 Other expenses 14,241 Revenue
19Jadestone Energy

31 | Business Risks and Uncertainties
The Group has processes and systems in place designed to identify the principal risks of the business and has established what is considers reasonable mitigation strategies wherever possible.
The Group has processes and systems in place designed to identify the principal risks of the business and has established what is considers reasonable mitigation strategies wherever possible.
For a detailed analysis of how the Group manages its business risks and uncertainties, see the Group’s financial statements for the year ended December 31, 2019. Aside from the below, the Group’s business risks and uncertainties have not materially changed since the disclosure in the audited consolidated financial statements.
Impact of Coronavirus outbreak (“Covid-19”)On January 30, 2020, the World Health Organisation declared the Covid-19 outbreak a "Public Health Emergency of International Concern" and on March 10, 2020, declared it to be a pandemic. Actions taken around the world to help mitigate the spread of Covid-19 include restrictions on travel, and quarantines in certain areas, and forced closures for certain types of public places and businesses. Covid-19 and the actions taken to mitigate it, have had, and are expected to continue to have, an adverse impact on the economies and financial markets of many countries, including the geographical area in which the Group operates.
On April 12, 2020, members of Organisation of the Petroleum Exporting Countries and certain other countries including the Russian Federation, have agreed to cut global daily oil production by almost 10%, representing 9.7mm bbls/d effectively from May 2020.
The substantially lower crude oil price will reduce the Group’s revenue in 2020, but the Group has no plan to reduce its crude oil production as the Group has significant downside protection in place, including via its capped swap and a relatively competitive cash operating cost base. The Group has hedged about a third of its planned production for the first nine months of 2020. Additionally, the crude at both Stag and Montara has generated a premium above benchmark crude oil prices.
In the absence of Vietnamese Government approvals for the Nam Du/U Minh field development plan in Q1 2020, and the decline in oil prices, the Group announced on March 19, 2020 to defer the Nam Du/U Minh gas field development. In respect of the Block 46/07 PSC appraisal well commitment, the Group will seek Vietnam Government approval for a further extension to the existing June 29, 2021 deadline, in order to align drilling of the appraisal well with development of Nam Du/U Minh. The Group is committed to the project and expects to receive approval for the extension request.
At the time the Group undertook the impairment review of its non-financial assets, as at March 31, 2020, the spot price for Dated Brent was US$17.68/bbl. Since that time, Dated Brent oil prices have climbed to US$32.85/bbl as at May 22, 2020. Aside from a US$0.4 million adjustment to the net realisable value of the Stag inventories as at March 31, 2020, no impairment has been made by the Group to its non-financial assets as at the reporting date. The current lower oil price is not regarded as indicative of medium and longer term oil prices for the purpose of impairment assessment of the Group’ medium- and long-term non-financial assets including intangible exploration assets and oil and gas properties.
The Group will reflect updated oil price data during its next impairment review, including spot oil prices, but will also give due consideration to both the medium- and long-term outlook for crude oil prices.
The Group will closely monitor the development of the Covid-19 outbreak and related oil prices outlook, and continue to evaluate its impact on the business, the Group’s financial position and operating results. As part of the preparation of the current financial statements, a forward-looking going concern analysis was undertaken at some of the lower current third-party downside Brent crude oil price outlooks, including US$21/bbl in Q2 2020 and US$30/bbl in H2 2020. The Group was able to generate positive operating cashflow without resorting to significant cuts in operating costs, and continue as a going concern.
Notes to the Condensed Consolidated Interim Financial Statementsfor the financial period ended March 31, 2020
20

32 | Financial Instruments, Financial Risks and Capital Managements
For a detailed analysis on how the Group manages its financial instruments, financial risks and capital management, see the Group's consolidated financial statements for the year ended December 31, 2019. The financial risks, instruments and capital market strategies have not materially changed since the year end.
Capital managementThe Group manages its capital structure and makes adjustments to it, based on the funds available to the Group, in order to support the acquisition, exploration and development of resource properties and the ongoing operations of its producing assets. Given the nature of the Group’s activities, the Board of Directors works with management to ensure that capital is managed effectively, and the business has a sustainable future.
To carry out planned asset acquisitions, exploration and development, and to pay for administrative costs, the Group may utilise excess cash generated from its ongoing operations and may utilise its existing working capital, and will work to raise additional funds should that be necessary.
Management reviews its capital management approach on an ongoing basis and believes that this approach, given the relative size of the Group, is reasonable. There were no changes in the Group’s approach to capital management during the financial period ended March 31, 2020. The Group is not subject to externally imposed capital requirements.
MARCH 31, 2020USD’000
DECEMBER 31, 2019USD’000
Borrowings (Note 28) (36,566) (49,123)Cash and cash equivalents (Note 21) 97,244 75,934Restricted cash (Note 21) 12,160 13,485
Cash less borrowings 72,838 40,296
Borrowings comprise long and short-term borrowings, incorporating effective interest method financing costs, and excludes derivatives, as detailed in Note 28. Cash and cash equivalents includes the Montara Assets’ minimum working capital cash balance of US$15.0 million required under the RBL, while restricted cash comprises the US$12.2 million in the RBL debt service reserve account (December 31, 2019: US$13.5 million). Restricted cash, as shown here, excludes the US$10.0 million deposited in support of a bank guarantee to a key supplier in respect of the Stag FSO.
21Jadestone Energy

Information reported to the Group’s Chief Executive Officer (the Chief Operating Decision Maker), for the purposes of resource allocation, is focused on two reportable/business segments driven by different types of activities within the upstream oil and gas value chain, namely producing assets and development and exploration assets. The geographic focus of the business is on SEA and Australia.
Revenue and non-current assets information based on the geographical location of assets respectively are as follows:
33 | Segment Information
Non-current assets include oil and gas properties, intangible exploration assets, right-of-use assets, restricted cash and plant and equipment used in corporate offices.
THREE MONTHS ENDED MARCH 31, 2020
PRODUCING ASSETSAUSTRALIA
USD’000
EXPLORATION/DEVELOPMENT
SEAUSD’000
CORPORATEUSD’000
TOTALUSD’000
RevenueLiquids revenue 74,220 - - 74,220
Production cost (30,553) - - (30,553)DD&A (19,481) (28) (73) (19,582)Staff costs (2,288) (1,061) (2,258) (5,607)Other expenses (1,494) (82) (1,325) (2,901)Other income 892 5 (77) 820Finance costs (3,604) (1) (9) (3,614)Other financial gains 359 - - 359
Profit/(Loss) before tax 18,051 (1,167) (3,742) 13,142
Additions to non-current assets 5,955 11,223 75 17,253
Non-current assets 438,218 127,357 942 566,517
THREE MONTHS ENDED MARCH 31, 2019
PRODUCING ASSETSAUSTRALIA
USD’000
EXPLORATION/DEVELOPMENT
SEAUSD’000
CORPORATEUSD’000
TOTALUSD’000
RevenueLiquids revenue 56,366 - - 56,366
Production cost (22,721) - - (22,721)DD&A (11,782) - (110) (11,892)Staff costs (1,727) (775) (2,066) (4,568)Other expenses (2,298) (97) (349) (2,744)Other income 302 - 1 303Finance costs (4,920) - 373 (4,547)Other financial gains 478 - - 478
Profit/(Loss) before tax 13,698 (872) (2,151) 10,675
Additions to non-current assets 6,071 2,543 - 8,614
Non-current assets 517,157 98,214 1,229 616,600
Notes to the Condensed Consolidated Interim Financial Statementsfor the financial period ended March 31, 2020
22

34 | Contingent Liabilities
36 | Events After the End of the Reporting Period
StagThe Group may be responsible for certain contingent payments after March 31, 2020 of up to US$10.0 million linked to future expansion of the Stag Oilfield. At this time, Jadestone’s management does not consider it probable that the conditions necessary to trigger the contingent payments will occur. Accordingly, as at March 31, 2020, no provision has been recognised in the financial statements.
MontaraThe Group may be responsible for certain contingent payments after March 31, 2020 of up to US$110.0 million linked to oil price appreciation, and/or volumes of production from the first infill well in its first year, and/or future expansion of the Montara Assets. At this time, Jadestone’s management only considers the contingent payments of up to US$10.0 million (fair value of US$ Nil) linked to oil price appreciation above US$80/bbl in 2020 as possible but remote, while also noting the uncertain nature of future changes in oil prices; in this case future prices of Dated Brent. Accordingly, as at March 31, 2020, no provision has been recognised in the financial statements.
Australian dollar forward contractsOn April 22, 2020, the Group entered into a series of forward exchange contracts under which it is contracted to purchase AU$10.0 million per month, for six months, commencing May 21, 2020, at a fixed forward AU$/US$ exchange rate of 0.6344.
Stocks options, performance shares and restricted sharesOn April 27, 2020 Jadestone granted an aggregate of 6,525,000 incentive stock options to a number of employees, officers, directors, and consultants, exercisable over a period of ten years, at an exercisable price of GBP 0.44 per share. The stock options will vest upon the third anniversary of the grant date.
The Group also issued an aggregate of 695,200 performance share awards to a number of its employees, and 101,063 restricted share awards to the Company’s President and CEO, A. Paul Blakeley.
The market value of the performance shares to be issued upon their vesting is approximately GBP 0.56 per share. The performance share awards will vest on the third anniversary of the grant date. The number of performance shares to be issued will be determined against two performance measures comprising relative total shareholder return and absolute total shareholder return, weighted at 70% and 30% respectively.
The market value of the restricted shares to be issued upon their vesting is approximately GBP 0.40 per share. The restricted share award will vest on the third anniversary of the grant date. With a view to further aligning interests with shareholders, A. Paul Blakeley elected to receive the restricted share award in lieu of cash with respect to a base salary increase, effective 1 January 2020.
The stock option awards, performance share awards and restricted share awards were granted in accordance with the terms of the Company’s stock option plan, performance share plan and restricted share plan respectively, each of which has been approved by the Company’s shareholders.
THREE MONTHS ENDEDMARCH 31, 2020
USD’000
THREE MONTHS ENDEDMARCH 31, 2019
USD’000
Short-term benefits 1,706 1,089Other benefits 215 212Share-based payments 237 123
2,158 1,424
35 | Related Party Transactions
During the period, the Group entities did not enter into transactions with related parties, other than the following:
Compensation of key management personnel
The total remuneration of members of key management for three months ended March 31, 2020 (including salaries and benefits) was US$2.2 million (March 31, 2019: US$1.4 million).
As at March 31, 2020, the Group has seventeen key management personnel (March 31, 2019: thirteen).
23Jadestone Energy

37 | Reclassification of Comparative Figures
Certain comparative figures in the financial statements of the Group have been reclassified to conform to the presentation in the current financial period.
These reclassifications were made to better reflect the nature of the expenses in the respective lines in the statement of profit or loss, and the nature of the assets in the respective lines of the statement of financial position.
The reclassification in the statement of cash flows were made to align with the presentation in the current financial period, and in accordance with the audited consolidated financial statements for the year ended December 31, 2019. The changes mainly relate to the reclassification of the movement in inventory from adjustment items to the movement in working capital, the reclassification of lease payments from an investing activity to a financing activity, and the reclassification of the DSRA cash balance from cash and cash equivalents to pick up movements in the DSRA cash balance as an investing activity. Consequently, the restricted cash balance has been excluded from the cash and cash equivalents at the beginning and end of the prior financial period.
The reclassifications impact the following items:
Notes to the Condensed Consolidated Interim Financial Statementsfor the financial period ended March 31, 2020
AS PREVIOUSLY REPORTEDUSD’000
RECLASSIFICATIONUSD’000
AS RECLASSIFIEDUSD’000
Statement of profit or loss and other comprehensive income for the financial period ended March 31, 2019Staff costs (3,778) (790) (4,568)Other expenses (2,867) 123 (2,744)Other income 160 143 303Finance costs (5,071) 524 (4,547)
Statement of financial position as at December 31, 2019Intangible exploration assets 116,096 1,344 117,440Oil and gas properties 383,018 (1,344) 381,674
Statement of cash flows for the financial period ended March 31, 2019Depletion, depreciation and amortisation 21,677 (11,799) 9,878Depreciation of right-of-use assets - 2,014 2,014Other finance costs 3,085 (546) 2,539Interest expense 1,462 546 2,008Oil and gas properties written off - 533 533Decrease in trade and other receivables 19,555 (3,094) 16,461Increase in inventories (18,650) 9,785 (8,865)Decrease in trade and other payables (7,485) (658) (8,143)Interest paid (1,462) (1) (1,463)Tax refunded - 3,096 3,096Payment for oil and gas properties (5,965) (533) (6,498)Payment for intangible exploration assets (1,607) 657 (950)Transfer from debt service reserve account - 2,369 2,369Lease payments (2,419) 2,419 -Repayment of borrowings (15,754) 1 (15,753)Repayment of lease liabilities - (2,419) (2,419)Net increase in cash and cash equivalents 3,139 2,370 5,509Cash and cash equivalents at beginning of the period 71,626 (18,645) 52,981Cash and cash equivalents at end of the period 74,765 (16,275) 58,490
24

25Jadestone Energy
