condensation processes in a motoring engine
TRANSCRIPT

C
LE
a
ARRAA
KIEPCE
1
datbbptdntlg
nT
vT
h0
J. of Supercritical Fluids 90 (2014) 84–100
Contents lists available at ScienceDirect
The Journal of Supercritical Fluids
j o ur na l ho me page: www.elsev ier .com/ locate /supf lu
ondensation processes in a motoring engine
u Qiu ∗, Rolf D. Reitz1
ngine Research Center, University of Wisconsin-Madison, 1500 Engineering Drive, Madison, WI 53706, USA
r t i c l e i n f o
rticle history:eceived 12 December 2013eceived in revised form 17 March 2014ccepted 26 March 2014vailable online 12 April 2014
eywords:soenergetic–isochoric flashntropy maximizationhase equilibriumondensationquation of state
a b s t r a c t
Condensation phenomena occurring in the combustion chamber of a motoring engine were investigatedusing a single-fluid approach by applying the Peng–Robinson equation of state to both the vapor andliquid phases. The phase transition process is modeled through thermodynamic equilibrium calculationsthat are based on an entropy maximization principle. The simulations show that condensation of purenitrogen is not possible as it can only experience condensation through an expansion process. However,condensation was possible in the compression stroke for example cases of pure n-heptane and twoselected binary mixtures. This is because the compression moves the fluid into the two-phase region,and when the fluid crosses the dew point line, condensation occurs with spontaneous heat release. Theamount of liquid phase is found to increase as the compression continues. In the expansion stroke, thecontinuous relaxation leads to evaporation of the two-phase mixture, and hence the liquid phase iscontinuously depleted. For pure species, condensation is first observed in the bulk flow regions and then
the extend of the two-phase mixture grows. After the whole charge is two-phase, the maximum liquidvolume fraction and hence minimum entropy are found in the wall regions due to heat transfer effects.Similar observations were seen for mixtures. Finally, thermodynamic analysis of binary mixtures of puren-alkane species with nitrogen shows that condensation was only possible in the diesel engine operationrange if the fuel surrogate is n-dodecane or a heavier species.© 2014 Elsevier B.V. All rights reserved.
. Introduction
Numerical simulations of complex flows and combustion iniesel and gasoline engines are helpful in the development ofdvanced engines with low pollutant emissions and high brakehermal efficiency. One critical challenge of the modeling is thatoth liquid and gas phases are present in the combustion cham-er. Traditionally for direct-injection diesel engine simulations, theressurized liquid fuel injection is modeled using the “blob” injec-ion model [1], which models the injected liquid fuel as discreteroplets with Sauter mean diameter (SMD) equal to the effectiveozzle hole diameter. Formulated in this way, the evolution of the
wo phases is calculated separately. To track the movement of theiquid fuel parcels, the Lagrangian method is used. For the ambientas phase, it is tracked by solving the governing equations of fluid∗ Corresponding author at: University of Wisconsin-Madison, Room 1011, Engi-eering Research Building, 1500 Engineering Drive, Madison, WI 53706, USA.el.: +1 662 617 9132.
E-mail addresses: [email protected] (L. Qiu), [email protected] (R.D. Reitz).1 Address: Engine Research Center, Department of Mechanical Engineering, Uni-
ersity of Wisconsin-Madison, 1500 Engineering Drive, Madison, WI 53706, USA.el.: +1 608 262 0145; fax: +1 608 262 6707.
ttp://dx.doi.org/10.1016/j.supflu.2014.03.013896-8446/© 2014 Elsevier B.V. All rights reserved.
mechanics in Eulerian coordinates. State of the art engine spraysimulations adopt the above treatments for separate tracking of thetwo phases (e.g., the KIVA code [2]). The common difficulty, how-ever, is that the coupling of the phases, such as the local heat, massand momentum transfer at fluid interfaces, requires more model-ing effort. For simplicity, many correlations that were developedfor the isolated droplet are used, such as the Ranz–Marshall corre-lation. However, the important underlying assumption is that thefuel droplet must be sufficiently small to be considered as a pointsource in a computational cell, which is problematic in the nearnozzle region.
Many research works on engine spray simulation have focusedon improving the evaporation model. This is especially true becauseunder high-pressure engine operating conditions, the ideal mix-ing model for low-pressure conditions, such as the widely usedRaoult’s law and gas phase non-ideality, etc., are not suitable. Onemajor research direction is to improve transcritical evaporationmodeling under supercritical ambient conditions by consideringreal gas effects. Earliest work was performed by Manrique andBorman [3] who investigated steady state carbon dioxide droplet
vaporization in nitrogen environment using the Redlick–Kwong(RK) equation of state (EOS) [4]. Later, Jin and Borman [5] studiedthe evaporation of a binary component fuel composed of pen-tane and octane under elevated conditions. For the vapor–liquid
rcritic
et[naAnsll[dtgRhicasuhPaohs
ieeoi(iliditpaaigiacTotfia
2
2
flApeofl
L. Qiu, R.D. Reitz / J. of Supe
quilibrium, they used a fugacity coefficient for the gas phase andhe activity coefficient model for the liquid phase. Hsieh et al.6] did a comprehensive analysis on multicomponent droplets atear critical conditions using the Soave–Redlich–Kwong (SRK) EOSpplied to both the liquid and gas phases to calculate the fugacity.
binary mixture of n-pentane/nitrogen and a ternary mixture of-pentane/n-octane/nitrogen were studied, considering gas phaseolubility and thermodynamic property non-ideality. Their simu-ations show that droplet can reach the critical state in its earlyifetime. Curtis and Farrell [7] applied the Peng–Robinson (PR) EOS8] to study the transient evaporation of R-113, n-heptane and n-odecane droplets in a nitrogen environment. It was found thatransient effects in both the liquid and vapor phases could havereat impact on the droplet heat up and vaporization processes.ecently, Harstad and Bellan [9] studied the binary mixture of n-eptane and nitrogen. They found that, at subcritical conditions, an
nner layer exists and the evaporation yields convection-diffusionharacteristics. But in supercritical conditions, the absence of such
layer renders only the diffusion effects. Zhu and Aggarwal [10]tudied transient droplet evaporation in supercritical conditionssing different EOS models. The RK EOS was found to predict aigher evaporation rate compared to the SRK and Peng–RobinsonR EOS. In addition, it was found that the PR EOS showed excellentgreement in a wide range of ambient conditions with experimentsf n-heptane and nitrogen mixtures. More detailed and compre-ensive reviews about the behavior of droplet evaporation underupercritical ambient conditions can be found in Refs. [11–13].
Despite all these efforts, there is no documented researchnvestigating possible condensation, the “opposite” process ofvaporation, for the conditions inside the combustion chamber ofngines. In fact, experiments have shown that condensation canccur at near supercritical conditions. For instance, Roy et al. [14]nvestigated the injection processes of supercritical fluoroketoneC6F12O) into a subcritical nitrogen environment using planar lasernduced fluorescence (PLIF). The experimental images show thatiquid droplets were formed some distance downstream of thenjector. This physical process requires modeling that is completelyifferent from cases where the liquid fuel source is anchored at the
njector location, since the phase transition must be tracked. Onhe other hand, because an engine cycle also involves an expansionrocess, it is intuitive to think that not only the fuel evaporation, butlso physical condensation can occur. For instance, condensation ofir occurs after continuous expansion, as experimentally evidencedn the wind tunnel experiments [15,16]. In this paper, we investi-ate the conditions when it is possible for condensation to occurn practical engine configurations, and if it occurs, what its char-cteristics are. In the next section, updates to the fluid solver thatonsiders real gas effects and the EOS model are briefly introduced.he theories and approaches to model the phase change are basedn classical thermodynamics, and are described from the perspec-ive of thermodynamic equilibrium. Simulation results of an enginelled with pure n-heptane, pure nitrogen, and two binary mixturesre then presented with discussions.
. Theory and methodologies
.1. The fluid solver
The fluid solver was based on the open-source computationaluid dynamics (CFD) code KIVA-3V Release 2 [17], which uses therbitrary Lagrangian Eulerian (ALE) approach to deal with two-
hase compressible flows with the moving boundaries of pistonngines. Various improved or new sub-models have been devel-ped and incorporated to better simulate complex multiphaseows with chemical reactions [18]. The standard code solves theal Fluids 90 (2014) 84–100 85
conservation equations at each time step in three consecutivephases: in the Lagrangian Phase A, the source terms due to sprayand combustion/chemistry are solved. In Phase B the cell is movedwith the local fluid velocity, and all the physical properties (pres-sure, temperature, velocity, diffusion, etc.), except for convectionare solved. This phase is the main part of the fluid dynamics solver.Finally, in Phase C (rezoning stage) the cell boundaries are mappedback to the position where they should be, as determined by thespecified mesh motion. The partial differential equation for internalenergy, but not temperature, is solved directly.
While the general governing equations for the fluid do notchange, the current simulations consider real gas effects, asopposed to the ideal gas relation in the original code, for trackingphase change. Phase A is irrelevant because a non-reactive Eulerianflow is considered; real gas effects mainly show up in the SIMPLEloop iterations in Phase B, which is used for the simultaneous solu-tion of the momentum and energy conservation equations. Moredetails about the generalization of the thermodynamic relationshipwith a realistic equation of state and the modifications to the origi-nal code can be found in Refs. [19,20]. The Peng–Robinson equationof state (PR EOS) [8] is adopted here due to its relative simplicityand accuracy in calculating liquid density. In fact, it has been usedby some researchers in investigating the high pressure evaporationand supercritical flows with reasonably good results. For example,it was shown in Ref. [10] that PR EOS gave better results over othercubic EOS models (e.g., RK or SRK EOS) in studying the high pres-sure droplet evaporation. Simulations of Kim et al. on the cryogenicliquid nitrogen jet showed that the predictions using PR EOS wasslightly better over the SRK EOS in matching with experimentaldensity profiles [21]. It should be noted that cubic EOS models stillgive relatively poor liquid density predictions, and one approach toreconcile this issue is to use the volume-translated EOS to correctthe predictions [22]. Recently, the perturbed-chain, statisticallyassociating fluid theory (PC-SAFT) is gaining more and more atten-tion because of its superiority in predicting the thermodynamicproperties of complex fluids by introducing extra associating effects[23,24]. However, these methods require a lot more computationsso they are less practical to be used in CFD simulations.
The PR EOS has the form:
P = RuT
v − b− a
�(v + b) + b(� − b)(1)
Here, P is the pressure, � is the molar volume, T is the temperatureand Ru is the universal gas constant. a and b are the two parametersdetermined from:
⎧⎪⎪⎪⎪⎨⎪⎪⎪⎪⎩
a = 0.457235R2
uT2c
Pc· �
b = 0.077796RuTc
Pc
� = [1 + �(1 − √Tr)]2
(2)
with
� = 0.37464 + 1.54226ω − 0.26992ω2 (3)
Tc, Pc and ω are the critical temperature, pressure and acentric fac-
tor, respectively. When ω is greater than 0.5, the following formula[25] is adopted:� = 0.3796 + 1.485ω − 0.1644ω2 + 0.01667ω3 (4)

8 rcritical Fluids 90 (2014) 84–100
m⎧⎪⎪⎪⎪⎨⎪⎪⎪⎪⎩xiiwe
2
mcmppuvtcogfu
bpitlab(slt
eafitcmtah[idaAtttpvni
6 L. Qiu, R.D. Reitz / J. of Supe
In the case of a mixture, the classical Van der Waals one fluidixing rule is used:
a =∑
i
∑j
xixjaij
b =∑
i
xibi
aij = (1 − ıi,j)√
ai
√aj
(5)
i is the mole fraction of species i in the mixture. ıi,j is the binarynteraction parameter between components i and j. The binarynteraction parameter is the only parameter that needs to be tuned
ith available vapor–liquid equilibria data of the mixtures of inter-st.
.2. The thermodynamic solver
In addition to modifications to the fluid solver, a phase transitionodel was introduced. The goal of the thermodynamic equilibrium
alculations, called the thermodynamic solver or phase transitionodel here, is to determine the state of a computational cell with
ossible phase change based on thermodynamics. For each com-utational cell, after the fluid solver advances the state throughpdating the internal energy, volume, species densities and cellelocities, thermodynamic equilibrium is then assumed to fur-her determine the temperature and pressure. The standard KIVAode uses ideal gas relations: the internal energy is only a functionf temperature. The complexity of the equilibrium calculations isreatly reduced since the temperature can be determined directlyrom the internal energy and the pressure is immediately calculatedsing the ideal gas equation of state.
However, when modeling phase change, real gas effects muste introduced in above calculations. In the current simulations thehase transition model was founded on classical thermodynam-
cs, and it made use of information from the fluid solver directlyo determine if a two-phase mixture solution can truly exist. Equi-ibrium calculations that determine the thermodynamic state of
mixture with specified internal energy volume and mole num-er of each component has been termed the isoenergetic–isochoricUVn) flash problem. The UVn flash is a natural extension of the fluidolver, and its outcome is the globally stable thermodynamic equi-ibrium state. Therefore, real gas effects are fully considered in bothhe fluid and thermodynamic solvers.
The current implementation, built upon homogeneous phasequilibrium, enables a full separation between thermodynamicsnd fluid dynamics. The thermodynamic state is determined fullyrom the outcome of the fluid dynamics and the thermodynamics held fixed during the fluid dynamic calculation. At the sameime, though energy and mass conservation are enforced in eachell, the cell itself does not differentiate itself from a two-phaseixture. Therefore, only one set of conservation equations needs
o be solved. In this sense, the two-phase flow problem is actu-lly treated as a single-fluid problem. This single-fluid treatmentas been adopted previously in simulating internal nozzle flows26–29]. The coupling scheme between the fluid and UVn solverss shown schematically in Fig. 1. Dynamic update of the thermo-ynamics during the fluid dynamics iterations is not practical. Buts long as the time step is small enough, this treatment is suitable.lso, any equation of state can be used as long as the treatments of
he fluid dynamics and the thermodynamics are valid and consis-ent. For instance, Giljarhus et al. [30] used the Span–Wagner EOSo study one dimensional shock wave problems for pure CO2 with
hase change, since it is very accurate in predicting properties for aery wide range of conditions. Upon the complete of the thermody-amic calculations, the computation of a hydrodynamic time steps finished.
Fig. 1. Schematic diagram of the coupling between fluid dynamics and thermody-namic solvers in the updated KIVA code.
From the perspective of classical thermodynamics, when thesystem internal energy, volume and mole number of each compo-nent are specified, the equilibrium state has the maximum entropy[31]. So the UVn flash may be expressed as the following mathe-matical problem:
maximize S(U, V, �n) subject to
⎧⎪⎪⎪⎨⎪⎪⎪⎩
U = Uspec
V = V spec∑j
nij = nspeci
(6)
S is the mixture entropy, U is the internal energy, V is the volumeand n is the mole number. i and j are the species and phase index,respectively. Despite the close connection between the thermody-namics and the fluid dynamics shown above, the UVn flash has notbeen studied very well because of two difficulties. The first one isthat the actual number of phases at equilibrium is not known apriori. Because phase change only occurs at some specified con-ditions, stability tests must be performed. The most-widely usedand mature stability test is based on Gibbs free energy minimi-zation [32–34] for the isothermal-isobaric (TPn) flash, for whichtemperature, pressure, and mole number of each component arespecified. This stability test has been adopted by many researchers,such as in Refs. [35–37]. To maintain both numerical robustnessand effectiveness, useful methods for solving phase stability [38]and some general strategies [39] have been developed, but are stillunder further development. We have recently developed and val-idated a phase equilibrium solver performing robust and efficientstability tests and flash calculations [40], so it can be used readilyin the UVn flash.
The second difficulty is a lack of efficient numerical methods tosolve the coupled nonlinear algebraic Eq. (6). This is because thethermodynamic variables, such as the internal energy and entropy,
are functions of both the temperature and pressure, which are tobe determined. Compared to the effort spent on the TPn flash, thereis very limited research focusing on UVn flash problems [41–44].Recently, Arendsen and Versteeg [45] performed simulations on
L. Qiu, R.D. Reitz / J. of Supercritical Fluids 90 (2014) 84–100 87
Table 1Engine specifications.
Engine type Single cylinder four stroke
Bore (mm) 82Stroke (mm) 90.4Displacement (L/Cyl) 0.48Compression ratio 17.4:1Piston bowl type �Intake valve closing −132◦ ATDCExhaust valve opening 112◦ ATDCWall temperature (K) 425Head temperature (K) 465Piston temperature (K) 455
Table 2Properties of the pure species.
Species Tc (K) Pc (bar) ω (–) MW (g/mol)
N2 126.2 33.9 0.0377 28.0nC7H16 540.2 27.4 0.3495 100.2
topmtcna
b
⎧⎪⎪⎪⎪⎪⎨⎪⎪⎪⎪⎪⎩�piac
Fig. 2. 2D sector computational mesh showing piston-liner crevice region.
nC16H32 723.0 14.0 0.7174 226.44
he dynamics of a liquid gas tank filled with a hydrocarbon mixturef propane and n-butane using Matlab. Castier [46] recently pro-osed a general scheme for solving the UVn problem, where theethodology is directly based on Eq. (6). Castier [46] also proved
hat the widely used phase stability test [32] in traditional TPn flashalculations can be used when the temperature, pressure and moleumbers of a phase are determined. As a result, a new phase isdded if and only if the original tested mixture is not stable.
Especially for a pure species, the following set of equations is toe solved [30,47]:
��V u(T, P, ZV ) + (1 − �)�Lu(T, P, ZL) = �specuspec
� = �spec − �L
�V − �L
P = PS(T)
f (T, P, ZV ) = f (T, P, ZL)
(7)
is the volume fraction of the vapor phase; Ps is the saturationressure of the pure species at temperature T. f is the fugacity and Z
s the compressibility factor. Subscripts “V” and “L” stand for vapor
nd liquid phase, respectively. More details of our UVn flash solveran be found in Ref. [48].Fig. 3. Ideal gas and real gas predictions for engine charged
2.3. Thermodynamic relationships
In Phase B of KIVA, a linearized, isentropic equation is used torelate the corrected pressures and volumes [2]. To account for realgas effects, the isentropic sound speed (cs) is calculated using thethermodynamic relationship [19]:
c2s =
(∂P
∂�
)s
=(
∂P
∂�
)T
+ T
C��2
[(∂P
∂T
)�
]2
(8)
where Cv is the isochoric specific heat capacity and � is the molardensity. It is remarked that the thermodynamically true soundspeed of a two-phase mixture can be calculated using the method
proposed by Pan and Firoozabadi [49], Nichita et al. [50] andCastier [51], based on the rigorous thermodynamic definition of thewith pure n-heptane. (a) Temperature. (b) Pressure.

88 L. Qiu, R.D. Reitz / J. of Supercritical Fluids 90 (2014) 84–100
Fig. 4. Evolution of properties of the two phases for the engine charged with pure n-heptane. (a) Specific heat ratio. (b) Compressibility factors of the two phases.
Fig. 5. Evolution of properties of the Smax cell, Smin cell and Savg for the engine charged with pure n-heptane. (a) Entropy. (b) Temperature.
Fig. 6. Evolution of state of the Smax cell, Smin cell and Savg on phase diagrams for the engine charged with pure n-heptane. (a) Pressure–temperature diagram. (b)Temperature–entropy diagram. ⊕ stands for the initial state.

L. Qiu, R.D. Reitz / J. of Supercritical Fluids 90 (2014) 84–100 89
F and p(
il⎧⎪⎪⎪⎨⎪⎪⎪⎩Ti
Z
ig. 7. Contour plots of temperature, specific entropy, liquid volume fraction (xf liq)a) and (b) At −70◦ ATDC. (c) and (d) −45◦ ATDC. (e) and (f) −20◦ ATDC.
sentropic sound speed. The enthalpy (h) and entropy (s) are calcu-ated using departure functions from Refs. [52,53]
h − hig = RuT(Z − 1) +∫ �
∞
[T
(∂P
∂T
)�
− P
]d�
s − sig = Ru ln(Z) +∫ �
∞
[(∂P
∂T
)�
− Ru
V
]d�
(9)
he superscript “ig” stands for the ideal gas state properties, and Zs calculated as
= P�
RuT(10)
ressure during the compression stroke for the engine charged with pure n-heptane.
In calculating the fugacity (f), the relation [54] used is:
RuT ln(
f
xiP
)=
∫ ∞
V
[(∂P
∂ni
)T,V,nj /= i
− RuT
V
]dV − RuT ln(Z) (11)
The chemical potential () is calculated using [46]:
i = 0i (T, P0) + RuT ln
(ϕixiP
P0
)(12)
The superscript “0” stands for reference state properties and ϕ isthe fugacity coefficient. The various partial derivatives used in theUVn flash have been documented in detail in the appendix of Ref.[46].

90 L. Qiu, R.D. Reitz / J. of Supercritical Fluids 90 (2014) 84–100
F ) and(
3
ecpvtciitaw
ig. 8. Contour plots of temperature, specific entropy, liquid volume fraction (xf liqa) and (b) At 10◦ ATDC. (c) and (d) At 30◦ ATDC. (e) and (f) At 50◦ ATDC.
. Results and discussion
After the code is generalized with a realistic equation of state,ngine cycle simulations were performed to examine possibleondensation processes in the combustion chamber. The enginearameters are listed in Table 1. The simulations start at intakealve closing (IVC) timing and end at exhaust valve opening (EVO)iming. IVC timing is the crank angle after which the charge is in alosed system. EVO timing is the crank angle after which the charges released to the ambient. The RNG k−� turbulence model [55]
s used with the law of the wall boundary condition. A 0.5◦ sec-or mesh is shown in Fig. 2 showing piston-liner crevice regionnd was used for the simulations. Properties of the pure speciesere taken from DIPPR database [56] and they are summarized inpressure during the expansion stroke for the engine charged with pure n-heptane.
Table 2. The ideal gas properties, such as the specific heat capacityand entropy, were calculated using the NASA 7-coefficient polyno-mials [57]. The reference state was taken at 298.15 K and 1 bar forproperty evaluations.
3.1. Pure n-heptane
Simulations were first performed for pure n-heptane, whichis initially in the vapor phase at 385.0 K and 1.25 bar at IVC. Theaverage cylinder temperature and pressure calculated using the
ideal gas law and the real gas equation of state (EOS) with phasechange are shown in Fig. 3. For the predicted temperature shown inFig. 3(a), though the two curves are close initially, after condensa-tion occurs around −96◦ after top dead center (ATDC), spontaneous
L. Qiu, R.D. Reitz / J. of Supercritical Fluids 90 (2014) 84–100 91
Fig. 9. Ideal gas and real gas predictions for the engine charged with pure nitrogen. (a) Temperature. (b) Pressure.
r the G
hfdsiw
FT
Fig. 10. Evolution of properties of the Smax cell, Smin cell and Savg fo
eat release from the condensation increases the temperatureaster, resulting a strong slope change. Later, temperatures pre-
icted with the real gas EOS are generally higher until the latetages of the expansion stroke. For the pressure profiles shownn Fig. 3(b), because of the heating effects, the pressure predictedith real gas EOS actually becomes much lower. The maximum
ig. 11. Evolution of state of the Smax cell, Smin cell and Savg on phase diagrams for
emperature–entropy diagram. ⊕ stands for the initial state.
M engine filled with pure nitrogen. (a) Entropy. (b) Temperature.
difference in temperature and pressure is about 45 K and 12 bararound TDC, respectively. It is noticed that the pressure changes
gradually in both cases, though condensation effects are obviouslyobserved from the temperature profiles. This means that the tem-perature is a better indication of the occurrence of phase changesover the pressure.the engine charged with pure nitrogen. (a) Pressure–temperature diagram. (b)

92 L. Qiu, R.D. Reitz / J. of Supercritical Fluids 90 (2014) 84–100
tures.
ysIhiccspcp
Fig. 12. Vapor–liquid equilibrium predictions for binary mix
In addition, since thermodynamic calculation with phase changeields the true thermodynamic state satisfying the equilibrium con-traints, Fig. 3 proves the importance of the phase transition model.t is seen from Fig. 4(a) that the specific heat ratio of the liquid isigher than that of the vapor phase, and the averaged value lies
n between. On the contrary, Fig. 4(b) shows that the vapor phaseompressibility is higher than that of the liquid phase. These plotslearly shows that condensation occurs when the compression is
trong enough to convert some gaseous n-heptane into the liquidhase, as evidenced by the jump in the compressibility or the spe-ific heat ratio of the liquid phase. Note that because the liquidhase is a newly formed phase, discontinuity of its properties isFig. 13. Predictions of temperature ((a) and (c)) and pressure ((b) and (d)) of the engi
(a) n-heptane and nitrogen. (b) n-hexadecane and nitrogen.
expected. Similarly in the expansion stroke, the drop of specificheat ratio or compressibility factor of the liquid phase indicatesthat the liquid phase is converted back to the vapor phase throughthe evaporation.
Once the thermodynamic state of each computational cell isdetermined, thermodynamic properties, such as entropy, etc., canbe calculated to further quantify the state change. For this purpose,cells with the maximum and minimum entropy (i.e., Smax and Smin
cells) were monitored, as well as the cylinder averaged entropy.Fig. 5(a) presents the dynamic change of the maximum, minimum,and average entropy, and shows that Smax and Smin are differentbut Savg is close to Smin. Fig. 5(b) shows that the Smax cell has higherne. (a) and (b) n-heptane and nitrogen. (c) and (d) n-hexadecane and nitrogen.

L. Qiu, R.D. Reitz / J. of Supercritical Fluids 90 (2014) 84–100 93
F c)) ann
tttadsccdt
tittaSwassmstcspidi
ig. 14. Effects of pressure and temperature on isentropic sound speed ((a) and (-hexadecane and nitrogen.
emperatures. This indicates that a small number of cells are at highemperature. It is seen that before around −40◦ ATDC, the tempera-ure of the Smax cell is higher than the other two. Since the pressuresre close to uniform, the temperature plays the dominant role inetermining the entropy. Afterward, the overlap in temperaturehows that there is less temperature inhomogeneity for the wholeharge. However, the difference in the entropy (see Fig. 5(a)) indi-ates that the amounts of liquid phase in those two-phase cells areifferent. After around −20◦ ATDC, the majority of the charge is inhe medium entropy state, as shown in figures below.
It is helpful to present the state change on a phase diagramo better illustrate the phase transition process. Fig. 6(a) and (b)llustrates the dynamic state changes on pressure–temperature andemperature–entropy phase diagrams, respectively. From Fig. 6(a),he charge initially in the vapor-phase is continuously compressednd it later enters the two-phase region with condensation. Themin cell enters the two-phase region earlier than the Smax cell,hich is not brought into the two-phase region until 50◦ crank
ngles later, after which the whole charge is two-phase. The chargetays in the two-phase region during the following compressiontroke and further compression makes the two-phase mixtureoving further away from the phase boundary and toward a
tate with more liquid. In the expansion stroke, it is seen thathe two-phase mixture experiences continuous evaporation, whichonverts all the liquid phase charge back to vapor phase. It is moretraightforward to analyze the process on a temperature-entropy
hase diagram, as shown in Fig. 6(b). Now the two-phase regions constrained in the phase envelop composed of the bubble andew point lines meeting at the critical point. This plot more clearly
llustrates how the Smin cell enters into the two-phase region and
d specific heat ratio ((b) and (d)). (a) and (b) n-heptane and nitrogen. (c) and (d)
how it penetrates toward the bubble point line upon further com-pression. At the end of the simulation at EVO, the Smin cell still doesnot return back to the vapor phase while the Smax cell does. Thismeans that some of the charge is still in two-phase.
Fig. 7 presents contour plots of temperature, pressure, liquidvolume fraction, and entropy at selected crank angles during thecompression stroke. The Smax cell always resides in the lowercrevice region. In practical engines, the piston-liner crevice regionfeatures complex physical processes associated with piston ringmotion and sealing, including lubricating oil film formation, com-bustion chamber gas blow-by flows, and targeted-under-piston oilcooling heat transfer. In the present simplified simulations blow-by is neglected, and the crevice region is assumed to only containcombustion chamber fluid (i.e., piston ring motion and lubricat-ing oil effects are not considered). In addition, the piston and linerwall temperatures are assumed to be constant, as listed in Table 1.Fig. 7(b) shows that the majority of the charge is two-phase mix-ture and the gaseous n-heptane is located in the wall region andthe lower portion of the bowl at −70◦ ATDC. This could be due tolocal wall heat transfer effects. As compression continues, at −45◦
ATDC, the liquid volume fraction increases, but the cells in the lowercrevice region are still in pure vapor phase (see Fig. 7(c) and (d)).As compression continues, all the charge is converted to two-phaseby −20◦ ATDC, as shown in Fig. 7(f). Comparing the liquid volumefraction in Fig. 7(b), (d) and (f), it is evident that more n-heptane isconverted to liquid during compression, which is consistent with
the thermodynamic analysis above. Similar plots are shown in Fig. 8during the expansion stroke at three time instants: 10◦, 30◦ and 50◦ATDC. Comparison of the entropy contours shows that the Smax cellis still located in the crevice region. At the same time, the Smin cell

94 L. Qiu, R.D. Reitz / J. of Supercritical Fluids 90 (2014) 84–100
ixture
ipapFn
3
gaatsspgtcctniSicsct
Fig. 15. Evolution of properties of the Smax cell, Smin cell and Savg. (a) and (b) M
s in the wall region, where heat transfer affects the local fluid tem-erature. As a result, the cell with maximum liquid volume fractionlso exists in the wall region (see Fig. 8(b), (d) and (e)). The liquidhase continuously decreases in the expansion stroke, as expected.inally, the last two-phase mixture is located in the upper cornerear the wall.
.2. Pure nitrogen
Simulations were also performed for a homogeneous pure nitro-en charge. Initially the charge is in the vapor phase at 1.25 barnd 100 K (this setup was only intended to set the initial state in
subcritical state, which allows for possibility of condensation inhe cycle simulations). The average cylinder temperature and pres-ure are shown in Fig. 9(a) and (b), respectively. Comparing theimulation results of the ideal gas with the real gas, both the tem-erature and pressure profiles share similar shapes but the idealas simulation underestimates the temperature by about 70 K andhe pressure by about 4 bar around TDC. These differences, espe-ially in temperature, indicate that the real gas effects must beonsidered at supercritical state when the thermodynamic proper-ies non-idealities are important. In contrast to the results for pure-heptane above, condensation does not occur as there is no sudden
ncrease in temperature slope. Evolutions of the properties of themax cell, Smin cell and Savg are shown in Fig. 10. It is noted that Savg
s close to Smin, while Smax increases with temperature. This indi-
ates that only a small portion of the charge is at the higher entropytate, which is in the crevice region. Because Smin does not decrease,ondensation is not expected, which is better shown in Fig. 11. Inhe pressure–temperature diagram in Fig. 11(a), it is seen that theof n-heptane and nitrogen. (c) and (d) Mixture of n-hexadecane and nitrogen.
state of the Smax and the Smin cell do not intersect the saturationlines of pure nitrogen. Fig. 11(b) shows that if the nitrogen is ini-tially in the vapor phase, the compression can only move the fluidto a supercritical state at higher temperatures so it can never touchthe dew point line. Such fluids are named regular fluids [58], andinclude air and water. On the other hand, species like n-heptane areretrograde fluids [58] as only through compression can the gaseousfluid experience condensation.
3.3. Binary mixtures of n-alkane and nitrogen
In the simulations in Ref. [19], three naphthalene and nitrogenmixtures were studied. However, possible phase change is not con-sidered as there is not a phase transition model. In the presentstudy, binary mixtures of n-heptane (nC7H16) or n-hexadecane(nC16H34) mixed with nitrogen were considered. This is motivatedby the fact that n-heptane is commonly used as a surrogate ofdiesel fuel to study its evaporation characteristics (e.g., see Refs.[7,9,59–61]) and has been used as a primary reference fuel (PRF)in direct injection engine combustion simulations [62]. Therefore,understanding the characteristics of such binary mixtures is ben-eficial for investigations of possible condensation in engine-likeconditions.
For mixtures of nC7H16-N2 the UVn flash calculation must berobust and efficient as it requires many calculations compared tosimulations for pure species. Since the phase behavior of a mixture
depends not only on temperature and pressure, but also its com-position, a homogeneous mixture was used in the simulations toavoid composition effects. Vapor–liquid equilibrium calculationswere performed at first to select the binary interaction parameter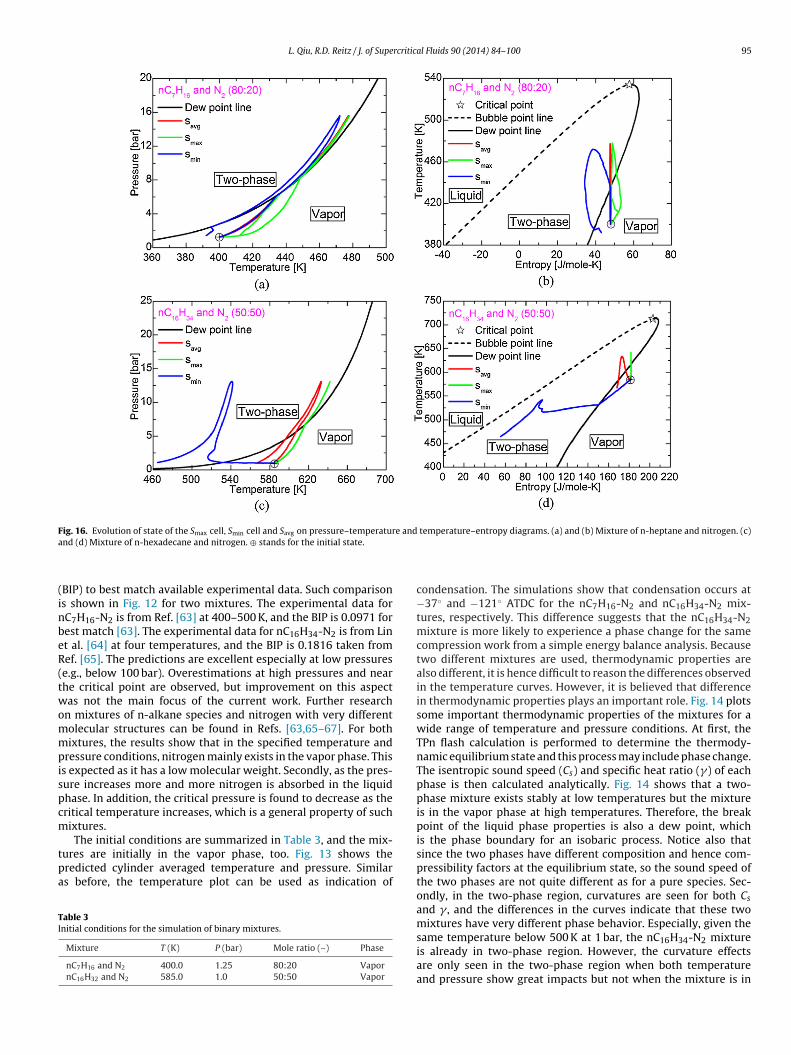
L. Qiu, R.D. Reitz / J. of Supercritical Fluids 90 (2014) 84–100 95
Fig. 16. Evolution of state of the S cell, S cell and S on pressure–temperature and temperature–entropy diagrams. (a) and (b) Mixture of n-heptane and nitrogen. (c)a
(inbeR(twommpispcm
tpa
TI
max min avg
nd (d) Mixture of n-hexadecane and nitrogen. ⊕ stands for the initial state.
BIP) to best match available experimental data. Such comparisons shown in Fig. 12 for two mixtures. The experimental data forC7H16-N2 is from Ref. [63] at 400–500 K, and the BIP is 0.0971 forest match [63]. The experimental data for nC16H34-N2 is from Lint al. [64] at four temperatures, and the BIP is 0.1816 taken fromef. [65]. The predictions are excellent especially at low pressurese.g., below 100 bar). Overestimations at high pressures and nearhe critical point are observed, but improvement on this aspectas not the main focus of the current work. Further research
n mixtures of n-alkane species and nitrogen with very differentolecular structures can be found in Refs. [63,65–67]. For bothixtures, the results show that in the specified temperature and
ressure conditions, nitrogen mainly exists in the vapor phase. Thiss expected as it has a low molecular weight. Secondly, as the pres-ure increases more and more nitrogen is absorbed in the liquidhase. In addition, the critical pressure is found to decrease as theritical temperature increases, which is a general property of suchixtures.
The initial conditions are summarized in Table 3, and the mix-ures are initially in the vapor phase, too. Fig. 13 shows theredicted cylinder averaged temperature and pressure. Similars before, the temperature plot can be used as indication of
able 3nitial conditions for the simulation of binary mixtures.
Mixture T (K) P (bar) Mole ratio (–) Phase
nC7H16 and N2 400.0 1.25 80:20 VapornC16H32 and N2 585.0 1.0 50:50 Vapor
condensation. The simulations show that condensation occurs at−37◦ and −121◦ ATDC for the nC7H16-N2 and nC16H34-N2 mix-tures, respectively. This difference suggests that the nC16H34-N2mixture is more likely to experience a phase change for the samecompression work from a simple energy balance analysis. Becausetwo different mixtures are used, thermodynamic properties arealso different, it is hence difficult to reason the differences observedin the temperature curves. However, it is believed that differencein thermodynamic properties plays an important role. Fig. 14 plotssome important thermodynamic properties of the mixtures for awide range of temperature and pressure conditions. At first, theTPn flash calculation is performed to determine the thermody-namic equilibrium state and this process may include phase change.The isentropic sound speed (Cs) and specific heat ratio (�) of eachphase is then calculated analytically. Fig. 14 shows that a two-phase mixture exists stably at low temperatures but the mixtureis in the vapor phase at high temperatures. Therefore, the breakpoint of the liquid phase properties is also a dew point, whichis the phase boundary for an isobaric process. Notice also thatsince the two phases have different composition and hence com-pressibility factors at the equilibrium state, so the sound speed ofthe two phases are not quite different as for a pure species. Sec-ondly, in the two-phase region, curvatures are seen for both Cs
and � , and the differences in the curves indicate that these twomixtures have very different phase behavior. Especially, given the
same temperature below 500 K at 1 bar, the nC16H34-N2 mixtureis already in two-phase region. However, the curvature effectsare only seen in the two-phase region when both temperatureand pressure show great impacts but not when the mixture is in
96 L. Qiu, R.D. Reitz / J. of Supercritical Fluids 90 (2014) 84–100
Fig. 17. Contour plots of liquid volume fraction (xf liq) and entropy. (a) and (b) At −40◦ ATDC. (c) and (d) −20◦ ATDC. (e) and (f) 0◦ ATDC. (g) and (h) At 20◦ ATDC. (i) and (j)50◦ ATDC. (a), (c), (e), (g) and (i) for mixture of 80% n-heptane and 20% nitrogen. (b), (d), (f), (h) and (j) for mixture of 50% n-hexadecane and 50% nitrogen.

L. Qiu, R.D. Reitz / J. of Supercritical Fluids 90 (2014) 84–100 97
F n. (b)t n of th
atpmd
FaAImicmtoa
tdNtmrclmepi
maSdrqcwswuetttw
the expected range. This means that for a mixture of these two
ig. 18. Temperature–mole fraction diagram. (a) Mixture of n-heptane and nitrogehe references to color in this figure legend, the reader is referred to the web versio
single phase, as expected. Finally, for a single-phase mixture,he dependence of Cs seems to be bifurcated as the high and lowressure curves intersect. On the other hand, � of a single-phaseixture decreases with temperature increases but with pressure
ecrease.Monitoring of the Smax and Smin cell and Savg is shown in Fig. 15.
or the nC7H16-N2 mixture, it is seen from Fig. 15(a) and (b) thatll the charge is mainly at a lower entropy state before −20◦
TDC while the higher entropy state cells overwhelm afterwards.n comparison, Fig. 15(c) and (d) shows that for the nC16H34-N2
ixture the charge is dominated by a higher entropy state. Morenterestingly, it is easily noticed from Fig. 15(a) and (c) that theondensation time closely corresponds to the sudden drop of mini-um entropy as the lower liquid phase entropy effectively lessens
he mixture averaged entropy. As a result of the earlier occurrencef condensation for the nC16H32-N2 mixture, Smin keeps decreasings compression continues.
Fig. 16 presents the thermodynamic path analysis. Note that onhe pressure–temperature diagram in Fig. 16(a) and (c), only theew point line is shown. It is seen that the Smin cell for the nC16H32-2 mixture stays further away from the phase boundary, indicating
hat stronger condensation has occurred, consistent with Fig. 15. Asentioned before, evaporation occurs in the expansion stroke. The
esults show that the two-phase nC7H16-N2 charge is completelyonverted back to the original vapor phase, as evidenced by theocation of the Smin cell state. On the contrary, for the nC16H34-N2
ixture, some of the charge is still in the two-phase region at thend of the expansion because the Smin cell still remains inside thehase envelop. Actually, Fig. 16(d) shows that the Smin cell keeps
nvading deeply into the two-phase region.For more detailed information, contour plots of the liquid phase
ole fraction and entropy are presented in Fig. 17 at five crankngles (−40◦, −20◦, 0◦, 20◦ and 50◦ ATDC) for the two mixtures.imilar observations can be made for both mixtures. Before con-ensation, the Smax cells are limited to the lower part of the creviceegion. The first condensation is found to start in the bulk flow anduickly condensation is also observed in the crevice region. Afterondensation occurs, the two-phase cells progress outward and thehole chamber is filled with two-phase mixtures, but with liquid
tratifications. In addition, after the whole charge is two-phase, theall and crevice region has the lowest entropy as the maximum liq-id phase charge is seen there. In other words, the crevice regionxperiences the strongest phase change with entropy change. Athe later stages of the expansion, the maximum liquid volume frac-ion and hence the Smin cell is in the wall region. Similar to before,
wo-phase mixture is lastly found in the upper corner near theall.Mixture of n-hexadecane and nitrogen. “CP” – critical point. (For interpretation ofis article.)
3.4. Diesel engine operation
The engine simulations above for homogeneous vapor chargesshow that condensation can occur in the compression stroke. Thequestion is: can both condensation and evaporation occur in dieselengine conditions? For simplicity, we assume that the fuel is com-posed of a single surrogate and the ambient gas is pure nitrogen. Thecritical point of the mixture is determined by performing the TPnflash [40], and the results for nC7H16-N2 and nC16H34-N2 mixturesare presented in Fig. 18(a) and (b), respectively. Pr is the reducedpressure (defined here as the ratio between the pressure and thecritical pressure of the fuel surrogate). Tr is the reduced tempera-ture with similar definition. “CP” is the critical point of the mixtureand it is determined when the two phases have similar compositionand above which gas and liquid phases cannot coexist [31]. Due tothe corresponding state principles-based equation of state model,the two mixtures show similar characteristics. When Pr is less than1, the critical temperature (Tc) increases with the critical pressure(Pc) until Pr = 1, and the trend becomes opposite when Pr is largerthan 1. In addition, the increasing (when Pr < 1) and decreasing(when Pr > 1) rates of Tc are different. Therefore, the critical mixingdiagram of a mixture must consider both composition and temper-ature effects. The non-linear relationship between Tc and Pc of themixture is shown in Fig. 19(a), which is the critical mixing diagramof the binary mixtures of pure n-alkanes with nitrogen, includingn-heptane, n-decane and n-hexadecane. The critical points of thepure components are also shown in symbols for comparison. Tak-ing the nC7H16-N2 mixture as an example, the pink dashed lineshows a one-to-one relationship between the composition and thecritical point when the mole fraction of nC7H16 is 80%. It is foundthat Tc reaches a maximum at around the critical temperature ofpure nC7H16 when there is about 0.7% of nitrogen. As the nitro-gen composition increases, the slope of the pressure–temperaturecurve becomes very large, indicating that Pc is more sensitive thanTc to the change of nitrogen composition. The opposite trend isfound for the mole fraction of the fuel surrogate: the higher it is,the lower Pc. Due to the rise of Pc by adding nitrogen, the phasebehavior of the mixture is distinctive from that of pure n-heptaneor nitrogen.
Possible intersection of the critical mixing line with dieseloperating conditions was also explored. The typical dieseloperating range was obtained from Zhu and Reitz [68]. Thepressure–temperature diagram in Fig. 19(a) reveals that the crit-ical mixing lines of nC7H16-N2 and nC10H22-N2 do not fall into
types initially in the vapor phase, regardless of its composition, atwo-phase mixture cannot exist as condensation is not physically

98 L. Qiu, R.D. Reitz / J. of Supercritical Fluids 90 (2014) 84–100
Fig. 19. (a) Critical mixing pressure–temperature and mole fraction–temperature diagrams of n-heptane (black), decane (red) and n-hexadecane (blue) and nitrogen. Shadedarea is typical diesel operation range. Symbols represent the critical point of pure n-heptane (square), decane (circle) and n-hexadecane (triangle). The pink dashed lines . (b) Pf r in th
pmlihistsmnppiptstlticse
4
efsoPaottc
agcn
tands represents the critical point of the 80% n-heptane and 20% nitrogen mixtureour compositions. “CP” – critical point. (For interpretation of the references to colo
ossible. However, with heavier surrogates, the critical mixing lineoves closer to the operating range, as seen by the critical mixing
ine of nC10H22-N2. Qualitatively, condensation becomes possiblef the fuel surrogate is represented by n-dodecane (nC12H26) or aeavier n-alkane species. Note that n-tetradecane (nC14H34), which
s inside this range, has been chosen as the diesel fuel physicalurrogate as they share similar physical properties [69]. Indeed,he condensation conditions for nC16H34-N2 mixture fall onto thehaded intersection region. The phase diagram of the nC16H34-N2ixture is shown in Fig. 19(b) with its critical mixing line at four
C16H34 mole fractions: 0.9, 0.7, 0.5 and 0.3. For a specified com-osition, the two-phase region is bounded by the bubble and dewoint lines, and the mixture critical point falls onto the critical mix-
ng line. The region to the left of the critical mixing line on theressure–temperature diagram is the only possible region wherewo phases coexist; otherwise the mixture is in the supercriticaltate. Therefore, in diesel spray simulations using a single surrogateo represent fuel evaporation, condensation is expected to occurocally where the temperature, pressure and composition condi-ions fall into the two-phase region. The formation of liquid fueln wall regions is another source of wall films and hence could belosely correlated to soot formation process. More detailed conden-ation behavior and its effects on combustion and emissions will bexplored in future diesel spray investigations.
. Summary and conclusions
To investigate the possibility of condensation occurring inngine combustion chamber, a CFD code was modified to accountor real gas effects by adopting the Peng–Robinson equation oftate (PR EOS), and incorporating a phase transition model basedn fundamental classical thermodynamics. To be consistent, theR EOS was applied for calculating the properties of both liquidnd vapor phases. Specifically, the phase transition model is basedn an isoenergetic–isochoric flash calculation that maximizes mix-ure entropy with possible phase change. Formulated in this way,he final equilibrium state is guaranteed to be thermodynamicallyorrect.
Simulations were performed for an engine initially filled with
pure species or binary mixtures. For regular fluid such as nitro-en, the expansion stroke does not form a two-phase fluid so noondensation occurs. For retrograde fluids such as n-heptane, theascent condensation takes place at −96◦ ATDC in the bulk flowressure–temperature phase diagram of the n-hexadecane and nitrogen mixture atis figure legend, the reader is referred to the web version of this article.)
region and the maximum entropy location is limited in the lowerpiston liner crevice region. For binary n-heptane/nitrogen and n-hexadecane/nitrogen mixtures, condensation starts at −37◦ and−121◦ ATDC, respectively. Thermodynamic analysis shows thatcondensation is possible under typical diesel operation conditionsif the fuel is represented by surrogates of C12 or higher n-alkanespecies and the ambient gas is nitrogen. General conclusions canbe draw from the simulations as follows:
(1) Before condensation occurs, the crevice region features themaximum entropy as the temperature and pressure thereincrease. After the charge is converted to a vapor–liquid mix-ture, the maximum entropy occurs in regions with least liquidvolume fraction.
(2) Condensation occurs when the compression sends the fluidacross the phase border (i.e., the dew point line) to be in thetwo-phase region. This is observed to start first in the bulk flowaway from the crevice. After the first condensation event, moreand more condensation is induced as the compression contin-ues. The maximum liquid volume fraction increases and reachesa maximum around top dead center.
(3) In the expansion stroke, the liquid phase is continuously con-verted to the gaseous phase through the evaporation process.The liquid phase is continuously depleted as the two-phasemixture moves toward the dew point line. The last two-phasemixture location is found to be in the upper wall region of thecombustion chamber.
Acknowledgements
The research work was conducted at the Engine Research Centerand sponsored by Department of Energy (DOE) and Sandia NationalLaboratories through the Advanced Engine Combustion Program(MOU 04-S-383) under the management of Dr. Dennis L. Siebers.Lu Qiu would like to acknowledge the helpful discussions on theUVn flash with Prof. Marcelo Castier at the TAMU at Qatar.
References
[1] R.D. Reitz, R. Diwakar, Structure of High-Pressure Fuel Sprays, SAE TechnicalPaper 870598, 1987.
[2] A.A. Amsden, P.J. O’Rourke, T.D. Butler, KIVA-II: A Computer Program for Chem-ically Reactive Flows with Sprays, Technical Report, LA-11560-MS, Los AlamosNational Laboratory, 1989.

rcritic
[
[
[
[
[
[
[
[
[
[
[
[
[
[
[
[
[
[
[
[
[
[
[
[
[
[
[
[
[
[
[
[
[
[
[
[
[
[
[
[
[
[
[
[
[
[
[
[
[
[
[
[
[
[
[
L. Qiu, R.D. Reitz / J. of Supe
[3] J.A. Manrique, G.L. Borman, Calculations of steady state droplet vaporizationat high ambient pressures, International Journal of Heat and Mass Transfer 12(1969) 1081–1095.
[4] O. Redlich, J.N.S. Kwong, On the thermodynamics of solutions. V. An equa-tion of state. Fugacities of gaseous solutions, Chemical Reviews 44 (1949)233–244.
[5] J.D. Jin, G.L. Borman, A Model for Multicomponent Droplet Vaporization at HighAmbient Pressures, SAE Technical Paper 850264, 1985.
[6] K.C. Hsieh, J.S. Shuen, V. Yang, Droplet vaporization in high-pressure envi-ronments. 1. Near critical conditions, Combustion Science and Technology 76(1991) 111–132.
[7] E.W. Curtis, P.V. Farrell, A numerical study of high-pressure droplet vaporiza-tion, Combustion and Flame 90 (1992) 85–102.
[8] D.Y. Peng, D.B. Robinson, A new two-constant equation of state, Industrial andEngineering Chemistry Fundamentals 15 (1976) 59–64.
[9] K. Harstad, J. Bellan, An all-pressure fluid drop model applied to a binary mix-ture: heptane in nitrogen, International Journal of Multiphase Flow 26 (2000)1675–1706.
10] G.S. Zhu, S.K. Aggarwal, Transient supercritical droplet evaporation withemphasis on the effects of equation of state, International Journal of Heat andMass Transfer 43 (2000) 1157–1171.
11] S.D. Givler, J. Abraham, Supercritical droplet vaporization and combustion stud-ies, Progress in Energy and Combustion Science 22 (1996) 1–28.
12] J. Bellan, Supercritical (and subcritical) fluid behavior and modeling: drops,streams, shear and mixing layers, jets and sprays, Progress in Energy and Com-bustion Science 26 (2000) 329–366.
13] V. Yang, Modeling of supercritical vaporization, mixing, and combustion pro-cesses in liquid-fueled propulsion systems, Proceedings of the CombustionInstitute 28 (2000) 925–942.
14] A. Roy, C. Joly, C. Segal, Disintegrating supercritical jets in a subcritical environ-ment, Journal of Fluid Mechanics 717 (2013) 193–202.
15] P.P. Wegener, L.M. Mack, Condensation in supersonic and hypersonic wind tun-nels, in: H.L. Dryden, K.Th. von (Eds.), Advances in Applied Mechanics, Elsevier,1958, pp. 307–447.
16] F.L. Daum, Air condensation in a hypersonic wind tunnel, AIAA Journal 1 (1963)1043–1046.
17] A.A. Amsden, KIVA-3V, Release 2, Improvements to KIVA-3V, Technical Report,LA-UR-99-915, Los Alamos National Laboratory, 1999.
18] R.D. Reitz, C.J. Rutland, Development and testing of diesel engine CFD models,Progress in Energy and Combustion Science 21 (1995) 173–196.
19] M.F. Trujillo, P.J. O’Rourke, D. Torres, Generalizing the Thermodynamics StateRelationships in KIVA-3V, Los Alamos Technical Report, Los Alamos NationalLaboratories, 2002.
20] M.F. Trujillo, D.J. Torres, P.J. O’Rourke, High-pressure multicomponent liq-uid sprays: departure from ideal behaviour, International Journal of EngineResearch 5 (2004) 229–246.
21] T. Kim, Y. Kim, S.-K. Kim, Numerical study of cryogenic liquid nitrogenjets at supercritical pressures, Journal of Supercritical Fluids 56 (2011)152–163.
22] W.A. Burgess, D. Tapriyal, B.D. Morreale, Y. Soong, H.O. Baled, R.M. Enick, Y.Wu, B.A. Bamgbade, M.A. McHugh, Volume-translated cubic EoS and PC-SAFTdensity models and a free volume-based viscosity model for hydrocarbonsat extreme temperature and pressure conditions, Fluid Phase Equilibria 359(2013) 38–44.
23] I.G. Economou, Statistical associating fluid theory: a successful model forthe calculation of thermodynamic and phase equilibrium properties of com-plex fluid mixtures, Industrial and Engineering Chemistry Research 41 (2001)953–962.
24] S.P. Tan, H. Adidharma, M. Radosz, Recent advances and applications of statis-tical associating fluid theory, Industrial and Engineering Chemistry Research47 (2008) 8063–8082.
25] D.B. Robinson, D.Y. Peng, The Characterization of the Heptanes and HeavierFractions For the GPA Peng–Robinson Programs, Research report RR-28, GasProcessors Association, 1978.
26] D. Schmidt, C. Rutland, M. Corradini, A Numerical Study of Cavitating FlowThrough Various Nozzle Shapes, SAE 971597, 1997.
27] C. Habchi, N. Dumont, O. Simonin, Multidimensional simulation of cavitat-ing flows in diesel injectors by a homogeneous mixture modeling approach,Atomization and Sprays 18 (2008) 129–162.
28] W.G. Lee, R.D. Reitz, A numerical investigation of transient flow and cavita-tion within minisac and valve-covered orifice diesel injector nozzles, Journalof Engineering for Gas Turbines and Power 132 (2010) 052802.
29] Y. Wang, R.D. Reitz, Simulating nozzle flow and sprays using an Eulerian two-phase flow model with a realistic equation of state, in: ICLASS 2012, 12thTriennial Conference on Liquid Atomization and Spray Systems, Heidelberg,Germany, September 2–6, 2012.
30] K.E.T. Giljarhus, S.T. Munkejord, G. Skaugen, Solution of the Span–Wagner equa-tion of state using a density–energy state function for fluid-dynamic simulationof carbon dioxide, Industrial and Engineering Chemistry Research 51 (2012)1006–1014.
31] H.B. Callen, Thermodynamics and An Introduction to Thermostatics, 2nd ed., J.
Wiley, New York, Chichester, 1985.32] M.L. Michelsen, The isothermal flash problem. 1. Stability, Fluid Phase Equilibria9 (1982) 1–19.
33] L.E. Baker, A.C. Pierce, K.D. Luks, Gibbs energy analysis of phase equilibria, SPEJournal 22 (1982) 731–742.
[
[
al Fluids 90 (2014) 84–100 99
34] J.W. Gibbs, A method of geometrical representation of the thermodynamicproperties of substances by means of surfaces, Transactions of the ConnecticutAcademy of Arts and Sciences II (1873) 382–404.
35] L.X. Nghiem, Y.K. Li, Computation of multiphase equilibrium phenomena withan equation of state, Fluid Phase Equilibria 17 (1984) 77–95.
36] L.X. Nghiem, Y.-K. Li, R.A. Heidemann, Application of the tangent plane criterionto saturation pressure and temperature computations, Fluid Phase Equilibria21 (1985) 39–60.
37] D.V. Nichita, S. Gomez, E. Luna, Multiphase equilibria calculation by direct mini-mization of Gibbs free energy with a global optimization method, Computers& Chemical Engineering 26 (2002) 1703–1724.
38] H. Hoteit, A. Firoozabadi, Simple phase stability-testing algorithm in the reduc-tion method, AIChE Journal 52 (2006) 2909–2920.
39] Z.D. Li, A. Firoozabadi, General strategy for stability testing and phase-splitcalculation in two and three phases, SPE Journal 17 (2012) 1096–1107.
40] L. Qiu, Y. Wang, Q. Jiao, H. Wang, R.D. Reitz, Development of a thermody-namically consistent, robust and efficient phase equilibrium solver and itsvalidations, Fuel 115 (2014) 1–16.
41] S. Saha, J.J. Carroll, The isoenergetic–isochoric flash, Fluid Phase Equilibria 138(1997) 23–41.
42] M.L. Michelsen, State function based flash specifications, Fluid Phase Equilibria158 (1999) 617–626.
43] F.M. Goncalves, M. Castier, O.Q.F. Araujo, Dynamic simulation of flash drumsusing rigorous physical property calculations, Brazilian Journal of ChemicalEngineering 24 (2007) 277–286.
44] E.R.A. Lima, M. Castier, E.C. Biscaia, Differential-algebraic approach to dynamicsimulations of flash drums with rigorous evaluation of physical properties, Oil& Gas Science and Technology 63 (2008) 677–686.
45] A.R.J. Arendsen, G.F. Versteeg, Dynamic thermodynamics with internalenergy, volume, and amount of moles as states: application to lique-fied gas tank, Industrial and Engineering Chemistry Research 48 (2009)3167–3176.
46] M. Castier, Solution of the isoenergetic–isochoric flash problem by directentropy maximization, Fluid Phase Equilibria 276 (2009) 7–17.
47] A.M. Star, J.R. Edwards, K.C. Lin, S. Cox-Stouffer, T.A. Jackson, Numerical simu-lation of injection of supercritical ethylene into nitrogen, Journal of Propulsionand Power 22 (2006) 809–819.
48] L. Qiu, Development of an isoenergetic–isochoric flash solver based on entropymaximization principle, Internal Research Report, Engine Research Center, Uni-versity of Wisconsin-Madison, 2013 (June 2013).
49] H.Q. Pan, A. Firoozabadi, Two-phase isentropic compressibility and two-phasesonic velocity for multicomponent–hydrocarbon mixtures, SPE Reservoir Eval-uation & Engineering 3 (2000) 335–341.
50] D.V. Nichita, P. Khalid, D. Broseta, Calculation of isentropic compressibility andsound velocity in two-phase fluids, Fluid Phase Equilibria 291 (2010) 95–102.
51] M. Castier, Thermodynamic speed of sound in multiphase systems, Fluid PhaseEquilibria 306 (2011) 204–211.
52] S.I. Sandler, Chemical and Engineering Thermodynamics, 3rd ed., Wiley, NewYork, 1999.
53] A. Firoozabadi, Thermodynamics of Hydrocarbon Reservoirs, McGraw-Hill,New York, 1999.
54] J.M. Prausnitz, E.G.d. Azevedo, R.N. Lichtenthaler, Safari Tech Books Online, in:Molecular Thermodynamics of Fluid-Phase Equilibria, 3rd ed., Prentice HallPTR, Upper Saddle River, NJ, 1999.
55] Z. Han, R.D. Reitz, Turbulence modeling of internal combustion enginesusing RNG k-epsilon models, Combustion Science and Technology 106 (1995)267–295.
56] R.L. Rowley, W.V. Wilding, J.L. Oscarson, N. Giles, R.J. Rowley, T.E. Daubert, R.P.Danner, DIPPR Data Compilation of Pure Compound Properties, 2001.
57] B.J. Sanford Gordon, McBride, Computer Program for Calculation of ComplexChemical Equilibrium Compositions and Applications: I. Analysis, NASA Refer-ence Publication 1311, 1994 (October 1994).
58] P.A. Thompson, D.A. Sullivan, Possibility of complete condensationshock-waves in retrograde fluids, Journal of Fluid Mechanics 70 (1975)639–649.
59] J.P. Hartfield, P.V. Farrell, Droplet vaporization in a high-pressure gas, Journalof Heat Transfer: ASME 115 (1993) 699–706.
60] G.-S. Zhu, R.D. Reitz, S.K. Aggarwal, Gas-phase unsteadiness and its influenceon droplet vaporization in sub- and super-critical environments, InternationalJournal of Heat and Mass Transfer 44 (2001) 3081–3093.
61] Y. Ra, R.D. Reitz, A vaporization model for discrete multi-component fuel sprays,International Journal of Multiphase Flow 35 (2009) 101–117.
62] Y. Ra, R.D. Reitz, A reduced chemical kinetic model for IC engine combustionsimulations with primary reference fuels, Combustion and Flame 155 (2008)713–738.
63] F. Garcia-Sanchez, G. Eliosa-Jimenez, G. Silva-Oliver, A. Godinez-Silva, High-pressure (vapor plus liquid) equilibria in the (nitrogen plus n-heptane) system,Journal of Chemical Thermodynamics 39 (2007) 893–905.
64] H.M. Lin, H.M. Sebastian, J.J. Simnick, K.C. Chao, Gas–liquid equilibrium inbinary-mixtures of methane with N-decane, benzene, and toluene, Journal ofChemical and Engineering Data 24 (1979) 146–149.
65] F. García-Sánchez, G. Eliosa-Jiménez, G. Silva-Oliver, R. Vázquez-Román,Vapor–liquid equilibria of nitrogen–hydrocarbon systems using the PC-SAFTequation of state, Fluid Phase Equilibria 217 (2004) 241–253.
66] R. Privat, J.-N. Jaubert, F. Mutelet, Addition of the nitrogen group to the PPR78model (Predictive 1978, Peng–Robinson EOS with temperature-dependent kij

1 rcritic
[
00 L. Qiu, R.D. Reitz / J. of Supe
calculated through a group contribution method), Industrial and EngineeringChemistry Research 47 (2008) 2033–2048.
67] J.N. Jaubert, R. Privat, F. Mutelet, Predicting the phase equilibria of syn-thetic petroleum fluids with the PPR78 approach, AIChE Journal 56 (2010)3225–3235.
[
[
al Fluids 90 (2014) 84–100
68] G.S. Zhu, R.D. Reitz, Engine fuel droplet high-pressure vaporization mod-eling, Journal of Engineering for Gas Turbines and Power 123 (2000)412–418.
69] A. Krishnasamy, R.D. Reitz, W. Willems, E. Kurtz, Surrogate Diesel Fuel Modelsfor Low Temperature Combustion, SAE 2013-01-1092, 2013.