concrete joint evaluation - minnesota department of
TRANSCRIPT

FEASIBILITY OF A JOINT CONDITION EVALUATION PROCESS
Bernard Igbafen Izevbekhai, P.E., PhD [email protected] Research Operations Engineer
Minnesota Department of Transportation
Research Pays Off Series Office of Materials and Road Research June 21 2016.

Sealant in Good Condition Sealant in Moderate
to Poor Condition
PROBLEM STATEMENT
Trapezoidal Deterioration at Bottom of Panel
A seal has to be a true seal

Evidence of Scouring
Non Draining Base
Draining Base
PROBLEM STATEMENT

Classic Case of Poor Drainage Vs Good Drainage MnROAD
Classic Case of Poor Drainage Vs Good Drainage TH 169, TH 210 Rohne et al 2010
Rohne et al 2010
SUBSURFACE DISTRESSES

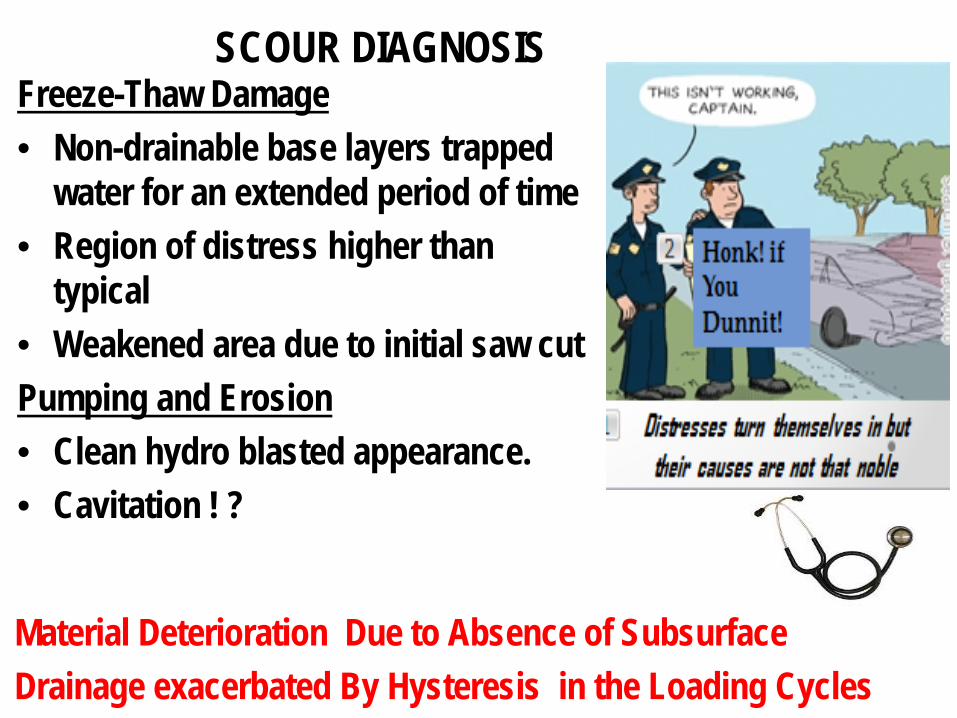
Freeze-Thaw Damage • Non-drainable base layers trapped
water for an extended period of time • Region of distress higher than
typical • Weakened area due to initial saw cut Pumping and Erosion • Clean hydro blasted appearance. • Cavitation ! ?
SCOURING DIAGNOSIS
Material Deterioration Due to Absence of Subsurface Drainage exacerbated By Hysteresis in the Loading Cycles

Trapezoidal Deterioration Sealant in Good Condition Sealant in Moderate
to Poor Condition
PROBLEM STATEMENT
Trapezoidal Deterioration at Bottom of Panel
A seal has to be a true seal

More Evidence of Scouring
Non Draining Base
Draining Base
PROBLEM STATEMENT CONTD.

Classic Case of Poor Drainage Vs Good Drainage MnROAD
Classic Case of Poor Drainage Vs Good Drainage TH 169, TH 210 Rohne et al 2010
Rohne et al 2010
RAISON D’ ETRE
Freeze-Thaw Damage • Non-drainable base layers trapped
water for an extended period of time • Region of distress higher than
typical • Weakened area due to initial saw cut Pumping and Erosion • Clean hydro blasted appearance. • Cavitation ! ?
SCOUR DIAGNOSIS
Material Deterioration Due to Absence of Subsurface Drainage exacerbated By Hysteresis in the Loading Cycles

When a fliud enters the cavity through the neck, the fluid in the neck has a total effective mass (m), it can be shown that
V
L
S is Surface area, L is length of joint (bottle neck) V is volume of bottle (Joint deterioration / erosion , bevelling volume)
RESONANCE PHENOM: HelmHoltz Resonance

HELMHOLTZ RESONANCE (Izevbekhai 2016)

The free body diagram shows the column of air in the orifice behaves as a spring in simple harmonic motion. To analyze a simple harmonic motion, a displacement
and an acceleration function particularly of the form 𝑑𝑑2𝑥𝑥𝑑𝑑𝑑𝑑2
= 𝐹𝐹𝑚𝑚
is important. *(Izevbekhai 2012 Dissertation)
F= ma or𝑑𝑑2𝑥𝑥𝑑𝑑𝑑𝑑2
= 𝐹𝐹𝑚𝑚
𝑃𝑃𝜌𝜌𝐴𝐴
= −𝛾𝛾 𝛻𝛻𝑉𝑉𝑉𝑉
= −𝛾𝛾 𝛻𝛻𝑆𝑆𝑥𝑥𝑉𝑉
.
𝑑𝑑2𝑥𝑥𝑑𝑑𝑑𝑑2
= 𝑝𝑝𝑆𝑆𝜌𝜌𝑆𝑆𝜌𝜌
= −𝛾𝛾𝑆𝑆𝑃𝑃𝐴𝐴𝜌𝜌𝑆𝑆𝜌𝜌
𝑥𝑥
This is a simple harmonic motion. Substituting for c= 𝛾𝛾𝑃𝑃𝜌𝜌
The resonant frequency is f = 𝑐𝑐2𝜋𝜋
𝑆𝑆𝑉𝑉𝜌𝜌
HELMHOLTZ RESONANCE
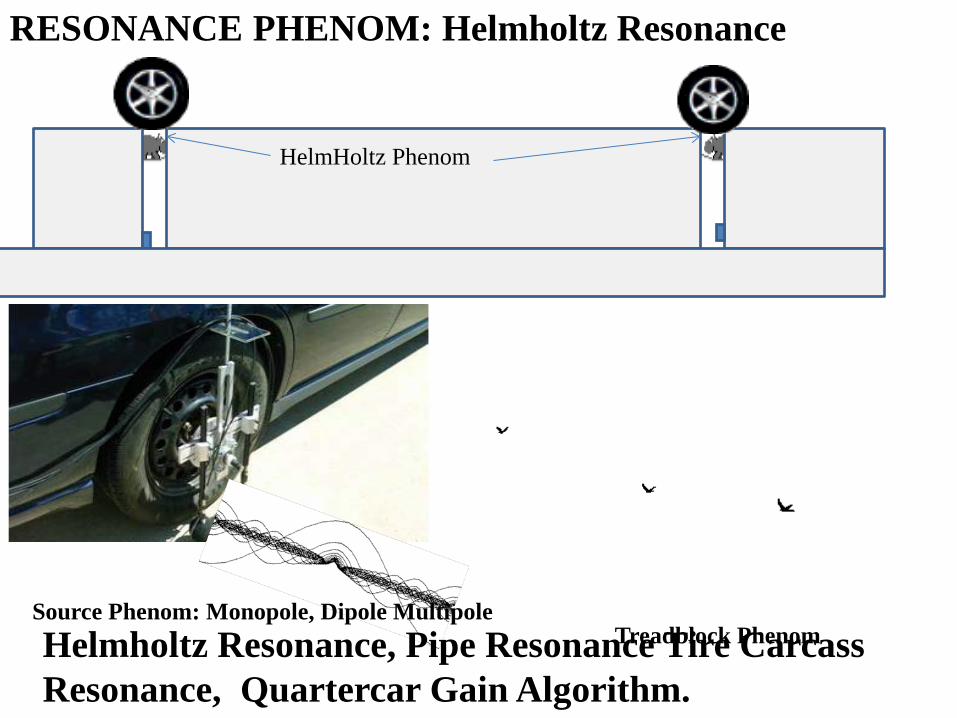
RESONANCE PHENOM: Helmholtz Resonance
HelmHoltz Phenom
Treadblock Phenom Source Phenom: Monopole, Dipole Multipole Helmholtz Resonance, Pipe Resonance Tire Carcass Resonance, Quartercar Gain Algorithm.

Progression of Joint Deterioration Showing Dimensions of Acoustic Relevance
Case 1 (Undeteriorated Joints)
Case2: Scoured Panels at Joints
Case 3: Scoured Panel and Relevant Acoustic Dimensions
Spall Wedge
Consider an orifice of area s with a neck length L, fluid density is ρ and displacement of fluid in cavity is ξ. It can be shown that with spalling of the neck, effective neck length of tube is altered. As the joint deteriorates (assume wedge to be isosceles triangle of normal sides “a”, and volume V of cavity increases, the acoustic energy generated by a tire riding over the joint will increase.
RESONANCE PHENOM: Helmholtz Resonance

The acoustic radiation resistance of an unspalled joint will reduce with subsequent spalling.
The higher the volume of cavity of deterioration of an unspalled joint, the lower the natural frequency.
The more the joint spalling (L’ increases) the lower the natural frequency.
RESONANCE PHENOM: Spalling
Cavity Volume

WorkPlan • Task 1: Concept: GPR , Impact Echo, MIRA, Rod Tamping, Chain Dragging:
Why do we need the impedance Tube. What are the Features we would exploit. What Joint Conditions are being evaluated.
• Task 2: Build Model Distressed Joints Deliverable) Model Distressed Joints
1. Pristine joint 2. Spalled Joint 3. Scoured Joint 4. Belled Bottom Joint 5. Combinations
• Task 2 Measurements of the various panel models • Task 3: Extract Data and plot all the 3rd Octaves OutPut Deliverable: Plotted data • Task 4 Data Analysis: Multiple regression, Stepwise regression • Task 5: Validation tests Cell 32: Validation Cores Deliverable : Validation (one Pager) • Task 6: Final Report: Identify Signatures of Various Distress Types and
propose calibration of impedance Tube


Minnesota Department of Transportation
• Glenn Engstrom • Bernard Igbafen Izevbekhai • Steve Olson • Eddie Johnson
Views of the Northstar Civilians and those discussed in this presentation do not
necessarily reflect those of the Minnesota Department of Transportation

• Background • Pavement
Structure • Concrete Joints • Testing
Equipment • Experimental
Design • Data Analysis • Conclusions


• Concrete joints facilitate
cracking
• Longitudinal joints containing
tie bars
• Transverse joints containing
dowel bars
Images via FHWA, Mn

14⁄ to 1 3⁄ sawcut in
concrete pavement joints Sawcut initiates cracking that propagates throughout the depth of the pavement

Image via FHWA, Izevbekhai
Spalling Scouring Belling

Images via Izevbek

Images via MnDOT

Image via MnD

Image & Info via Izevb
• White Noise Source • Microphones • Impedance Tube • Base Plate
ASTM E-1050 MnDOT in-situ test

Equations from Graff & Izevbekha
Acoustic Impedance • Impedance (Z) • Importance
• Produces two measurable variables
• Sound Absorption (RP) 𝑅𝑅𝑃𝑃 2 = 1 −
1𝐾𝐾𝑟𝑟2
𝑃𝑃𝑟𝑟𝑃𝑃𝑑𝑑
2

1. 1/3 Octave Frequencies • Calculated by raising
preceding frequency to the 1/3 power
2. Sound Absorption • Averaged to the 1/3 octave
frequency
3. Plots • Frequency vs. Sound
Absorption
𝐹𝐹𝑛𝑛 = 𝐹𝐹400 ∗ 2𝑛𝑛−13
Equation via Izevbekhai 2012 Izevbekhai 2016
0
0.05
0.1
0.15
0.2
0.25
0.3
0 500 1000 1500 2000So
und
Abso
rptio
n []
Frequency [Hz]
Sound Absorption

• Large range of values at each frequency • No conclusions could be made
0.00
0.05
0.10
0.15
0.20
0.25
0.00 500.00 1000.00 1500.00 2000.00
Soun
d Ab
sorp
tion
[]
Frequency [Hz]
Combined Distress in a Joint Qualitative Comparison
0.00
0.05
0.10
0.15
0.20
0.25
0.00 500.00 1000.00 1500.00 2000.00
Soun
d Ab
sorp
tion
[]
Frequency [Hz]
Pristine Joint Qualitative Comparison

Image via Pennsylvania State University
T-test information via Barnes, et. al.
Statistical Analysis: T-test • Compares sets of data • 𝐻𝐻0: Difference = 0
• α = 0.05 • p-value < α :
Question 𝐻𝐻0 0.002.004.006.008.00
10.00
0.00 0.01 0.02 0.03 0.04 0.06
Num
ber
Sound Absorption [ ]
Histogram of Sound Absorption Values for the 1000 Hz Pristine
Concrete Joint
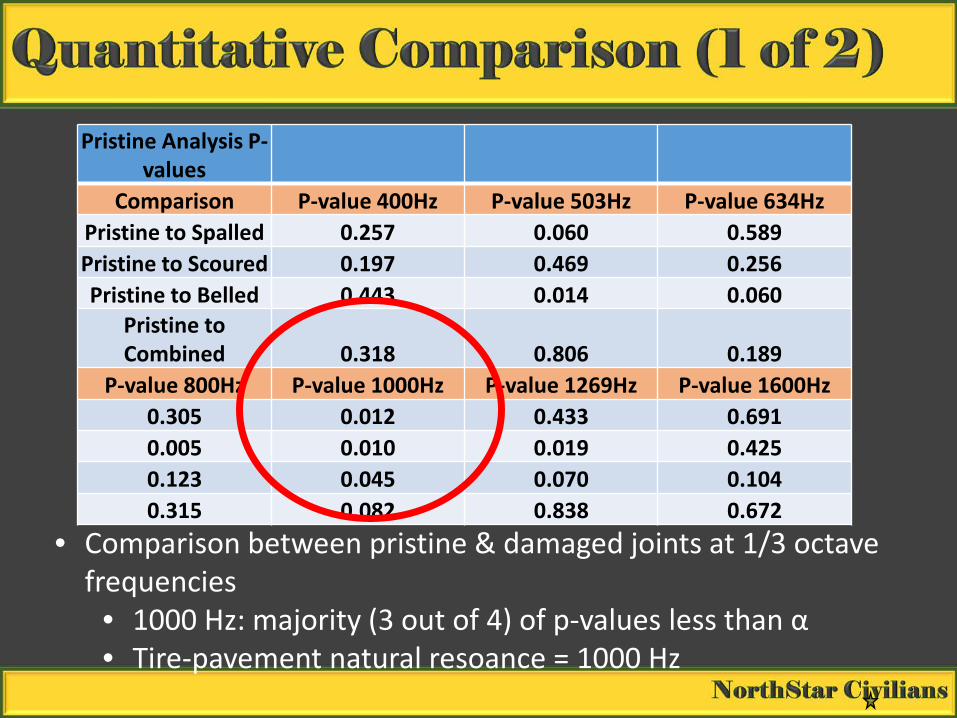
• Comparison between pristine & damaged joints at 1/3 octave frequencies
• 1000 Hz: majority (3 out of 4) of p-values less than α • Tire-pavement natural resoance = 1000 Hz
Pristine Analysis P-values
Comparison P-value 400Hz P-value 503Hz P-value 634Hz Pristine to Spalled 0.257 0.060 0.589 Pristine to Scoured 0.197 0.469 0.256 Pristine to Belled 0.443 0.014 0.060
Pristine to Combined 0.318 0.806 0.189
P-value 800Hz P-value 1000Hz P-value 1269Hz P-value 1600Hz 0.305 0.012 0.433 0.691 0.005 0.010 0.019 0.425 0.123 0.045 0.070 0.104 0.315 0.082 0.838 0.672

Sealed vs. Unsealed at 1000 Hz Analysis
Degradation Condition P-value
Pristine 0.020
Spalled 0.026
Scoured 0.010
Belled 0.489 Combined 0.008
Frequency Independent
Comparison P-value Pristine vs. Combined 0.885
Pristine vs. Spalled 0.002
Pristine vs. Scoured 3.049E-05
Pristine vs. Belled 1.127E-06
• Comparison of Sealed vs. Unsealed Concrete Joints • 4 out of 5 concrete joints had a p-value < α
• Comparison of sound absorption values for pristine vs. damaged • 3 out of 4 concrete joints had a p-value < α

Environmental
Economic
Performance
Image via UDO

• Testing device is feasible option to identify damage in concrete joints • The t-test & Data analysis: frequencies of
1,000 Hz may be sufficient for preliminary determination of whether the concrete joint is damaged or undamaged
• The t-test & data analysis: potential to determine if the concrete joint is damaged or undamaged by comparing all sound absorption values independent of frequency

• Collect more data • Create empirical model to determine
model constants associated with various distress types using multiple non-linear regression
• Test concrete joints in the field • Attempt using an impedance tube with
different dimension and settings during data collection

1. Chadbourn, B. (2007). Mn/DOT Flexible Pavement Design-Mechanistic Empirical
Method. MnDOT. 2. Izevbekhai, B. I. (2010). Sound Absorption Coefficient of Pavements - Impedance Tube
(ASTM E-1050 Modified for In-Situ Testing). MnRoad, 1. 3. Barnes, R. et. al. (2008). Effects of Seasonal Changes on Ride Quality at MnROAD.
Minnesota Local Road Research Board, 2008,23. 4. Pennsylvania State University. (2016). Hypothesis Testing: Examples. Retrieved from
https://onlinecourses.science.psu.edu/statprogram/node/139 5. Izevbekhai, B. I. (2016). Pavement Surface Characteristics Concrete New Construction
(MnROAD Study). Minnesota Local Road Research Board, 2015-48. 6. Graff, K. (1975). Wave Motion in Elastic Solids. Dover Publications Inc., New York.