concordia bus annual report 2007/2008 -...
TRANSCRIPT
CONCORDIA BUS ANNUAL REPORT 2007/2008^

KAPITEL02 Presenting Concordia Bus 04 Statement from the CEO 06 Vision, mission, goals and strategies 08 Market 12 Swebus 14 Concordia
Bus Finland 15 Concordia Bus Norway 16 Swebus Express 17 Concordia Bus Fleet 18 Sustainability 20 Management systems and share
data 21 Corporate governance 24 Board of Directors 25 Executive Management 26 Administration report 29 Consolidated income state-
ment 30 Consolidated balance sheet 31 Consolidated statement of changes in equity 32 Consolidated cash flow statement 33 Parent
Company income statement 34 Parent Company balance sheet 35 Parent Company statement of changes in equity 36 Parent Company
cash flow statement 37 Notes 58 Audit report 59 Addresses, Glossary and Definitions 60 Historical overview
KEY FINANCIAL RATIOS SEK M, unless otherwise stated 03/04* 04/05* 05/06** 06/07** 07/08**
Revenue 4,761 4,812 4,683 5,075 5,406Operating profit –155 –312 –344 –24 161
Profit after net financial items –463 –562 –794 –246 –16Profit after tax –409 –560 –795 –245 –15
Cash flow for the year 149 –169 2 117 211Cash and cash equivalents*** 346 175 231 351 529
Equity/assets ratio, % –9.7 –31.1 –0.6 6.7 5.7Equity –330 –873 –17 227 210
Equity per ordinary share –66 –174.6 –0.85 11.35 10.50* According to Annual Accounting Act
** According to IFRS*** Cash and cash equivalents include
blocked bank accounts.

KAPITEL
CONCORDIA BUS’S VALUES We keep our promises to customers We respect our employees – and earn their respect in return
We value good leadership We have integrity We are committed to quality
^^ ^^
CONCORDIA BUS WON ITS FIRST TRANSPORT CONTRACT
IN DENMARK, EFFECTIVE FROM AUTUMN 2008.
REVENUE FROM LONG-DISTANCE BUS TRANSPORT SERVICES AMOUNTED TO SEK 351 MILLION (365).
OPERATING PROFIT WAS SEK 19 MILLION (10).
REVENUE FROM CONTRACTUAL BUS TRANSPORT SERVICES IN NORWAY TOTALLED SEK 463
MILLION (443). OPERATING PROFITWAS SEK 23 MILLION (19).
REVENUE FROM CONTRACTUALBUS TRANSPORT SERVICES IN
FINLAND REACHED SEK 517 MILLION (409). OPERATING PROFIT
WAS SEK 9 MILLION (–9).
REVENUE FROM CONTRACTUAL BUS
TRANSPORT SERVICES INSWEDEN AMOUNTED TO
SEK 3,990 MILLION (3,668).OPERATING PROFIT WAS
SEK 153 MILLION (7).
REVENUE IN THE CONCORDIA BUS GROUP ROSE TO
SEK 5,406 MILLION (5,075).
FOR 2007 THE CONCORDIA BUSGROUP REPORTED AN
OPERATING PROFIT OF SEK 161 MILLION (–24).
THE CONCORDIA BUS GROUP WON CONTRACTS FOR 370 BUSES (194)
IN THE YEAR’S TENDERS
^
IN 2007 THE GROUP PURCHASED 133 BUSES (377)FOR A TOTAL OF SEK 306 MILLION (931)
UNDER FINANCE LEASES.

2 C O N C O R D I A B U S A N N U A L R E P O R T 2 0 0 7 / 2 0 0 8
Presenting Concordia Bus
. ..
.Sweden
Market leader. Swebus has 103 bus
transport contracts and 200 million
passengers in a market worth SEK 12
billion, of which 90% is deregulated.
Challenging car transports.
Norway
Top three. Concordia Bus Norway
has 8 bus transport contracts and 11
million passengers in a rapidly dereg-
ulating market worth SEK 11 bil-
lion. Around 30% of bus services are
competitively tendered. Challenging
car transports.
Finland
Top three. Concordia Bus Finland
has 45 bus transport contracts and
31 million passengers in a market
worth SEK 5 billion that is under-
going gradual deregulation. Approx-
imately 47% of bus services are com-
petitively tendered. Challenging car
transports.
Denmark
New operator. As of 2008, start of
the fi rst bus transport contract in a
fully competitive market worth SEK
6 billion. Challenging car transports.
LONG-DISTANCE TRAFFIC
Market leader. Swebus Express has
2.2 million passengers on 30 long-
distance bus lines. Challenging car,
air and rail transports.
BUS FLEET MANAGEMENT
Th e only Nordic specialist company.
Concordia Bus Fleet Group optim-
izes purchasing, management and
sales of the approximately 3,400
buses in the Group’s fl eet.
CONTRACTUAL BUS TRANSPORT SERVICES
C O N C O R D I A B U S 3
CONCORDIA BUS
CONCORDIA BUS FLEET
SWEBUS EXPRESSSWEDEN
SWEBUSSWEDEN
CONCORDIA BUS FINLAND
FINLAND
CONCORDIA BUS NORGE
NORWAY
CONCORDIA BUS DANMARK
DENMARK
ORGANIZATIONAL CHART
0
1,000
2,000
3,000
4,000
5,000
6,000
07/0806/0705/0604/0503/04
4,761
SEK M
4,812 4,6835,075
5,406
REVENUE OPERATING PROFIT TENDER HISTORY
PRESENTING CONCORDIA BUS
03/04 04/05 05/06 06/07 07/08
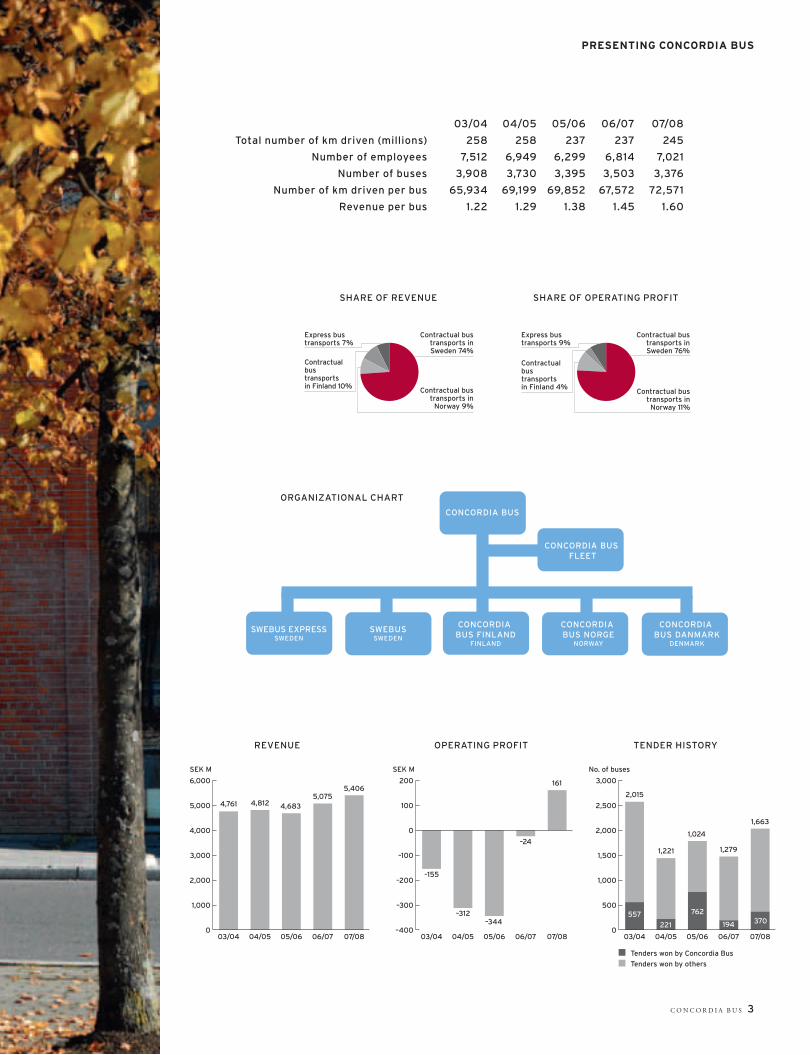
Total number of km driven (millions) 258 258 237 237 245
Number of employees 7,512 6,949 6,299 6,814 7,021
Number of buses 3,908 3,730 3,395 3,503 3,376
Number of km driven per bus 65,934 69,199 69,852 67,572 72,571
Revenue per bus 1.22 1.29 1.38 1.45 1.60
SHARE OF REVENUE SHARE OF OPERATING PROFIT
Contractual bustransports inSweden 74%
Contractual bustransports in
Norway 9%
Express bus transports 7%
Contractual bus transports in Finland 10%
Contractual bustransports inSweden 76%
Contractual bustransports in
Norway 11%
Express bus transports 9%
Contractual bus transports in Finland 4%
–400
–300
–200
–100
0
100
200
07/0806/0705/0604/0503/04
–155
SEK M
–312–344
–24
161
0
500
1,000
1,500
2,000
2,500
3,000
07/0806/0705/0604/0503/04
557
2,015
No. of buses
1,221
221
1,024
762
1,279
194
1,663
370
Tenders won by Concordia BusTenders won by others
4 C O N C O R D I A B U S A N N U A L R E P O R T 2 0 0 7 / 2 0 0 8
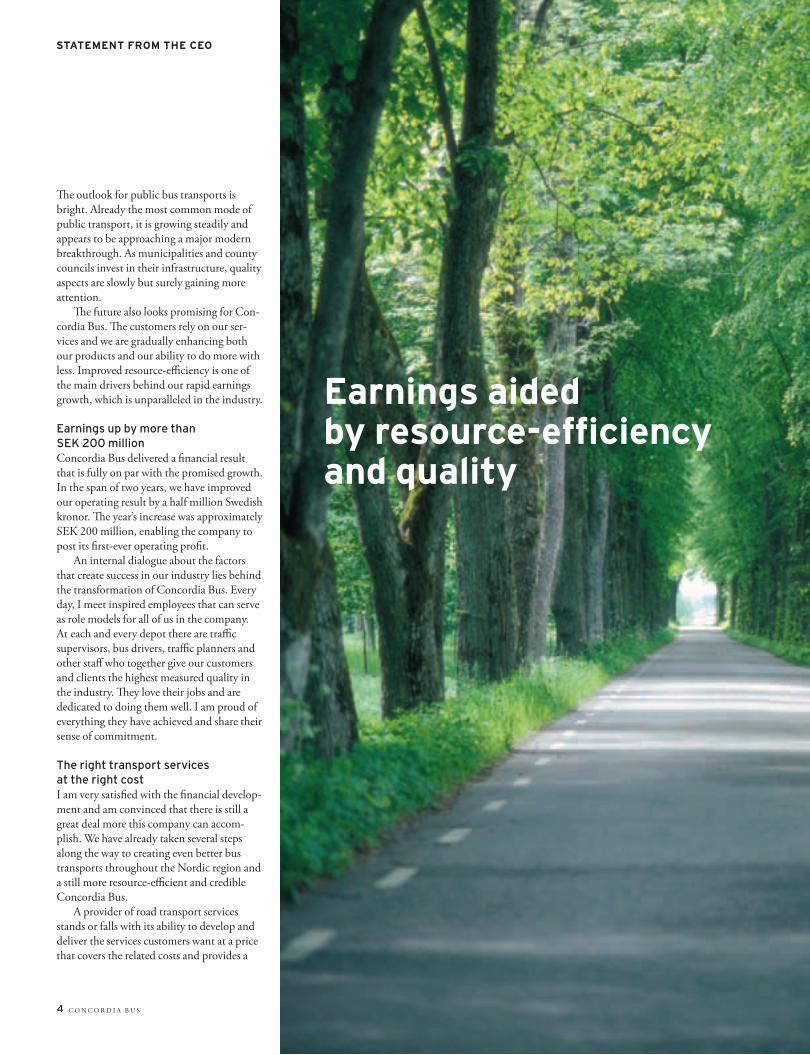
Earnings aided by resource-effi ciency and quality
Th e outlook for public bus transports is
bright. Already the most common mode of
public transport, it is growing steadily and
appears to be approaching a major modern
breakthrough. As municipalities and county
councils invest in their infrastructure, quality
aspects are slowly but surely gaining more
attention.
Th e future also looks promising for Con-
cordia Bus. Th e customers rely on our ser-
vices and we are gradually enhancing both
our products and our ability to do more with
less. Improved resource-effi ciency is one of
the main drivers behind our rapid earnings
growth, which is unparalleled in the industry.
Earnings up by more than SEK 200 million Concordia Bus delivered a fi nancial result
that is fully on par with the promised growth.
In the span of two years, we have improved
our operating result by a half million Swedish
kronor. Th e year’s increase was approximately
SEK 200 million, enabling the company to
post its fi rst-ever operating profi t.
An internal dialogue about the factors
that create success in our industry lies behind
the transformation of Concordia Bus. Every
day, I meet inspired employees that can serve
as role models for all of us in the company.
At each and every depot there are traffi c
supervisors, bus drivers, traffi c planners and
other staff who together give our customers
and clients the highest measured quality in
the industry. Th ey love their jobs and are
dedicated to doing them well. I am proud of
everything they have achieved and share their
sense of commitment.
The right transport services at the right cost I am very satisfi ed with the fi nancial develop-
ment and am convinced that there is still a
great deal more this company can accom-
plish. We have already taken several steps
along the way to creating even better bus
transports throughout the Nordic region and
a still more resource-effi cient and credible
Concordia Bus.
A provider of road transport services
stands or falls with its ability to develop and
deliver the services customers want at a price
that covers the related costs and provides a
STATEMENT FROM THE CEO
A N N U A L R E P O R T 2 0 0 7 / 2 0 0 8 C O N C O R D I A B U S 5
reasonable surplus. However, the existence of
a predefi ned transport network limits our
freedom to defi ne the product we deliver,
and means that good planning and resource-
effi ciency are decisive in meeting the set targets.
Th e perspective is almost ecological – we
should never use more resources than we
need. Th e point is not to expend more eff ort,
but to do everything more effi ciently than we
did yesterday and more effi ciently than our
competitors today.
I believe that the realignment of Concordia
Bus into a process-driven company was a
turning point. By measuring ourselves against
a set of carefully defi ned performance indic-
ators and making use of benchmarking, we
have been able to enhance our quality while
at the same time signifi cantly strengthening
our earnings.
Stealing market share from carsWe are not challenging the railways and have
no dispute with other providers of road trans-
port services, whether they operate in the
open market or enjoy the protection of a
granted concession. It is cars we all want to
steal market shares from, the thoughtless rec-
reational motorists and private automobiles
that day after day drive to and from work car-
rying only a driver. We are committed to
increasing the use of public transport for the
benefi t of the taxpayers and the environment,
as much as for our own sake.
A modern bus requires fewer than four
passengers to be an environmentally superior
alterative to the automobile. And even greater
environmental gains are possible by increas-
ing the number of passengers on the buses.
We and other major transport providers
are working strenuously to minimize environ-
mentally hazardous emissions and reduce
the use of fossil fuels. Th ese eff orts have been
successful and our long-term ambition at
Concordia Bus is to reach a point where our
operations are climate- and eco-neutral. In
the meantime, increased ridership on our
buses nonetheless has a faster and greater
eff ect without any cost to the county trans-
port authorities or the taxpayers.
Here, there is a natural affi nity of interests
between all players in the public transport
sector, whether clients or contractors. If we
and other operators are given better scope to
off er transport services that are truly customer-
driven, we can fi nally create the product
needed by society today and in the future.
Incentive agreements are the key Overly detailed tender documents that specify
not only the needs to be satisfi ed but also how
this is to take place are an everyday burden
for public transport operators. And when the
amount of compensation is also fi xed and
regulated on the basis of production, the
situation is further aggravated. Despite this,
so-called gross cost contracts have become
even more common than before. An already
shackled transport operator is left without
any incentive whatsoever to increase the
number of passengers or improve their satis-
faction.
Concordia Bus advocates wider use of
incentive agreements in the public transport
sector. It must be profi table for all parties
when the operator does everything right.
Higher quality transports that lead to more
passengers on the buses and lower environ-
mental impact should provide scope to sup-
plement the operator’s fi xed compensation
with a variable component based on ticket
revenues.
Our own profi tability is now stable and
expected to strengthen further. We have
proven our ability to calculate, win and
deliver on contracts better than most. Th e
internal risks are low, but there are external
risks that are beyond Concordia Bus’s con-
trol, particularly the price of fuel, environ-
mental requirements and access to qualifi ed
manpower.
I have already spoken of the company’s
many dedicated managers and employees,
but I am well aware that our employee pro-
grams have not yet reached all the way out to
the front lines where supervisor meets driver
and driver meets customer. Th e transport
contracts of the future require employees who
know what is expected of us all and can easily
follow up their performance. Th is is where we
are headed.
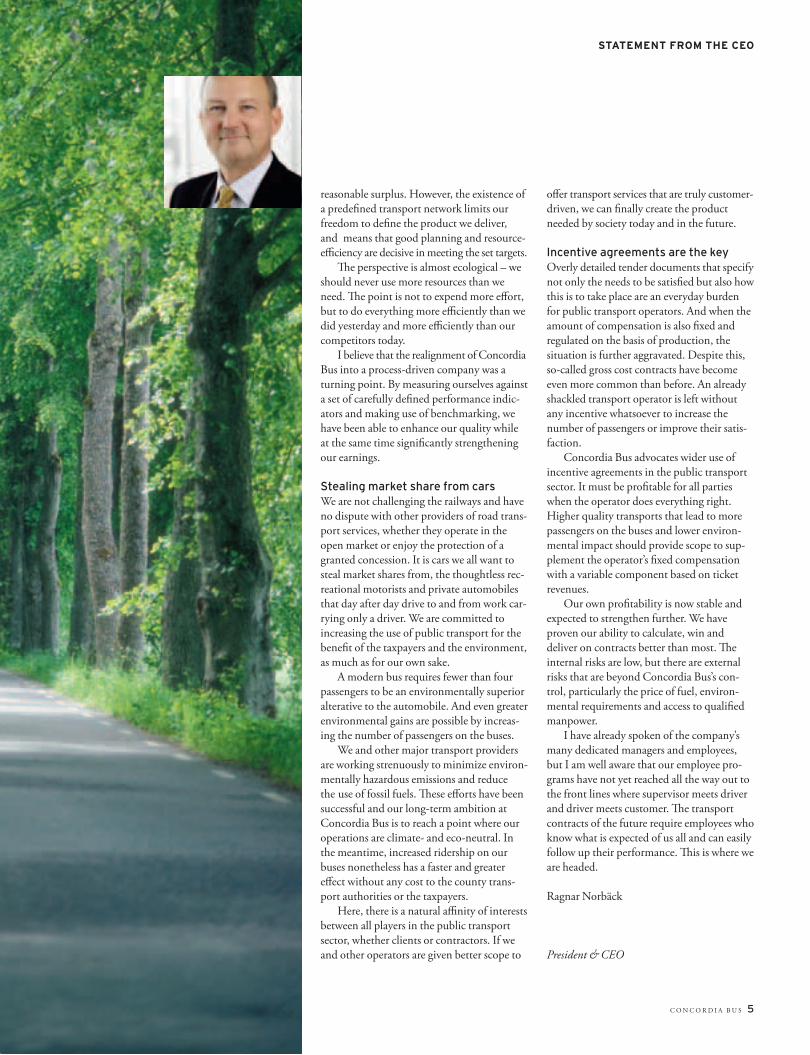
Ragnar Norbäck
President & CEO
STATEMENT FROM THE CEO
6 C O N C O R D I A B U S A N N U A L R E P O R T 2 0 0 7 / 2 0 0 8
Customer experience in focus
VISION, MISSION, GOALS AND STRATEGIES
The customer experience is at the core of Concordia Bus’s business. By realizing its objectives for perceived quality, the company can also meet its operating and fi nancial goals.
In the Nordic region there is a rising need,
and demand, for public transport. Competi-
tion for previously protected transport ser-
vices is contributing to growth in the dereg-
ulated segment of the market.
Concordia Bus is active exclusively in
road transport services, above all through
transport contracts awarded by public sector
agencies. Since the compensation payable
under these transport contracts is largely
fi xed, Concordia Bus is working to boost the
share of controllable revenue. A change of
this type raises the operator’s risk and respons-
ibility for encouraging customers to increase
their use of transport services.
Long-term goalsConcordia Bus sets goals in three diff erent
categories: Market goals, operating goals and
fi nancial goals. To reach each and every one
of these goals, the company has formulated a
number of diff erent strategies.
Market goals
• More than 80% satisfi ed customers.
• Market leader in selected segments of the
Nordic region and among the top three in
all four countries.
• More than one third of all scheduled road
transport services in the Nordic region.
• Highest quality rating among leading
public transport operators from the Insti-
tute for Quality Development, SIQ.
• Highest credibility among the clients.
Operating goals
• Motivated Employee Index of more than
80.
• Climate-neutral.
• Fewer than 1 personal injury per a
distance equal to 100 times the earth’s
circumference.
Financial goals
• Profi t margin of 3–5%.
• Return on capital employed of at least 10%.
• Return on equity of at least 15%.
• Equity/assets ratio of 25%.
• Cash fl ow that covers investment needs
and shareholder dividends.
StrategiesTh e strategies are divided into fi ve diff erent
areas: growth, market effi ciency, structure,
resource management and employee develop-
ment.
An increased undertaking in the local
transport service contracts is a key compon-
ent not only of Concordia Bus’s growth
ambitions but also for development in other
prioritized strategic areas. Th e company seeks
greater responsibility for the service off ering,
timetable and sales, as well as compensation
for both the provision of transport services
and the number of passengers. Concordia
Bus aims to grow both organically and
through increased penetration of existing
markets, but also via product diversifi cation
and by playing an active role in the anticip-
ated consolidation of the market.
Market effi ciency will be improved
through new transport solutions, ongoing
productifi cation, improved tender prepara-
tion, careful contract management and active
communication. A new communication plat-
form was launched in the past year and a new
graphic identity will be introduced in the
year ahead.
In every geographical market, Concordia
Bus strives to promote the existence of strong
industry organizations. Strategic partnerships
accelerate the company’s own pace of develop-
ment and assessment of the company’s fi nan-
cial and corporate structure satisfi es other
primarily fi nancial goals.
Because resource management is of cen-
tral importance to Concordia Bus and is a
critical competitive strength, the related strat-
egies cover a number of diff erent initiatives.
Resource optimization through fl eet manage-
ment, continuous development of the com-
pany’s already market-leading expertise in
traffi c planning and evaluation of the group-
wide services are a few strategic priorities in
the resource management area. Safety issues
also belong to this category, as do the increas-
ingly urgent and prioritized environmental
activities. However, process control and
benchmarking of effi ciency and performance
have the greatest impact of all.
Motivated employees are needed in every
part of the company’s operations, where the
shared values serve as a foundation for the
creation of a professional culture. Th e com-
pany encourages employee commitment and
strives to systematically utilize this commit-
ment and provide individual feedback on
work performance. Powers and responsibili-
ties must be absolutely clear and the decision-
making processes eff ective. Managers are
developed in accordance with established
leadership criteria and each employee is given
opportunities for personal development
through at least one yearly evaluation to-
gether with his or her manager and matching
of skills to work duties. Th e bus drivers are
trained in a way that refl ects the company’s
obligations to its customers and Concordia
Bus strives to be perceived as the industry’s
most attractive employer.
Increase in uniform working methodsTo realize the vision “Everyone wants to
travel with us” and achieve its goals, the com-
pany focuses on continuous improvement of
its working methods through benchmarking.

A N N U A L R E P O R T 2 0 0 7 / 2 0 0 8 C O N C O R D I A B U S 7
VISION, MISSION, GOALS AND STRATEGIES
In this context, customer-perceived quality is
the single most important factor and motivated
employees are vital for long-term success.
Concordia Bus has fi ve basic shared val-
ues that steer development of the company’s
working methods: Credibility, mutual
respect, good leadership, integrity and qual-
ity. Th ese values provide a platform not only
for the company’s day-to-day operations, but
also its strategies, goals and even its vision.
Better solutions through process controlTh e shared values also create a framework for
process control and a growing number of
group-wide working methods in production,
accounting, fi nance and administration.
Group-wide working methods are of major
importance, above all for quality manage-
ment and resource-effi ciency.
25 carefully selected performance indic-
ators make it possible to identify the areas
where the company is performing most suc-
cessfully. 17 interdisciplinary process teams
that involve 120 employees in nine main pro-
cesses evaluate alternative methods for
enhancing quality in everything the company
does. Each team is headed by a president or
member of the Executive Management.
When a routine is created or changed, the
results are documented and added to the
continuously revised and updated collection
of group-wide rules and routines known as
Policies & Instructions.
Successful benchmarking has enabled
recent years’ improvements in contract starts
and wind-ups, implementation of in-house
customer surveys and development of the
Green Journey pilot project.
In the past two years the share of group-
wide working methods has grown dramatic-
ally and now makes up around 25% of all
identifi ed processes, a share that is expected
to grow further.
VALUESFive shared values define the ethics applied in all parts of the Group’s operations, from internal activities to relations with external parties. They also describe how the company strives to conduct its activities in an efficient manner. Through sys-tematic monitoring, the management can deter-mine how firmly established the values are throughout the company.
WE KEEP OUR PROMISES TO THE CUSTOMERSOur customers see us as credible. The informa-tion we provide is perceived as timely and suffi-cient in scope. Our commitments are long term.
WE RESPECT OUR EMPLOYEES – AND EARN THEIR RESPECT IN RETURNOur company stands for equal treatment of all employees. Together we create a secure and con-genial working environment that stimulates initia-tive and ideas for improvement. We encourage health and development, and recognize achieve-ment. We react to a lack of respect towards to company and its employees.
WE VALUE GOOD LEADERSHIPWe have well defined leadership criteria. Our managers place the interests of our customers and the company first. We promote cooperation across borders and provide feedback on work performance. We can be trusted with confidences.
WE HAVE INTEGRITYAt Concordia Bus we comply with the applicable laws, rules and industry standards. We take our responsibility for the environment and society. Our relationships with business partners are characterized by mutual respect.
WE ARE COMMITTED TO QUALITYWe deliver results. Our services maintain the promised level of quality as a minimum require-ment. We use systematic follow-up and develop-ment of operations to ensure lasting correction of errors and deviations.
APPRECIATED The customers enjoy accessibi-lity, reliability and courteous service. The public transport authorities recognize the value of Concordia Bus’s advice. The drivers represent Concordia Bus’s approach to good custo-mer relations.
CREDIBLE Concordia Bus keeps its promi-ses, maintains a high level of safety and provides transport solutions that support society’s objectives for development of road transports.
RESOURCE-EFFICIENCY
Concordia Bus has a low pro-duction cost in relation to its delivered quality and offers effective solutions that also contribute to sustainable long-term development.
ROAD TRANSPORT
Concordia Bus provides scheduled transport services under contracts, in partnership or independently.
MISSION:AN APPRECIATED, CREDIBLE AND
RESOURCE-EFFICIENT PROVIDER OF ROAD TRANSPORT SERVICES
VISION: EVERYONE WANTS TO TRAVEL WITH US
^

8 C O N C O R D I A B U S A N N U A L R E P O R T 2 0 0 7 / 2 0 0 8
By winning the Danish contract in 2008, Concordia Bus has made a breakthrough into a market worth approximately SEK 6 billion. This is equal to more than 20% of the entire deregulated market in the Nordic region, which is the company’s home market.
Th e public transport market in Sweden, Nor-
way, Denmark and Finland generates annual
revenue in the range of SEK 70 billion.
Scheduled bus transports account for more
than half of this total, or around SEK 40 bil-
lion, of which approximately SEK 28 billion
is tendered in open competition. Th is is Con-
cordia Bus’ market – scheduled competitively
tendered bus transport services for passengers
in the Nordic region.
With annual revenue of SEK 5.4 billion,
Concordia Bus is the largest bus transport
operator in the Nordic region and one of the
ten largest public transport companies in
Europe.
Young people the most frequent usersTh e majority of Concordia Bus’s customers
are passengers in urban traffi c. Surveys in
Sweden show that 70% of the population
uses public transport occasionally, with
women outnumbering men and young
people the most frequent users of all. Around
15% use public transport daily and an equal
share never use it. Industry surveys on cus-
tomer satisfaction among users of public bus
transports show that two of three are satisfi ed
or highly satisfi ed.
Convenience of cars still attractive 50 years have passed since the automobile
MARKET
A complex and evolving market

A N N U A L R E P O R T 2 0 0 7 / 2 0 0 8 C O N C O R D I A B U S 9
MARKET
POLITICIANS CUSTOMERIMAGE›
CLIENT OPERATORCONTRACT: 5–10 YEARS›
CO
ND
ITIO
NS
›
DE
LIV
ER
Y
››
IMAGE
Fee per km, hour and bus
Model for public procurement of
public transport services.
Th e rules for procurement of public bus transport services are
relatively similar in all four Nordic countries and are based on the
guidelines in the EU’s public procurements directive.
took over as favoured mode of transport in
the Nordic region. Despite eff orts by politi-
cians and transport companies, the public
transport sector’s market share has been stag-
nant at around 20% for decades. With few
exceptions, the situation is similar through-
out the EU. In other words, the foremost
competitor to bus transports by far is the car,
a costly alternative that leads to congestion
and increased environmental impact but
off ers a high level of convenience. Rail trans-
ports, with annual revenue of around SEK 7
billion in Sweden during 2006, are the domi-
nant competitor for long-distance travel.
Th e automobile is retaining or even
strengthening its grip on travellers every-
where, except for in the metropolitan areas.
For longer distances, signifi cantly more trav-
ellers choose the train than bus. Concordia
Bus’s long-distance bus transports have
focused on transports within or to and from
Sweden, and currently account for around
7% of the company’s total revenue. Revenue
in this category comes exclusively from the
individual customers, i.e. the passengers.
School bus transports are sometimes ten-
dered in connection with urban transports
and currently make up around 1.0% of oper-
ations in Concordia Bus, while transports to
and from airports account for 0.3%.
Th e Nordic public transport market gen-
erates annual revenue of around SEK 70 bil-
lion. A total of around 14,000 buses operate
in scheduled traffi c in the region. Concordia
Bus has a fl eet of 3,376 buses, down by 3.6%
compared to the end of fi scal 2006-2007.
Competition increasingPrior to 1989, public bus transport services in
the individual markets were not exposed to
competition and services were provided
under concessions that gave the operators
exclusive rights to all traffi c in a specifi c area
and to the revenue from this traffi c.
Although EU public procurement regula-
tions permit the award of concessions for an
unlimited period, today the transport author-
ities are putting nearly all contracts in both
Sweden and Denmark up for tender, while
the share is 47% in Finland and 31% in
Norway. Between 2008 and 2010 the open
market will grow substantially in Norway,
whereas development in Finland is progress-
ing more slowly.
Th e rising number of passengers is also
contributing to growth in the market. Th e
growth rate is currently highest in Sweden,
where it exceeds 5% annually. Without
exception, bus transport services in the capi-
tal city regions make up the largest single
market in each country and employ around
half of the total number of buses. In many
more sparsely populated regions, the use of
public transport is declining.
The Nordic modelTh e system for procurement and production
of public transport services is essentially the
same in the four Nordic countries.
Th e client, which is a politically
appointed public transport authority, has
overall responsibility for the provision of
public transport services in a particular
region. Today there are some 60 such author-
ities in the Nordic countries. Th e client also
decides whether to provide public transport
services under an existing concession or to
invite tenders through a public procurement.
Th is responsibility includes decision on time-
tables, ticket pricing and contract periods.
Th e diff erence between production costs and
operating revenue is covered by taxes.
Th e operator is the bus company that
provides transport services according to the
terms of the contract. Th is company can be
an international group, a small or mid-sized
privately owned company or an enterprise
owned by a municipality or county council.
Th e contract between the client and oper-
ator regulates the way in which transport ser-
vices are provided based on the terms and
conditions in the tender documents. It gener-
ally runs for a period of 5-8 years and the
operator typically receives payment on a gross
cost basis. Th e amount paid to the operator
under a gross cost contract is based solely on
the number of kilometers or hours driven,
while all ticket revenues go to the public
transport authority. A net cost contract
instead assigns the bulk of ticket revenues to
the operator. An incentive contract is a cross
between a gross cost and net cost contract,
and is based on the gross cost model but
allows the operator to increase its revenue if
the number of passengers rises. One thing all
three contract types have in common is that
the compensation is indexed over time to
refl ect changes such as rising fuel or payroll
costs.
London’s public transport system is organ-
ized according to principles similar to those
found in the Nordic countries. Areas of Eng-
land outside London are exposed to unlim-
ited competition, along the same lines as bus
freight transports in the Nordic countries.
Th e continental model for public bus trans-
port services is based on close cooperation
between the public and private sectors, which
is expressed through the guidelines for public
procurements described in EU legislation.

1 0 C O N C O R D I A B U S A N N U A L R E P O R T 2 0 0 7 / 2 0 0 8
MARKET
›
Germany
CO
NT
RA
CT
PR
ICIN
G
TIME FROM START OF DEREGULATION
›
Norway
Finland
Sweden
Denmark
England
Level of compensation changes over timeContract pricing typically follows the curve
shown in the “Deregulation and pricing
cycle” diagram. Before deregulation begins in
a certain area, the level of compensation is
high. Because there is only one public trans-
port authority in each area, but often a large
number of bidders, an imbalance arises when
traffi c is tendered. In many cases, the span
between the highest and lowest bids is con-
siderable, sometimes so large that the lowest
is not even suffi cient to cover the bidder’s
costs. Regardless of the motives behind such
tactics, a gradual market correction takes
place so that the price increases over time. As
a result, the prices will fall relatively slowly
after the fi rst tender, and will then rise some-
what faster after bottoming out.
Concordia Bus believes that the market
will eventually consolidate into a small num-
ber of effi cient and quality-driven players. In
Denmark this has already taken place.
At the current price levels, ticket revenues
are not adequate to cover traffi c costs. Th e so-
called self-fi nancing ratio varies both between
countries and over time, but currently averages
at around 50–60% throughout the Nordic
region. Th e remainder is covered by tax rev-
enues. Th e degree of consolidation among
transport authorities is increasing, mainly as a
means for achieving scale economies.
Costs are rising faster than revenue, partly
as a result of surging fuel prices and a ten-
dency for transport solutions to become more
resource-intensive in the form of increased
driver time and empty transports. Due to
insuffi cient indexation in many contracts,
this cost growth is a problem for operators as
well.
SwedenNearly all scheduled public bus transports are
competitively tendered. Th e market is worth
approximately SEK 12 billion, which is
around 40% more than the second largest
Nordic market. Gothenburg, Luleå and
Västerås are the largest cities that do not con-
tract out all bus transports.
With a market share of 20% and 2,551
buses, Concordia Bus and Swebus are the
leading providers of public bus transports
tendered by county transport authorities. A
market share of over 50% makes Concordia
Bus and Swebus’s sister company Swebus
Express the leader in that small portion of
long-distance transports carried out by
express bus rather than rail. Th ese transports
and conducted on behalf of, and fully
fi nanced by, the individual customers.
Swedes are travelling more by car and by
public transport, both within and outside
Stockholm, which accounts for close to 45%
of all public transport in the country. Over
the past fi ve years, the number of trips by
public bus transport increased by around 5%.
Volumes in the underground system were
largely unchanged, while other rail-bound
traffi c rose by between 13% and 18%. Th e
underground, light rail and local trains all
had around 15% fewer passengers than the
buses.
Contracts for some 2,300 buses will be
opened for new tenders over the next three
years.
NorwayNorwegian public bus transports employ
some 7,000 buses and generate annual reve-
nue in the range of SEK 11.5 billion. Th e
share of competitively tendered transports is
growing and currently amounts to 31%,
equal to around 2,200 buses.
Concordia Bus Norway has a market
share of 17% of competitive public bus trans-
ports.
Th e market is relatively fragmented and
immature, with a large number of local oper-
ators. All international operators in the Nor-
dic region are also active in Norway. In the
coming three years, contracts for 1,835 buses
will be put to tender for the fi rst time. Th e
remaining non-competitive transports are
based on concession agreements.
FinlandTh e Finnish market for public bus transports
is worth the equivalent of SEK 5 billion. 47%
of this total, equal to approximately SEK 2.3
billion, is procured, above all through com-
petitive tendering of transports in the largest
cities of Helsinki and Turku. Th e country’s
third largest city, Tampere, has also started to
procure bus transports in open competition.
Concordia Bus Finland operates only in
the Helsinki region, where all transports are
procured in open competition. Helsinki mar-
ket is worth the equivalent of SEK 1.7 billion
and employs 1,205 buses.
Concordia Bus Finland is the market-
leader alongside the municipally-owned
Helb, while Veolia is number three. Th e com-
pany has enlarged its market share for the
third consecutive year and currently com-
mands 30% of the market, with 380 buses.
Without access to a well situated depot, the
company lacks opportunity to compete for
contracts in the Turku area where 80% of bus
transports are tendered competitively. Th e
situation is the same in the Tampere region.
Th ere are 964 buses in service outside the
three major cities, but none of these trans-
ports are tendered and no change is antici-
pated in the near future. A large share of this
traffi c consists of express buses operating
under exclusive concessions.
DenmarkIn the spring of 2008 Concordia Bus won its
fi rst tender in Denmark, a contract for 54
buses in the Copenhagen area eff ective from
the autumn of 2008.
Public bus transports in Denmark were
deregulated in the early 1990s and generate
an estimated SEK 6 billion in annual reve-
nue. All transports are competitively ten-
dered and close to half of the volume will
come up for bids within the next three years.
Th e latest measurements indicate a
decrease in use of public transport. Th e
underlying reasons are unknown, and it is
also uncertain whether this is a lasting trend.
UK-based Arriva acquired Veolia’s opera-
tions in 2007 and now operates around 1,600
buses with a market share of 52%. Keolis has
acquired 30% of Busslink (formerly SL-Bus)
in Sweden and also operates in Denmark
through City-Trafi k, which has a market
share of 9%.
DEREGULATION AND PRICING CYCLE
In Europe, only the UK has carried out more extensive
deregulation than the Nordic countries. In other parts of
Europe, most public transports are still conducted under
concessions with privately or publicly owned operators.

A N N U A L R E P O R T 2 0 0 7 / 2 0 0 8 C O N C O R D I A B U S 1 1
MARKNAD
ArrivaArriva is a listed British company that is
expanding outside the UK. In the Nordic
region, the company has traffi c in Sweden
and Denmark. Th e Nordic fl eet consists of
1,726 buses.
VeoliaVeolia is a listed French company that also
provides transport services on trains and
ferries. Th e company is the only operator
that has, or has had, scheduled traffi c in all
of the Nordic countries, but has now left
the Danish market. Th e fl eet consists of
1,579 buses.
Busslink/City-Trafi k/KeolisFrench Keolis is the principal owner of
Busslink, which formerly called SL-Buss
and was at that time wholly owned by
SLL. Today SLL has a holding of 30%. In
Denmark, Keolis owns the company City-
Trafi k. Th e fl eet consists of 1,613 buses.
Helb/City of HelsinkiTh e City of Helsinki’s bus company Helb
is the largest operator in the Helsinki
region and the second largest bus company
in Finland, after Koiviston Auto. Th e com-
pany has no operations outside Finland.
Th e fl eet consists of around 600 buses.
Nettbuss/NSBTh e Norwegian state railway operator
NSB own’s Norway’s largest bus company
Nettbuss. Th e company also has opera-
tions in Sweden (Orusttrafi ken, KR-trafi k
and Säffl ebussen) and Denmark. Th e fl eet
consists of 1,900 buses.
TideTide is a listed company with operations
in bus and boat transports in Norway.
Today the company is active mainly in
Bergen and Hordaland County. Th e fl eet
consists of around 1,000 buses.
Norgesbuss/Fosen/TorghattengruppenTorghattengrupen is a majority share-
holder in the listed company Fosen, which
also includes Norgesbuss. Th e corporate
group has no operations outside Norway.
Th e fl eet consists of 800 buses.
THE LARGEST OPERATORS
^

1 2 C O N C O R D I A B U S A N N U A L R E P O R T 2 0 0 7 / 2 0 0 8
Customer-driven in every dimension
Managing Director Jan Bosaeus
Annual revenue SEK 4,080 million (3,778)
Market share 30% (31%)
Number of passengers 200 million (190)
Number of employees 5,514 (5,425)
Number of buses 2,551 (2,758)
Number of km driven 185 million (178)
Competitors Busslink, Veolia, Arriva,
Orusttrafiken, etc.
Website www.swebus.se
The ability to offer secure and effi cient bus transports characterized by consideration and respect for the customer at all times is decisive for Swebus’s success. As the market leader, the company welcomes the chance to take greater responsibility for developing public transport in a more customer-oriented direction.
SWEBUS
Swebus 74%
SHARE OF CONCORDIA BUS’S REVENUE
A N N U A L R E P O R T 2 0 0 7 / 2 0 0 8 C O N C O R D I A B U S 1 3
Swebus’s vision is to be a word-class service
company. Th e Swedish unit of the group’s
contractual transport operations develops,
sells and produces public transport services
on contract on to some 20 clients in more
than 100 locations throughout Sweden. Th e
company is the market leader in Sweden,
with responsibility for nearly one in every
three bus journeys in the country.
Increased profi tabilityTh ree years ago Swebus adopted a plan for
gradual and sustainable earnings growth, a
plan the company has succeeded in realizing.
During these three years, operating profi t has
increased by more than SEK 350 million.
Profi tability is now stable and operating
profi t for the past fi nancial year reached SEK
73 million.
Th e current profi tability is proof that
Swebus has chosen the right path. When pro-
fessionalism, effi ciency and customer satisfac-
tion all improve, this is also visible in the
fi nancial results.
Swebus was formed through a merger
between three state-owned enterprises – SJ
Buss, GDG and Postens diligenstrafi k. At the
end of fi scal 2007–2008 the company had
around 100 transport contracts and approxi-
mately 8,000 employees working full time,
part time or on a contract basis. Th e majority
of these were drivers of the approximately
2,300 buses in scheduled traffi c. Th e 25%
largest contracts generated around 75% of
transport revenues. Service, maintenance and
local management/administration are carried
out in leased facilities.
A full 98% of transport revenues come
from the clients and only 2% from passenger
ticket purchases in a few individual contracts.
It is vital to increase the share of contracts
providing the operator with both fi xed com-
pensation and variable revenue based changes
in passenger volumes. Contracts with a large
incentive component result in lower tax
fi nancing.
Consolidated market sharesBecause the largest contracts in Sweden were
not subject to new tenders in the past year,
the dominant operators’ market shares
changed only marginally. Swebus, with 30%
of the market, is larger than its two closest
competitors combined. Busslink commands
18% of the market and Veolia 12%.
In the year’s tenders, Swebus extended its
contract with Kalmar County and was
awarded a new contract for urban traffi c in
Umeå. Th e contract on Gotland, where Swe-
bus is responsible for regional transports, will
be opened to new tenders 2008. In Stock-
holm the tenders for Märsta and Ekerö were
lost. Th e company lost its contract in Jön-
köping to a competitor that submitted a very
low bid.
In 2008 contracts will be tendered for
around 700 buses and in 2009 for an addi-
tional 840. Today Swebus operates around
25% of these transports.
Working for changePrice remains the decisive factor in most
transport contract tenders. In dialogue with
the clients, Swebus is working to reduce the
focus on fi xed price contracts and improve
the scope to off er the customer- oriented
transport services that are the company’s
business mission.
Th e client typically determines the time-
table. It would benefi t the customers, and in
a longer perspective also the client and tax-
payers, if the operator were instead given
responsibility for creating a timetable that
delivers maximum benefi t for the customers
and client based on certain pre-defi ned crite-
ria. Th e results of the 2007 Public Transport
Barometer survey support this argument.
Th e yearly survey, which is conducted by
the Swedish Public Transport Association
(SLTF) shows that customers value simplicity
in public transport services over reliability,
speed and security, which have always been
among the top customer priorities. Departure
times, on the other hand, are not listed among
the fi ve most important factors for customers.
Swebus is working to increase the share of
incentive contracts in the public transport
sector, among other things through the bus
operators’ industry organization.
Higher effi ciencyWhether the timetable is created by the client
or Swebus, good traffi c planning is critical for
the company to operate successfully. Th e per-
formance management system developed by
Concordia Bus is the most eff ective in the
industry, and the only one that makes up part
of a larger customer-oriented model for pro-
cess control.
In the past year Swebus further improved
its planning effi ciency. For the customers this
means better traffi c solutions, without ever
compromising on safety or security and
always with room for a comfort and con-
venience that contributes to a positive experi-
ence of the journey.
For the client, a high level of planning
effi ciency is synonymous with improved
transport services and a cost reduction that
can decrease the long-term need for tax sub-
sidies. It also provides scope to allocate
resources to an expanded service off ering that
attracts more customers.
One consequence of ineffi ciency is that
drivers are available to customers only for
around two thirds of their so-called driving
time. Th e remaining time is spent at the
depot, at the starting/end stops and during
empty transports. 13% of the total kilome-
ters driven by Swebus consist of empty trans-
ports, which means that every day Swebus is
forced to drive two times the Earth’s circum-
ference without any passengers onboard.
Proactive environmental effortsFrom a societal and the environmental per-
spective, bus transports are an excellent alter-
native. Buses off er environmental advantages
even when carrying only a few passengers,
and a reduced number of cars on the road
alleviates traffi c congestion and provides
greater scope for commercial transports,
bicyclists and pedestrians. Th e challenge for
Swebus lies in encouraging more people to
choose the bus as their mode of transport.
When it comes to the ability to pro-
actively seek new ways of maximizing re-
source-effi ciency in the environmental area
and meeting continuously escalating environ-
mental challenges, Swebus is a forerunner.
Th e company continuously measures and
takes action to reduce its environmental
impact, which will be presented for the fi rst
time in a comprehensive environmental report
during 2008. Swebus’s goal is to achieve a 20%
reduction in greenhouse gas emissions per pas-
senger by the year 2012 and to increase the use
of renewable energy in the company’s buses
and premises. In addition, the company has
joined forces with clients in an environmental
project to increase the number of passengers
and minimize empty transports.
Dedicated employeesDedicated employees that share Swebus’s
values and have the knowledge necessary to
develop the company’s operations in the right
direction are essential for success. Swebus
therefore works actively to foster both dedica-
tion and expertise. Several of the 25 perform-
ance indicators used by Swebus and the other
companies in the Concordia Bus Group are
aimed at providing both managers and other
employees with opportunities for personal
SWEBUS
1 4 C O N C O R D I A B U S A N N U A L R E P O R T 2 0 0 7 / 2 0 0 8
CONCORDIA BUS FINLAND
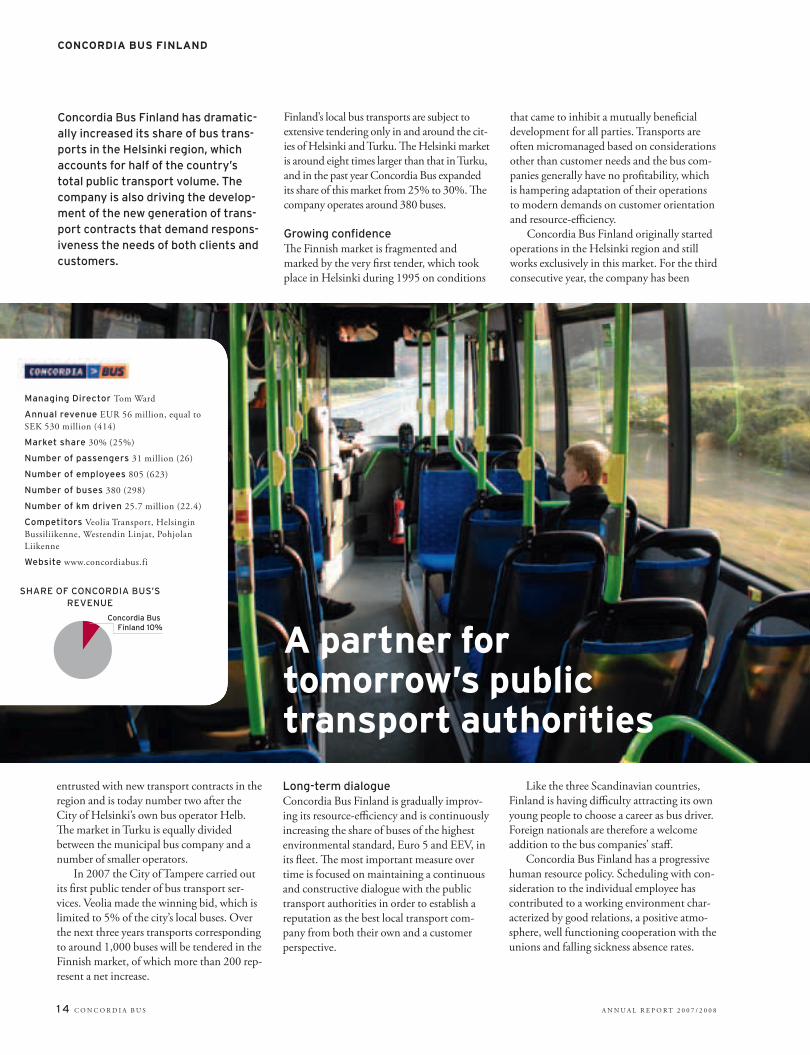
Concordia Bus Finland has dramatic-ally increased its share of bus trans-ports in the Helsinki region, which accounts for half of the country’s total public transport volume. The company is also driving the develop-ment of the new generation of trans-port contracts that demand respons-iveness the needs of both clients and customers.
Finland’s local bus transports are subject to
extensive tendering only in and around the cit-
ies of Helsinki and Turku. Th e Helsinki market
is around eight times larger than that in Turku,
and in the past year Concordia Bus expanded
its share of this market from 25% to 30%. Th e
company operates around 380 buses.
Growing confi denceTh e Finnish market is fragmented and
marked by the very fi rst tender, which took
place in Helsinki during 1995 on conditions
that came to inhibit a mutually benefi cial
development for all parties. Transports are
often micromanaged based on considerations
other than customer needs and the bus com-
panies generally have no profi tability, which
is hampering adaptation of their operations
to modern demands on customer orien tation
and resource-effi ciency.
Concordia Bus Finland originally started
operations in the Helsinki region and still
works exclusively in this market. For the third
consecutive year, the company has been
A partner for tomorrow’s public transport authorities
Managing Director Tom Ward
Annual revenue EUR 56 million, equal to
SEK 530 million (414)
Market share 30% (25%)
Number of passengers 31 million (26)
Number of employees 805 (623)
Number of buses 380 (298)
Number of km driven 25.7 million (22.4)
Competitors Veolia Transport, Helsingin
Bussiliikenne, Westendin Linjat, Pohjolan
Liikenne
Website www.concordiabus.fi
entrusted with new transport contracts in the
region and is today number two after the
City of Helsinki’s own bus operator Helb.
Th e market in Turku is equally divided
between the municipal bus company and a
number of smaller operators.
In 2007 the City of Tampere carried out
its fi rst public tender of bus transport ser-
vices. Veolia made the winning bid, which is
limited to 5% of the city’s local buses. Over
the next three years transports corresponding
to around 1,000 buses will be tendered in the
Finnish market, of which more than 200 rep-
resent a net increase.
Long-term dialogueConcordia Bus Finland is gradually improv-
ing its resource-effi ciency and is continuously
increasing the share of buses of the highest
environmental standard, Euro 5 and EEV, in
its fl eet. Th e most important measure over
time is focused on maintaining a continuous
and constructive dialogue with the public
transport authorities in order to establish a
reputation as the best local transport com-
pany from both their own and a customer
perspective.
Like the three Scandinavian countries,
Finland is having diffi culty attracting its own
young people to choose a career as bus driver.
Foreign nationals are therefore a welcome
addition to the bus companies’ staff .
Concordia Bus Finland has a progressive
human resource policy. Scheduling with con-
sideration to the individual employee has
contributed to a working environment char-
acterized by good relations, a positive atmo-
sphere, well functioning cooperation with the
unions and falling sickness absence rates.
Concordia Bus Finland 10%
SHARE OF CONCORDIA BUS’S REVENUE
A N N U A L R E P O R T 2 0 0 7 / 2 0 0 8 C O N C O R D I A B U S 1 5
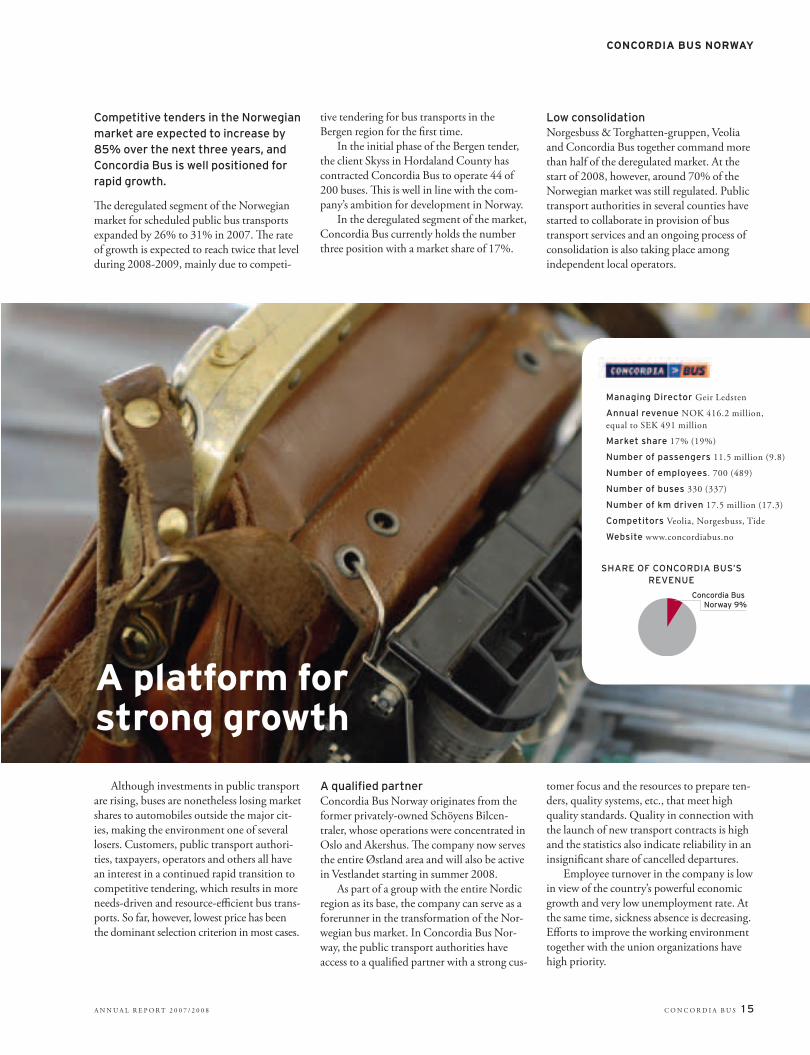
A platform for strong growth
Managing Director Geir Ledsten
Annual revenue NOK 416.2 million,
equal to SEK 491 million
Market share 17% (19%)
Number of passengers 11.5 million (9.8)
Number of employees. 700 (489)
Number of buses 330 (337)
Number of km driven 17.5 million (17.3)
Competitors Veolia, Norgesbuss, Tide
Website www.concordiabus.no
CONCORDIA BUS NORWAY
Competitive tenders in the Norwegian market are expected to increase by 85% over the next three years, and Concordia Bus is well positioned for rapid growth.
Th e deregulated segment of the Norwegian
market for scheduled public bus transports
expanded by 26% to 31% in 2007. Th e rate
of growth is expected to reach twice that level
during 2008-2009, mainly due to competi-
tive tendering for bus transports in the
Bergen region for the fi rst time.
In the initial phase of the Bergen tender,
the client Skyss in Hordaland County has
contracted Concordia Bus to operate 44 of
200 buses. Th is is well in line with the com-
pany’s ambition for development in Norway.
In the deregulated segment of the market,
Concordia Bus currently holds the number
three position with a market share of 17%.
Low consolidationNorgesbuss & Torghatten-gruppen, Veolia
and Concordia Bus together command more
than half of the deregulated market. At the
start of 2008, however, around 70% of the
Norwegian market was still regulated. Public
transport authorities in several counties have
started to collaborate in provision of bus
transport services and an ongoing process of
consolidation is also taking place among
independent local operators.
Although investments in public transport
are rising, buses are nonetheless losing market
shares to automobiles outside the major cit-
ies, making the environment one of several
losers. Customers, public transport authori-
ties, taxpayers, operators and others all have
an interest in a continued rapid transition to
competitive tendering, which results in more
needs-driven and resource-effi cient bus trans-
ports. So far, however, lowest price has been
the dominant selection criterion in most cases.
A qualifi ed partnerConcordia Bus Norway originates from the
former privately-owned Schöyens Bilcen-
traler, whose operations were concentrated in
Oslo and Akershus. Th e company now serves
the entire Østland area and will also be active
in Vestlandet starting in summer 2008.
As part of a group with the entire Nordic
region as its base, the company can serve as a
forerunner in the transformation of the Nor-
wegian bus market. In Concordia Bus Nor-
way, the public transport authorities have
access to a qualifi ed partner with a strong cus-
tomer focus and the resources to prepare ten-
ders, quality systems, etc., that meet high
quality standards. Quality in connection with
the launch of new transport contracts is high
and the statistics also indicate reliability in an
insignifi cant share of cancelled departures.
Employee turnover in the company is low
in view of the country’s powerful economic
growth and very low unemployment rate. At
the same time, sickness absence is decreasing.
Eff orts to improve the working environment
together with the union organizations have
high priority.
Concordia Bus Norway 9%
SHARE OF CONCORDIA BUS’S REVENUE
1 6 C O N C O R D I A B U S A N N U A L R E P O R T 2 0 0 7 / 2 0 0 8
Th e fundamental conditions for express bus
operations are completely diff erent from
those for local bus transports, mainly in that
revenue comes exclusively from the individ-
ual passengers.
At Swebus Express, express bus transports
consist of scheduled transports that cover a
distance of at least 100 km and cross a least
one county line. Unlike rail-bound transports,
there is no opportunity to benefi t from public
sector subsidies in this segment.
Swebus Express is the dominant player
above all on bus lines with a large customer
base, such as the Swedish triangle Stockholm-
Gothenburg-Malmö, and also operates to the
Norwegian and Danish capital cities.
Major challengesRail transports are the foremost competitor
for eco-conscious customers in the public
transport sector and, unlike express buses,
increased their volumes in 2007. Th e market
share for rail transports is estimated at
approximately 75%, while Swebuss Express
has around 5%. Including express bus trans-
ports, the company has a market share of over
50%.
Automobiles are a fi nancially and environ-
mentally inferior alternative to express bus
transports, but nonetheless gained ground in
the past year. Th rough an objectionary right,
the aff ected public transport authorities can
still prevent boarding and deboarding of indi-
vidual passengers within the same county.
Young people, students and seniors are the
key customer groups for Swebus Express, and
price is often the decision factor for their
choice. Sales take place to a growing extent
over the Internet, which provides convenience
for the customers and scope to keep prices low.
By purchasing a ticket 24 hours before depar-
ture, the customer is guaranteed a seat on the
bus.
Alongside the express product, Swebus
Express operates commuter transports
between Stockholm and Uppsala.
Increased effi ciencyIn the past year the company increased its
resource-effi ciency by revising the seat guar-
antee, reducing the number of owned buses
in service, winding up commuter lines and
other lines with weak demand, boosting the
share of online sales, reducing the number of
administrative staff and raising the share of
environmentally-friendly buses in the com-
pany’s own fl eet. Swebus Express has also
increased the number of campaigns and
special off ers.
Attractive offersTh e company strives to continuously optim-
ize the relative price advantages of its prod-
ucts, which is necessary in achieving a sus-
tainable improvement in customer satisfac-
tion and loyalty.
Swebus Express will continue enhancing
its resource-effi ciency through improved sup-
port systems, increased capacity utilization
and the purchasing of even more vehicles of a
high environmental standard. Th e company
also aims to strengthen its position through
attractive off ers to the customers.
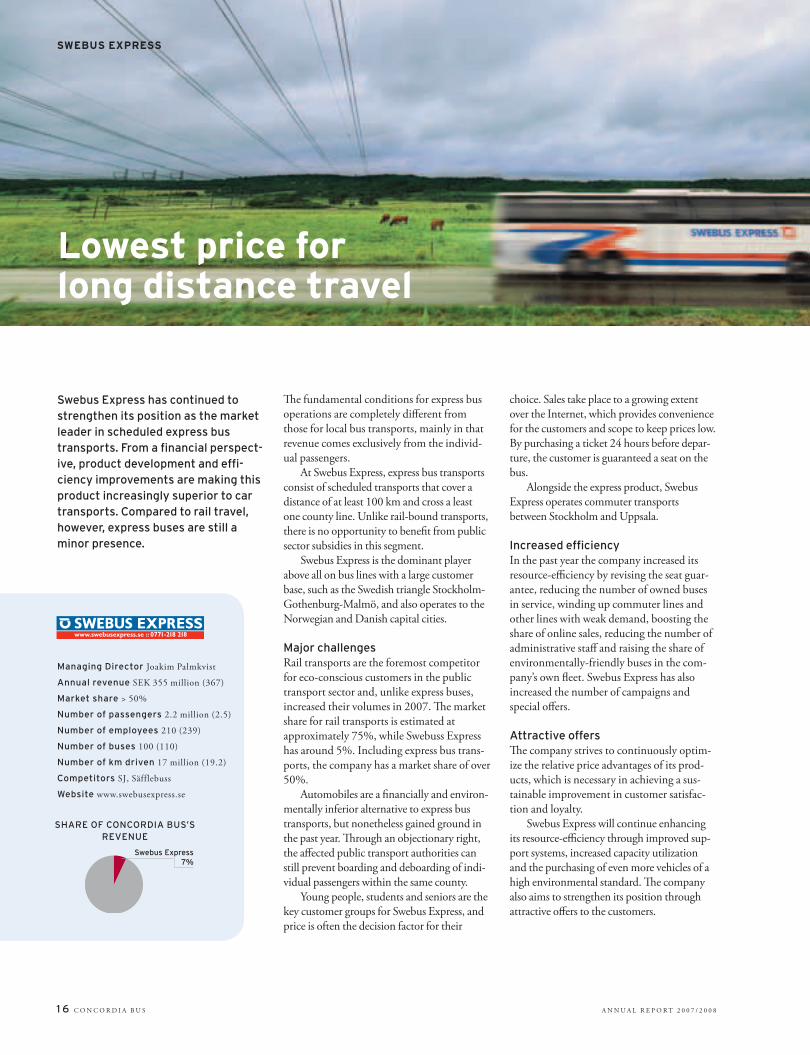
Lowest price for long distance travel
Managing Director Joakim Palmkvist
Annual revenue SEK 355 million (367)
Market share > 50%
Number of passengers 2.2 million (2.5)
Number of employees 210 (239)
Number of buses 100 (110)
Number of km driven 17 million (19.2)
Competitors SJ, Säfflebuss
Website www.swebusexpress.se
SWEBUS EXPRESS
Swebus Express has continued to strengthen its position as the market leader in scheduled express bus transports. From a fi nancial perspect-ive, product development and effi -ciency improvements are making this product increasingly superior to car transports. Compared to rail travel, however, express buses are still a minor presence.
Swebus Express7%
SHARE OF CONCORDIA BUS’S REVENUE

A N N U A L R E P O R T 2 0 0 7 / 2 0 0 8 C O N C O R D I A B U S 1 7
Concordia Bus Fleet gives the Group a detailed overview of the Nordic region’s largest bus fl eet and greater leverage in bidding for transport contracts.
Concordia Bus Fleet bases all purchasing of
buses on dynamic calculations of the total cost
of ownership over the entire lifecycle of each
bus. Th e calculations take into account not
only the purchase price and fi nancing cost of
the buses, but also their resale value and costs
for fuel, service, spare parts, etc. Th is method
for purchasing vehicles provides far better con-
trol over an area that normally makes up
around 40% of a bus company’s total costs.
By acquiring all buses via a single company
Concordia Bus is able to exploit its scale econ-
omies while at the same time standardizing its
purchasing routines, which further improves
the scope to optimize operations.
At the time it was established in 2006,
Concordia Bus Fleet was the fi rst company of
its kind in the Nordic market. With a small
and highly specialized staff , Concordia Bus
Fleet purchases and fi nances buses in a fl eet
that is spread across four countries. Th e
Group’s central purchasing department then
handles the fi nal acquisition. Concordia Bus
Fleet optimizes utilization of the Group’s bus
fl eet to reduce both tied-up capital and the
need for new investments. Th is contributes to
satisfying the client’s requirements in the most
resource-effi cient manner possible. Handling
the buses in a separate company also ensures
greater transparency and security for the fi nan-
ciers.
Competitive total solution Concordia Bus’s operations are focused on
meeting the requirements in a large number of
multi-year transport contracts containing
individual and far-reaching demands on the
local traffi c and buses.
Th e detailed tender specifi cations put for-
ward by the transport authorities require extens-
ive system support in the operating companies.
Concordia Bus Fleet has developed a sophisti-
cated, comprehensive and robust model that is
used by the Group and its operating units.
Before making a bid, the operating com-
pany is assisted by Concordia Bus Fleet to cal-
culate exactly how the bus concept in the tender
in question should be structured to achieve a
cost advantage. Th rough effi cient resource allo-
cation, the need for new investments can be
reduced and the bid be made more competitive,
at the same time that the transport services
become more profi table. If the tender is won,
Concordia Bus Fleet provides the operating
company with a complete package consisting of
buses, fi nancing, administration and other bus-
related services. Th e concept is based on pre-
agreed market-based terms between the parties,
with both fi xed and variable compensation.
Flexibility through right of return Th e operating companies in the Concordia
Bus Group lease buses from Concordia Bus
Fleet with a right of return. If the operating
company wishes to adjust its bus fl eet during
the term of the contract, this can be done after
a short notice period. In the event that a com-
pany loses one of its transport contracts, it has
the right to cancel the lease according to a pre-
determined notice period and to return all of
the aff ected buses.
When a transport contract expires, the
buses are either sold or relocated. Th is right of
return during ongoing transport contracts
accelerates the elimination of excess capacity
in the operating companies, which thereby
achieve greater fl exibility and cost-awareness
and are able to maximize utilization of the bus
fl eet.
At the end of the fi scal year, close to 98%
of the buses were on lease to operating compa-
nies in the Concordia Bus Group. Th e remain-
ing buses were either for sale or, when deemed
more advantageous for internal optimization,
leased outside the Group. In the past fi scal year
Concordia Bus Fleet sold 260 buses.
Lower cost of acquisition Two years after its formation, Concordia Bus
Fleet has acquired and fi nanced buses for a
total of SEK 1.7 billion. Th is means that the
company has been responsible for the pur-
chase of nearly every fi fth bus in Sweden, Nor-
way and Finland. Th e acquisitions are fi nanced
through fi nance leases in which the contract
period is shorter than the useful life of the
buses, thereby reducing fi nancing risk. In the
past fi scal year the company acquired 392
buses from fi ve diff erent Swedish and foreign
manufacturers, and continuously evaluates
alternative suppliers.
Concordia Bus Fleet expects to acquire up
to 300 buses annually over the next three
years. In 2008 the company is conducting an
in-depth analysis of the fl eet that includes
every individual bus. Th e results will serve as
a basis for the proactive measures needed by
Concordia Bus to optimally meet the needs
of customers and clients in each part of the
Nordic market.
Total control reduces costs
0
500
1,000
1,500
2,000
2,500
3,000
3,500
4,000
20082007200620052004
Operating leasesFinance leasesOwned buses
Number
2,568
1,317
1,470
1,569
1,731
23
23
31 328
2,237
1,7951,562
1,216
512
1,648
BREAKDOWN OF BUSES BY TYPE OF FINANCING
CONCORDIA BUS FLEET

1 8 C O N C O R D I A B U S A N N U A L R E P O R T 2 0 0 7 / 2 0 0 8
Long-term sustainable travel
Concordia Bus works toward sustainable transport development with a focus on customer benefi t and innovation. The Group’s new environmental policy has provided the fi rst necessary platform for this process.
In 2007 Concordia Bus formulated and adopted
a group-wide environmental policy that refl ects
a commitment to developing public transport’s
benefi ts to society through continuous measures
to promote sustainable development.
As a next step, the management will choose
how to implement focus and integrate it with
both operating activities and process develop-
ment. Th e long-term target is for the company
to become climate-neutral.
Higher capacity utilization increases benefi tsBuses are environmentally superior to automo-
biles even when carrying only a few passengers.
Th e more people who choose the bus instead of
a car, the greater the environmental gains. In
order for bus transports to become climate-
neutral – on the road and in the workshops and
depots – energy consumption and emissions
must be further reduced.
Measures such as new fuels, new bus tech-
nology and fuel-effi cient driving can contribute
to increased sustainability, and transport effi -
ciency also has a direct infl uence on environ-
mental impact. Optimized timetables with a
minimum of unproductive time help to reduce
negative environmental eff ects, and pressure on
the environment is further alleviated by main-
taining the smallest possible distance between
the bus storage yards and the fi rst stop. Th e use
of energy, water, cleaning agents and chemicals
in connection with vehicle service is also signi-
fi cant from an environmental standpoint.
230 million passengersToday’s needs must be satisfi ed in a way that
makes it possible to also meet future needs. In
other words, all development must be sustain-
able in the long term.
Concordia Bus drives more people and more
buses than any other operator in the Nordic
countries. Every fi fth bus operated in the Nordic
region belongs to the company and around 5%
of all diesel fuel sold in the Nordic market is used
to transport its 230 million passengers. Th is rep-
resents a major environmental responsibility.
All three of the company’s defi ning charac-
teristics – appreciated, credible and resource-
effi cient – have a direct bearing on environ-
mental performance. In a longer perspective,
public transports without environmental
responsibility can never be perceived as reliable
or appreciated. Transport solutions that do not
support society’s ambitions for road traffi c lack
credibility. Th e resource-effi ciency requirement
means that low production costs must be com-
bined with high quality and eff ective solutions
that contribute to sustainable development.
In 2005 Swebus adopted an environmental
plan and began working according to an environ-
mental management system based on ISO
14001:2004, while the companies in Norway
and Finland were both already certifi ed to this
environmental standard.
Th e Group has an environmental council
consisting of the environmental directors of each
subsidiary. Th e environmental council draws up
guidelines for the Group’s joint environmental
eff orts. Every year, the aff ected employees in
each organization attend an environmental
course. Recurring audits are used to monitor
environmental activities and their results.
Integrated environmental aspects Th e new group-wide environmental policy
emphasizes the long-term nature of these meas-
ures. Environmental aspects must be coordi-
nated and integrated with the development of
processes, services, quality issues, etc., in order
to create lasting value for all stakeholders. Th e
commitment applies to all areas of activity, not
only bus transports.
Concordia Bus aims to be one of the most
eco-adapted alternatives for public transport and
long-distance bus travel. With a focus on cus-
tomers and innovation, the company strives to
be an industry leader in the development of sus-
tainable public transport.
Successful environmental work demands
clearly defi ned goals and continuous evaluation.
SUSTAINABILITY

A N N U A L R E P O R T 2 0 0 7 / 2 0 0 8 C O N C O R D I A B U S 1 9
SUSTAINABILITY
BREAKDOWN OF BUS FLEET BY ENGINE CLASS/EURO CLASS
BREAKDOWN OF BUSFLEET BY FUEL TYPE
EMISSIONS TONNES
Carbon dioxides 211,712
Nitrogen oxides 3,054
Particulates 39
Hydrocarbons 40
Diesel 96.17%Ethanol 2.37%
CNG/Biogas 1.44%
Electricity 0.02%
EEV 1.53%
Euro 0 0.51%
Euro 1 10.18%
Euro 2 42.82%Euro 3 32.68%
Euro 4 9.56%
Euro 5 2.74%
Environmental aspects are therefore integrated with
general business development, which means that tar-
gets are set at least yearly in connection with adop-
tion of the annual business plan and are followed up
systematically. For several years, the company has
worked actively to develop performance indicators
for the Group’s total environmental impact.
Th e environmental policy underlines a few areas
that are of particular importance for successful envir-
onmental management, such as responsible use of
energy, a reduced share of fossil fuels, conservation
of resources, an increase in the employees’ environ-
mental knowledge and encouragement of their
environmental initiatives.
Decreased fuel consumption Fuel consumption in the buses and their emissions
of greenhouse gases (GHGs) and particulates,
together with energy for heating, are the key focus
areas for environmental eff orts.
With the Nordic region’s largest bus fl eet and a
positive operating result, there is good potential to
act as a driving force for technological advances that
can reduce the environmental footprint of transport
services. Th e ongoing transition to increasingly eco-
effi cient buses and upgrading of existing buses is
also enabling these to meet modern environmental
standards.
Th e number of kilometers driven with passen-
gers rose by 3.4% in the past fi scal year despite a
decrease of 3.6% or 127 buses in the fl eet, mainly
thanks to improved transport effi ciency. Th e com-
pany’s total diesel consumption reached 94.3 mil-
lion liters, corresponding to 96% of the total num-
ber of kilometers driven. Total carbon dioxide emis-
sions amounted to 211,000 tonnes.
Concordia Bus collaborates with bus manufac-
turers and other suppliers to develop new genera-
tions of more resource-effi cient and innovative
vehicles and engines. In the current fi scal year, the
company will reduce its fuel consumption in exist-
ing transports by 2%. Emissions of carbon dioxide
are expected to decrease by 4,000 tonnes through
measures such as modernization of the bus fl eet,
improved maintenance, eco-adapted driving and
optimized use of the buses with the best environ-
mental performance.
Th e buses use Environmental Class 1 (EC1) diesel
with various additives to reduce fuel-generated emis-
sions. Of total fuel consumption, ethanol and CNG
accounted for an unchanged share of nearly 5%.
In several cities where Concordia Bus is respons-
ible for public transport, promising trials are under-
way to test new, natural fuel additives that reduce
emissions of both GHGs and particulates. By 2012,
GHG emissions will be reduced by 20% per passen-
ger kilometer.
Modernization of treatment plantsEnergy consumption at the depots is falling and will
be further reduced over the next three-year period.
Th e conversion from chemical to biological or
fresh water processes in the depots’ treatment plants
has resulted in a 50% decrease in hazardous emis-
sions. Modernization of the treatment plants is con-
tinuing in pace with the availability of new treat-
ment and recycling technology.
Each depot has an individual waste plan. When
a bus is scrapped, close to 90% of the components
are recovered.
Safety comes fi rstA high level of safety is vital in all of the company’s
transports, and in all other operating activities. Th e
traffi c safety policy expresses the company’s ambi-
tion to serve as a role model in traffi c. Safety-related
work is conducted systematically and as an integral
part of other operations.
Safety and security are the top priorities in day-
to-day bus transports, are take precedence over
comfort, convenience and punctuality. In 2007
Concordia Bus won an award in Sweden for its traf-
fi c safety eff orts including several thousand self-
administered speed checks that resulted in lower
driving speeds.
Th e buses undergo technical tune-ups and ser-
vice every 10,000 kilometers and have earned the
industry’s top scores in annual vehicle inspections
for the past two years. In addition, each bus is sub-
ject to a daily 29-point safety check that is per-
formed before entering service for the day.
Th e company’s active approach to safety
includes follow-up of threats and violence against
customers or staff and risks related to traffi c incid-
ents. An in-house developed computer system
handles data and contributes to a safe and secure
environment where traffi c fl ows smoothly without
disruptions.
2 0 C O N C O R D I A B U S A N N U A L R E P O R T 2 0 0 7 / 2 0 0 8
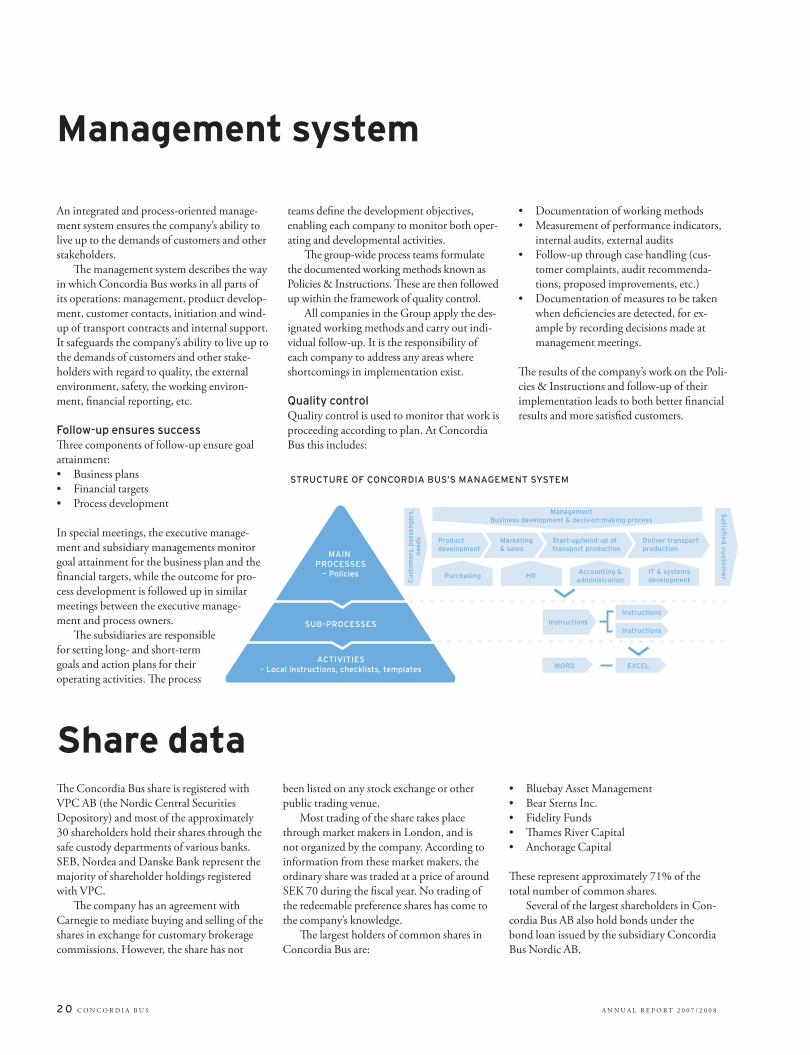
Management system
Share dataTh e Concordia Bus share is registered with
VPC AB (the Nordic Central Securities
Depository) and most of the approximately
30 shareholders hold their shares through the
safe custody departments of various banks.
SEB, Nordea and Danske Bank represent the
majority of shareholder holdings registered
with VPC.
Th e company has an agreement with
Carnegie to mediate buying and selling of the
shares in exchange for customary brokerage
commissions. However, the share has not
been listed on any stock exchange or other
public trading venue.
Most trading of the share takes place
through market makers in London, and is
not organized by the company. According to
information from these market makers, the
ordinary share was traded at a price of around
SEK 70 during the fi scal year. No trading of
the redeemable preference shares has come to
the company’s knowledge.
Th e largest holders of common shares in
Concordia Bus are:
• Bluebay Asset Management
• Bear Sterns Inc.
• Fidelity Funds
• Th ames River Capital
• Anchorage Capital
Th ese represent approximately 71% of the
total number of common shares.
Several of the largest shareholders in Con-
cordia Bus AB also hold bonds under the
bond loan issued by the subsidiary Concordia
Bus Nordic AB.
An integrated and process-oriented manage-
ment system ensures the company’s ability to
live up to the demands of customers and other
stakeholders.
Th e management system describes the way
in which Concordia Bus works in all parts of
its operations: management, product develop-
ment, customer contacts, initiation and wind-
up of transport contracts and internal support.
It safeguards the company’s ability to live up to
the demands of customers and other stake-
holders with regard to quality, the external
environment, safety, the working environ-
ment, fi nancial reporting, etc.
Follow-up ensures successTh ree components of follow-up ensure goal
attainment:
• Business plans
• Financial targets
• Process development
In special meetings, the executive manage-
ment and subsidiary managements monitor
goal attainment for the business plan and the
fi nancial targets, while the outcome for pro-
cess development is followed up in similar
meetings between the executive manage-
ment and process owners.
Th e subsidiaries are responsible
for setting long- and short-term
goals and action plans for their
operating activities. Th e process
teams defi ne the development objectives,
enabling each company to monitor both oper-
ating and developmental activities.
Th e group-wide process teams formulate
the documented working methods known as
Policies & Instructions. Th ese are then followed
up within the framework of quality control.
All companies in the Group apply the des-
ignated working methods and carry out indi-
vidual follow-up. It is the responsibility of
each company to address any areas where
shortcomings in implementation exist.
Quality controlQuality control is used to monitor that work is
proceeding according to plan. At Concordia
Bus this includes:
• Documentation of working methods
• Measurement of performance indicators,
internal audits, external audits
• Follow-up through case handling (cus-
tomer complaints, audit recommenda-
tions, proposed improvements, etc.)
• Documentation of measures to be taken
when defi ciencies are detected, for ex-
ample by recording decisions made at
management meetings.
Th e results of the company’s work on the Poli-
cies & Instructions and follow-up of their
implementation leads to both better fi nancial
results and more satisfi ed customers.
STRUCTURE OF CONCORDIA BUS’S MANAGEMENT SYSTEM
MAIN PROCESSES
– Policies
Cus
tom
ers,
pas
seng
ers,
need
s
Satisfi
ed
custo
me
r
SUB-PROCESSES
ACTIVITIES– Local instructions, checklists, templates
Product development
Purchasing Accounting &administration
IT & systemsdevelopment
Marketing & sales
Start-up/wind-up of transport production
Deliver transportproduction
WORD EXCEL
ManagementBusiness development & decision-making process
HR
InstructionsInstructions
Instructions

A N N U A L R E P O R T 2 0 0 7 / 2 0 0 8 C O N C O R D I A B U S 2 1
Concordia Bus AB (publ)) is a Swedish regis-
tered company domiciled in Stockholm. Th e
Group consists of fi ve subsidiaries that con-
duct bus operations, primarily related to pub-
lic transport in the Nordic countries, and two
administrative companies. Th is report per-
tains to the fi scal year 2007-2008 and pro-
vides an account of activities prior to the
2008 Annual General Meeting. Th e report
has not been audited by the company’s inde-
pendent auditors. Th e Board’s report on
internal control forms a separate section of
the corporate governance report.
Corporate governance requirementsCorporate governance in Concordia Bus is
regulated by Swedish law, primarily the
Swedish Companies Act and loan agreements
with bond holders.
Concordia Bus has undertaken to fulfi ll
the fundamental requirements for corporate
governance. Th is report describes company’s
corporate governance, management and
administration, as well as the manner in
which the Board ensures the quality of the
fi nancial statements and its cooperation with
the company’s independent auditors.
Corporate governance bodiesA number of diff erent bodies in the company
are responsible for control and corporate gov-
ernance. At the Annual General Meeting, the
shareholders exercise their voting rights, for
example in determining the composition of
the Board and election of auditors. Th e
Nomination Committee recommends can-
didates for election of Board members, the
Board Chairman and independent auditors.
Th e Board is responsible for the compa-
ny’s long-term development and strategy and
for controlling and evaluating day-to-day
operations. Th e Board appoints the President
of Concordia Bus AB, who is also the CEO.
Th e President is responsible for ensuring
that day-to-day operations are conducted in
accordance with the Board’s guidelines and
instructions. Th e president of each subsidiary
reports directly to the CEO and is responsi-
ble, in turn, for complying with the estab-
lished instructions and guidelines.
General meeting of shareholdersIn accordance with the Swedish Companies
Act and Concordia Bus’s articles of associa-
tion, the composition of the Board and other
matters to be addressed by the Annual Gen-
eral Meeting are determined by voting. Sup-
plementary voting rules might be found in
the shareholder agreements signed between
certain owners.
Resolutions by the Annual General Meet-
ing are normally passed by a simple majority.
In certain cases, however, the Swedish Com-
panies Act requires a specifi c level of atten-
dance to form a quorum or a particular voting
majority. At the Annual General Meeting, the
shareholders have the opportunity to pose
question about the company and its results for
the past year. Representatives from the Board,
executive management and auditors are norm-
ally present to answer these questions. Share-
holders and other stakeholders can also write
to the Board or executive management by e-
mail, via the website www.concordiabus.com
or by letter to: Concordia Bus AB, Solna
Strandväg 78, SE-171 54 Solna, Sweden.
2007 Annual General MeetingAt the Annual General Meeting on 30 May
2007, 6.35% of the shareholders and 7.75%
of the voting rights were represented. Th e
Board and management of Concordia Bus
AB were present. Th e following resolutions
were passed:
• Th e incumbent Board was re-elected
• Th e income statements and balance
sheets of the Parent Company and Group
were adopted
• Th e members of the Board of Directors
and the President were discharged from
liability for the 2006–2007 fi scal year
• Th e amount of Board fees was established
• Th e principles for remuneration and
other terms of employment for senior
executives were approved
2008 Annual General MeetingConcordia Bus has preliminarily scheduled
the Annual General Meeting for 28 May
2008.
Board of DirectorsTh e task of the Board of Directors is to pro-
mote healthy business development and ade-
quate control of the company’s operations.
Th e composition of Concordia Bus’s Board of
Directors, and the fees and attendance of each
member, are presented in the table below.
Aside from the reported benefi ts and
remuneration, the members of the Board are
covered by a stock option program. Th e
Board in full also serves at the company’s
Audit Committee.
Th e Board of Concordia Bus AB is
responsible for the organization and adminis-
tration of the company’s aff airs. Th e Board
shall consist of at least three and at most ten
members. From among its members the Board
has appointed a Chairman, who according to
Swedish law may not simultaneously hold the
position of President of the company.
One of the Board’s most important tasks
is to ensure good management, monitoring
and control of the company’s operations in
order to create value for the shareholders,
customers, employees and other stakeholders.
The Board’s formal work plan and independence Th e Board has adopted a formal work plan
for its activities that describes how duties are
Corporate governance report
SEK thousand Regular fees Extra fees Meeting attendance Shareholding
Chairman
Jan Sjökvist 650,000 – 100% –
Members
Jan Sundling 175,000 – 100% –
Rolf Lydahl 175,000 – 100% –
Gina Germano 0 – 0% –
Deputy
Thomas Naess 0 – 100% –
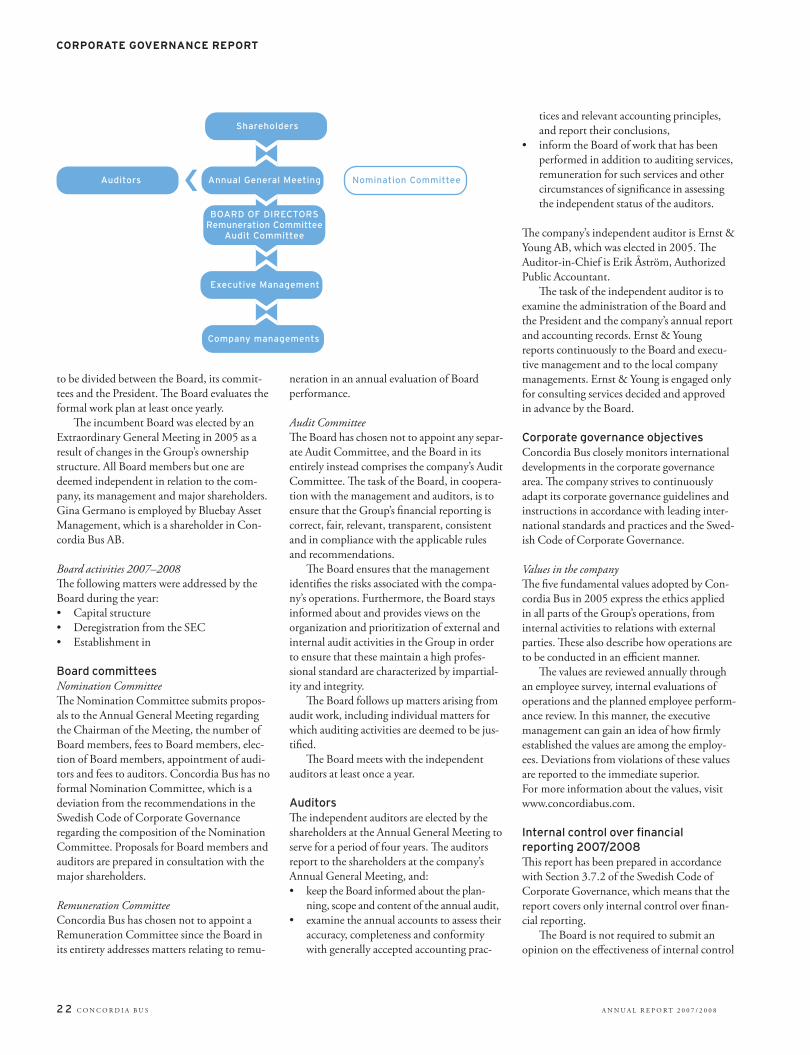
2 2 C O N C O R D I A B U S A N N U A L R E P O R T 2 0 0 7 / 2 0 0 8
to be divided between the Board, its commit-
tees and the President. Th e Board evaluates the
formal work plan at least once yearly.
Th e incumbent Board was elected by an
Extraordinary General Meeting in 2005 as a
result of changes in the Group’s ownership
structure. All Board members but one are
deemed independent in relation to the com-
pany, its management and major shareholders.
Gina Germano is employed by Bluebay Asset
Management, which is a shareholder in Con-
cordia Bus AB.
Board activities 2007–2008
Th e following matters were addressed by the
Board during the year:
• Capital structure
• Deregistration from the SEC
• Establishment in
Board committeesNomination Committee
Th e Nomination Committee submits propos-
als to the Annual General Meeting regarding
the Chairman of the Meeting, the number of
Board members, fees to Board members, elec-
tion of Board members, appointment of audi-
tors and fees to auditors. Concordia Bus has no
formal Nomination Committee, which is a
deviation from the recommendations in the
Swedish Code of Corporate Governance
regarding the composition of the Nomination
Committee. Proposals for Board members and
auditors are prepared in consultation with the
major shareholders.
Remuneration Committee
Concordia Bus has chosen not to appoint a
Remuneration Committee since the Board in
its entirety addresses matters relating to remu-
neration in an annual evaluation of Board
performance.
Audit Committee
Th e Board has chosen not to appoint any separ-
ate Audit Committee, and the Board in its
entirely instead comprises the company’s Audit
Committee. Th e task of the Board, in coopera-
tion with the management and auditors, is to
ensure that the Group’s fi nancial reporting is
correct, fair, relevant, transparent, consistent
and in compliance with the applicable rules
and recommendations.
Th e Board ensures that the management
identifi es the risks associated with the compa-
ny’s operations. Furthermore, the Board stays
informed about and provides views on the
organization and prioritization of external and
internal audit activities in the Group in order
to ensure that these maintain a high profes-
sional standard are characterized by impartial-
ity and integrity.
Th e Board follows up matters arising from
audit work, including individual matters for
which auditing activities are deemed to be jus-
tifi ed.
Th e Board meets with the independent
auditors at least once a year.
AuditorsTh e independent auditors are elected by the
shareholders at the Annual General Meeting to
serve for a period of four years. Th e auditors
report to the shareholders at the company’s
Annual General Meeting, and:
• keep the Board informed about the plan-
ning, scope and content of the annual audit,
• examine the annual accounts to assess their
accuracy, completeness and conformity
with generally accepted accounting prac-
tices and relevant accounting principles,
and report their conclusions,
• inform the Board of work that has been
performed in addition to auditing services,
remuneration for such services and other
circumstances of signifi cance in assessing
the independent status of the auditors.
Th e company’s independent auditor is Ernst &
Young AB, which was elected in 2005. Th e
Auditor-in-Chief is Erik Åström, Authorized
Public Accountant.
Th e task of the independent auditor is to
examine the administration of the Board and
the President and the company’s annual report
and accounting records. Ernst & Young
reports continuously to the Board and execu-
tive management and to the local company
managements. Ernst & Young is engaged only
for consulting services decided and approved
in advance by the Board.
Corporate governance objectivesConcordia Bus closely monitors international
developments in the corporate governance
area. Th e company strives to continuously
adapt its corporate governance guidelines and
instructions in accordance with leading inter-
national standards and practices and the Swed-
ish Code of Corporate Governance.
Values in the company
Th e fi ve fundamental values adopted by Con-
cordia Bus in 2005 express the ethics applied
in all parts of the Group’s operations, from
internal activities to relations with external
parties. Th ese also describe how operations are
to be conducted in an effi cient manner.
Th e values are reviewed annually through
an employee survey, internal evaluations of
operations and the planned employee perform-
ance review. In this manner, the executive
management can gain an idea of how fi rmly
established the values are among the employ-
ees. Deviations from violations of these values
are reported to the immediate superior.
For more information about the values, visit
www.concordiabus.com.
Internal control over fi nancial reporting 2007/2008Th is report has been prepared in accordance
with Section 3.7.2 of the Swedish Code of
Corporate Governance, which means that the
report covers only internal control over fi nan-
cial reporting.
Th e Board is not required to submit an
opinion on the eff ectiveness of internal control
Shareholders
Annual General Meeting
Executive Management
Company managements
Auditors Nomination Committee
BOARD OF DIRECTORSRemuneration Committee
Audit Committee
››
›
›
›
›
›
›
CORPORATE GOVERNANCE REPORT
A N N U A L R E P O R T 2 0 0 7 / 2 0 0 8 C O N C O R D I A B U S 2 3
and the report is not required to be examined
the company’s independent auditor.
Application
Concordia Bus shall steer its eff orts, in an effi -
cient manner, to produce reliable and accurate
fi nancial statements for external publication.
For Concordia Bus, reliable and accurate
fi nancial reporting mean that:
• the accounting policies are appropriate
and conform to International Financial
Reporting Standards (IFRS)
• reporting on the results of operations is
informative and provides an appropriate
level of detail
• the reporting correctly shows the under-
lying transactions and events, and with a
reasonable degree of certainty refl ects the
company’s actual results, fi nancial position
and cash fl ow.
Risk assessment
Th e primary risks arising in connection with
fi nancial reporting include fraud, loss or
embezzlement of assets, improper favoring of
a third party at the expense of the company
and other risks related to material misstate-
ments in the valuation of assets, liabilities, rev-
enue and expenses or deviations from the dis-
closure requirements.
Th e Group uses the same type of risk
assessment for all processes. Th is takes place in
three stages and is initiated by a management
review. Th e basis for assessment is a present sit-
uation analysis of the Group and the manage-
ment’s previous experience. Th e risks that are
deemed to have a material eff ect on fi nancial
reporting are classifi ed as high risks, and those
that are deemed to have an immaterial eff ect
are classifi ed as low risks.
At the second stage, the high risks in opera-
tions are assessed in connection with a mapping
of sub-processes. Experts from the processes
perform a detailed valuation of all risks in each
process. Th e working process is as follows:
1. Identify risks and assign them to the rel-
evant process stage:
• Describe the current preventive measures
• Evaluate their probability/impact/proba-
bility of detection
• Calculate risk values
2. For high risk values, propose improvement
measures
Th is means that the management’s assessment
of a risk many be given a lower value by the
operation in question, just as a risk that is not
assessed by the management can be given a
high value by the operation.
Th e fi nal stage of the process is to compile all
identifi ed risk values and present them at a
meeting of the executive management. Th e
management then decides on a prioritization of
highly valued risks and allocates resources to
manage these. Risks with low values are archived
on a risk list for reassessment at the latest in con-
nection with the following year’s risk assessment.
Risk assessment according to this method
was started in 2005 and supplemented in
2006. In the 2007 review, it was assessed
whether earlier years’ risks still apply in the
same order of priority.
Internal control
Th e risk assessment provides the opportunity
to take preventive action. High risks are prior-
itized and result in measures to reduce or elim-
inate them. Th e use of controls and control
points ensures that preventive measures are
taken in all Group companies.
Th e company has a number of controls for
approval and authorization of business trans-
actions. In operating activities these controls
are applied on a daily basis, and signifi cant
accounting policies are applied by all Group
companies in the preparation of fi nancial
accounts and reports. Established routines
steer review and analysis of fi nancial reporting
at all levels in the Group, which is important
in ensuring the accuracy of the reports.
Control is exercised through established
policies and instructions that are formulated
in group-wide process teams. Th ese teams also
decide on important control points for ensur-
ing the quality of fi nancial reporting.
Control environment
Th e company’s control is based on a group-
wide and process-oriented management system.
Th e purpose is to ensure a corporate culture
characterized by integrity and that the company
does not compromise on its ethical values.
Th e management system includes the
employees’ experience, skills, attitudes, ethical
values and perceptions about the division of
powers and responsibilities in the organization.
Th e management system illustrates how
the Group works in key areas. Th e control
environment is made up of each operation’s
main processes and related policies and
instructions at both the Group and local level.
Th e process owners propose preventive action,
development measures and improvements in
the process. Th e managements of the various
operations are responsible for implementing
and following up this work and addressing any
shortcomings.
Communication and information
Th e communication plan ensures that the
control points are communicated to the
intended target groups. Th e information in
each control point describes the company’s
actions in the control and how deviations are
reported and followed up. Th e process owner
is responsible for ensuring that information
about group-wide methods is provided to the
entire organization.
Th e line organization holds regular meetings
at the function or area level. New policies and
instructions are always presented at these meet-
ings as part of their implementation. Written
communication is distributed primarily via the
intranet, where information is updated immedi-
ately and the management system and group-
wide policies and instructions are presented.
Monitoring
Th e fi nancial risks that are deemed to be high
are monitored mainly within the respective
process. A control function is built into the
risk’s control point, allowing the operation
itself to ensure that the risk is being managed
as planned.
In addition, the company performs regular
internal audits to ensure that the control
points are working eff ectively. In 2007 Con-
cordia Bus carried out two group-wide in-
ternal audits and some 20 company-specifi c
internal audits using employees specially
trained for this task. Th e purpose of these
internal audits is to establish a stable control
environment in the company and to ensure
that application and monitoring are carried
out in key areas of operations. Th e company’s
principle is that every process should have
control functions that support follow-up
activities. In this respect, the internal audit
serves as a complementary instrument for
ensuring that operations are conducted in
accordance with formal decisions.
Th e results of the internal audits are
reported to both the Board and the executive
management.
Changes in operations that may infl uence
internal control are assessed annually and
reported to the Board.
CORPORATE GOVERNANCE REPORT
24 C O N C O R D I A B U S A N N U A L R E P O R T 2 0 0 7 / 2 0 0 8
Jan Sjöqvist
Born in 1948 Board Chairman. Chairman of ODEN Anläggningsentreprenad. Board member of Stora Enso, Green Cargo and Aspen. Former President and CEO of NCC. M.B.A.
Jan Sundling
Born in 1947President of Green Cargo 2001–07. Currently active as Chairman of the Association of Swedish Train Operators, the Swedish Maritime Administra-tion and TAF/TSI Deployment Board. Board mem-ber of Amapola Flyg, Salenia Air Cargo, COOP Sverige, Concordia Bus, Corem Property Group and Cargonet.
Rolf Lydahl
Born in 1945Chairman of Jernhusen, IndeCap and SwedCarrier. Board member of AP fastigheter, TradeDoubler and Steneken. Former President of Probo, Execu-tive Vice President of Nordstiernan and responsi-ble for Credit Suisses’s representation office in Stockholm. M.B.A. (Stockholm School of Economics)
Gina Germano
Born in 1966American citizen. Senior portfolio manager at Bluebay Asset Manage-ment since 2002. Former portfolio manager at Lazard Asset Management and analyst at Morgan Stanley. Master’s degree from Lund University, degrees from Boston University and Northwestern University.
Advisor the Board of DirectorsJörgen Andersson
Born in 1946Former cabinet member. Chairman of Nordiske Etanproduktion, Safe Return and Connect Syd. Board member of Eco-Heating.
BOARD OF DIRECTORS
The Board of Concordia Bus consists of four members, of whom the Chairman and two other members have an independent status in relation to the shareholders. One member represents the largest shareholder, Bluebay Asset Management.
Jan Sjöqvist Jan Sundling Rolf Lydahl Gina Germano
A N N U A L R E P O R T 2 0 0 7 / 2 0 0 8 C O N C O R D I A B U S 2 5
Ragnar Norbäck
Born in 1955 CEO of Concordia Bus ABEmployed since 2004Previously employed by Sandvik, Adidas, TNT, Linjebuss, Volvo and American Express. M.Sc.Eng.
Per Skärgård
Born in 1957CFO of Concordia Bus ABEmployed since 2004Previously employed by Warner Lambert, Netnet, Danzas-ASG and DHL. B.Sc.Econ.
Jan Bosaeus
Born in 1960MD of Swebus ABEmployed since 2002Previously employed by SMA Maskin AB, Engson Maskin AB and Kalmar LMV Sverige AB. Marketing economist
Joakim Palmkvist
Born in 1964MD of Swebus Express ABEmployed since 2006Previously employed by OnOff, ElGiganten, Ticket resebyrå and Synoptik.Marketing economist
Tom Ward
Born in 1956MD of Concordia Bus Finland Oy Employed since 2004Previously employed by Huolintakeskus Oy, Scansped Oy, MPS Management Consulting and Oy Scan-Auto. Business economist
Geir Ledsten
Born in 1962MD of Concordia Bus Norge ASEmployed since 2007Previously employed by C.Tybring-Gjedde AS, Narvesen AS, Coop Norge AS, AS Kellox/Loxkel AS and Oslo Taxi BA, among others.Economist
Michael Karlsson
Born in 1956 MD of Concordia Bus Fleet ABEmployed since 2006Previously employed by SEB Finans, NCM Kreditförsäkring, GE Capital Equipment Finance and Key Equipment Finance. M.B.A.
Sjur Brenden Born in 1961Marketing and Purchasing Director, Concordia Bus ABEmployed since 2001Previously employed by Linjebuss Sverige AB, AS Sporveisbussene and Concordia Bus Norge AS.M.B.A.
EXECUTIVE MANAGEMENT
The Executive Management of Concordia Bus consists of the CEO, CFO, the President of Concordia Bus Fleet and the presidents of each subsidiary.
Ragnar Norbäck Per Skärgård Jan Bosaeus Joakim Palmkvist
Tom Ward Geir Ledsten Michael Karlsson Sjur Brenden
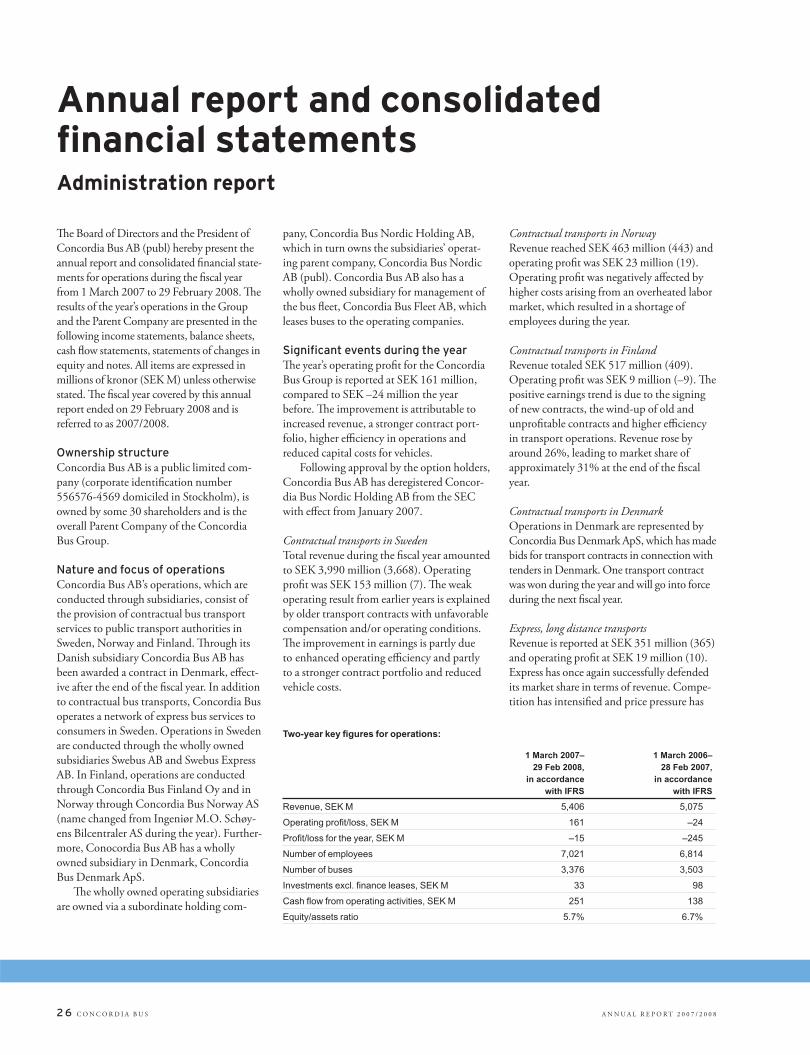
2 6 C O N C O R D I A B U S A N N U A L R E P O R T 2 0 0 7 / 2 0 0 8
Th e Board of Directors and the President of
Concordia Bus AB (publ) hereby present the
annual report and consolidated fi nancial state-
ments for operations during the fi scal year
from 1 March 2007 to 29 February 2008. Th e
results of the year’s operations in the Group
and the Parent Company are presented in the
following income statements, balance sheets,
cash fl ow statements, statements of changes in
equity and notes. All items are expressed in
millions of kronor (SEK M) unless otherwise
stated. Th e fi scal year covered by this annual
report ended on 29 February 2008 and is
referred to as 2007/2008.
Ownership structureConcordia Bus AB is a public limited com-
pany (corporate identifi cation number
556576-4569 domiciled in Stockholm), is
owned by some 30 shareholders and is the
overall Parent Company of the Concordia
Bus Group.
Nature and focus of operationsConcordia Bus AB’s operations, which are
conducted through subsidiaries, consist of
the provision of contractual bus transport
services to public transport authorities in
Sweden, Norway and Finland. Th rough its
Danish subsidiary Concordia Bus AB has
been awarded a contract in Denmark, eff ect-
ive after the end of the fi scal year. In addition
to contractual bus transports, Concordia Bus
operates a network of express bus services to
consumers in Sweden. Operations in Sweden
are conducted through the wholly owned
subsidiaries Swebus AB and Swebus Express
AB. In Finland, operations are conducted
through Concordia Bus Finland Oy and in
Norway through Concordia Bus Norway AS
(name changed from Ingeniør M.O. Schøy-
ens Bilcentraler AS during the year). Further-
more, Conocordia Bus AB has a wholly
owned subsidiary in Denmark, Concordia
Bus Denmark ApS.
Th e wholly owned operating subsidiaries
are owned via a subordinate holding com-
pany, Concordia Bus Nordic Holding AB,
which in turn owns the subsidiaries’ operat-
ing parent company, Concordia Bus Nordic
AB (publ). Concordia Bus AB also has a
wholly owned subsidiary for management of
the bus fl eet, Concordia Bus Fleet AB, which
leases buses to the operating companies.
Signifi cant events during the yearTh e year’s operating profi t for the Concordia
Bus Group is reported at SEK 161 million,
compared to SEK –24 million the year
before. Th e improvement is attributable to
increased revenue, a stronger contract port-
folio, higher effi ciency in operations and
reduced capital costs for vehicles.
Following approval by the option holders,
Concordia Bus AB has deregistered Concor-
dia Bus Nordic Holding AB from the SEC
with eff ect from January 2007.
Contractual transports in Sweden
Total revenue during the fi scal year amounted
to SEK 3,990 million (3,668). Operating
profi t was SEK 153 million (7). Th e weak
operating result from earlier years is explained
by older transport contracts with unfavorable
compensation and/or operating conditions.
Th e improvement in earnings is partly due
to enhanced operating effi ciency and partly
to a stronger contract portfolio and reduced
vehicle costs.
Contractual transports in Norway
Revenue reached SEK 463 million (443) and
operating profi t was SEK 23 million (19).
Operating profi t was negatively aff ected by
higher costs arising from an overheated labor
market, which resulted in a shortage of
employees during the year.
Contractual transports in Finland
Revenue totaled SEK 517 million (409).
Operating profi t was SEK 9 million (–9). Th e
positive earnings trend is due to the signing
of new contracts, the wind-up of old and
unprofi table contracts and higher effi ciency
in transport operations. Revenue rose by
around 26%, leading to market share of
approximately 31% at the end of the fi scal
year.
Contractual transports in Denmark
Operations in Denmark are represented by
Concordia Bus Denmark ApS, which has made
bids for transport contracts in connection with
tenders in Denmark. One transport contract
was won during the year and will go into force
during the next fi scal year.
Express, long distance transports
Revenue is reported at SEK 351 million (365)
and operating profi t at SEK 19 million (10).
Express has once again successfully defended
its market share in terms of revenue. Compe-
tition has intensifi ed and price pressure has
Annual report and consolidated fi nancial statementsAdministration report
1 March 2007– 1 March 2006– 29 Feb 2008, 28 Feb 2007, in accordance in accordance with IFRS with IFRS
Revenue, SEK M 5,406 5,075
Operating profi t/loss, SEK M 161 –24
Profi t/loss for the year, SEK M –15 –245
Number of employees 7,021 6,814
Number of buses 3,376 3,503
Investments excl. fi nance leases, SEK M 33 98
Cash fl ow from operating activities, SEK M 251 138
Equity/assets ratio 5.7% 6.7%
Two-year key fi gures for operations:

A N N U A L R E P O R T 2 0 0 7 / 2 0 0 8 C O N C O R D I A B U S 2 7
continued. Th ese operations were changed
during the year through modifi cation of the
product off ering and new methods for pro-
duction management, which led to an
improvement in earnings compared to the
previous year. Th e company’s priorities for
the coming period consist mainly of more
ambitious marketing and additional meas-
ures to boost earnings.
Fleet Management and central functions
Th e Group’s bus fl eet is controlled and man-
aged by the two companies Concordia Bus
Fleet AB and Swebus Busco AB. Th e buses
are made available to the Group’s operating
bus companies through lease contracts. Con-
cordia Bus Fleet is responsible for tender and
fi nancing of the Group’s buses. In the past
year a total of 133 buses (377) were acquired
for a total of SEK 306 million (931) and were
fi nanced through fi nance leases.
Aside from management functions, the
head offi ce contains service function such as
IT, legal aff airs and purchasing, which are
debited to the various Group companies
based on market prices. Th e cost of non-
debited management functions and other
items amounted to SEK 43 million (59).
Divested operations
Via the sub-group Concordia Bus Nordic
AB, Concordia Bus AB sold all of the shares
in Interbus AB to Strömma Turism & Sjöfart
AB during the preceding fi scal year. Th is sale
has aff ected the comparative prior year infor-
mation in that Interbus is included in the
year-earlier fi gures with revenue of SEK 141
million and an operating profi t of SEK 8 mil-
lion.
MarketTh e Concordia Bus Group is active in public
bus transports, most of which consists of
publicly tendered transport services that are
operated by subsidiaries in the diff erent
countries. In addition, a separate subsidiary
operates express bus transports in open com-
petition mainly within Sweden.
Th e market for tendered public transport
services was previously highly exposed to
price dumping in bids and fl awed indexing
systems for revenue calculation. However, the
conditions for profi tability are gradually
improving thanks to the combined eff ects of
a smaller number of operators with more
commercial goals and progressively better
and more effi cient tendering processes.
All operations require permits for opera-
tion of passenger transports. All subsidiaries
hold the necessary permits.
Financing, liquidity and cash fl owIn January 2007 an earlier mezzanine loan
was repaid following the issue of new shares
for a total of SEK 510 million. A redeemable
preference share granting entitlement to a
guaranteed annual dividend of 16.5% was
issued with pre-emptive rights for the existing
shareholders. Th e company issued fi ve mil-
lion shares of the new type at a subscription
price of SEK 102 each.
Th e Group’s fi nancial expenses decreased
by SEK 24 million (244) compared to the
previous year, mainly due to the repayment
of a mezzanine loan for EUR 45 million.
Th e Group recorded foreign exchange
losses of SEK 8 million for the past fi scal year,
compared to exchange gains of SEK 39 mil-
lion the year before.
Investments and depreciationTh e Group’s investments during the year con-
sisted primarily of bus acquisitions, which
were fi nanced through leases. Cash-fi nanced
investments amounted to SEK 33 million
(98). Via its subsidiary Concordia Bus Fleet
AB, the Group has entered into fi nance lease
contracts with a historical cost of SEK 306
million (931) and these have been classifi ed
as fi xed assets in the balance sheet. Th e lease
commitment has been reported as a liability
in the balance sheet. Depreciation and inter-
est expenses are recognized in the income
statement.
During the year, the Group sold buses for
a value of SEK 58 million (90), correspond-
ing to 260 buses (374). Th e sale resulted in a
capital gain of SEK 0 million (–16).
EmployeesTh e average number of employees in the
Group during the period was 7,021 (6,814).
In all countries where Concordia Bus AB has
operations, collective agreements are applied
in accordance with the trade union that rep-
resents employees in the industry where each
company is active. Th ere are well established
practices and traditions for the way in which
working hours, compensatory terms, infor-
mation and cooperation are negotiated and
applied between employee representatives
and the company.
Th e Concordia Bus Group uses programs
focusing on values and employee relations in
order to boost the employees’ motivation at
work and ultimately improve the quality of
services to the customers.
Cooperation with external stakeholdersTh e Concordia Bus Group’s subsidiaries are
dependent on certain suppliers, primarily in
the vehicle and energy sectors, to conduct
their operations. Purchasing agreements are
signed mainly at the Group level, and the
individual subsidiaries enter into agreements
with specifi c manufacturers only for the sup-
ply of diesel. Th is is done partly because no
functioning retail trade for fuels exists, and
partly because the subsidiaries are extremely
dependent on regular fuel deliveries in order
to conduct transports in a reliable manner.
Environmental impact of operationsNew buses are normally equipped with envir-
onmentally upgraded engines and add-on
equipment for exhaust emission control, and
are therefore compliant with future emissions
standards well before these go into eff ect. In
its permanent facilities, the Group invests in
environmental enhancements such as new
and improved cleaning facilities in the bus
washes. Goal-oriented eff orts are also made
to minimize total emissions through reduced
fuel consumption and a transition to new
and better fuel products.
Th e Group conducts operations subject
to reporting requirements under the Swedish
Environmental Code such as bus washing
ADMINISTRATION REPORT

2 8 C O N C O R D I A B U S A N N U A L R E P O R T 2 0 0 7 / 2 0 0 8
and storage of engine fuels, gas, waste oil and
lead batteries. Th e environmental impact of
these operations consists mainly of water
emissions from the bus washes.
In connection with the takeover and
transfer of operations, the facilities in ques-
tion undergo environmental inspection to
determine the company’s environmental lia-
bility and impact. Th ese operating companies
carry out minor decontamination actions as
needed. So far, no signifi cant decontamina-
tion liability has been found with respect to
the Group’s own operations.
Disputes During the year, the subsidiary Swebus AB
appealed tenders in Jönköping, on Gotland
and in Stockholm. After the end of the fi scal
year, there was a remaining tender dispute
with SL (Storstockholms Lokaltrafi k) regard-
ing quality evaluation in connection with
tendering of the Märsta and Ekerö traffi c
areas in Stockholm. After the end of the fi scal
year, the Supreme Court denied Swebus a
review permit, whereby the dispute was con-
cluded and Swebus defi nit ively lost the con-
tract. Th e Group is not involved in any other
signifi cant disputes.
Trading of the company’s sharesConcordia Bus AB has an agreement with
Carnegie regarding trading of the company’s
shares. Under the agreement, Carnegie medi-
ates buying and selling of the shares in return
for customary brokerage commissions. How-
ever, the share is not listed on any exchange
or other public trading venue.
Risk managementTh e Group is primarily exposed to interest
rate risk as a consequence of the company’s
fi nance and operating leases and the compa-
ny’s loans. Among other things, the lease
charges and loans are based on variable mar-
ket interest rates.
Th e Concordia Bus Group is exposed to
exchange rate fl uctuations on its bond loan,
which is denominated in EUR. Th e Group’s
fi nance policy states that all foreign exchange
exposure on interest payments during the
coming 12-month period must be at least
50% hedged. Th is foreign exchange expos-
ure, excluding currency hedging, represents
a potential foreign exchange loss of more
than SEK 3 million in the event of a 10%
depreciation of SEK. Th e Concordia Bus
Group is also exposed to a potential foreign
exchange loss on the total value of the bond
loan, which in such case will be unrealized
until the bond loan matures. Negotiations
have been initiated regarding the necessary
credit limits to enter into derivative contracts
for currency hedging.
Th e Group is also exposed to exchange
rate fl uctuations through its purchasing of
diesel, which is traded on the international
commodities marketing US dollars. Th rough
revenue indexation clauses in its contracts
with public transport authorities, the Group
receives partial compensation for changes in
the diesel price. According to internal calcu-
lations, this index compensation reduces
exposure to diesel price movements by 57%.
Concordia Bus has used diesel derivatives dur-
ing the fi scal year to cover diesel price risk in
excess of indexation in the transport contracts.
Based on the budgeted diesel consump-
tion and estimated index compensation, an
increase in the diesel price by USD 1 per
tonne would raise the net diesel cost by SEK
0.2 million for the following fi scal year.
Signifi cant events after the end of the fi scal yearNo signifi cant events have occurred since the
end of the fi scal year.
Anticipated future developmentConcordia Bus AB’s fi nancial development in
the past year was stronger than anticipated,
for which reason the company has revised its
fi nancial forecast assumptions. Th ese take
into account the current fi nancial trend,
which indicates additional favorable oppor-
tunities for improved earnings growth. A
profi t increase of 5–10% annually is awaited
for the 2008–2010 fi scal years. In the follow-
ing two years, the margin is expected to
improve by 1–2 percentage points annually.
As a result, the profi t margin can lie between
3% and 5% before interest expenses on the
current bond loan.
Concordia Bus AB will continue to strive
for an improved capital structure.
IFRS and the company’s accounting standardsTh e consolidated fi nancial statements have
been prepared in accordance with the Inter-
national Financial Reporting Standards
(IFRS) issued by the International Account-
ing Standards Board (IASB). Th e Parent
Company applies the same accounting stan-
dards as the Group, except for in those cases
described under the heading “Accounting
policies of the Parent Company”. Any devia-
tions that that exist are a result of the Swedish
Annual Accounts Act’s limitations on the
scope for IFRS conformity in the Parent
Company and in certain cases also tax con-
siderations. Th e company’s accounting poli-
cies are presented in Note 1.
Parent Company
Th e Parent Company reported a pretax profi t
of SEK 14 million (–62). Th e Parent com-
pany had nine employees during the year.
Allocation of profi ts
Funds available for allocation by the Annual General Meeting (SEK)
Share premium reserve 492,239,445
Accumulated defi cit –128,759,629
Profi t for the year 20,288,936
Total 383,768,752
The Board of Directors proposes that the company’s profi ts be allocated as follows:
To be paid to the shareholders as a dividend of SEK 17.88 per preference share 89,400,000
To be carried forward to new account 294,368,752
Total 383,768,752
For more information about the results and
fi nancial position of the Group and the Par-
ent Company, see the following income state-
ments, balance sheets and notes.
ADMINISTRATION REPORT

A N N U A L R E P O R T 2 0 0 7 / 2 0 0 8 C O N C O R D I A B U S 2 9
1 March 2007– 1 March 2006–SEK M Note 29 Feb 2008 28 Feb 2007
Net revenue 1, 2, 3 5,320 4,986
Other operating income 86 89
TOTAL REVENUE 5,406 5,075
OPERATING EXPENSES
Fuel, tires and other consumables 4 –1,162 –1,110
Other external expenses 4, 5, 6 –1,118 –1,125
Personnel expenses 4, 7 –2,701 –2,548
Capital loss/gain on the sale of fi xed assets 0 –16
Depreciation/amortization and impairment losses 8 –264 –300
OPERATING PROFIT/LOSS 1, 2 161 –24
PROFIT/LOSS FROM FINANCIAL INVESTMENTS
Profi t/loss from shares in group companies 29 – –13
Interest income and similar profi t/loss items 9 15 7
Interest expense and similar profi t/loss items 10 –192 –216
PROFIT/LOSS AFTER FINANCIAL ITEMS –16 –246
Income tax expense 11 1 1
PROFIT/LOSS FOR THE YEAR –15 –245
Of which, attributable to equity holders of the Parent Company –15 –245
Earnings per share before dilution (SEK) 22 –5 –13
Earnings per share after dilution (SEK) 22 –5 –13
Average number of common shares before dilution 22 20,000, 20,000
Average number of common shares after dilution 22 20,000 20,000
Consolidated income statement
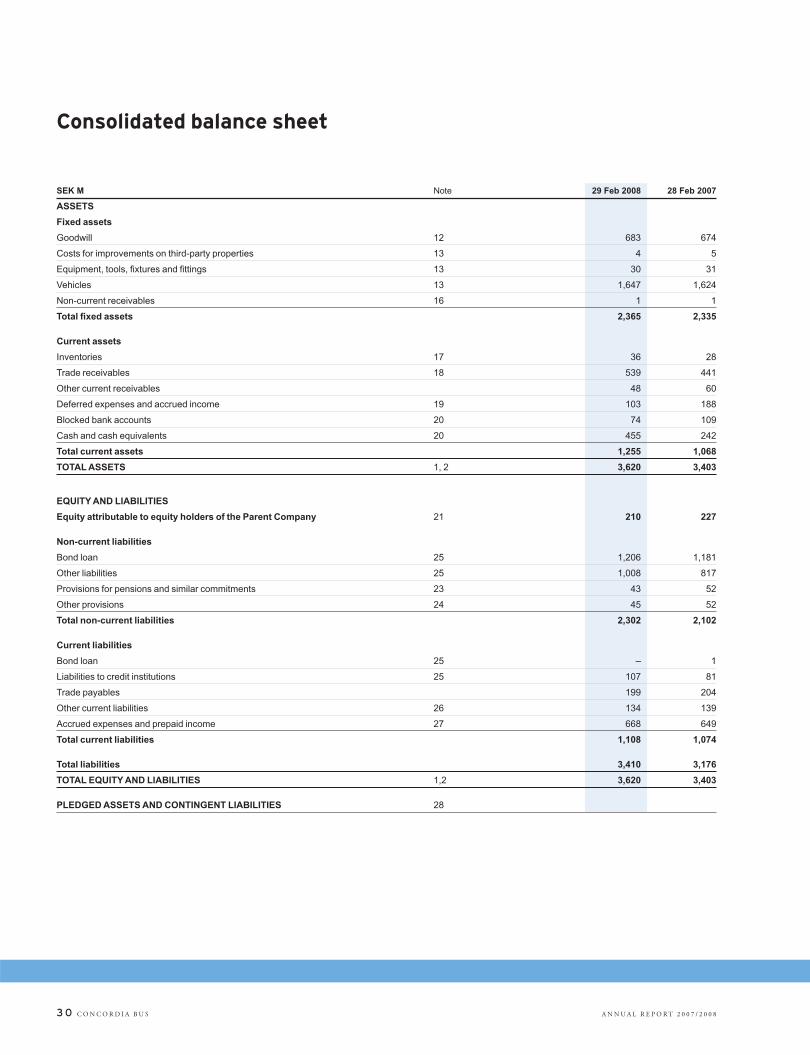
3 0 C O N C O R D I A B U S A N N U A L R E P O R T 2 0 0 7 / 2 0 0 8
Consolidated balance sheet
SEK M Note 29 Feb 2008 28 Feb 2007
ASSETS
Fixed assets
Goodwill 12 683 674
Costs for improvements on third-party properties 13 4 5
Equipment, tools, fi xtures and fi ttings 13 30 31
Vehicles 13 1,647 1,624
Non-current receivables 16 1 1
Total fi xed assets 2,365 2,335
Current assets
Inventories 17 36 28
Trade receivables 18 539 441
Other current receivables 48 60
Deferred expenses and accrued income 19 103 188
Blocked bank accounts 20 74 109
Cash and cash equivalents 20 455 242
Total current assets 1,255 1,068
TOTAL ASSETS 1, 2 3,620 3,403
EQUITY AND LIABILITIES
Equity attributable to equity holders of the Parent Company 21 210 227
Non-current liabilities
Bond loan 25 1,206 1,181
Other liabilities 25 1,008 817
Provisions for pensions and similar commitments 23 43 52
Other provisions 24 45 52
Total non-current liabilities 2,302 2,102
Current liabilities
Bond loan 25 – 1
Liabilities to credit institutions 25 107 81
Trade payables 199 204
Other current liabilities 26 134 139
Accrued expenses and prepaid income 27 668 649
Total current liabilities 1,108 1,074
Total liabilities 3,410 3,176
TOTAL EQUITY AND LIABILITIES 1,2 3,620 3,403
PLEDGED ASSETS AND CONTINGENT LIABILITIES 28
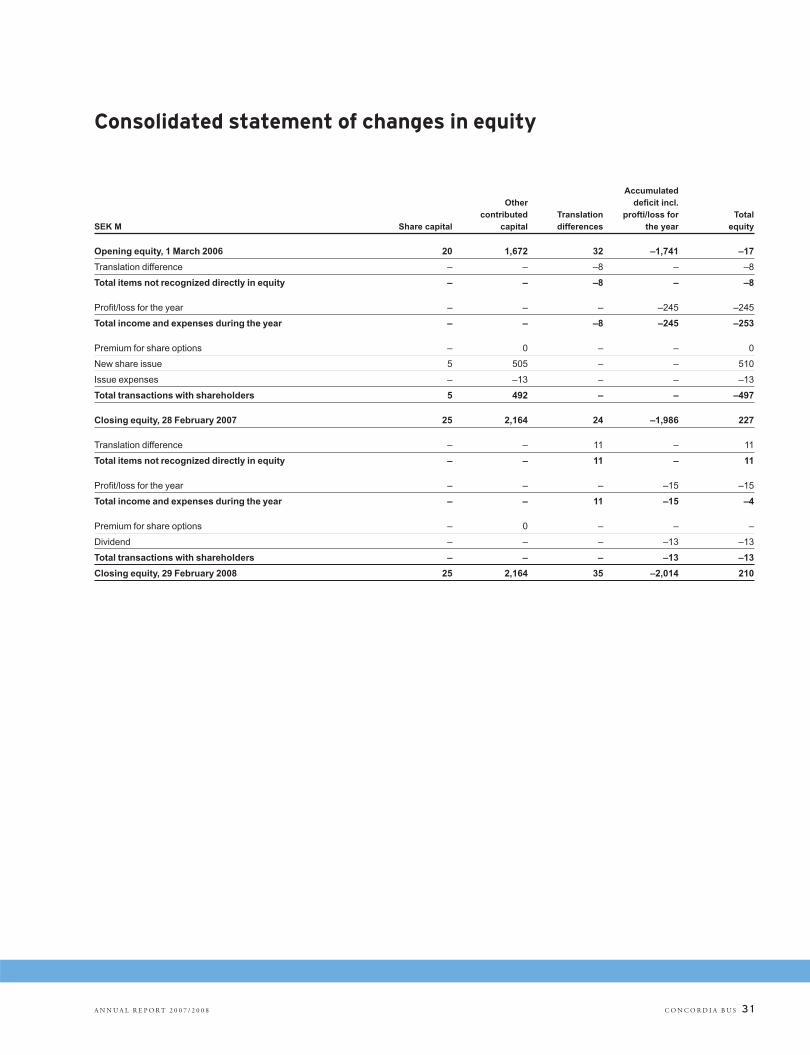
A N N U A L R E P O R T 2 0 0 7 / 2 0 0 8 C O N C O R D I A B U S 3 1
Consolidated statement of changes in equity
Accumulated Other defi cit incl. contributed Translation profti/loss for TotalSEK M Share capital capital differences the year equity
Opening equity, 1 March 2006 20 1,672 32 –1,741 –17
Translation difference – – –8 – –8
Total items not recognized directly in equity – – –8 – –8
Profi t/loss for the year – – – –245 –245
Total income and expenses during the year – – –8 –245 –253
Premium for share options – 0 – – 0
New share issue 5 505 – – 510
Issue expenses – –13 – – –13
Total transactions with shareholders 5 492 – – –497
Closing equity, 28 February 2007 25 2,164 24 –1,986 227
Translation difference – – 11 – 11
Total items not recognized directly in equity – – 11 – 11
Profi t/loss for the year – – – –15 –15
Total income and expenses during the year – – 11 –15 –4
Premium for share options – 0 – – –
Dividend – – – –13 –13
Total transactions with shareholders – – – –13 –13
Closing equity, 29 February 2008 25 2,164 35 –2,014 210
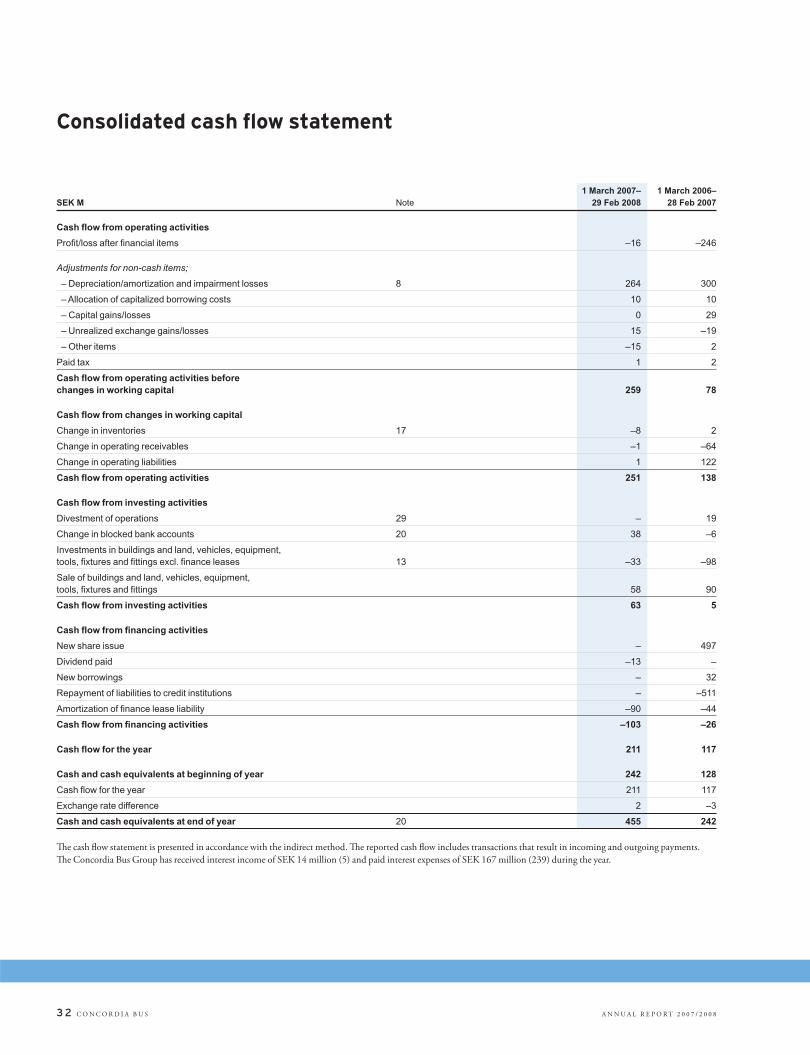
3 2 C O N C O R D I A B U S A N N U A L R E P O R T 2 0 0 7 / 2 0 0 8
1 March 2007– 1 March 2006–SEK M Note 29 Feb 2008 28 Feb 2007
Cash fl ow from operating activities
Profi t/loss after fi nancial items –16 –246
Adjustments for non-cash items;
– Depreciation/amortization and impairment losses 8 264 300
– Allocation of capitalized borrowing costs 10 10
– Capital gains/losses 0 29
– Unrealized exchange gains/losses 15 –19
– Other items –15 2
Paid tax 1 2
Cash fl ow from operating activities before changes in working capital 259 78
Cash fl ow from changes in working capital
Change in inventories 17 –8 2
Change in operating receivables –1 –64
Change in operating liabilities 1 122
Cash fl ow from operating activities 251 138
Cash fl ow from investing activities
Divestment of operations 29 – 19
Change in blocked bank accounts 20 38 –6
Investments in buildings and land, vehicles, equipment, tools, fi xtures and fi ttings excl. fi nance leases 13 –33 –98
Sale of buildings and land, vehicles, equipment, tools, fi xtures and fi ttings 58 90
Cash fl ow from investing activities 63 5
Cash fl ow from fi nancing activities
New share issue – 497
Dividend paid –13 –
New borrowings – 32
Repayment of liabilities to credit institutions – –511
Amortization of fi nance lease liability –90 –44
Cash fl ow from fi nancing activities –103 –26
Cash fl ow for the year 211 117
Cash and cash equivalents at beginning of year 242 128
Cash fl ow for the year 211 117
Exchange rate difference 2 –3
Cash and cash equivalents at end of year 20 455 242
Th e cash fl ow statement is presented in accordance with the indirect method. Th e reported cash fl ow includes transactions that result in incoming and outgoing payments.
Th e Concordia Bus Group has received interest income of SEK 14 million (5) and paid interest expenses of SEK 167 million (239) during the year.
Consolidated cash fl ow statement
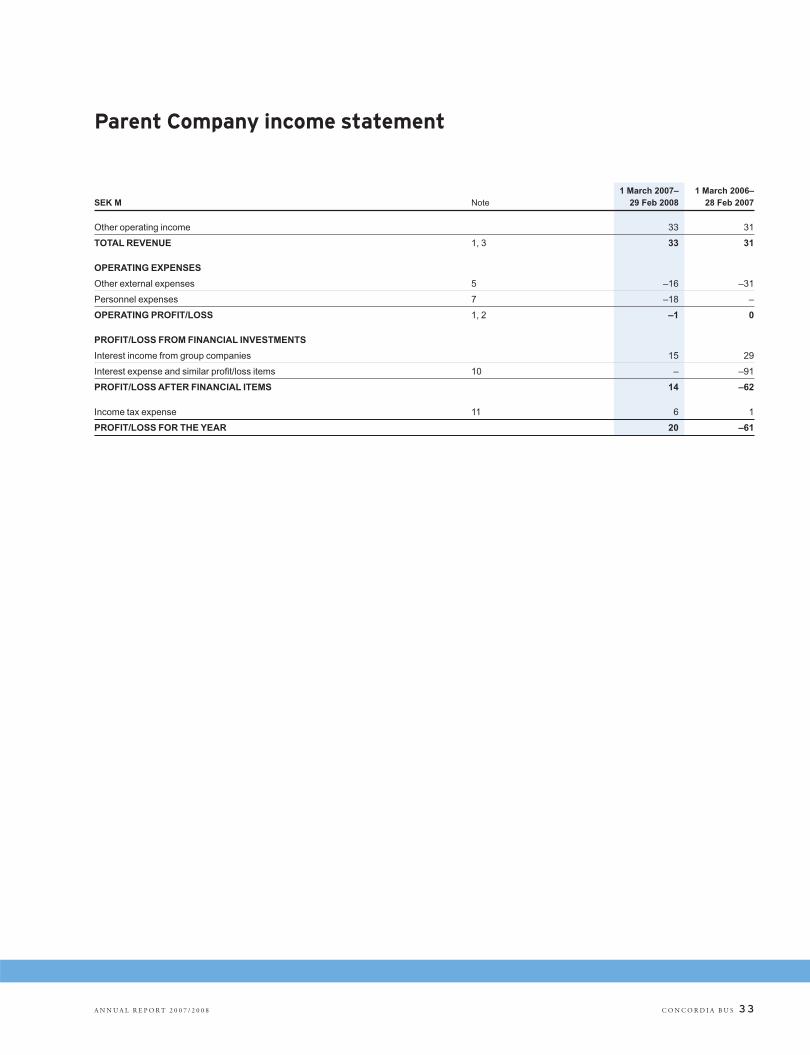
A N N U A L R E P O R T 2 0 0 7 / 2 0 0 8 C O N C O R D I A B U S 3 3
1 March 2007– 1 March 2006–SEK M Note 29 Feb 2008 28 Feb 2007
Other operating income 33 31
TOTAL REVENUE 1, 3 33 31
OPERATING EXPENSES
Other external expenses 5 –16 –31
Personnel expenses 7 –18 –
OPERATING PROFIT/LOSS 1, 2 –1 0
PROFIT/LOSS FROM FINANCIAL INVESTMENTS
Interest income from group companies 15 29
Interest expense and similar profi t/loss items 10 – –91
PROFIT/LOSS AFTER FINANCIAL ITEMS 14 –62
Income tax expense 11 6 1
PROFIT/LOSS FOR THE YEAR 20 –61
Parent Company income statement
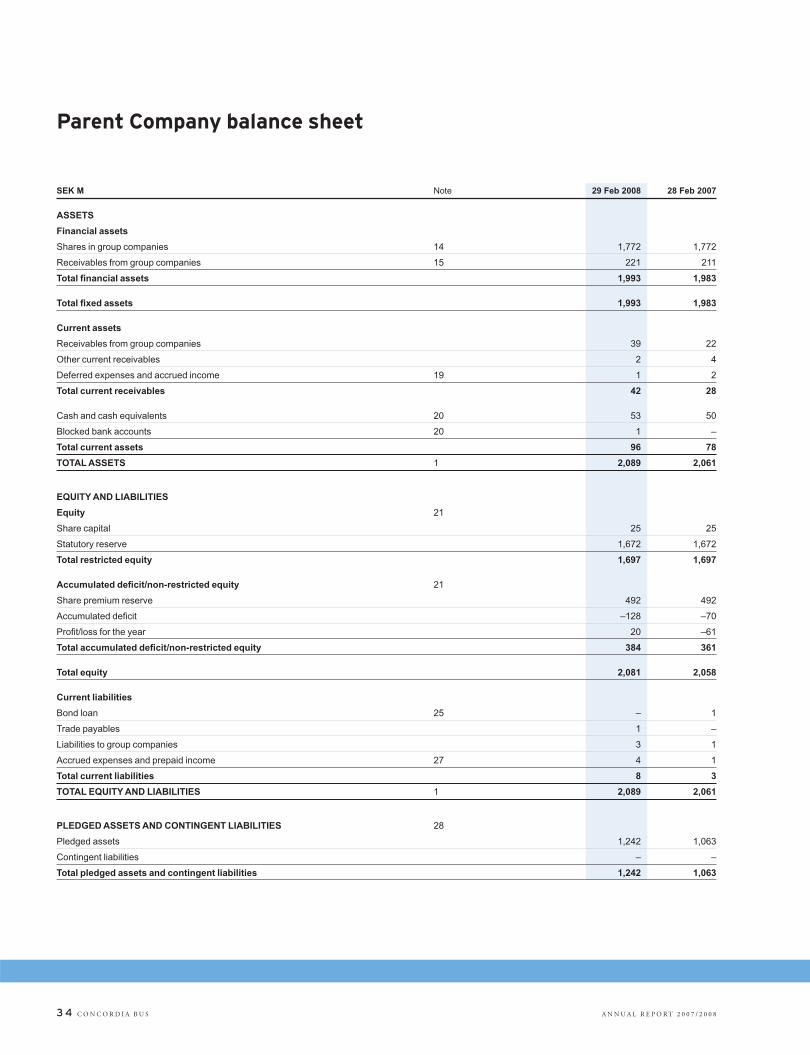
3 4 C O N C O R D I A B U S A N N U A L R E P O R T 2 0 0 7 / 2 0 0 8
Parent Company balance sheet
SEK M Note 29 Feb 2008 28 Feb 2007
ASSETS
Financial assets
Shares in group companies 14 1,772 1,772
Receivables from group companies 15 221 211
Total fi nancial assets 1,993 1,983
Total fi xed assets 1,993 1,983
Current assets
Receivables from group companies 39 22
Other current receivables 2 4
Deferred expenses and accrued income 19 1 2
Total current receivables 42 28
Cash and cash equivalents 20 53 50
Blocked bank accounts 20 1 –
Total current assets 96 78
TOTAL ASSETS 1 2,089 2,061
EQUITY AND LIABILITIES
Equity 21
Share capital 25 25
Statutory reserve 1,672 1,672
Total restricted equity 1,697 1,697
Accumulated defi cit/non-restricted equity 21
Share premium reserve 492 492
Accumulated defi cit –128 –70
Profi t/loss for the year 20 –61
Total accumulated defi cit/non-restricted equity 384 361
Total equity 2,081 2,058
Current liabilities
Bond loan 25 – 1
Trade payables 1 –
Liabilities to group companies 3 1
Accrued expenses and prepaid income 27 4 1
Total current liabilities 8 3
TOTAL EQUITY AND LIABILITIES 1 2,089 2,061
PLEDGED ASSETS AND CONTINGENT LIABILITIES 28
Pledged assets 1,242 1,063
Contingent liabilities – –
Total pledged assets and contingent liabilities 1,242 1,063
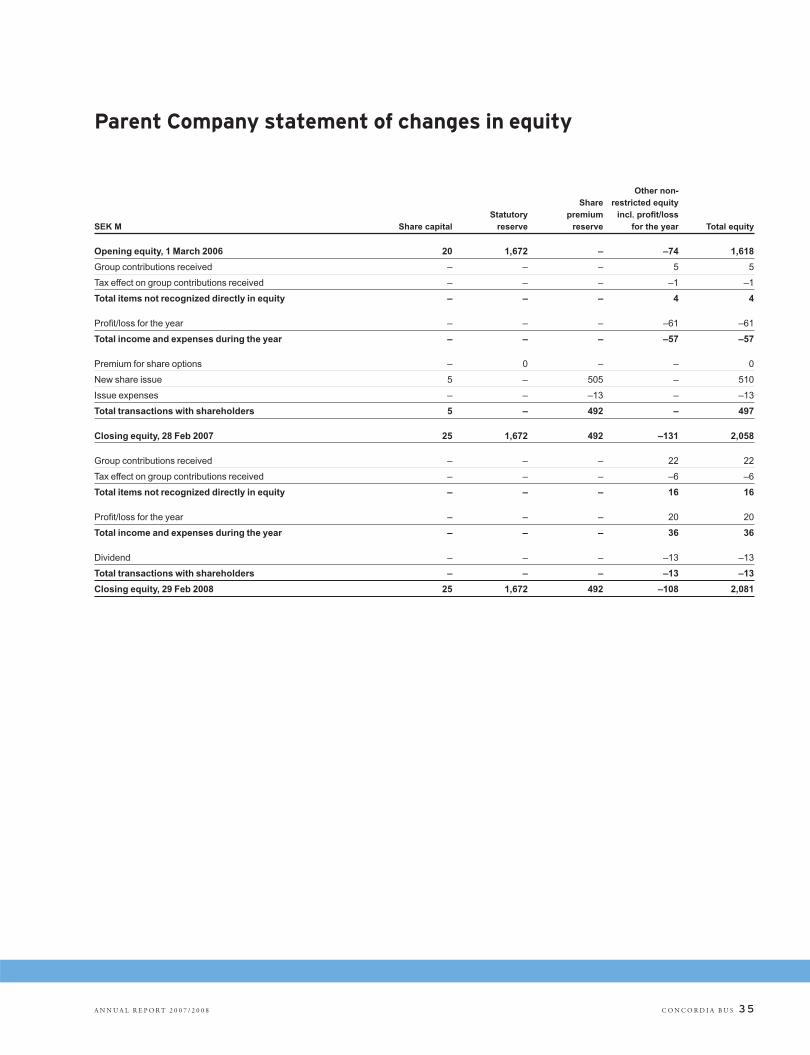
A N N U A L R E P O R T 2 0 0 7 / 2 0 0 8 C O N C O R D I A B U S 3 5
Parent Company statement of changes in equity
Other non- Share restricted equity Statutory premium incl. profi t/loss SEK M Share capital reserve reserve for the year Total equity
Opening equity, 1 March 2006 20 1,672 – –74 1,618
Group contributions received – – – 5 5
Tax effect on group contributions received – – – –1 –1
Total items not recognized directly in equity – – – 4 4
Profi t/loss for the year – – – –61 –61
Total income and expenses during the year – – – –57 –57
Premium for share options – 0 – – 0
New share issue 5 – 505 – 510
Issue expenses – – –13 – –13
Total transactions with shareholders 5 – 492 – 497
Closing equity, 28 Feb 2007 25 1,672 492 –131 2,058
Group contributions received – – – 22 22
Tax effect on group contributions received – – – –6 –6
Total items not recognized directly in equity – – – 16 16
Profi t/loss for the year – – – 20 20
Total income and expenses during the year – – – 36 36
Dividend – – – –13 –13
Total transactions with shareholders – – – –13 –13
Closing equity, 29 Feb 2008 25 1,672 492 –108 2,081

3 6 C O N C O R D I A B U S A N N U A L R E P O R T 2 0 0 7 / 2 0 0 8
Parent Company cash fl ow statement
1 March 2007– 1 March 2006– SEK M Note 29 Feb 2008 28 Feb 2007
Cash fl ow from operating activities
Profi t/loss after fi nancial items 14 –62
Adjustments for non-cash items;
– Change in interest receivable –11 13
– Change in interest payable 25 0 33
Cash fl ow from operating activities before changes in working capital 3 –16
Cash fl ow from changes in working capital
Change in inventories 17 – –
Change in operating receivables –14 31
Change in operating liabilities 6 –7
Cash fl ow from operating activities –5 8
Cash fl ow from investing activities
Change in blocked bank accounts –1 –
Cash fl ow from investing activities –1 –
Cash fl ow from fi nancing activities 22
Dividend paid –13 –
Group contributions received 22 –
New share issue – 497
New borrowings – 32
Repayment of liabilities to credit institutions – –511
Cash fl ow from fi nancing activities 9 18
Cash fl ow for the year 3 26
Cash and cash equivalents at beginning of year 50 24
Cash fl ow for the year 3 26
Cash and cash equivalents at end of year 20 53 50
Th e cash fl ow statement is presented in accordance with the indirect method. Th e reported cash fl ow includes transactions that result in incoming and outgoing payments.
Th e Parent Company has paid interest expenses of SEK 0 million (110). Th e Parent Company has not paid any tax during the year.
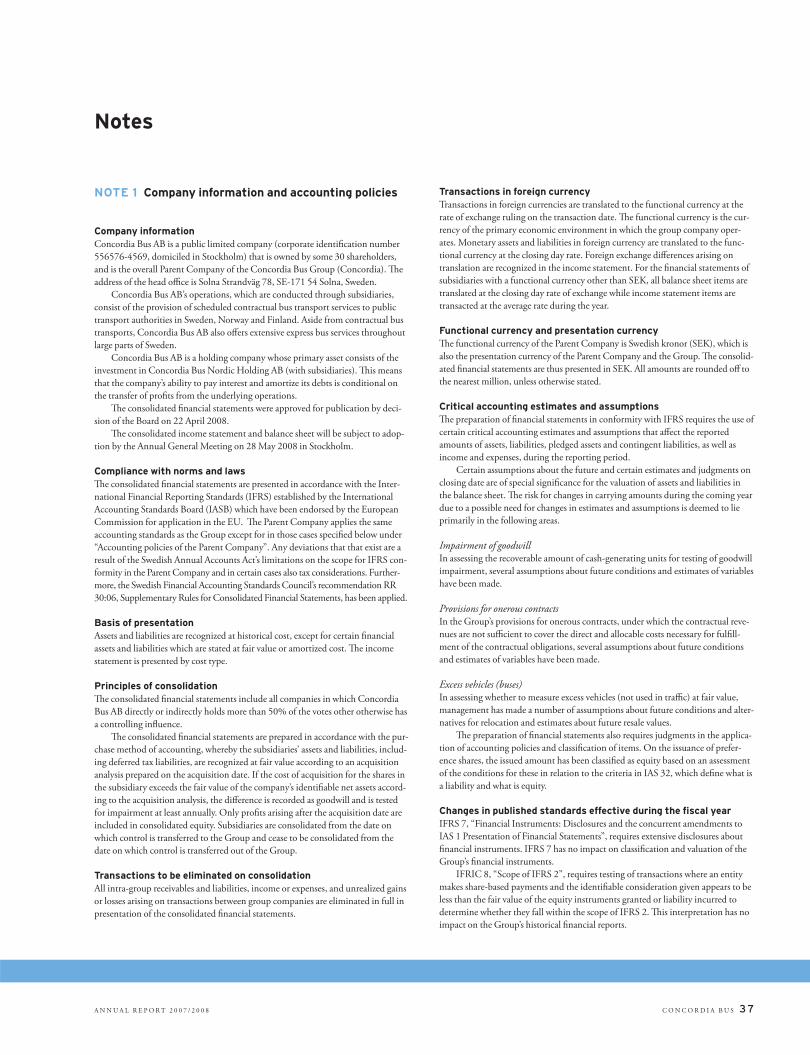
A N N U A L R E P O R T 2 0 0 7 / 2 0 0 8 C O N C O R D I A B U S 3 7
Notes
NOTE 1 Company information and accounting policies
Company informationConcordia Bus AB is a public limited company (corporate identifi cation number
556576-4569, domiciled in Stockholm) that is owned by some 30 shareholders,
and is the overall Parent Company of the Concordia Bus Group (Concordia). Th e
address of the head offi ce is Solna Strandväg 78, SE-171 54 Solna, Sweden.
Concordia Bus AB’s operations, which are conducted through subsidiaries,
consist of the provision of scheduled contractual bus transport services to public
transport authorities in Sweden, Norway and Finland. Aside from contractual bus
transports, Concordia Bus AB also off ers extensive express bus services throughout
large parts of Sweden.
Concordia Bus AB is a holding company whose primary asset consists of the
investment in Concordia Bus Nordic Holding AB (with subsidiaries). Th is means
that the company’s ability to pay interest and amortize its debts is conditional on
the transfer of profi ts from the underlying operations.
Th e consolidated fi nancial statements were approved for publication by deci-
sion of the Board on 22 April 2008.
Th e consolidated income statement and balance sheet will be subject to adop-
tion by the Annual General Meeting on 28 May 2008 in Stockholm.
Compliance with norms and lawsTh e consolidated fi nancial statements are presented in accordance with the Inter-
national Financial Reporting Standards (IFRS) established by the International
Accounting Standards Board (IASB) which have been endorsed by the European
Commission for application in the EU. Th e Parent Company applies the same
accounting standards as the Group except for in those cases specifi ed below under
“Accounting policies of the Parent Company”. Any deviations that that exist are a
result of the Swedish Annual Accounts Act’s limitations on the scope for IFRS con-
formity in the Parent Company and in certain cases also tax considerations. Further-
more, the Swedish Financial Accounting Standards Council’s recommendation RR
30:06, Supplementary Rules for Consolidated Financial Statements, has been applied.
Basis of presentationAssets and liabilities are recognized at historical cost, except for certain fi nancial
assets and liabilities which are stated at fair value or amortized cost. Th e income
statement is presented by cost type.
Principles of consolidationTh e consolidated fi nancial statements include all companies in which Concordia
Bus AB directly or indirectly holds more than 50% of the votes other otherwise has
a controlling infl uence.
Th e consolidated fi nancial statements are prepared in accordance with the pur-
chase method of accounting, whereby the subsidiaries’ assets and liabilities, includ-
ing deferred tax liabilities, are recognized at fair value according to an acquisition
analysis prepared on the acquisition date. If the cost of acquisition for the shares in
the subsidiary exceeds the fair value of the company’s identifi able net assets accord-
ing to the acquisition analysis, the diff erence is recorded as goodwill and is tested
for impairment at least annually. Only profi ts arising after the acquisition date are
included in consolidated equity. Subsidiaries are consolidated from the date on
which control is transferred to the Group and cease to be consolidated from the
date on which control is transferred out of the Group.
Transactions to be eliminated on consolidation All intra-group receivables and liabilities, income or expenses, and unrealized gains
or losses arising on transactions between group companies are eliminated in full in
presentation of the consolidated fi nancial statements.
Transactions in foreign currencyTransactions in foreign currencies are translated to the functional currency at the
rate of exchange ruling on the transaction date. Th e functional currency is the cur-
rency of the primary economic environment in which the group company oper-
ates. Monetary assets and liabilities in foreign currency are translated to the func-
tional currency at the closing day rate. Foreign exchange diff erences arising on
translation are recognized in the income statement. For the fi nancial statements of
subsidiaries with a functional currency other than SEK, all balance sheet items are
translated at the closing day rate of exchange while income statement items are
transacted at the average rate during the year.
Functional currency and presentation currencyTh e functional currency of the Parent Company is Swedish kronor (SEK), which is
also the presentation currency of the Parent Company and the Group. Th e consolid-
ated fi nancial statements are thus presented in SEK. All amounts are rounded off to
the nearest million, unless otherwise stated.
Critical accounting estimates and assumptionsTh e preparation of fi nancial statements in conformity with IFRS requires the use of
certain critical accounting estimates and assumptions that aff ect the reported
amounts of assets, liabilities, pledged assets and contingent liabilities, as well as
income and expenses, during the reporting period.
Certain assumptions about the future and certain estimates and judgments on
closing date are of special signifi cance for the valuation of assets and liabilities in
the balance sheet. Th e risk for changes in carrying amounts during the coming year
due to a possible need for changes in estimates and assumptions is deemed to lie
primarily in the following areas.
Impairment of goodwillIn assessing the recoverable amount of cash-generating units for testing of goodwill
impairment, several assumptions about future conditions and estimates of variables
have been made.
Provisions for onerous contractsIn the Group’s provisions for onerous contracts, under which the contractual reve-
nues are not suffi cient to cover the direct and allocable costs necessary for fulfi ll-
ment of the contractual obligations, several assumptions about future conditions
and estimates of variables have been made.
Excess vehicles (buses)In assessing whether to measure excess vehicles (not used in traffi c) at fair value,
management has made a number of assumptions about future conditions and alter-
natives for relocation and estimates about future resale values.
Th e preparation of fi nancial statements also requires judgments in the applica-
tion of accounting policies and classifi cation of items. On the issuance of prefer-
ence shares, the issued amount has been classifi ed as equity based on an assessment
of the conditions for these in relation to the criteria in IAS 32, which defi ne what is
a liability and what is equity.
Changes in published standards effective during the fi scal yearIFRS 7, “Financial Instruments: Disclosures and the concurrent amendments to
IAS 1 Presentation of Financial Statements”, requires extensive disclosures about
fi nancial instruments. IFRS 7 has no impact on classifi cation and valuation of the
Group’s fi nancial instruments.
IFRIC 8, “Scope of IFRS 2”, requires testing of transactions where an entity
makes share-based payments and the identifi able consideration given appears to be
less than the fair value of the equity instruments granted or liability incurred to
determine whether they fall within the scope of IFRS 2. Th is interpretation has no
impact on the Group’s historical fi nancial reports.

3 8 C O N C O R D I A B U S A N N U A L R E P O R T 2 0 0 7 / 2 0 0 8
NOTES
IFRC 10, “Interim Financial Reporting and Impairment”, concludes that
where an entity has recognized an impairment loss in an interim period for good-
will or an investment in either an equity instrument or a fi nancial asset carried at
cost, that impairment should not be reversed in subsequent interim or annual
fi nancial statements. Th is interpretation has no impact on the Group’s historical
fi nancial reports.
New accounting standardsTh e following new standards and amendments eff ective for periods beginning on
or after 1 January 2008 have not been applied for 2007. Th ese are not expected to
have any impact on the consolidated fi nancial statements other than increased dis-
closure requirements.
IFRS 8, “Operating Segments” requires operating segments to be identifi ed on
the basis of the company’s system of internal fi nancial reporting to key manage-
ment personnel.
Amendments to IAS 1, “Presentation of Financial Statements”, requires the
presentation of all non-owner changes in equity (comprehensive income) either in
one statement of comprehensive income or in two statements (a separate income
statement and a statement of comprehensive income). Components of compre-
hensive income may not be presented in the statement of changes in equity.
Segment reportingConcordia Bus is active in two business areas; contractual transports and long-dis-
tance transports between selected cities (express transports). Contractual transports
are operated in large parts of Sweden and in metropolitan areas of Finland and
Norway. Th e bulk of revenue comes from contracts with public transport authori-
ties that represent the various counties. In nearly all cases, the public transport
authorities receive ticket revenues and the operator receives a fi xed amount of com-
pensation as payment for the contracted services. Swebus Express traffi cs certain
predetermined routes throughout Sweden. Revenue is generated by the sale of tick-
ets to the passengers. Some of the companies also conduct contract traffi c mainly
by using vehicles and personnel during periods when these are not occupied in reg-
ular transport operations.
Th e Group’s operations are steered and reported primarily by business segment
and secondarily by geographical market. Th e accounting policies used by the
reporting segments at the same as those applied in the consolidated fi nancial state-
ments. Concordia Bus evaluates operations in each business segment based on
operating profi t for each reporting business segment and normally reports sales and
transfers between business segments on a third-party basis, i.e. valued at market
prices. Sales are attributed to the geographical location where the assets that gener-
ated the revenue are reported.
Group-wide functionsCosts for group-wide support functions such as IT, systems administration and
legal aff airs, etc., are allocated to the operating entities and countries according to
the degree of utilization and are included in operating profi t. General administra-
tive expenses, costs for the head offi ce and other costs that arise at the central level
and are attributable to the entire company are not included in entity’s profi t or loss.
Th e operating assets in each entity include all operating assets that are used by the
entity, primarily intangible assets, tangible assets, inventories and trade receivables.
Most of these assets are directly attributable to the respective entity. Th e operating
liabilities in each entity include all operating liabilities that are used by the entity,
accrued expenses and prepaid income. Most of these liabilities are directly attribut-
able to the respective entity. Estimated deferred tax and external and internal loans
are not included in the entity’s capital employed.
Revenue recognitionTh e majority of Concordia’s revenue is attributable to contracts with public trans-
port authorities (PTAs) with a term of 5-8 years. Th e PTA contracts are generally
designed so that Concordia receives a fi xed fee in return for services performed.
Ticket revenues do not accrue to Concordia, but are forwarded to the PTAs. Most
of the PTA contracts are of the gross cost contract type, in which compensation is
based exclusively on the number of kilometers or hours driven and is entirely unre-
lated to the number of passengers. Under certain contracts, Concordia receives
compensation based on the services performed, while other contracts provide Con-
cordia with remuneration in advance. Regardless of the payment fl ows in the con-
tractual operations and the basis for compensation, Concordia recognizes the reve-
nue evenly over the term of the contract, before indexation. Th e amount of compen-
sation is often tied to certain cost indices in order to compensate the operators for
cost increases during the term of the contract. Th e compensation is adjusted during
the term of the contract due to changes in these indices. Concordia adjusts its reve-
nues during the contract period according to the agreed indexation formula. Certain
of Concordia’s PTA contracts are designed so that all or part of the compensation is
based on the number of passengers, so-called net cost contracts. Revenue from these
contracts is recognized on the date when the passenger travels with Concordia.
Revenues from express transports consist of ticket revenues from the passen-
gers. For express transports, revenue is recognized on the date when the passenger
travels with Concordia.
Th e revenues also include revenues for rents, fuel sales and maintenance ser-
vices. Revenues from these activities are recognized when the goods are delivered
and the services performed or, in cases where revenues are obtained through operat-
ing leases, they are distributed evenly over the term of the lease.
All revenues are reported excluding value added tax.
LeasesIn the consolidated fi nancial statements, leases are classifi ed as either fi nance or
operating leases. A lease is classifi ed as a fi nance lease if it transfers substantially all
the risks and rewards incident to ownership to the lessee. All other leases are classi-
fi ed as operating leases. Assets held under fi nance leases are recorded as fi xed assets
in the consolidated balance sheet. Th e obligation to pay future lease charges is rec-
ognized as a liability. At commencement of the lease term, all assets and liabilities
are measured at the lower of fair value and the present value of minimum lease pay-
ments. Assets held under fi nance leases are depreciated on a straight-line basis over
their estimated useful lives according to the same valuation principles used for sim-
ilar asset groups, which do not follow the payment periods in the lease contracts. In
the company’s assessment, the benefi ts earned from the leased vehicles extend for
longer than the related fi nancial obligation. Th e fi nance lease payments are appor-
tioned between the fi nance charge and reduction of outstanding liability to pro-
duce a constant periodic rate of interest on the remaining balance of the liability for
each period. In the income statement, the fi nance charge is recognized as amortiza-
tion and interest expenses. For operating leases, no assets or liabilities are recog-
nized in the balance sheet. In the income statement, the lease payments are recog-
nized as an expense on a straight-line basis over the lease term.
DepreciationDepreciation of tangible assets is based on the historical costs and estimated useful
lives of diff erent groups of fi xed assets. Depreciation is charge out on a straight-line
basis over the useful life of the assets down to an estimated residual value. For assets
acquired during the year, depreciation is calculated from the acquisition date.
Applied useful lives
Computers 3 years
Offi ce equipment and furniture 5 years
Vehicles Standard buses, 14 years
Long-distance buses, 10 years
Special buses, according to individual valuation
Remodeling in leased premises 5 years, but not exceeding the term of the lease
Financial income and expensesFinancial income and expenses consist of interest income on bank deposits and
receivables, interest expense on loans and realized and unrealized gains and losses
attributable to fi nancing.
Income taxesTh e Groups’s income taxes consist of current tax and deferred tax. Current tax
refers to tax payable or receivable with respect to the year’s profi t or loss. Deferred
tax is calculated according to the balance sheet method on the basis of temporary
Cont’d. NOTE 1

NOTES
A N N U A L R E P O R T 2 0 0 7 / 2 0 0 8 C O N C O R D I A B U S 3 9
diff erences between the carrying amount of an asset or liability and its tax base and
tax on the Group’s tax loss carryforward. Deferred tax is computed according to the
applicable tax rate in each country. Deferred tax assets are recognized only to the
extent that it is probable that these can be utilized against future taxable profi ts.
Tax laws in Sweden and Finland permit provisions to special reserves and
funds which constitute temporary diff erences. Within specifi ed limits, this enables
companies to retain reported profi ts in the company without immediate taxation
of these profi ts. Th e untaxed reserves are not subject to taxation until they are dis-
solved. During years when the operations make a loss, however, the untaxed
reserves can be utilized to cover losses without giving rise to any taxation. In the
Group’s balance sheet, untaxed reserves are divided between equity and deferred tax
liabilities. In the income statement, deferred tax is reported among other things as
tax attributable to the year’s change in untaxed reserves.
Intangible assetsIn cases where the fair value of purchase consideration given for operations or
shares in subsidiaries exceed the fair value of net assets acquired, the diff erence is
recorded as goodwill. Goodwill is no longer amortized but is instead tested for
impairment at least annually.
Tangible assetsTh e carrying amounts of the Group’s fi xed assets are reviewed regularly to look for
any indication that an asset may be impaired. If there is an indication of impair-
ment, the asset’s net selling price and value in use are calculated. Net selling price
consists of the amount recoverable on the sale of the asset less costs to sell.
A fi xed asset is considered to be impaired when its carrying amount exceeds the
present value of future cash fl ows from the asset. Th e impairment loss consists of
the diff erence between the asset’s present value and carrying amount. For fi xed
assets held for sale, the impairment loss is calculated as the diff erence between the
estimated selling price less costs for disposal and the carrying amount of the asset.
InventoriesInventories are stated at the lower of cost and fair value on a First-In, First-Out
(FIFO) basis. Th e necessary provisions are made for obsolescence, partly on a case-
by-case basis and partly through collective assessment.
Financial assets and liabilities and other fi nancial instruments Financial instruments are initially measured at cost, corresponding to fair value
including transaction costs for all fi nancial instruments aside from those in the cat-
egory of fi nancial assets and liabilities measured at fair value through profi t or loss.
Subsequent to initial recognition, the accounting treatment of fi nancial liabilities
depends on how they are classifi ed, as described below.
A fi nancial asset or liability is recognized in the balance sheet when the com-
pany initially becomes party to the contractual provisions of the instrument. Trade
receivables are recorded in the balance sheet when an invoice has been issued.
Financial liabilities are recognized when the counterparty has performed and there
is contractual obligation to pay, even if no invoice has been received. Trade payables
are recorded when an invoice has been received.
A fi nancial asset is derecognized from the balance sheet when the company’s
rights under the agreement are realized, expire or the company has relinquished
control of the asset. Th e same applies to a part of a fi nancial asset. A fi nancial liabil-
ity is derecognized from the balance sheet when the obligation specifi ed in the
agreement is discharged or otherwise extinguished. Th e same applies to a part of a
fi nancial liability.
At each reporting date, the Group assesses whether there is objective evidence
of impairment for a fi nancial asset or group of fi nancial assets.
Financial assets and liabilities at fair value through profi t or lossAssets and liabilities in this category consist of derivatives measured at fair value
with fair value changes through profi t or loss.
Currency derivatives (forward exchange contracts and currency swaps) entered
into in order to hedge currency exposure in interest payments on the bond loan are
reported according to hedge accounting, i.e. the profi t/loss eff ects attributable to the
derivative instruments are recognized on the same date as the foreign exchange eff ects
on the underlying commercial fl ow are realized. Outstanding currency derivatives
that do not meet the criteria for hedge accounting are measured at fair value with fair
value changes through other fi nancial items in the income statement.
Interest derivatives (interest rate caps) entered into in order to achieve the desired
fi xed interest period in lease liabilities are reported according to hedge accounting, i.e.
the profi t/loss eff ects attributable to the derivative instruments are recognized on the
same date as the underlying item. Interest derivatives that do not meet the criteria for
hedge accounting are measured at fair value with fair value changes through other
fi nancial items in the income statement.
Loans and receivablesAfter individual assessment, trade receivables are reported in the amount in which
they are expected to be received after deduction of doubtful debts, which are
assessed on a case-by-case basis. When the expected maturity is short, the receivable
is recognized at face value without discounting. Impairment losses on loans and
receivables are recognized in operating expenses
Blocked bank accountsBlocked bank accounts consist of deposits to secure bank guarantees and lease con-
tracts. Among other things, bank guarantees have been furnished as security for
Concordia Bus Nordic AB´s pension liability, Concordia Bus Norge AS’s obliga-
tions in respect of transport contracts in Oslo, Swebus AB and Swebus Express ABs
obligations pursuant to the Travel Guarantee Act and Swebus’s obligations in
respect of electricity purchases. Swebus has deposited funds under a lease contract
for a bus.
Cash and cash equivalentsCash and cash equivalents consist of comprise cash in hand and at bank.
Other fi nancial liabilitiesLiabilities are classifi ed as other fi nancial liabilities, which means that these are ini-
tially measured at the amount received less transaction costs and are subsequently
measured at amortized cost according to the eff ective interest rate method.
Trade payables are classifi ed as other fi nancial liabilities. Trade payables have a
short expected maturity and are measured at face value without discounting.
Determining recoverable amountTh e recoverable amounts of fi nancial assets in the categories of held-to-maturity
investments and loans and receivables measured at amortized cost are calculated as
the present value of future cash fl ows discounted at the eff ective rate in force on ini-
tial recognition of the asset. Assets with a time to maturity of less than one year are
not discounted.
Impairment losses on held-to-maturity investments and loans and receivables
measured at amortized cost are reversed if a later increase in the recoverable amount
can be objectively attributed to an event occurring after the date of the impairment
loss.
Provisions A provision is recognized in the balance sheet when the Group has a present obliga-
tion (legal or constructive) that has arisen as a result of a past event, it is probable
that an outfl ow of resources will be required to settle the obligation and the amount
can be estimated reliably. When the timing eff ect of payment is signifi cant, provi-
sions are measured at discounted present value using a pre-tax discount rate that
refl ects current market assessments of the time value of money and the risks specifi c
to the liability.
Termination benefi tsA provision is recognized on the termination of employees only if the company is
demonstrably committed to terminate an employee or group of employees before
the normal retirement date. In the event of termination, the company draws up a
detailed plan including at least the place of work, positions and approximate num-
ber of persons aff ected, as well as the amount of compensation for each employee
category or position and the time of the plan’s implementation.
Cont’d. NOTE 1

4 0 C O N C O R D I A B U S A N N U A L R E P O R T 2 0 0 7 / 2 0 0 8
NOTES
Onerous contractsA large share of the Group’s revenue relates to contracts with public transport
authorities with a term of 5-8 years. Th e terms of these contracts normally stipulate
that the amount of revenue shall be adjusted upwards according to an established
index, either the consumer price index or various other producer price indices. As a
result of changed conditions and when costs increase more than revenues, these
contracts can become onerous contracts in which the contractual revenues are not
suffi cient to cover the direct and allocable costs necessary for fulfi llment of the con-
tractual obligations. A provision for future losses is then made in the period when
the management has identifi ed the contract as an onerous contract. Th e loss is cal-
culated by including direct and indirect costs attributable to the contract including
depreciation of buses used to fulfi ll the contractual obligations. Provisions are made
at the public transport authority level in cases where there is a natural connection
between the various contracts. Many contracts make use of joint resources which
are often diffi cult to allocate between the contracts. Th e contracts can also be
related for other reasons, for example in tenders for packages of contracts where
certain are profi table and others loss-making but the transaction as such generates a
surplus.
Future third-party obligationsProvisions are made for damages that of occurred, but have not been settled, to the
Group’s own vehicles or vehicles owned by third parties. Th e provision shall cover
future obligations to third parties.
Future environmental obligations Provisions are made for future environmental obligations on leased land and facili-
ties that are, or have been, used in operations.
PensionsTh e Group has both defi ned contribution and defi ned benefi t pension plans. In the
defi ned contribution pension plans, Concordia pays a pays a fi xed contribution
according to plan and has no further obligation to pay post-employment contribu-
tions. Under the defi ned contribution plans for Concordia Bus Norge AS and
Concordia Bus Nordic AB, benefi ts are paid to former employees on the basis of
fi nal salary and years of service. Th e Group bears the risk for ensuring that the con-
tractual benefi ts are paid.
Pension obligations for most of the Swedish operations are covered by a
defi ned benefi t pension plan of the multi-employer type. Th e plan is insured in the
mutual insurance company Alecta. Th e Group has not had access to suffi cient
information to report its proportional share of the defi ned benefi t obligation and of
the plan assets and expenses. Th e plan is therefore reported as a defi ned contribu-
tion plan, which means that benefi ts paid are recognized as an expense. In the
Swedish operations, there is also a defi ned benefi t pension plan that is funded.
Th e Group’s net obligation under defi ned benefi t plans is determined sepa-
rately for each plan according to the Projected Unit Credit Method. Th is means
that the obligation is calculated as the present value of expected future pension pay-
ments. Th is obligation is compared to the fair value of plan assets and the diff erence
is recognized as a liability/asset with respect to accrued actuarial gains/losses. Th e
calculation of future payments is based on actuarial assumptions that include life
expectancy, future salary increases, employee turnover and factors of signifi cance
for the choice of discount rate.
Changes in and deviations from the actuarial assumptions normally lead to
actuarial gains or losses. Actuarial gains and losses are recognized only when the
accumulated gain or loss exceeds 10% of the higher of the present value of plan
obligations and the fair value of plan assets. If the accumulated gain or loss falls
below the above-mentioned limit, the excess portion is recognized in income or
expense over the expected average remaining working lives of the participating
employees.
When valuation leads to an asset for the Group, the recognized value of the
asset is limited to the net total of unrealized actuarial losses and past service costs
and the present value of any benefi ts available in the form of refunds or reductions
in future employer contributions to the plan.
Cash fl owTh e cash fl ow statement has been prepared med based on the income statement and
other changes between the opening and closing balances in the balance sheet, taking
into account translation diff erences. Cash and cash equivalents in the cash fl ow state-
ment include cash in hand, driver receipts and bank deposits.
Accounting policies of the Parent CompanyTh e Parent Company applies the same accounting policies as the Group aside from
those exceptions and additional stated in the Swedish Financial Accounting Stand-
ards Council’s recommendation RR32:06, Accounting for Legal Entities. Any devi-
ations that that exist are a result of the Swedish Annual Accounts Act’s limitations on
the scope for IFRS conformity in the Parent Company.
Group contributions for legal entitiesTh e Parent Company reports Group contributions in accordance with a statement
from the Swedish Financial Accounting Standards Council’s Emerging Issues Task
Force. Group contributions are reported in accordance with their fi nancial signifi c-
ance. Th is means that Group contributions paid to minimize the Group’s overall tax
burden are reported directly in retained earnings less the current tax eff ect.
Cont’d. NOTE 1

NOTES
A N N U A L R E P O R T 2 0 0 7 / 2 0 0 8 C O N C O R D I A B U S 4 1
NOTE 2 Segment reporting
Revenue by business segment
1 March 2007– 1 March 2006–SEK M 29 Feb 2008 28 Feb 2007
Contractual transport services – Sweden, external customers 3,990 3,668
Contractual transport services – Norway 463 443
Contractual transport services – Finland 517 409
Total contractual transport services 4,970 4,520
Express, long-distance transports 351 365
Interbus, external customers – 114
Total other transports 351 479
Other revenue and group eliminations 85 76
Total revenue 5,406 5,075
Operating profi t/loss by business segment
1 March 2007– 1 March 2006–SEK M 29 Feb 2008 28 Feb 2007
Contractual transport services – Sweden 153 7
Contractual transport services – Norway 23 19
Contractual transport services – Finland 9 -9
Total contractual transport services 185 17
Express, long-distance transports 19 10
Interbus – 8
Total other transports 19 18
Total bus operations 204 35
Central functions and other items –43 –59
Total operating profi t/loss 161 –24
Assets by business segment
SEK M 29 Feb 2008 28 Feb 2007
Contractual transport services – Sweden 2,279 2,353
Contractual transport services – Norway 577 532
Contractual transport services – Finland 332 222
Total contractual transport services 3,188 3,107
Express, long-distance transports 170 139
Interbus – –
Total other transports 170 139
Total bus operations 3,358 3,246
Parent Company and intra-group eliminations 262 157
Total assets 3,620 3,403
Liabilities by business segment
SEK M 29 Feb 2008 28 Feb 2007
Contractual transport services – Sweden 1,615 1,581
Contractual transport services – Norway 152 131
Contractual transport services – Finland 217 100
Total contractual transport services 1,984 1,812
Express, long-distance transports 84 60
Interbus – –
Total other transports 84 60
Total bus operations 2,068 1,872
Parent Company and intra-group eliminations 1,342 1,304
Total liabilities 3,410 3,176
Investments in tangible and fi nancial assets by business segment
1 March 2007– 1 March 2006–SEK M 29 Feb 2008 28 Feb 2007
Contractual transport services – Sweden 84 930
Contractual transport services – Norway 57 61
Contractual transport services – Finland 141 15
Total contractual transport services 282 1,006
Express, long-distance transports 38 16
Interbus – –
Total other transports 38 16
Total bus operations 320 1,022
Parent Company and intra-group eliminations 19 15
Total investments 339 1,037
Investments in tangible and fi nancial assets consist of fi nance leases for SEK 306
million (931) which have no eff ect in liquidity in the business segment.
Depreciation/amortization by business segment
1 March 2007– 1 March 2006 –SEK M 29 Feb 2008 28 Feb 2007
Contractual transport services – Sweden 210 233
Contractual transport services – Norway 17 24
Contractual transport services – Finland 23 19
Total contractual transport services 250 276
Express, long-distance transports 8 11
Interbus – 6
Total other transports 8 17
Total bus operations 258 293
Parent Company and intra-group eliminations 6 7
Total depreciation/amortization 264 300

4 2 C O N C O R D I A B U S A N N U A L R E P O R T 2 0 0 7 / 2 0 0 8
NOTES
Revenue by country
1 March 2007– 1 March 2006–SEK M 29 Feb 2008 28 Feb 2007
Sweden 4,408 4,201
Norway 476 460
Finland 522 414
Total revenue 5,406 5,075
Assets by country
SEK M 29 Feb 2008 28 Feb 2007
Sweden 2,711 2,649
Norway 577 532
Finland 332 222
Total assets 3,620 3,403
Investments in tangible and fi nancial assets by country
1 March 2007– 1 March 2006–SEK M 29 Feb 2008 28 Feb 2007
Sweden 141 961
Norway 57 61
Finland 141 15
Total investments 339 1,037
Investments in tangible and fi nancial assets consist of fi nance leases for SEK 306
million (931) which have no eff ect in liquidity in the business segment.
Cont’d. NOTE 2
NOTE 3 Revenue
Revenue includes other operating income, which consists primarily of revenue from leasing, the sale of fuel and diesel and revenue from workshop services to external customers.
Group Parent Company
1 March 2007– 1 March 2006– 1 March 2007– 1 March 2006–Breakdown of revenue, SEK M 29 Feb 2008 28 Feb 2007 29 Feb 2008 28 Feb 2007
Revenue from bus operations 5,299 4,961 – –
Leasing, external workshop services and diesel sales 21 25 – –
Other revenue 86 89 33 31
Total revenue 5,406 5,075 33 31
Sales to Group companiesRevenue in the Parent Company includes sales of SEK 33 million (31) to group companies. Sales to one major customer represent 20& (28%) of total revenue.
NOTE 4 Cost of services sold
Th e cost of services sold consists of personnel expenses, depreciation of buses and other direct costs.
Group Parent Company
1 March 2007– 1 March 2006– 1 March 2007– 1 March 2006–SEK M 29 Feb 2008 28 Feb 2007 29 Feb 2008 28 Feb 2007
Compensation to drivers 2,394 2,321 – –
Depreciation and lease charges on buses 638 697 – –
Other direct costs 1,514 1,483 – –
Total 4,546 4,501 – –
NOTE 5 Other external expenses
Group Parent Company
1 March 2007– 1 March 2006– 1 March 2007– 1 March 2006–Fees and compensation to auditors (SEK th) 29 Feb 2008 28 Feb 2007 29 Feb 2008 28 Feb 2007
Ernst & Young
Auditing services 2,290 2,775 401 286
Non-auditing services 351 40 186 –
Total 2,641 2,815 587 286
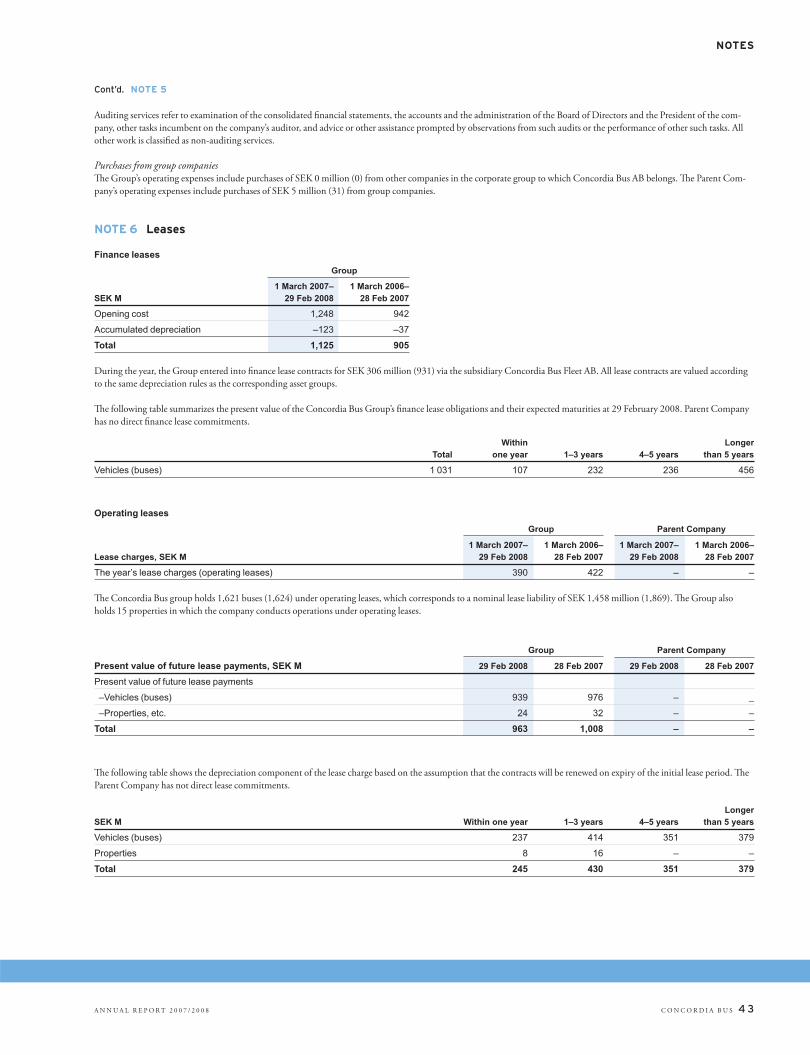
NOTES
A N N U A L R E P O R T 2 0 0 7 / 2 0 0 8 C O N C O R D I A B U S 4 3
Auditing services refer to examination of the consolidated fi nancial statements, the accounts and the administration of the Board of Directors and the President of the com-
pany, other tasks incumbent on the company’s auditor, and advice or other assistance prompted by observations from such audits or the performance of other such tasks. All
other work is classifi ed as non-auditing services.
Purchases from group companiesTh e Group’s operating expenses include purchases of SEK 0 million (0) from other companies in the corporate group to which Concordia Bus AB belongs. Th e Parent Com-
pany’s operating expenses include purchases of SEK 5 million (31) from group companies.
NOTE 6 Leases
Finance leases
Group
1 March 2007– 1 March 2006–SEK M 29 Feb 2008 28 Feb 2007
Opening cost 1,248 942
Accumulated depreciation –123 –37
Total 1,125 905
During the year, the Group entered into fi nance lease contracts for SEK 306 million (931) via the subsidiary Concordia Bus Fleet AB. All lease contracts are valued according
to the same depreciation rules as the corresponding asset groups.
Th e following table summarizes the present value of the Concordia Bus Group’s fi nance lease obligations and their expected maturities at 29 February 2008. Parent Company
has no direct fi nance lease commitments.
Within Longer Total one year 1–3 years 4–5 years than 5 years
Vehicles (buses) 1 031 107 232 236 456
Operating leases
Group Parent Company
1 March 2007– 1 March 2006– 1 March 2007– 1 March 2006–Lease charges, SEK M 29 Feb 2008 28 Feb 2007 29 Feb 2008 28 Feb 2007
The year’s lease charges (operating leases) 390 422 – –
Th e Concordia Bus group holds 1,621 buses (1,624) under operating leases, which corresponds to a nominal lease liability of SEK 1,458 million (1,869). Th e Group also
holds 15 properties in which the company conducts operations under operating leases.
Group Parent Company
Present value of future lease payments, SEK M 29 Feb 2008 28 Feb 2007 29 Feb 2008 28 Feb 2007
Present value of future lease payments
–Vehicles (buses) 939 976 – _
–Properties, etc. 24 32 – –
Total 963 1,008 – –
Th e following table shows the depreciation component of the lease charge based on the assumption that the contracts will be renewed on expiry of the initial lease period. Th e
Parent Company has not direct lease commitments.
LongerSEK M Within one year 1–3 years 4–5 years than 5 years
Vehicles (buses) 237 414 351 379
Properties 8 16 – –
Total 245 430 351 379
Cont’d. NOTE 5
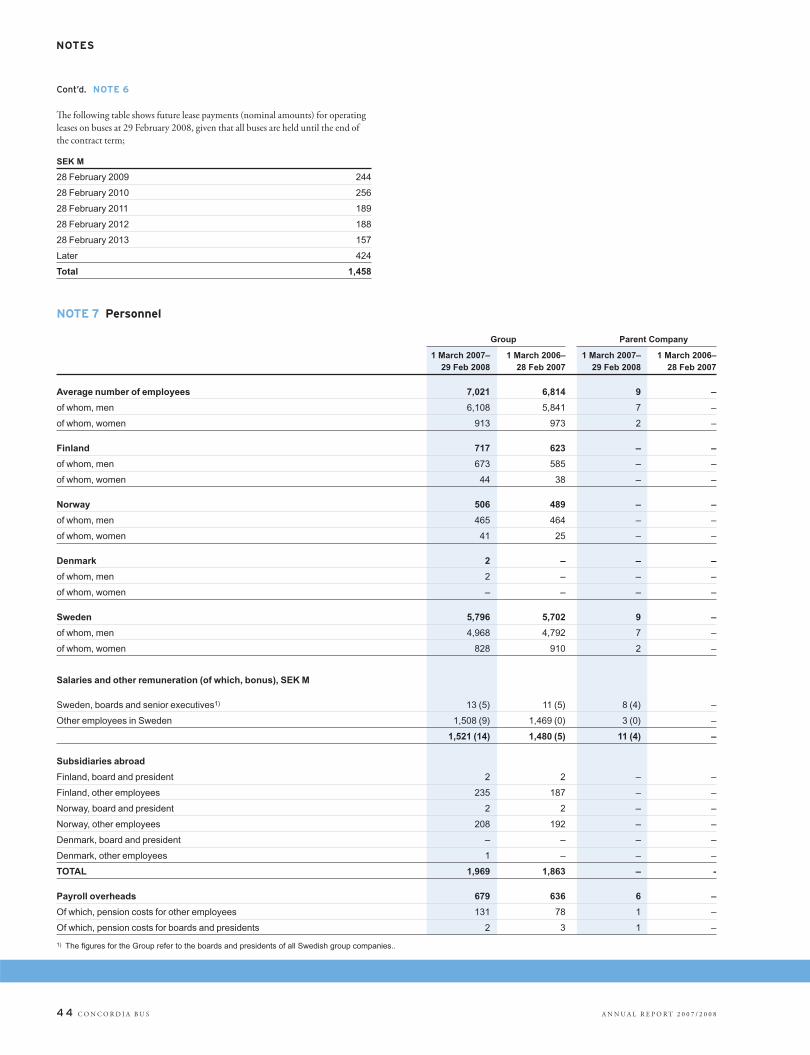
4 4 C O N C O R D I A B U S A N N U A L R E P O R T 2 0 0 7 / 2 0 0 8
NOTES
Th e following table shows future lease payments (nominal amounts) for operating
leases on buses at 29 February 2008, given that all buses are held until the end of
the contract term;
SEK M
28 February 2009 244
28 February 2010 256
28 February 2011 189
28 February 2012 188
28 February 2013 157
Later 424
Total 1,458
NOTE 7 Personnel
Group Parent Company
1 March 2007– 1 March 2006– 1 March 2007– 1 March 2006– 29 Feb 2008 28 Feb 2007 29 Feb 2008 28 Feb 2007
Average number of employees 7,021 6,814 9 –
of whom, men 6,108 5,841 7 –
of whom, women 913 973 2 –
Finland 717 623 – –
of whom, men 673 585 – –
of whom, women 44 38 – –
Norway 506 489 – –
of whom, men 465 464 – –
of whom, women 41 25 – –
Denmark 2 – – –
of whom, men 2 – – –
of whom, women – – – –
Sweden 5,796 5,702 9 –
of whom, men 4,968 4,792 7 –
of whom, women 828 910 2 –
Salaries and other remuneration (of which, bonus), SEK M
Sweden, boards and senior executives1) 13 (5) 11 (5) 8 (4) –
Other employees in Sweden 1,508 (9) 1,469 (0) 3 (0) –
1,521 (14) 1,480 (5) 11 (4) –
Subsidiaries abroad
Finland, board and president 2 2 – –
Finland, other employees 235 187 – –
Norway, board and president 2 2 – –
Norway, other employees 208 192 – –
Denmark, board and president – – – –
Denmark, other employees 1 – – –
TOTAL 1,969 1,863 – -
Payroll overheads 679 636 6 –
Of which, pension costs for other employees 131 78 1 –
Of which, pension costs for boards and presidents 2 3 1 –
1) The fi gures for the Group refer to the boards and presidents of all Swedish group companies..
Cont’d. NOTE 6

NOTES
A N N U A L R E P O R T 2 0 0 7 / 2 0 0 8 C O N C O R D I A B U S 4 5
Board members and senior executives
Group Group 29 Feb 2008 28 Feb 2007
Number Of whom, men Number Of whom, men
Board of Directors 21 95% 20 95%
Presidents and other senior executives 32 91% 26 81%
Board members and senior executives
Parent Company Parent Company 29 Feb 2008 28 Feb 2007
Number Of whom, men Number Of whom, men
Board of Directors 4 75% 4 75%
Presidents and other senior executives 2 100% – –
Parent CompanyNo disclosures about sickness absence are provided since the number of employees
is fewer than 10.
Remuneration to senior executivesIn the event of termination of employment, senior executives in the Concordia Bus
Group are entitled to a maximum of 12 monthly salaries. As a rule, there is a
6-month mutual term of notice between the company and the senior executive.
Furthermore, additional compensation in a maximum amount of 6 monthly sala-
ries is payable in the event of termination on the part of the company. Senior exec-
utives include the President and CFO of the Parent Company and the presidents of
the Group’s subsidiaries. During the year, an agreement was signed with the presi-
dent of one subsidiary.
Pensions benefi ts of the PresidentTh e retirement age for the President of the Parent Company is 62 years. Pension
expenses for the company are reduced to 90% of salary on retirement at the age of
62–63 years, 80% of salary on retirement at the age of 63–64 years and 70% of sal-
ary on retirement at the age of 64–65 years. Concordia Bus AB’s obligations to its
presidents ceases on retirement, 65 years of age. Pension expenses consist of defi ned
benefi t pensions, for which the premium is equal to 30% of pensionable salary.
Pensionable salary consists of basic salary as long as the president remains in the
company’s employment. Termination benefi ts are pensionable.
Vacation for the PresidentTh e President is entitled to 30 vacation days per year.
Sick pay for the PresidentTh e President is insured up to 90% of salary for a maximum of 365 days per calen-
dar year, with no qualifying days.
Other employment benefi ts of the PresidentAside from the described taxable benefi ts, there is also healthcare insurance. Th e
President is covered by the issued share option programs, which are reported under
the heading “Share option programs”.
Remuneration to the Board Chairman and membersRemuneration to the Chairman and other members of the Board is paid according
to the decision of the Annual General Meeting. No remuneration in excess of that
decided by the Annual General Meeting is paid. Th e President receives no Board
fees. Th e members of the Board are covered by the issued share option programs,
which are reported under the heading “Share option programs”.
Remuneration and other benefi ts during the year
Group
1 March 2007– 1 March 2006–SEK M 29 Feb 2008 28 Feb 2007
Board Chairman
Jan Sjöqvist 0.6 0.6
Board members
Gina Germano 0.0 0.0
Jan Sundling 0.2 0.2
Rolf Lydahl 0.2 0.2
President
Ragnar Norbäck 3.6 3.6
Total 4.6 4.6
During the year, Concordia Bus AB paid pension benefi ts to former Board mem-
bers in an amount of SEK 0.1 million. Former Board members are entitled to life-
long compensation from the company.
Share option programsConcordia Bus AB has issued two share option programs. Program 1, issued on
24 June 2005, consisted of 1,052,000 share options, and Program 2, issued on
8 November 2005, consisted of 304,569 share options. Each share option grants
the right to subscribe for 1 share.
Common Subscription Subscription shares price, SEK period
Program 1 1,052,000 22 1 June 2008– 30 Sept 2008
Program 2 304,569 49 8 Nov 2008– 22 Nov 2008
Total 1,356,569
Program 1 has been granted to senior executives in Concordia Bus AB and its sub-
sidiaries, while Program 2 has been primarily granted to the member of the Board
of Concordia Bus AB.
Th e share options correspond to an increase of 6.8% in the common shares.
Th e price of the share options has been calculated according to the Black & Scholes
model based on the following assumptions:
Program 1 Program 2
Share price SEK 10.85 SEK 20.71
Exercise price SEK 22.81 SEK 34.41
Share option price SEK 0.05 SEK 0.44
Risk-free interest rate 2.4% 2.4%
Maturity 3 years 3 years
No dividends have been assumed in valuation of the share options. Th e assessment
has been based on theoretical calculations of the share option’s value. Th e future
volatility of the share has been assessed with consideration to historical volatility in
comparable companies.
Cont’d. NOTE 7
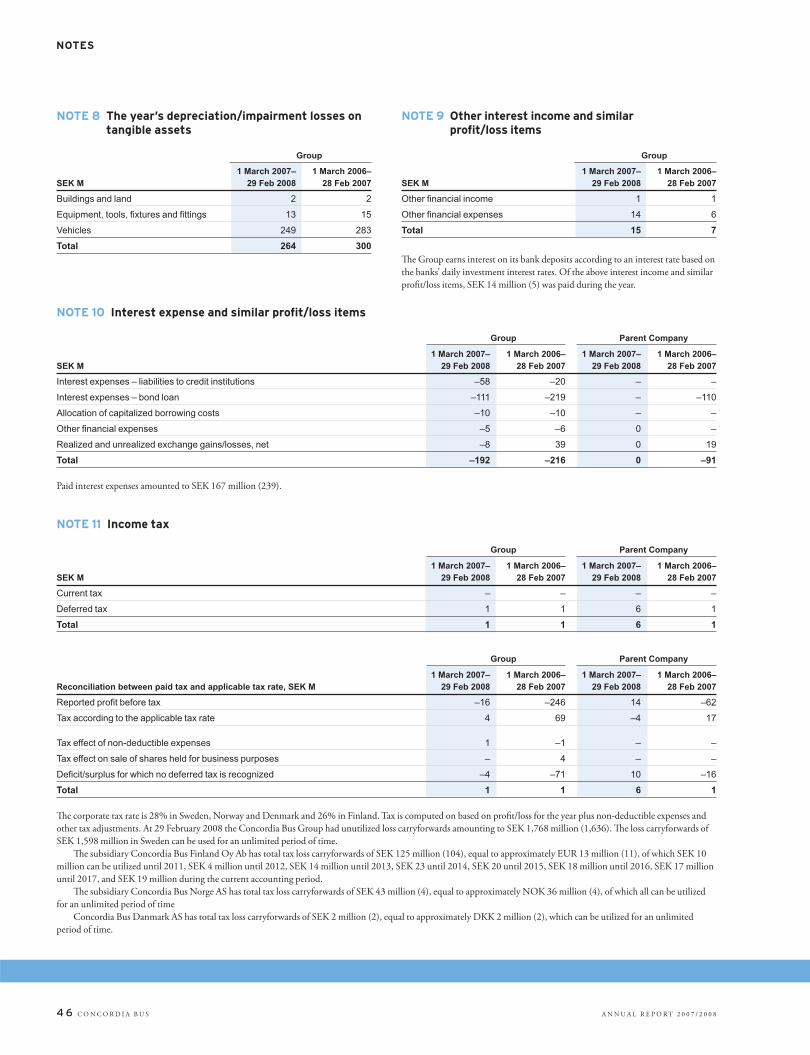
4 6 C O N C O R D I A B U S A N N U A L R E P O R T 2 0 0 7 / 2 0 0 8
NOTES
NOTE 8 The year’s depreciation/impairment losses on tangible assets
Group
1 March 2007– 1 March 2006–SEK M 29 Feb 2008 28 Feb 2007
Buildings and land 2 2
Equipment, tools, fi xtures and fi ttings 13 15
Vehicles 249 283
Total 264 300
NOTE 9 Other interest income and similar profi t/loss items
Group
1 March 2007– 1 March 2006–SEK M 29 Feb 2008 28 Feb 2007
Other fi nancial income 1 1
Other fi nancial expenses 14 6
Total 15 7
Th e Group earns interest on its bank deposits according to an interest rate based on
the banks’ daily investment interest rates. Of the above interest income and similar
profi t/loss items, SEK 14 million (5) was paid during the year.
NOTE 10 Interest expense and similar profi t/loss items
Group Parent Company
1 March 2007– 1 March 2006– 1 March 2007– 1 March 2006–SEK M 29 Feb 2008 28 Feb 2007 29 Feb 2008 28 Feb 2007
Interest expenses – liabilities to credit institutions –58 –20 – –
Interest expenses – bond loan –111 –219 – –110
Allocation of capitalized borrowing costs –10 –10 – –
Other fi nancial expenses –5 –6 0 –
Realized and unrealized exchange gains/losses, net –8 39 0 19
Total –192 –216 0 –91
Paid interest expenses amounted to SEK 167 million (239).
NOTE 11 Income tax
Group Parent Company
1 March 2007– 1 March 2006– 1 March 2007– 1 March 2006–SEK M 29 Feb 2008 28 Feb 2007 29 Feb 2008 28 Feb 2007
Current tax – – – –
Deferred tax 1 1 6 1
Total 1 1 6 1
Group Parent Company
1 March 2007– 1 March 2006– 1 March 2007– 1 March 2006–Reconciliation between paid tax and applicable tax rate, SEK M 29 Feb 2008 28 Feb 2007 29 Feb 2008 28 Feb 2007
Reported profi t before tax –16 –246 14 –62
Tax according to the applicable tax rate 4 69 –4 17
Tax effect of non-deductible expenses 1 –1 – –
Tax effect on sale of shares held for business purposes – 4 – –
Defi cit/surplus for which no deferred tax is recognized –4 –71 10 –16
Total 1 1 6 1
Th e corporate tax rate is 28% in Sweden, Norway and Denmark and 26% in Finland. Tax is computed on based on profi t/loss for the year plus non-deductible expenses and
other tax adjustments. At 29 February 2008 the Concordia Bus Group had unutilized loss carryforwards amounting to SEK 1,768 million (1,636). Th e loss carryforwards of
SEK 1,598 million in Sweden can be used for an unlimited period of time.
Th e subsidiary Concordia Bus Finland Oy Ab has total tax loss carryforwards of SEK 125 million (104), equal to approximately EUR 13 million (11), of which SEK 10
million can be utilized until 2011, SEK 4 million until 2012, SEK 14 million until 2013, SEK 23 until 2014, SEK 20 until 2015, SEK 18 million until 2016, SEK 17 million
until 2017, and SEK 19 million during the current accounting period.
Th e subsidiary Concordia Bus Norge AS has total tax loss carryforwards of SEK 43 million (4), equal to approximately NOK 36 million (4), of which all can be utilized
for an unlimited period of time
Concordia Bus Danmark AS has total tax loss carryforwards of SEK 2 million (2), equal to approximately DKK 2 million (2), which can be utilized for an unlimited
period of time.

NOTES
A N N U A L R E P O R T 2 0 0 7 / 2 0 0 8 C O N C O R D I A B U S 4 7
Temporary differences resulted in deferred tax assets/liabilities in the following items.
Group Parent Company
SEK M 29 Feb 2008 28 Feb 2007 29 Feb 2008 28 Feb 2007
Deferred tax liability
Excess depreciation – – – –
Goodwill arising through business combinations – – – –
Deferred tax assets
Total in respect of loss carryforwards 493 487 – –
Provisions for onerous contracts – 1 – –
Impairment losses on receivables – – – –
Reporting of fi nance leases –4 –3 – –
Other temporary differences 1 1 – –
Uncapitalized deferred tax assets –489 –485 – –
Total 1 1 – –
Cont’d. NOTE 11
NOTE 12 Intangible assets
Group
Goodwill, SEK M 29 Feb 2008 28 Feb 2007
Historical cost
Opening balance 674 699
Sales and disposals – –19
Exchange rate differences 9 –6
Closing accumulated cost 683 674
Th e Group’s management has carried out impairment tests and found no indica-
tion of impairment for consolidated goodwill. Th e test has been performed with
respect to each operating unit and is based on the respective company’s profi t/loss
before amortization/depreciation, return multiples, discounted cash fl ows, 12%
return, future 5-year forecasts and existing and future market shares. Th e growth
rate has been estimated at 2% per year and business segment. In the management’s
assessment, reasonable and possible changes in the above variables would not have
such signifi cant eff ects that they would individually reduce the recoverable amount
to a level lower than the carrying amount.
NOTE 13 Tangible assets
Group Parent Company
Costs for improvements on third-party properties, SEK M 29 Feb 2008 28 Feb 2007 29 Feb 2008 28 Feb 2007
Historical cost
Opening cost 8 6 – –
Purchases 0 4 – –
Sales and disposals 0 –2 – –
Closing accumulated cost 8 8 – –
Accumulated depreciation
Opening accumulated depreciation –3 –2 – –
Sales and disposals 0 1 – –
The year’s depreciation –1 –2 – –
Closing accumulated depreciation –4 –3 – –
Closing carrying amount 4 5 – –

4 8 C O N C O R D I A B U S A N N U A L R E P O R T 2 0 0 7 / 2 0 0 8
NOTES
Group Parent Company
Equipment, tools, fi xtures and fi ttings, SEK M 29 Feb 2008 28 Feb 2007 29 Feb 2008 28 Feb 2007
Historical cost
Opening cost 157 230 – –
Purchases 11 18 – –
Sales and disposals –29 –79 – –
Translation difference 0 –1 – –
Reclassifi cation – –8 – –
Sale of operation – –3 – –
Closing accumulated cost 139 157 – –
Accumulated depreciation
Opening accumulated depreciation –126 –200 – –
Sales and disposals 29 78 – –
The year’s depreciation –12 –15 – –
Translation difference 0 1 – –
Reclassifi cation – 7 – –
Sale of operation – 3 – –
Closing accumulated depreciation –109 –126 – –
Closing carrying amount 30 31 – –
Group Parent Company
Vehicles, SEK M 29 Feb 2008 28 Feb 2007 29 Feb 2008 28 Feb 2007
Historical cost
Opening cost 3,219 3,011 – –
Purchases 328 1,015 – –
Sales and disposals –358 –746 – –
Translation difference 5 –13 – –
Sale of operation – –48 – –
Closing accumulated cost 3,194 3,219 – –
Accumulated depreciation
Opening accumulated depreciation –1,510 –1,914 – –
Sales and disposals 252 628 – –
The year’s depreciation –240 –243 – –
Translation difference –1 7 – –
Sale of operation – 12 – –
Closing accumulated depreciation –1,499 –1,510 – –
Accumulated impairment losses
Opening accumulated impairment losses –85 –56 – –
Sales and disposals 48 13 – –
The year’s impairment losses –11 –42 – –
Closing accumulated impairment losses –48 –85 – –
Closing carrying amount 1,647 1,624 – –
Impairment losses refer to excess buses whose carrying amounts exceed their fair market value.
Th e year’s purchases include assets acquired through fi nance leases amounting to SEK 306 million (931). Th e total historical cost of the Group’s fi nance lease contracts
amounts to SEK 1,248 million (942).
Cont’d. NOTE 13
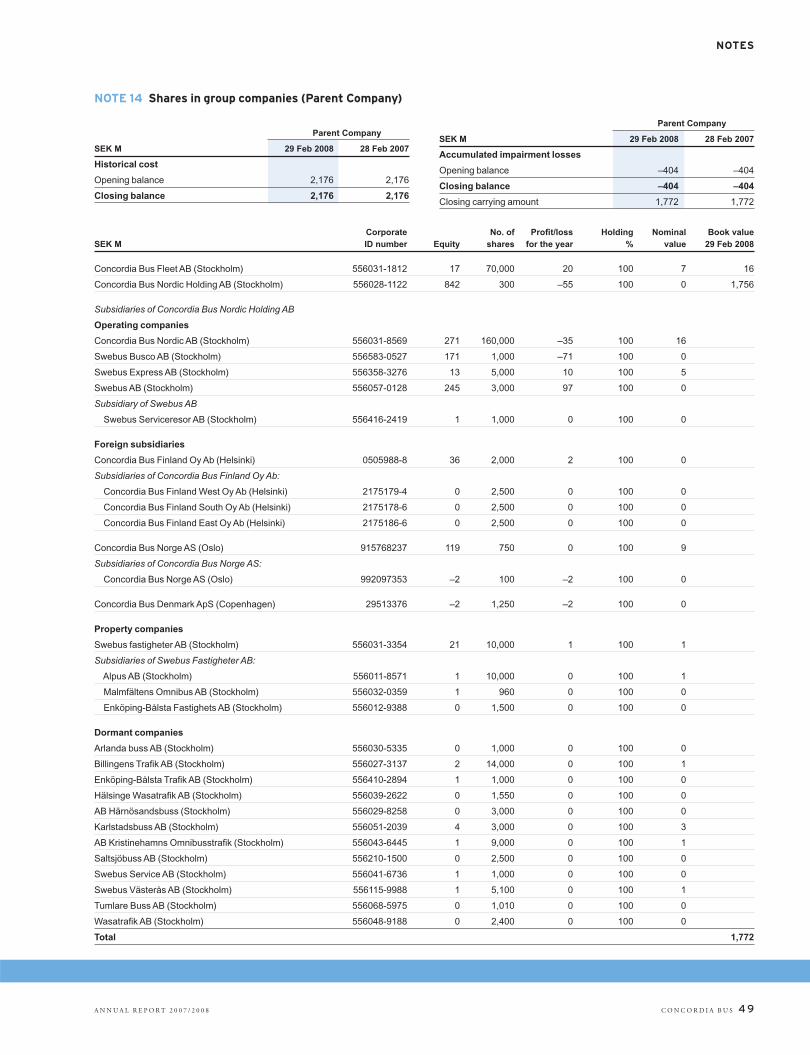
NOTES
A N N U A L R E P O R T 2 0 0 7 / 2 0 0 8 C O N C O R D I A B U S 4 9
NOTE 14 Shares in group companies (Parent Company)
Parent Company
SEK M 29 Feb 2008 28 Feb 2007
Historical cost
Opening balance 2,176 2,176
Closing balance 2,176 2,176
Parent Company
SEK M 29 Feb 2008 28 Feb 2007
Accumulated impairment losses
Opening balance –404 –404
Closing balance –404 –404
Closing carrying amount 1,772 1,772
Corporate No. of Profi t/loss Holding Nominal Book valueSEK M ID number Equity shares for the year % value 29 Feb 2008
Concordia Bus Fleet AB (Stockholm) 556031-1812 17 70,000 20 100 7 16
Concordia Bus Nordic Holding AB (Stockholm) 556028-1122 842 300 –55 100 0 1,756
Subsidiaries of Concordia Bus Nordic Holding AB
Operating companies
Concordia Bus Nordic AB (Stockholm) 556031-8569 271 160,000 –35 100 16
Swebus Busco AB (Stockholm) 556583-0527 171 1,000 –71 100 0
Swebus Express AB (Stockholm) 556358-3276 13 5,000 10 100 5
Swebus AB (Stockholm) 556057-0128 245 3,000 97 100 0
Subsidiary of Swebus AB
Swebus Serviceresor AB (Stockholm) 556416-2419 1 1,000 0 100 0
Foreign subsidiaries
Concordia Bus Finland Oy Ab (Helsinki) 0505988-8 36 2,000 2 100 0
Subsidiaries of Concordia Bus Finland Oy Ab:
Concordia Bus Finland West Oy Ab (Helsinki) 2175179-4 0 2,500 0 100 0
Concordia Bus Finland South Oy Ab (Helsinki) 2175178-6 0 2,500 0 100 0
Concordia Bus Finland East Oy Ab (Helsinki) 2175186-6 0 2,500 0 100 0
Concordia Bus Norge AS (Oslo) 915768237 119 750 0 100 9
Subsidiaries of Concordia Bus Norge AS:
Concordia Bus Norge AS (Oslo) 992097353 –2 100 –2 100 0
Concordia Bus Denmark ApS (Copenhagen) 29513376 –2 1,250 –2 100 0
Property companies
Swebus fastigheter AB (Stockholm) 556031-3354 21 10,000 1 100 1
Subsidiaries of Swebus Fastigheter AB:
Alpus AB (Stockholm) 556011-8571 1 10,000 0 100 1
Malmfältens Omnibus AB (Stockholm) 556032-0359 1 960 0 100 0
Enköping-Bålsta Fastighets AB (Stockholm) 556012-9388 0 1,500 0 100 0
Dormant companies
Arlanda buss AB (Stockholm) 556030-5335 0 1,000 0 100 0
Billingens Trafi k AB (Stockholm) 556027-3137 2 14,000 0 100 1
Enköping-Bålsta Trafi k AB (Stockholm) 556410-2894 1 1,000 0 100 0
Hälsinge Wasatrafi k AB (Stockholm) 556039-2622 0 1,550 0 100 0
AB Härnösandsbuss (Stockholm) 556029-8258 0 3,000 0 100 0
Karlstadsbuss AB (Stockholm) 556051-2039 4 3,000 0 100 3
AB Kristinehamns Omnibusstrafi k (Stockholm) 556043-6445 1 9,000 0 100 1
Saltsjöbuss AB (Stockholm) 556210-1500 0 2,500 0 100 0
Swebus Service AB (Stockholm) 556041-6736 1 1,000 0 100 0
Swebus Västerås AB (Stockholm) 556115-9988 1 5,100 0 100 1
Tumlare Buss AB (Stockholm) 556068-5975 0 1,010 0 100 0
Wasatrafi k AB (Stockholm) 556048-9188 0 2,400 0 100 0
Total 1,772
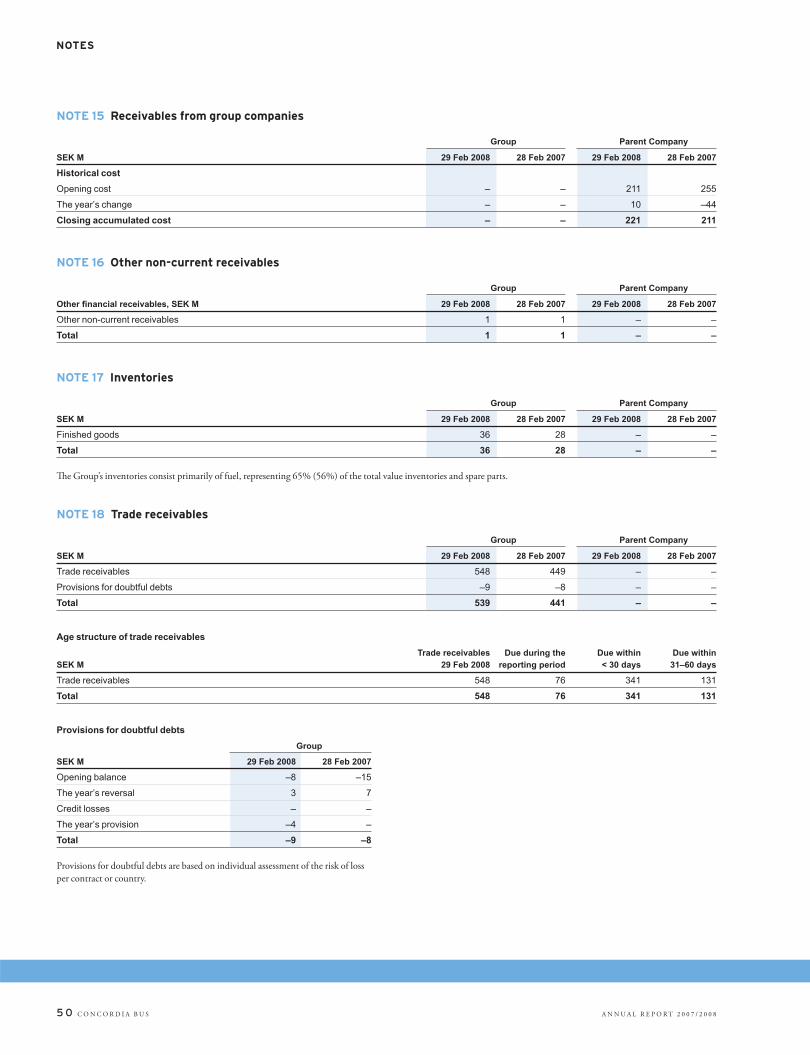
5 0 C O N C O R D I A B U S A N N U A L R E P O R T 2 0 0 7 / 2 0 0 8
NOTES
NOTE 15 Receivables from group companies
Group Parent Company
SEK M 29 Feb 2008 28 Feb 2007 29 Feb 2008 28 Feb 2007
Historical cost
Opening cost – – 211 255
The year’s change – – 10 –44
Closing accumulated cost – – 221 211
NOTE 16 Other non-current receivables
Group Parent Company
Other fi nancial receivables, SEK M 29 Feb 2008 28 Feb 2007 29 Feb 2008 28 Feb 2007
Other non-current receivables 1 1 – –
Total 1 1 – –
NOTE 17 Inventories
Group Parent Company
SEK M 29 Feb 2008 28 Feb 2007 29 Feb 2008 28 Feb 2007
Finished goods 36 28 – –
Total 36 28 – –
Th e Group’s inventories consist primarily of fuel, representing 65% (56%) of the total value inventories and spare parts.
NOTE 18 Trade receivables
Group Parent Company
SEK M 29 Feb 2008 28 Feb 2007 29 Feb 2008 28 Feb 2007
Trade receivables 548 449 – –
Provisions for doubtful debts –9 –8 – –
Total 539 441 – –
Age structure of trade receivables
Trade receivables Due during the Due within Due withinSEK M 29 Feb 2008 reporting period < 30 days 31–60 days
Trade receivables 548 76 341 131
Total 548 76 341 131
Provisions for doubtful debts
Group
SEK M 29 Feb 2008 28 Feb 2007
Opening balance –8 –15
The year’s reversal 3 7
Credit losses – –
The year’s provision –4 –
Total –9 –8
Provisions for doubtful debts are based on individual assessment of the risk of loss
per contract or country.

NOTES
A N N U A L R E P O R T 2 0 0 7 / 2 0 0 8 C O N C O R D I A B U S 5 1
NOTE 19 Deferred expenses and accrued income
Group Parent Company
SEK M 29 Feb 2008 28 Feb 2007 29 Feb 2008 28 Feb 2007
Accrued transport revenues – transport contracts 35 56 – –
Other deferred expenses 68 132 1 2
Total 103 188 1 2
Accrued transport revenues refer mainly to earned but not yet invoiced compensation for transport services performed.
NOTE 20 Cash and cash equivalents and blocked bank accounts
Group Parent Company
SEK M 29 Feb 2008 28 Feb 2007 29 Feb 2008 28 Feb 2007
Cash and cash equivalents 455 242 53 50
Blocked bank accounts 74 109 1 –
Th e item cash and cash equivalents consist of the company’s checking accounts tied to the Group account, in which Concordia Bus Nordic AB is the principal account holder.
Blocked bank accounts consist of deposits to secure bank guarantees and lease contracts. Among other things, bank guarantees have been furnished as security for Concor-
dia Bus Nordic’s pension liability, Concordia Bus Norge AS’s obligations under transport contracts in Oslo, Swebus and Swebus Express’s obligations pursuant to the Trans-
port Guarantee Act and Swebus AB’s obligations regarding electricity purchases. Swebus AB has deposited funds under a lease contract for a bus.
NOTE 21 Changes in equity
Share capitalAccording to the articles of association for Concordia Bus AB, the share capital
shall amount to not less than SEK 15,000,000 and not more than SEK
60,000,000. Th e company’s shares are issued in two classes, common shares and
preference shares. Th e common shares grant the right to one vote and the prefer-
ence shares to one-tenth of one vote each.
All preference shares, 5,000,000, with a quota value of SEK 1 each, were issued
at a price of SEK 102, and the common shares, 20,000,000 with a quota value of
SEK 1 each, are fully paid up. Th ere are share option programs for senior executives
which can have a dilutive eff ect on the share capital. No treasury shares are held by
the company or its subsidiaries.
Each preference share entitles the holder to an annual dividend in an amount
equal to 16.5% of SEK 102 plus accrued and capitalized but unpaid dividends at
5 January and 5 July. No dividends are paid on the common shares until those on
the preference shares have been paid. In the event of the company’s dissolution or
liquidation, amounts available for distribution to the company’s shareholders
should be allocated as follows:
• Firstly, to the holders of preference shares in an amount corresponding to
accrued and capitalized but unpaid dividends on the preference shares for the
period until the date of the decision to dissolve or liquidate the company.
• Secondly, to the holders of preference shares in an amount corresponding to
SEK 102 per preference share.
• Th irdly, to the holders of preference shares in an amount corresponding to
the premium that may be paid, whereby the date of the decision to dissolve or
liquidate the company shall be the same as the date of the Board’s decision to
redeem the shares.
Th e available amount then remaining for distribution is divided equally between
the common shares.
Th e preference share does not entail the right to redemption. If the company
decides on the redemption of preference shares after 4 January 2010, redemption
will take place at a price equal to the issue price of SEK 102 each. If redemption
takes place prior to this date, it will take place at a higher predetermined price. Th e
redemption about per preference share shall be;
• SEK 102 plus a premium corresponding to 5.0% of SEK 102, plus such
accrued and capitalized but unpaid dividends, if the Board or Annual General
Meeting decides on redemption during the period from 5 January 2007 to
4 January 2008.
• SEK 102 plus a premium corresponding to 3.0% of SEK 102, plus such
accrued and capitalized but unpaid dividends, if the Board or Annual General
Meeting decides on redemption during the period from 5 January 2008 to
4 January 2009.
• SEK 102 plus a premium corresponding to 1.0% of SEK 102, plus such
accrued and capitalized but unpaid dividends, if the Board or Annual General
Meeting decides on redemption during the period from 5 January 2009 to
4 January 2010.
• SEK 102 plus such accrued and capitalized but unpaid dividends, if the Board
or Annual General Meeting decides on redemption during the period from
4 January 2010.
Consequently, if redemption takes place on 1 February 2010 the redemption
amount per preference share shall be SEK 102 plus accrued and capitalized but
unpaid dividends.
Concordia Bus’s total capital consists of equity and borrowed capital. Th e
company’s objective is to generate profi ts for the shareholders by increasing the
value of managed equity. Changes in the managed equity are shown below. Th ere
are no external capital requirements other than those set out in the Swedish Com-
panies Act. Concordia Bus currently has no dividend policy. Th e conditions for
borrowed capital are described in Note 25.
Reconciliation of share capital, SEK M Common Preference shares shares
Opening balance 20,000,000 5,000,000
Closing balance 20,000,000 5,000,000
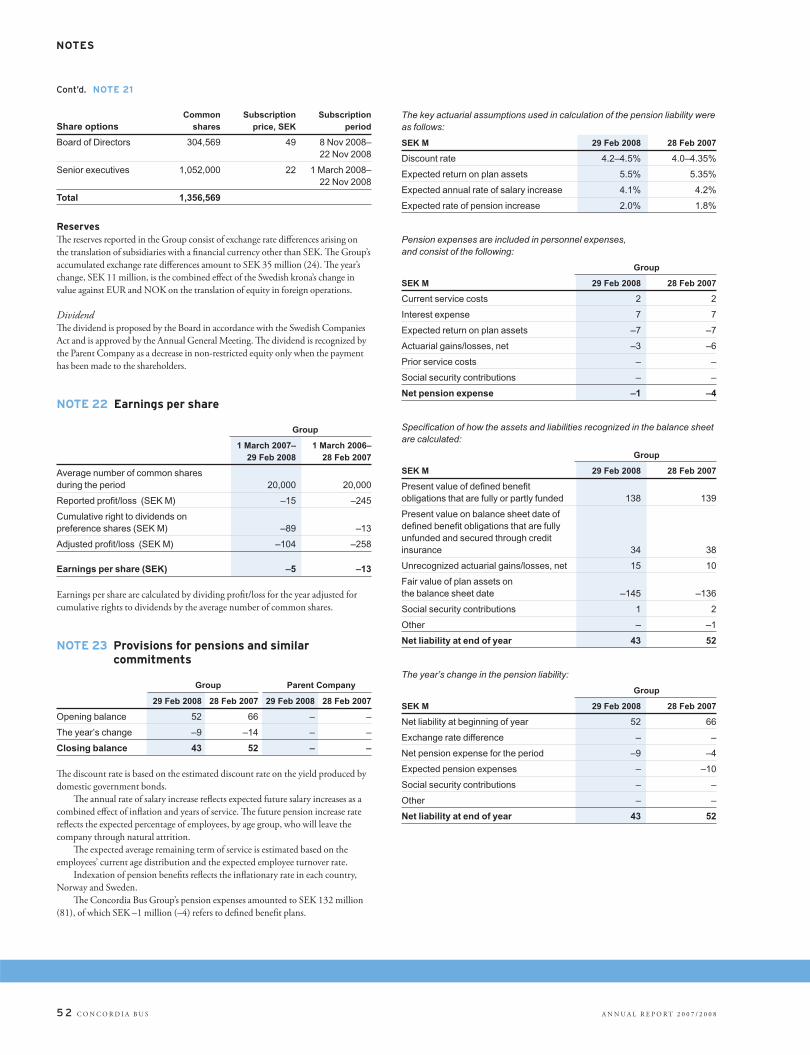
5 2 C O N C O R D I A B U S A N N U A L R E P O R T 2 0 0 7 / 2 0 0 8
NOTES
Common Subscription SubscriptionShare options shares price, SEK period
Board of Directors 304,569 49 8 Nov 2008– 22 Nov 2008
Senior executives 1,052,000 22 1 March 2008– 22 Nov 2008
Total 1,356,569
ReservesTh e reserves reported in the Group consist of exchange rate diff erences arising on
the translation of subsidiaries with a fi nancial currency other than SEK. Th e Group’s
accumulated exchange rate diff erences amount to SEK 35 million (24). Th e year’s
change, SEK 11 million, is the combined eff ect of the Swedish krona’s change in
value against EUR and NOK on the translation of equity in foreign operations.
DividendTh e dividend is proposed by the Board in accordance with the Swedish Companies
Act and is approved by the Annual General Meeting. Th e dividend is recognized by
the Parent Company as a decrease in non-restricted equity only when the payment
has been made to the shareholders.
NOTE 22 Earnings per share
Group
1 March 2007– 1 March 2006– 29 Feb 2008 28 Feb 2007
Average number of common shares during the period 20,000 20,000
Reported profi t/loss (SEK M) –15 –245
Cumulative right to dividends on preference shares (SEK M) –89 –13
Adjusted profi t/loss (SEK M) –104 –258
Earnings per share (SEK) –5 –13
Earnings per share are calculated by dividing profi t/loss for the year adjusted for
cumulative rights to dividends by the average number of common shares.
NOTE 23 Provisions for pensions and similar commitments
Group Parent Company
29 Feb 2008 28 Feb 2007 29 Feb 2008 28 Feb 2007
Opening balance 52 66 – –
The year’s change –9 –14 – –
Closing balance 43 52 – –
Th e discount rate is based on the estimated discount rate on the yield produced by
domestic government bonds.
Th e annual rate of salary increase refl ects expected future salary increases as a
combined eff ect of infl ation and years of service. Th e future pension increase rate
refl ects the expected percentage of employees, by age group, who will leave the
company through natural attrition.
Th e expected average remaining term of service is estimated based on the
employees’ current age distribution and the expected employee turnover rate.
Indexation of pension benefi ts refl ects the infl ationary rate in each country,
Norway and Sweden.
Th e Concordia Bus Group’s pension expenses amounted to SEK 132 million
(81), of which SEK –1 million (–4) refers to defi ned benefi t plans.
The key actuarial assumptions used in calculation of the pension liability were as follows:
SEK M 29 Feb 2008 28 Feb 2007
Discount rate 4.2–4.5% 4.0–4.35%
Expected return on plan assets 5.5% 5.35%
Expected annual rate of salary increase 4.1% 4.2%
Expected rate of pension increase 2.0% 1.8%
Pension expenses are included in personnel expenses, and consist of the following:
Group
SEK M 29 Feb 2008 28 Feb 2007
Current service costs 2 2
Interest expense 7 7
Expected return on plan assets –7 –7
Actuarial gains/losses, net –3 –6
Prior service costs – –
Social security contributions – –
Net pension expense –1 –4
Specifi cation of how the assets and liabilities recognized in the balance sheet are calculated:
Group
SEK M 29 Feb 2008 28 Feb 2007
Present value of defi ned benefi t obligations that are fully or partly funded 138 139
Present value on balance sheet date of defi ned benefi t obligations that are fully unfunded and secured through credit insurance 34 38
Unrecognized actuarial gains/losses, net 15 10
Fair value of plan assets on the balance sheet date –145 –136
Social security contributions 1 2
Other – –1
Net liability at end of year 43 52
The year’s change in the pension liability:
Group
SEK M 29 Feb 2008 28 Feb 2007
Net liability at beginning of year 52 66
Exchange rate difference – –
Net pension expense for the period –9 –4
Expected pension expenses – –10
Social security contributions – –
Other – –
Net liability at end of year 43 52
Cont’d. NOTE 21

NOTES
A N N U A L R E P O R T 2 0 0 7 / 2 0 0 8 C O N C O R D I A B U S 5 3
Breakdown of plan assets
Actual market value of plan assets on the balance sheet date:
Group
SEK M 29 Feb 2008 Percent 28 Feb 2007 Percent
Fixed-income securities, cash and cash equivalents 78 54 80 59
Shares and other investments 67 46 56 41
Total 145 100 136 100
Future paymentsTh e pension liabilities are secured partly through blocked bank accounts and partly
through credit insurance.
Given the applied actuarial assumptions, Concordia expects the following paid
benefi ts over the coming fi ve-year period.
Group
Future payments, SEK M 2008 2009 2010 2011 2012
Expected paid benefi ts 14 14 14 13 13
NOTE 24 Other provisions
Group
Other provisions, SEK M 29 Feb 2008 28 Feb 2007
Provisions for onerous contracts 8 6
Provisions for damage to vehicles and third parties 30 40
Provisions for environmental obligations 7 6
Total 45 52
Group
Provisions for onerous contracts, SEK M 29 Feb 2008 28 Feb 2007
Opening balance 6 18
Reversal – –15
The year’s provisions 2 3
Closing balance 8 6
Group
Provisions for damage to vehicles and third parties, SEK M 29 Feb 2008 28 Feb 2007
Opening balance 40 31
Reversal –10 –
The year’s provisions – 9
Closing balance 30 40
Group
Provisions for environmental obligations for lease land and facilities, SEK M 29 Feb 2008 28 Feb 2007
Opening balance 6 2
Reversal – –
The year’s provisions 1 4
Closing balance 7 6
Cont’d. NOTE 23
NOTE 25 Interest-bearing non-current liabilities
Group Parent Company
SEK M 29 Feb 2008 28 Feb 2007 29 Feb 2008 28 Feb 2007
Bond loan “Senior Subordinated Notees” 11% – 1 – 1
Bond loan “Senior Secured Notees” 9.125% 1,220 1,204 – –
Finance lease liabilities 1,115 898 – –
Capitalized borrowing costs –14 –23 – –
Total 2,321 2,080 – 1
Less, current portion –107 –82 – –1
Total 2,214 1,998 – –
Non-current liabilities include corporate bonds issued by Concordia Bus Nordic AB in an amount of EUR 139 million. Th e corporate bonds carry fi xed interest at a rate of
9.125% that is paid semi-annually (on 1 February and 1 August). Th e corporate bonds mature in full for payment in August 2009.
In connection with the issuance of corporate bonds for a total of EUR 130 million, Concordia Bus Nordic AB and its subsidiaries have undertaken to fulfi ll a number of
fi nancial covenants. Among other things, these fi nancial covenants mean that Concordia Bus Nordic AB and its subsidiaries have limited opportunities to raise additional
loans, enter into fi nance lease or sale and leaseback contracts, carry out certain types of investments and divest assets. Furthermore, these covenants create certain restrictions
on payment of dividends by Concordia Bus Nordic AB and its subsidiaries. See also Note 32 regarding the company’s fi nancing. All of these covenants were fulfi lled at 29 Feb-
ruary 2008.
Capitalized borrowing costs refer to expenses arising in connection with raising of loans. Th ese are expensed on a straight-line basis over the term of a loan, unless the loan
is redeemed in advance, in which case the capitalized charge is expensed in full.
Cont’d. NOTE 24
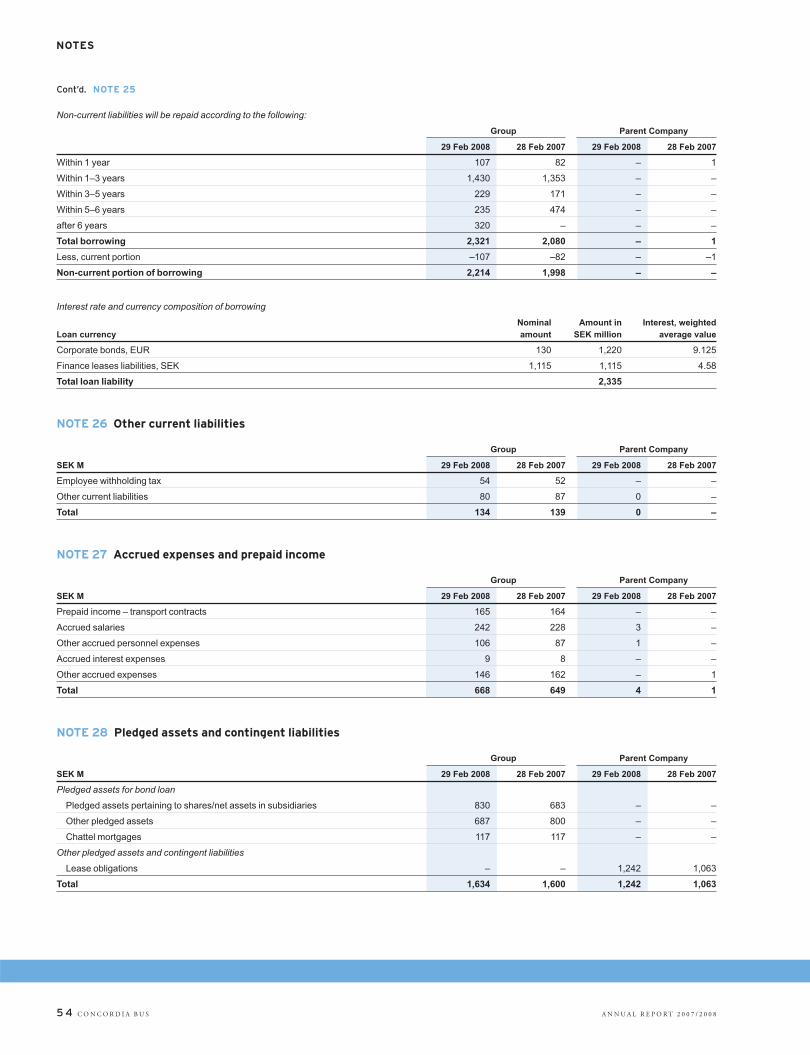
5 4 C O N C O R D I A B U S A N N U A L R E P O R T 2 0 0 7 / 2 0 0 8
NOTES
Non-current liabilities will be repaid according to the following:
Group Parent Company
29 Feb 2008 28 Feb 2007 29 Feb 2008 28 Feb 2007
Within 1 year 107 82 – 1
Within 1–3 years 1,430 1,353 – –
Within 3–5 years 229 171 – –
Within 5–6 years 235 474 – –
after 6 years 320 – – –
Total borrowing 2,321 2,080 – 1
Less, current portion –107 –82 – –1
Non-current portion of borrowing 2,214 1,998 – –
Interest rate and currency composition of borrowing
Nominal Amount in Interest, weighted Loan currency amount SEK million average value
Corporate bonds, EUR 130 1,220 9.125
Finance leases liabilities, SEK 1,115 1,115 4.58
Total loan liability 2,335
NOTE 26 Other current liabilities
Group Parent Company
SEK M 29 Feb 2008 28 Feb 2007 29 Feb 2008 28 Feb 2007
Employee withholding tax 54 52 – –
Other current liabilities 80 87 0 –
Total 134 139 0 –
NOTE 27 Accrued expenses and prepaid income
Group Parent Company
SEK M 29 Feb 2008 28 Feb 2007 29 Feb 2008 28 Feb 2007
Prepaid income – transport contracts 165 164 – –
Accrued salaries 242 228 3 –
Other accrued personnel expenses 106 87 1 –
Accrued interest expenses 9 8 – –
Other accrued expenses 146 162 – 1
Total 668 649 4 1
NOTE 28 Pledged assets and contingent liabilities
Group Parent Company
SEK M 29 Feb 2008 28 Feb 2007 29 Feb 2008 28 Feb 2007
Pledged assets for bond loan
Pledged assets pertaining to shares/net assets in subsidiaries 830 683 – –
Other pledged assets 687 800 – –
Chattel mortgages 117 117 – –
Other pledged assets and contingent liabilities
Lease obligations – – 1,242 1,063
Total 1,634 1,600 1,242 1,063
Cont’d. NOTE 25
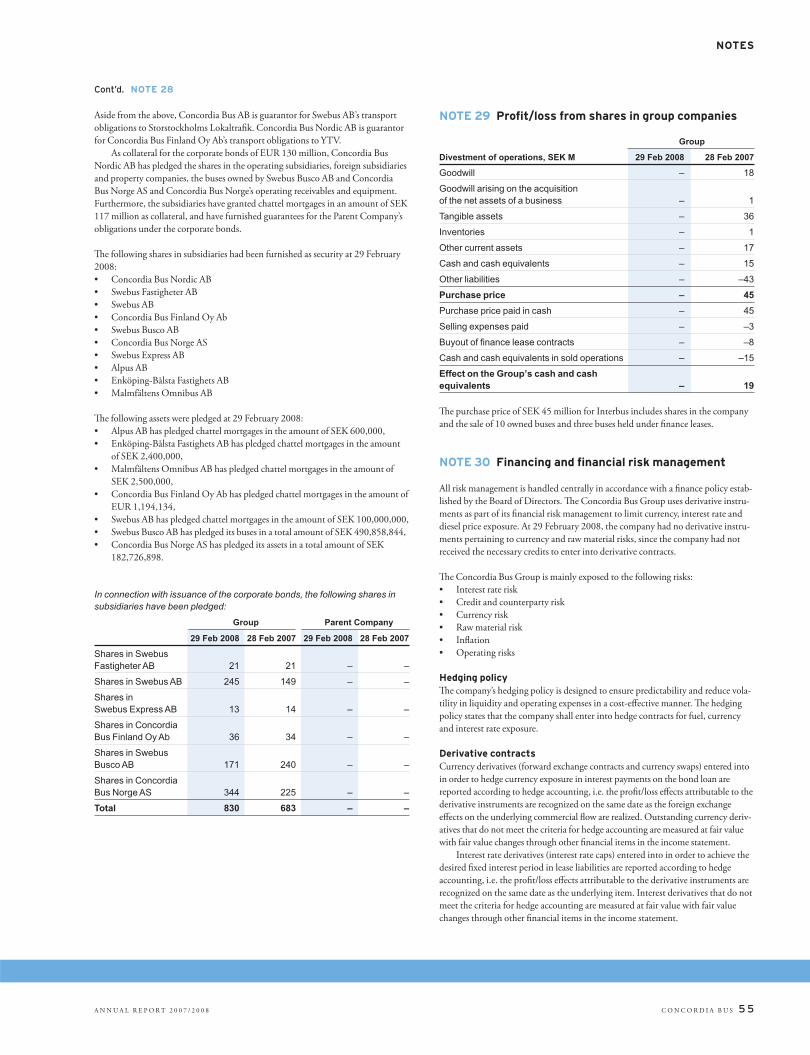
NOTES
A N N U A L R E P O R T 2 0 0 7 / 2 0 0 8 C O N C O R D I A B U S 5 5
Aside from the above, Concordia Bus AB is guarantor for Swebus AB’s transport
obligations to Storstockholms Lokaltrafi k. Concordia Bus Nordic AB is guarantor
for Concordia Bus Finland Oy Ab’s transport obligations to YTV.
As collateral for the corporate bonds of EUR 130 million, Concordia Bus
Nordic AB has pledged the shares in the operating subsidiaries, foreign subsidiaries
and property companies, the buses owned by Swebus Busco AB and Concordia
Bus Norge AS and Concordia Bus Norge’s operating receivables and equipment.
Furthermore, the subsidiaries have granted chattel mortgages in an amount of SEK
117 million as collateral, and have furnished guarantees for the Parent Company’s
obligations under the corporate bonds.
Th e following shares in subsidiaries had been furnished as security at 29 February
2008:
• Concordia Bus Nordic AB
• Swebus Fastigheter AB
• Swebus AB
• Concordia Bus Finland Oy Ab
• Swebus Busco AB
• Concordia Bus Norge AS
• Swebus Express AB
• Alpus AB
• Enköping-Bålsta Fastighets AB
• Malmfältens Omnibus AB
Th e following assets were pledged at 29 February 2008:
• Alpus AB has pledged chattel mortgages in the amount of SEK 600,000,
• Enköping-Bålsta Fastighets AB has pledged chattel mortgages in the amount
of SEK 2,400,000,
• Malmfältens Omnibus AB has pledged chattel mortgages in the amount of
SEK 2,500,000,
• Concordia Bus Finland Oy Ab has pledged chattel mortgages in the amount of
EUR 1,194,134,
• Swebus AB has pledged chattel mortgages in the amount of SEK 100,000,000,
• Swebus Busco AB has pledged its buses in a total amount of SEK 490,858,844,
• Concordia Bus Norge AS has pledged its assets in a total amount of SEK
182,726,898.
In connection with issuance of the corporate bonds, the following shares in subsidiaries have been pledged:
Group Parent Company
29 Feb 2008 28 Feb 2007 29 Feb 2008 28 Feb 2007
Shares in Swebus Fastigheter AB 21 21 – –
Shares in Swebus AB 245 149 – –
Shares in Swebus Express AB 13 14 – –
Shares in Concordia Bus Finland Oy Ab 36 34 – –
Shares in Swebus Busco AB 171 240 – –
Shares in Concordia Bus Norge AS 344 225 – –
Total 830 683 – –
NOTE 29 Profi t/loss from shares in group companies
Group
Divestment of operations, SEK M 29 Feb 2008 28 Feb 2007
Goodwill – 18
Goodwill arising on the acquisition of the net assets of a business – 1
Tangible assets – 36
Inventories – 1
Other current assets – 17
Cash and cash equivalents – 15
Other liabilities – –43
Purchase price – 45
Purchase price paid in cash – 45
Selling expenses paid – –3
Buyout of fi nance lease contracts – –8
Cash and cash equivalents in sold operations – –15
Effect on the Group’s cash and cash equivalents – 19
Th e purchase price of SEK 45 million for Interbus includes shares in the company
and the sale of 10 owned buses and three buses held under fi nance leases.
NOTE 30 Financing and fi nancial risk management
All risk management is handled centrally in accordance with a fi nance policy estab-
lished by the Board of Directors. Th e Concordia Bus Group uses derivative instru-
ments as part of its fi nancial risk management to limit currency, interest rate and
diesel price exposure. At 29 February 2008, the company had no derivative instru-
ments pertaining to currency and raw material risks, since the company had not
received the necessary credits to enter into derivative contracts.
Th e Concordia Bus Group is mainly exposed to the following risks:
• Interest rate risk
• Credit and counterparty risk
• Currency risk
• Raw material risk
• Infl ation
• Operating risks
Hedging policyTh e company’s hedging policy is designed to ensure predictability and reduce vola-
tility in liquidity and operating expenses in a cost-eff ective manner. Th e hedging
policy states that the company shall enter into hedge contracts for fuel, currency
and interest rate exposure.
Derivative contracts Currency derivatives (forward exchange contracts and currency swaps) entered into
in order to hedge currency exposure in interest payments on the bond loan are
reported according to hedge accounting, i.e. the profi t/loss eff ects attributable to the
derivative instruments are recognized on the same date as the foreign exchange
eff ects on the underlying commercial fl ow are realized. Outstanding currency deriv-
atives that do not meet the criteria for hedge accounting are measured at fair value
with fair value changes through other fi nancial items in the income statement.
Interest rate derivatives (interest rate caps) entered into in order to achieve the
desired fi xed interest period in lease liabilities are reported according to hedge
accounting, i.e. the profi t/loss eff ects attributable to the derivative instruments are
recognized on the same date as the underlying item. Interest derivatives that do not
meet the criteria for hedge accounting are measured at fair value with fair value
changes through other fi nancial items in the income statement.
Cont’d. NOTE 28

5 6 C O N C O R D I A B U S A N N U A L R E P O R T 2 0 0 7 / 2 0 0 8
NOTES
Interest rate riskInterest rate risk refers the risk that movements in market interest rates will nega-
tively aff ect the Group’s net interest income. Th e rate at which interest rate fl uctua-
tions aff ect net interest income depends on the fi xed interest period of the loans.
Th e Group is primarily exposed to interest rate risk through the company’s fi nance
and operating leases. Th e lease charges are based, among other things, on a variable
interest rate. In order to reduce interest rate exposure, Concordia Bus AB has
entered into interest rate derivatives which fi xed the interest rate for a portion of
the interest liability. Th e outstanding derivatives at 29 February 2008 amounted to
SEK 3,720 million. All derivatives will expire on 27 February 2009.
Credit and counterparty riskTh e Group’s fi nancial transactions give rise to credit risks in relation to fi nancial
counterparties. Concordia Bus’s fi nance policy states that credit risk shall be limited
by only accepting counterparties with high credit ratings and through established
limits. Commercial credit risks are limited by a diversifi ed customer base with high
credit ratings. Provisions have been made for trade receivables deemed as doubtful,
and have aff ected operating profi t/loss.
Currency riskCurrency exposure arises in connection with payment fl ows in foreign currency
(transaction exposure) and on the translation of foreign subsidiaries’ income state-
ments and balance sheets to SEK (translation exposure).
Transaction exposure – Th e Concordia Bus Group is exposed to exchange rate
movements on its bond loan, which was raised in EUR. Th e Group’s fi nance policy
states that all currency exposure for the coming 12 months shall be hedged. An
exchange loss of more than SEK 3 million in the event of a 10% SEK devaluation
shall be hedged in an amount of at least 50%. Concordia has not received the nec-
essary credits to enter into derivative contracts to implement currency hedges.
Based on the Group’s interest payments in EUR, totaling EUR 12 million for
the coming 12 months, interest expenses would increase by SEK 11 million in the
event of a 10% devaluation of SEK against EUR at 29 February 2008.
Th e Group is also exposed to exchange rate movements through its purchases
of diesel. Diesel is traded in the international commodities markets in US dollars.
Th rough revenue indices in its contracts with public transport authorities, the
Group is partly compensated for fl uctuations in diesel prices. According to calcula-
tions, this index compensation reduces exposure to diesel price fl uctuations by
57%. Th e Concordia Bus Group had no diesel derivatives at 29 February 2008.
Based on the budgeted diesel consumption, a 10% devaluation of SEK against
USD would increase the diesel cost by SEK 12 million for the following fi scal year.
Translation exposure – Concordia Bus’s currency exposure on translation of
foreign subsidiaries is normally not hedged.
Raw material riskTh e Group is exposed to movements in raw materials through its purchases of diesel.
Diesel is traded in the international commodities markets in US dollars. Th rough
revenue indices in its contracts with public transport authorities, the Group is
partly compensated for fl uctuations in diesel prices. According to calculations, this
index compensation reduces exposure to diesel price fl uctuations by 57%. Th e
Concordia Bus Group had no diesel derivatives at 29 February 2008. Based on the
budgeted diesel consumption, an increased of USD 1 in the diesel price per tonne
would increase the diesel cost by approximately SEK 0.2 million for the following
fi nancial year. Th e calculation includes the estimated index compensation.
Infl ationInfl ation had no signifi cant impact on operations during the year. Since the terms
of the contracts include compensation for costs through the agreed indices (which
include infl ation), which do not exactly follow the cost trend in the industry, full
compensation is currently not received for cost increases since the industry’s costs
are rising faster than the amount of compensation received through indexation
from the public transport authorities.
Operating risksOperating risk is the risk for a loss due to shortcomings in internal routines and
systems. Concordia Bus’s risk management is based on a number of internally
established rules and guidelines, as well as policies adopted by the Board. Key nor-
mative documents include the fi nance policy, instructions for authorization and
other instructions. Th e company carries out continuous controls to regulate and
secure powers and responsibilities in day-to-day operations. Th e subsidiaries have
their own instructions which are based on the rules applied by the Parent Company.
NOTE 31 Financial instruments
Carrying amount
The Group’s fi nancial assets, SEK M 29 Feb 2008 28 Feb 2007
Loans and receivables
Non-current receivables 1 1
Trade receivables 539 441
Other receivables 48 60
Financial assets and liabilities at fair value through profi t or loss
Interest swaps – –
Total Group 588 502
Carrying amount
The Group’s fi nancial liabilities, SEK M 29 Feb 2008 28 Feb 2007
Other fi nancial liabilities
Interest-bearing liabilities, pensions 43 52
Interest-bearing liabilities, loans 2,311 2,080
Trade payables 199 204
Other liabilities 134 139
Financial assets and liabilities at fair value through profi t or loss
Interest swaps – –
Total Group 2,687 2,475
Carrying amount
The Parent Company’s fi nancial assets, SEK M 29 Feb 2008 28 Feb 2007
Loans and receivables
Receivables from group companies, interest-bearing 260 233
Other receivables 2 4
Financial assets and liabilities at fair value through profi t or loss
Interest swaps – –
Total Parent Company 262 237
Carrying amount
The Parent Company’s fi nancial liabilities, SEK M 29 Feb 2008 28 Feb 2007
Other fi nancial liabilities
Liabilities to group companies, interest-bearing 3 1
Other liabilities 1 1
Financial assets and liabilities at fair value through profi t or loss
Interest swaps – –
Total Parent Company 4 2
Cont’d. NOTE 30
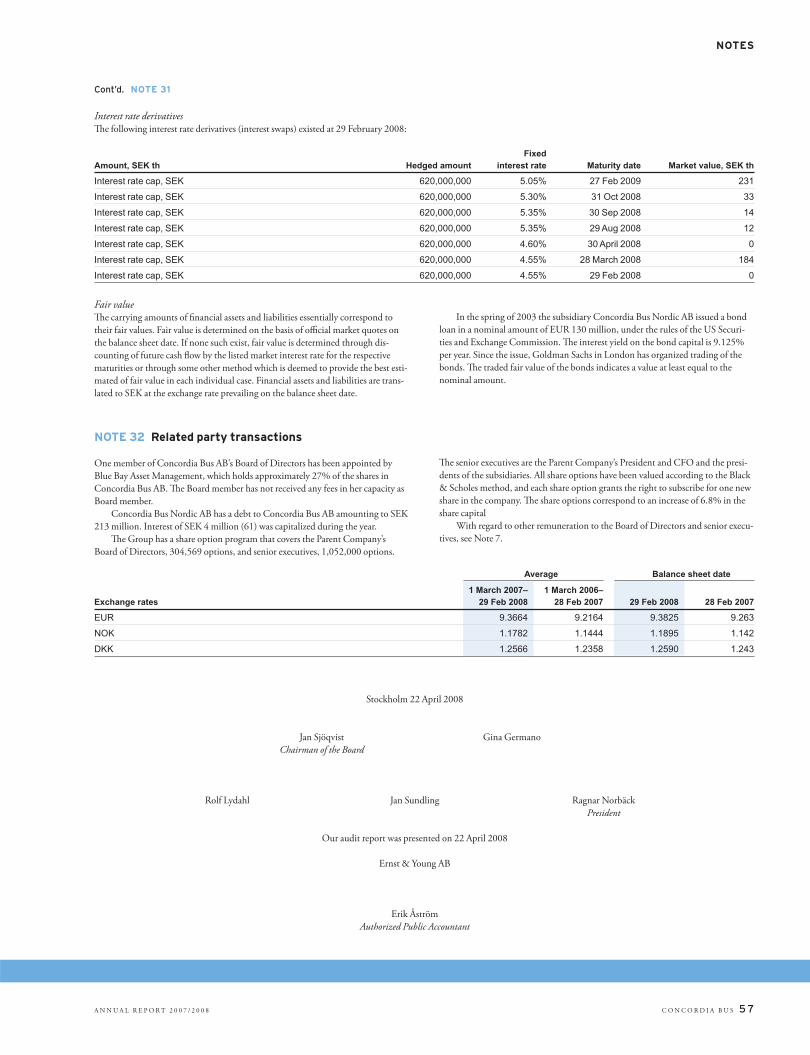
NOTES
A N N U A L R E P O R T 2 0 0 7 / 2 0 0 8 C O N C O R D I A B U S 5 7
Interest rate derivativesTh e following interest rate derivatives (interest swaps) existed at 29 February 2008:
FixedAmount, SEK th Hedged amount interest rate Maturity date Market value, SEK th
Interest rate cap, SEK 620,000,000 5.05% 27 Feb 2009 231
Interest rate cap, SEK 620,000,000 5.30% 31 Oct 2008 33
Interest rate cap, SEK 620,000,000 5.35% 30 Sep 2008 14
Interest rate cap, SEK 620,000,000 5.35% 29 Aug 2008 12
Interest rate cap, SEK 620,000,000 4.60% 30 April 2008 0
Interest rate cap, SEK 620,000,000 4.55% 28 March 2008 184
Interest rate cap, SEK 620,000,000 4.55% 29 Feb 2008 0
Fair valueTh e carrying amounts of fi nancial assets and liabilities essentially correspond to
their fair values. Fair value is determined on the basis of offi cial market quotes on
the balance sheet date. If none such exist, fair value is determined through dis-
counting of future cash fl ow by the listed market interest rate for the respective
maturities or through some other method which is deemed to provide the best esti-
mated of fair value in each individual case. Financial assets and liabilities are trans-
lated to SEK at the exchange rate prevailing on the balance sheet date.
In the spring of 2003 the subsidiary Concordia Bus Nordic AB issued a bond
loan in a nominal amount of EUR 130 million, under the rules of the US Securi-
ties and Exchange Commission. Th e interest yield on the bond capital is 9.125%
per year. Since the issue, Goldman Sachs in London has organized trading of the
bonds. Th e traded fair value of the bonds indicates a value at least equal to the
nominal amount.
Average Balance sheet date
1 March 2007– 1 March 2006–Exchange rates 29 Feb 2008 28 Feb 2007 29 Feb 2008 28 Feb 2007
EUR 9.3664 9.2164 9.3825 9.263
NOK 1.1782 1.1444 1.1895 1.142
DKK 1.2566 1.2358 1.2590 1.243
NOTE 32 Related party transactions
One member of Concordia Bus AB’s Board of Directors has been appointed by
Blue Bay Asset Management, which holds approximately 27% of the shares in
Concordia Bus AB. Th e Board member has not received any fees in her capacity as
Board member.
Concordia Bus Nordic AB has a debt to Concordia Bus AB amounting to SEK
213 million. Interest of SEK 4 million (61) was capitalized during the year.
Th e Group has a share option program that covers the Parent Company’s
Board of Directors, 304,569 options, and senior executives, 1,052,000 options.
Th e senior executives are the Parent Company’s President and CFO and the presi-
dents of the subsidiaries. All share options have been valued according to the Black
& Scholes method, and each share option grants the right to subscribe for one new
share in the company. Th e share options correspond to an increase of 6.8% in the
share capital
With regard to other remuneration to the Board of Directors and senior execu-
tives, see Note 7.
Stockholm 22 April 2008
Jan Sjöqvist Gina Germano
Chairman of the Board
Rolf Lydahl Jan Sundling Ragnar Norbäck
President
Our audit report was presented on 22 April 2008
Ernst & Young AB
Erik Åström
Authorized Public Accountant
Cont’d. NOTE 31

5 8 C O N C O R D I A B U S A N N U A L R E P O R T 2 0 0 7 / 2 0 0 8
Audit reportTo the Annual General Meeting of Concordia Bus AB
Corporate identifi cation number 556576-4569
I have audited the annual accounts, the consolidated accounts, the accounting records and the administration of the Board of
Directors and the President of Concordia Bus AB for the year 1 March 2007 – 29 February 2008. Th e annual accounts and
the consolidated accounts of the company are included in the printed version of this document on pages 25–57. Th e board of
directors and the President are responsible for these accounts and the administration of the company as well as for the applic-
ation of the Annual Accounts Act when preparing the annual accounts and the application of international fi nancial report-
ing standards IFRSs as adopted by the EU and the Annual Accounts Act when preparing the consolidated accounts. My
responsibility is to express an opinion on the annual accounts, the consolidated accounts and the administration based on my
audit.
I conducted my audit in accordance with generally accepted auditing standards in Sweden. Th ose standards require that I
plan and perform the audit to obtain reasonable assurance that the annual accounts and the consolidated accounts are free of
material misstatement. An audit includes examining, on a test basis, evidence supporting the amounts and disclosures in the
accounts. An audit also includes assessing the accounting principles used and their application by the Board of Directors and
the President and signifi cant estimates made by the Board of Directors and the President when preparing the annual accounts
and consolidated accounts as well as evaluating the overall presentation of information in the annual accounts and the con-
solidated accounts. As a basis for my opinion concerning discharge from liability, I examined signifi cant decisions, actions
taken and circumstances of the company in order to be able to determine the liability, if any, to the company of any Board
member or the President. I also examined whether any Board member or the President has, in any other way, acted in contra-
vention of the Companies Act, the Annual Accounts Act or the Articles of Association. I believe that my audit provides a
reasonable basis for my opinion set out below.
Th e annual accounts have been prepared in accordance with the Annual Accounts Act and give a true and fair view of the
company’s fi nancial position and results of operations in accordance with generally accepted accounting principles in Swe-
den. Th e consolidated accounts have been prepared in accordance with international fi nancial reporting standards IFRSs as
adopted by the EU and the Annual Accounts Act and give a true and fair view of the Group’s fi nancial position and results of
operations. Th e statutory administration report is consistent with the other parts of the annual accounts and the consolidated
accounts.
I recommend to the annual meeting of shareholders that the income statements and balance sheets of the Parent Com-
pany and the Group be adopted, that the profi t of the Parent Company be dealt with in accordance with the proposal in the
statutory administration report and that the members of the Board of Directors and the President be discharged from liability
for the fi nancial year.
Stockholm, 22 April 2008
Ernst & Young AB
Erik Åström
Authorized Public Accountant

A N N U A L R E P O R T 2 0 0 7 / 2 0 0 8 C O N C O R D I A B U S 5 9
Addresses
Concordia Bus AB
Solna Strandväg 78SE-171 54 SOLNASweden
Concordia Bus Nordic Holding AB
Solna Strandväg 78SE-171 54 SOLNASweden
Concordia Bus Nordic AB
Solna Strandväg 78SE-171 54 SOLNASweden
Swebus AB
Solna Strandväg 78SE-171 54 SOLNASweden
Concordia Bus Norway AS
Lysaker Torg 12Postboks 54N-1324 LYSAKERNorway
Concordia Bus Finland OY
Klovinpellontie 5FIN-02180 ESPOOFinland
Swebus Express AB
Österängsvägen 3SE-550 05 JÖNKÖPINGSweden
Concordia Bus Fleet AB
Solna Strandväg 78SE-171 54 SolnaSweden
Glossary
Client/Public transport authority
A public sector authority that has been given responsibility for organizing procurement of public transport services in a certain area, normally a county. Awards transport contracts after evaluation of submitted bids.
Concession
Transport contract awarded to a certain operator by a public transport authority without competitive tendering. Not possible after deregulation of the public transport market.
Customers
Passengers, i.e. those who use our services regard-less of whether they pay for the trip directly or via a public transport authority.
Euro 0 – Euro 5, EEV
Different generations of emissions classes for diesel engines.
Express bus
Scheduled long-distance transports that cross at least one county line. In connection with permit-ting, the affected public transport authorities have an objectionary right. An independent operator’s revenue comes exclusively from the passengers.
Gross cost contracts
A transport contract in which the client compensates the operator only for the number of kilometers or hours driven. Ticket revenues go to the client.
Incentive contract
A transport contract in which the client provides the operator with a certain share of variable com-pensation. Based on mutual trust and aimed at achieving better results through higher quality and efficiency. The amount of compensation to the operator increases in proportion to the number of passengers.
Indexation
Recalculation of fixed compensation per kilometer or hour for a new period under a transport contract based on a weighted index for inflation in cost cate-gories that are significant for the operator.
Net cost contract
A transport contract in which the client compen-sates the operator primarily through ticket revenues.
Operator
A provider of public transport services.
Other operating revenue
Sales of primarily fuel and workshop services to external customers.
Transport contract
An agreement between a client and a contractor to perform a specific service at a pre-agreed price. At Concordia Bus a contract with a public transport authority, normally for a period of 5–8 years, to produce public transports at a fixed price with agreed indexation conditions.
Defi nitions
Average number of employees
The number of hours paid divided by normal working hours for a full-time employee.
Earnings per share
Profit for the year adjusted for dividends on p reference shares divided by the average number of common shares.
Earnings per share after full dilution
Profit for the year adjusted for dividends on prefer-ence shares divided by the average weighted num-ber of common shares.
Equity/assets ratio
Shareholders’ equity as a percentage of total assets at the end of the fiscal year.
Net investments
Acquisition cost of investments in fixed assets less sales value of divested fixed assets.
Production: Concordia Bus in association with n3prenör. Printing: Strokirk-Landströms, 2008. Translation: GH Language Solutions ABThe annual report is printed on environmentally friendly FSC-labelled paper. The Forest Stewardship Council (FSC)
promotes environmentally appropriate, socially beneficial and economically viable management of the world’s forests.
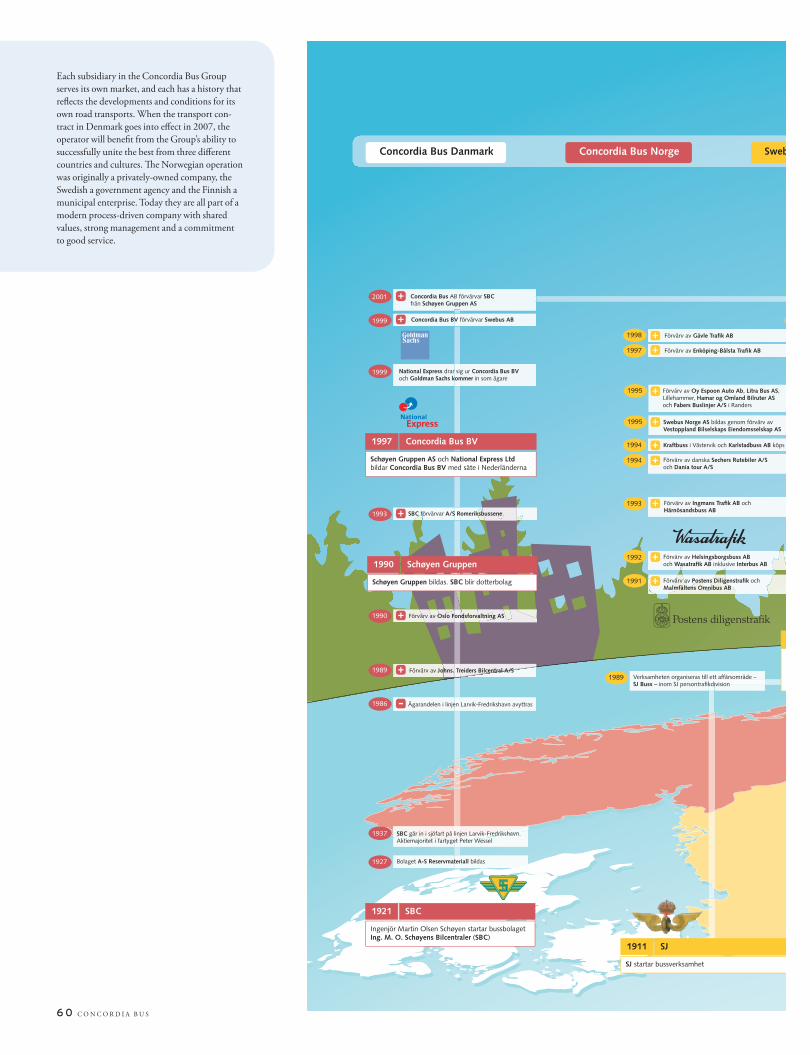
6 0 C O N C O R D I A B U S
Each subsidiary in the Concordia Bus Group
serves its own market, and each has a history that
refl ects the developments and conditions for its
own road transports. When the transport con-
tract in Denmark goes into eff ect in 2007, the
operator will benefi t from the Group’s ability to
successfully unite the best from three diff erent
countries and cultures. Th e Norwegian operation
was originally a privately-owned company, the
Swedish a government agency and the Finnish a
municipal enterprise. Today they are all part of a
modern process-driven company with shared
values, strong management and a commitment
to good service.
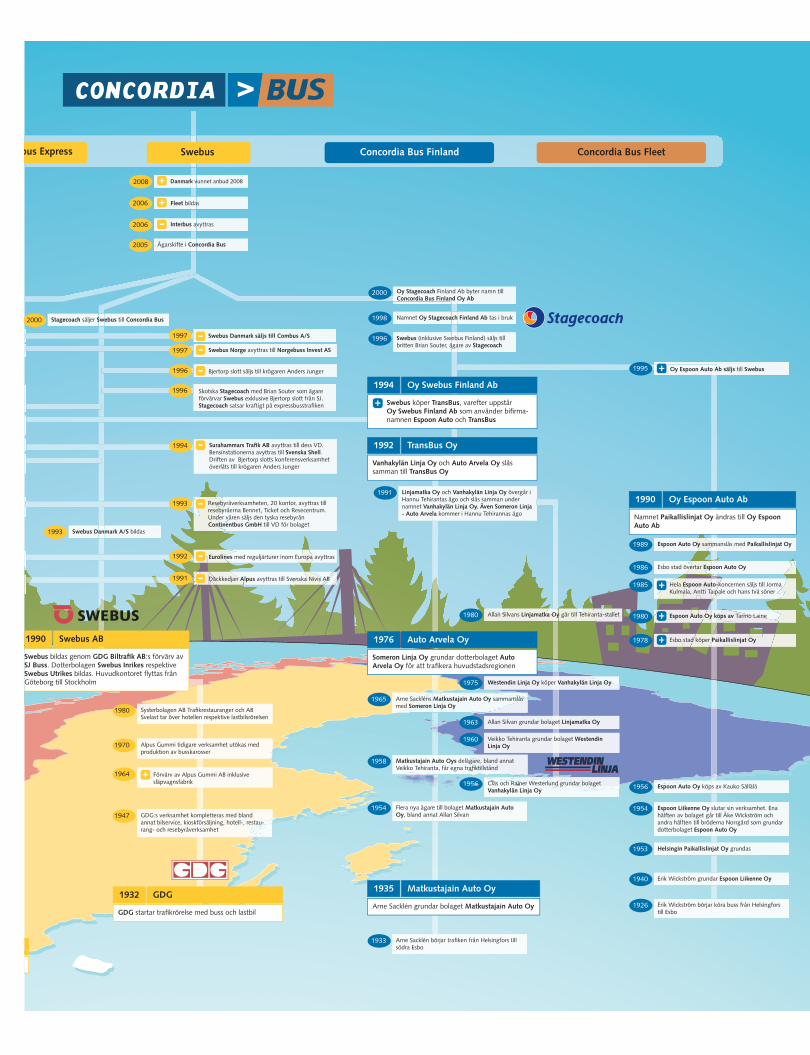
2008 Danmark vunnet anbud 2008

^Concordia Bus AB
Solna Strandväg 78SE-171 54 Solna
Sweden
Tel +46 8 546 300 00Fax +46 8 546 300 55
www.concordiabus.com