concerns, attitudes, and intended practices of healthcare
TRANSCRIPT

Concerns, Attitudes, and Intended Practices of Healthcare Workers toward COVID-19 Vaccination in the Caribbean
www.paho.org
Concerns, Attitudes, and Intended Practices of Healthcare Workers to COVID-19 Vaccination in the Caribbean
Co
ncern
s, Attitu
des, an
d In
tend
ed Practices o
f Health
care Wo
rkers to C
OV
ID-19 V
accinatio
n in
the C
aribb
ean


Washington, D.C. 2021
Concerns, Attitudes, and Intended Practices of Healthcare Workers to COVID-19 Vaccination in the Caribbean

Concerns, Attitudes, and Intended Practices of Healthcare Workers toward COVID-19 Vaccination in the Caribbean
© Pan American Health Organization, 2021
PAHO/CPC/COVID-19/21-0001
Some rights reserved. This work is available under the Creative Commons Attribution-NonCommercial-ShareAlike 3.0 IGO license (CC BY-NC-SA 3.0 IGO; https://creativecommons.org/licenses/by-nc-sa/3.0/igo).
Under the terms of this license, this work may be copied, redistributed, and adapted for non-commercial purposes, provided the new work is issued using the same or equivalent Creative Commons license and it is appropriately cited, as indicated below. In any use of this work, there should be no suggestion that the Pan American Health Organization (PAHO) endorses any specific organization, product, or service. Use of the PAHO logo is not permitted.
Adaptations: If this work is adapted, the following disclaimer should be added along with the suggested citation: “This is an adaptation of an original work by the Pan American Health Organization (PAHO). Views and opinions expressed in the adaptation are the sole responsibility of the author(s) of the adaptation and are not endorsed by PAHO.”
Translation: If this work is translated, the following disclaimer should be added along with the suggested citation: “This translation was not created by the Pan American Health Organization (PAHO). PAHO is not responsible for the content or accuracy of this translation.”
Suggested citation. Concerns, Attitudes, and Intended Practices of Healthcare Workers toward COVID-19 Vaccination in the Caribbean. Washington, D.C.: Pan American Health Organization; 2021. License: CC BY-NC-SA 3.0 IGO.
Cataloguing-in-Publication (CIP) data. CIP data are available at http://iris.paho.org.
Sales, rights, and licensing. To purchase PAHO publications, write to [email protected]. To submit requests for commercial use and queries on rights and licensing, visit http://www.paho.org/permissions.
Third-party materials. If material that is attributed to a third party, such as tables, figures, or images, is reused from this work, it is the user’s responsibility to determine whether permission is needed for that reuse and to obtain permission from the copyright holder. The risk of claims resulting from infringement of any third-party owned material or component from this work rests solely with the user.
General disclaimers. The designations employed and the presentation of the material in this publication do not imply the expression of any opinion whatsoever on the part of PAHO concerning the legal status of any country, territory, city, or area or of its authorities, or concerning the delimitation of its frontiers or boundaries. Dotted and dashed lines on maps represent approximate border lines for which there may not yet be full agreement.
The mention of specific companies or of certain manufacturers’ products does not imply that they are endorsed or recommended by PAHO in preference to others of a similar nature that are not mentioned. Errors and omissions excepted, the names of proprietary products are distinguished by initial capital letters.
All reasonable precautions have been taken by PAHO to verify the information contained in this publication. However, the published material is being distributed without warranty of any kind, either expressed or implied. The responsibility for the interpretation and use of the material lies with the reader. In no event shall PAHO be liable for damages arising from its use.
CPC/IM/2021
Cover image: © PAHO/WHO

ContentsForeword v
Acknowledgments vi
Introduction 1
Methods 3
Survey Instrument Development 3
Survey Implementation 3
Survey Dissemination and Advertising the Survey 3
Sample Size 4
Statistical Analysis 4
Data Cleaning and Categorization 4
Summarizing Open Text Responses 5
Ethics Committee and Confidentiality 6
Results 7
Qualitative Responses Categorized by Behavioral and Social Domain (BeSD) and Construct and by HCW Job Category 19
Attitude toward COVID-19 Vaccines 21
Attitude toward Influenza Vaccines 23
Discussion 25
Strengths and Limitations 28
Recommendations 30
References 32
Annexes 35
Annex A. Questionnaire 36
Annex B. Number of Responses, by Question 39
Annex C. Summary of Responses Including Colored Bars and Chi-Square and Logistic Regression P-Values, by Question 40
Annex D. Survey Pilot Additional Information 57
Annex E. Messaging for Caribbean Healthcare Workers Based on Survey Results 60
iii

List of Figures
Figure 1. Respondents by age, sex, and job category 8
Figure 2. Vaccine hesitancy by HCW category 12
Figure 3. Vaccine hesitancy by HCW subcategory (specialty) 13
Figure 4. Vaccine hesitancy by HCW age group 13
Figure 5. Knowledge about the vaccine to make a decision, by nurse subcategory 14
Figure 6. Knowledge about the vaccine to make a decision, by age 15
Figure 7. Social media as opinion shaper, by age 17
Figure 8. WHO behavior and social determinants domains and constructs for COVID-19 vaccines, Caribbean HCWs survey iteration 19
Figure 9. Qualitative response domains classified using the WHO Behavioral and Social Drivers (BeSD) rubric, all four qualitative questions together 20
Figure 10. Qualitative response domains classified using the WHO Behavioral and Social Drivers (BeSD) rubric, open text questions about COVID-19 vaccines 21
Figure 11. Qualitative response domains classified using the WHO Behavioral and Social Drivers (BeSD) rubric, open text questions about influenza vaccine 23
List of Tables
Table 1. Respondents by country and job category 7
Table 2. Respondents by age, sex, and job category 8
Table 3. Summary of responses by HCW categories, age, and sex 9
Table 4. Readiness: New vaccines carry more risk than older vaccines 10
Table 5. Readiness: Concerns about serious adverse effects of vaccines 11
Table 6. Reasons: Development may be rushed/vaccine may not be thoroughly tested 16
Table 7. Attitudes to taking the influenza vaccine (“I would take the flu vaccine if offered”) 18
Table 8. Recommendations by domains, indicator, intervention category, and description 31
iv HEALTHCARE WORKERS AND COVID-19 VACCINATION IN THE CARIBBEAN

ForewordHealthcare workers have long been recognized as the heroes of the immunization program. Without their tireless
efforts and dedication, the Region of the Americas would not be the global trailblazer in immunization that it is today:
the first region to eliminate multiple diseases and lead the introduction of new vaccines like human papillomavirus (HPV)
and rotavirus to national routine vaccination programs. In fact, the Caribbean specifically has a long history of being
a global leader in immunization, with successes in certification of measles, rubella, and congenital rubella syndrome
elimination and 36 years without a case of polio. One of the key factors contributing to this success has been the
commitment and dedication of national immunization program staff in promoting the benefits of vaccines and ensuring
the vaccination of all eligible children, adolescents, and adults.
Beyond the act of administering vaccines, maintaining necessary cold chains, and conducting surveillance for vaccine-
preventable diseases, healthcare workers play another critical role when it comes to vaccination: building trust between
the public and the immunization program. In fact, healthcare workers are generally cited as the most trusted source of
information on vaccination.
It is thus imperative that healthcare workers themselves are confident in vaccination as a public health good and are
able to transmit this confidence to their patients, family, friends, and community members. However, just as with the
general public, healthcare workers are at risk of falling prey to misinformation about vaccines, especially in the context
of the infodemic that is complicating the response to the COVID-19 pandemic globally.
For these reasons, the Pan American Health Organization (PAHO) set out to understand the attitudes and intents of
healthcare workers in 14 Caribbean countries about routine immunization and COVID-19 vaccination. During April and
May 2021, a mixed-methods survey was carried out to capture the thoughts, opinions, and reasoning of over 1,000
healthcare workers who lent their time to participate in this study.
It is our hope that the findings presented in this report can be of use to public health decisionmakers, policymakers,
communications professionals, and healthcare workers who seek to be vaccine advocates among their peers. By
using social and behavioral data such as that shared here, immunization programs can have more success in targeting
their interventions to build confidence and acceptance for vaccination among key audiences, including Caribbean
healthcare workers.
Cuauhtémoc Ruiz Matus
Chief
Comprehensive Family Immunization Program
Family, Health Promotion, and Life Course Department
Pan American Health Organization
Dean Chambliss
Subregional Program Director,
Caribbean
Pan American Health Organization
vFOREWORD

AcknowledgmentsThe main investigators in this study were team leader
Dr. E. Benjamin Puertas, Advisor, Human Resources
for Health, Subregional Program Coordination for the
Caribbean, Pan American Health Organization (PAHO);
Dr. Martha Velandia, Regional Immunization Advisor,
Comprehensive Family Immunization Unit, Family, Health
Promotion and Life Course Department, PAHO; and Ms.
Lauren Vulanovic, Communication Specialist, Family,
Health Promotion and Life Course Department, PAHO.
The survey team comprised Ms. Lisa Bayley, PAHO
Consultant, Communication, Subregional Program
Coordination for the Caribbean, PAHO; Dr. Karen
Broome, PAHO Consultant, Immunization, Subregional
Program Coordination for the Caribbean, PAHO; Ms.
Marcela Contreras, PAHO Consultant, Comprehensive
Family Immunization Unit, Family, Health Promotion
and Life Course Department, PAHO; Mr. Dale Rhoda,
Statistician, Biostat Global Consulting, Worthington,
Ohio, United States of America; Dr. Nina Rise, Intern,
Human Resources for Health, Subregional Program
Coordination for the Caribbean, PAHO; and Ms.
Maite Vera Antelo, PAHO Consultant, Comprehensive
Family Immunization Unit, Family, Health Promotion
and Life Course Department, PAHO. Platform support
was provided by Ms. Claudia Ortiz, Information
Systems Specialist.
The contribution of the PAHO Representatives and focal
points for the dissemination and follow-up of the survey
in the participating countries is gratefully acknowledged.
Thanks to Francine Ganter-Restrepo and Lisa Menning
from the Department of Immunization, Vaccines and
Biologicals at the World Health Organization for their
support and guidance with this study.
Deepest thanks go to all the healthcare workers
who took time out of their busy schedules to
answer this survey.
vi HEALTHCARE WORKERS AND COVID-19 VACCINATION IN THE CARIBBEAN

IntroductionOn 10 March 2020, the first case of COVID-19 was
reported in the CARICOM Caribbean Subregion. As of
10 May 2021, 167,003 cases had been confirmed in the
Caribbean, with more than 130,000 recovered and 2,808
deaths attributed to COVID-19 in the Subregion (1). The
pandemic has led to the steepest recession in the history
of Latin America and the Caribbean, which, according to
the projections made by the Economic Commission for
Latin America and the Caribbean, will mean a regional
drop in growth of -9.1% in 2020. Other projections
include an increase in the poverty rate of 7.0 percentage
points, which will reach 37.3% of the population
(231 million in total, with 45 million new poor) (2).
Vaccines present an important measure for gaining
control of the COVID-19 pandemic and research has
been occurring at an accelerated rate to provide safe,
effective vaccines to the world’s population (3). The
Values Framework for the Allocation and Prioritization
of COVID-19 Vaccination, released by WHO SAGE on
14 September 2020, offers guidance on the prioritization
of groups for vaccination within countries while supply is
limited. Healthcare workers, older adults, and adults with
chronic diseases have been identified as priority groups to
receive the first doses of an approved COVID-19 vaccine.
An essential part of these plans is a communication
campaign, which will target not only members of the
public but the specific priority groups identified by
each country. The COVID-19 pandemic is the first in
history in which technology and social media are being
used on a massive scale to keep people safe, informed,
productive, and connected. A study from the United
States of America found that the Internet is the main
source of information on COVID-19 (4) but at the same
time, the technology we rely on to keep connected and
informed is enabling and amplifying an infodemic – an
overabundance of information both online and
offline – that continues to undermine the global response
and jeopardizes measures to control the pandemic.
The newly developed COVID-19 vaccines have been
significant targets of misinformation and disinformation,
leading to public mistrust and concerns over vaccine
safety. Previously, social media has been demonstrated
to be a powerful channel for the propagation of anti-
vaccine information and consequently to have an inverse
impact on uptake of influenza vaccine, but if social
media is used to spread reliable vaccine information from
trusted healthcare workers (HCWs) and public health
authorities, they can foster public trust in vaccination
(5). The possible negative impact on the acceptance
and mistrust of COVID-19 vaccines in the Caribbean
Subregion must be assessed and communication
strategies and public policy implemented to ensure rapid
recovery from the effects of this pandemic.
Hamel et al. (6) identified that in the United States of
America at least 27% of the public was vaccine hesitant,
and the main reasons expressed were concern over the
possible side effects of the vaccine, the vaccine being
too new, and a lack of trust in the government to make
sure the vaccine is safe and effective. At least 85% of
the population indicated their own doctor or healthcare
provider was the most trusted source of information.
However, a survey among HCWs in the United States
identified that vaccine hesitancy was a serious problem
with at least 15% of the HCWs who were offered
vaccination refusing to take the vaccine (7). This was
mirrored in other parts of the country, leading to a
reduction in the uptake of vaccines (8). Studies from
across the world have found nurses to be more hesitant
toward COVID-19 vaccination than other HCWs (9–11).
Female sex has been identified by several studies to
be a negative predictor of vaccine uptake (10, 12–17),
as have younger age and parenthood/having children
at home (9, 15, 17, 18). Studies from Latin America
and the Caribbean have found rural-dwelling, lower
education, and financial insecurity to be associated with
vaccine hesitancy among both HCWs and the public
(16, 19). This is also found in studies from other parts of
the world (15, 17, 18).
Targeting HCWs is important to increase vaccine
uptake (20). Studies of HCWs in Europe and Canada
1INTRODUCTION

found concerns about vaccine safety to be a key
influencer of vaccine hesitancy (21, 22). In France,
vaccine information specifically targeting HCWs has
shown to increase vaccine uptake among hospital
staff (23), and HCWs’ trust in the institutions
delivering information on vaccines and vaccination is
essential for vaccine acceptance (21). A study among
HCWs in Mexico also found information and being
well-informed to be key to vaccine uptake (24). The
extent to which this infodemic has affected and
influenced the knowledge and attitudes of HCWs
must be assessed in order to design and implement
targeted communication campaigns and ensure that
messaging geared toward HCWs is appropriately
responding to their concerns and questions. This
evidence can also lead decisionmakers in the
development of public policy to establish adequate
measures to ameliorate its impact. Therefore,
documenting their attitudes to COVID-19 vaccination
is of utmost importance to the eventual success of
a targeted communication effort and the uptake of
the COVID-19 vaccines.
The objectives of this study are to gather and use
quality data on the behavioral and social drivers of
vaccination and COVID-19 vaccines among HCWs
in the Caribbean, and to improve implementation
strategies and tailor communication approaches
on COVID-19 vaccines and vaccines in general in
the Caribbean, with the final aim to contribute to
increasing vaccination acceptance and improving
vaccine confidence among HCWs. In this manner,
programs can design, target, and evaluate
interventions to achieve greater impact with
more efficiency, and to examine and understand
comparable trends over time.
2 HEALTHCARE WORKERS AND COVID-19 VACCINATION IN THE CARIBBEAN

Methods
Survey Instrument DevelopmentThe instrument is based on a tool presented in the
interim guidance document Data for Action: Achieving
high uptake of COVID-19 vaccines by WHO and UNICEF
(25), and a questionnaire developed by the University
of California at Los Angeles (26). It was adapted for use
in the Caribbean, reviewed by the Caribbean Technical
Advisory Group for Immunization, and piloted in the
Caribbean to ensure questions and response options
were understood as intended and measured what they
were designed to measure. The instrument includes
specific questions geared at HCWs, as they are a target
audience for COVID-19 vaccine communications,
considering their important role as trusted sources of
information on vaccines and the fact that they are to
be among the first group to be vaccinated as vaccines
are rolled out. Questions on the influenza vaccine were
added to facilitate the comparison between attitudes
toward COVID-19 vaccine and another vaccine given to
adults in the Caribbean.
Survey Implementation
Data were collected anonymously using an electronic
survey in English and in French via Qualtrics® (Qualtrics,
Provo, UT) (Annex A). Qualtrics recorded the respondents’
start and end date and time and used cookies and IP
address tracking and geographical coordinates (latitude/
longitude) to prevent multiple submissions by the same
respondent. It was set to accept responses from within
the Caribbean region. The project team tested the web
survey before it was opened for project data collection.
Questions were grouped into several categories:
1. Country, sex, age, job title, healthcare
worker category;
2. Opinion questions 1:
a. Attitudes to vaccines in general
(7 Likert questions)
b. Vaccine readiness (3 Likert questions);
3. Opinion questions 2: Attitudes toward
COVID-19 vaccines:
a. Overall attitudes (3 Likert questions),
b. Vaccination if a COVID-19 vaccine becomes
publicly available (4 Likert questions),
c. Reasons for delaying or refusing a
COVID-19 vaccine (5 Likert questions
and one open text);
4. Reasons contributing to opinions of COVID-19
vaccines (8 Likert questions and one open text);
5. Attitudes toward influenza vaccine (2 Likert questions
and two open text).
If the respondent consented to take the survey, they were
presented with all the questions. They were not required
to respond to any of the opinion questions. There was
no review or confirmation step at the end of the survey.
All Likert questions used four response options: Strongly
agree; Agree; Disagree; Strongly disagree.
In Trinidad and Tobago, there were complications
due to poor Internet access, so a paper form of the
questionnaire was circulated. Paper forms were collected
for 86 such respondents and their responses were
uploaded using Qualtrics at a location with stable
Internet access.
Survey Dissemination and Advertising the SurveyThe Qualtrics platform created a link and quick response
(QR) code for survey dissemination. These were
distributed to the ministries of health and professional
associations of the participating countries through Pan
American Health Organization (PAHO) country offices in
the Caribbean. PAHO country offices advised the country
officials to distribute the survey via communications
3METHODS

at health clinics and in professional associations or
societies. At the subregional level, the questionnaire link
and QR code were sent to regional entities such as the
Regional Nursing Body and the Caribbean Community
(CARICOM), and academic institutions, specifically the
University of the West Indies (UWI), to be distributed to
their graduates’ list. Several webinars with the assigned
PAHO focal points were carried out to present the survey
and describe its components.
The survey had the option of multiple completes per
link to allow for snowballing. However, the survey was
protected to ensure that each respondent only completed
the survey once. Qualtrics monitors survey activity using a
browser-based cookie. If someone who has already taken
the survey attempted to repeat it, they were kept out.
There were no payments or incentives to complete the
survey. Data collection occurred between 15 March and
30 April 2021.
Sample Size
The sample size for the study was calculated using the
total number of HCWs in the categories reported to
the WHO National Health Workforce Accounts Portal
(NHWA): nurses, physicians, midwives, dentists, and
pharmacists. Fourteen countries of the Caribbean that
provide Human Resources for Health data to the NHWA
portal reported a total of 38,671 HCWs. To calculate the
sample, a complex multilevel sample was used to add
representativity. Population N = 38,671 was defined in
14 countries with a vaccine acceptance of 50% and a
margin of error of 5% and a design effect of 2, resulting
in n = 761 distributed across countries in proportion to
their population of HCWs. Sample size was calculated
using Open Epi, version 3.01.
Statistical Analysis
Summaries were calculated using proportions, where
the denominator was the number of respondents
who answered the question, and the numerator
was the number of persons who gave the response
in question. Data were summarized as if they were
from a simple random sample of Caribbean HCWs.
Responses to each of the 32 opinion questions
were summarized using all four categories: Strongly
agree; Agree; Disagree; Strongly disagree, and two
consolidated categories: Strongly agree combined
with Agree (Agree); Disagree combined with Strongly
disagree (Disagree).
Binary consolidated response categories (agree vs.
disagree) were analyzed using chi-square statistics to
identify questions that yielded different proportions
of agreement between respondent categories. The
main analysis approach was to examine groups
of questions and look for patterns in responses
between respondent categories – and to use those
patterns to inform communication strategies for
HCWs. The chi-square p-values were used to
confirm that the patterns in proportions were
statistically significant.
The question, “If a COVID-19 vaccine becomes
available, I intend to get it as soon as possible”
was identified as a proxy of COVID-19 vaccine
acceptance. Those who disagree or strongly disagree
with this statement were considered to be COVID-19
vaccine hesitant.
Multivariable logistic regression was used to assess
outcomes for every opinion question. Respondents
who said “Strongly agree” or “Agree” were
coded with an outcome of 1 and those who said
“Disagree” or “Strongly disagree” were coded with
0. Explanatory factors included three categorical
variables: job category (five levels, with physicians
as the reference group), sex (with males as the
reference), and age quartile (with the youngest
quartile as the reference group).
Each opinion question reports the percentage
of respondents in each response category along
with the number of persons in that category who
answered the question. The number of responses
by question are given in Annex B. The data and
chi-square and logistic regression results for all
32 questions and all respondent categories are
listed in Annex C.
4 HEALTHCARE WORKERS AND COVID-19 VACCINATION IN THE CARIBBEAN

Data Cleaning and CategorizationAfter the survey was closed, responses in English
and French were downloaded from the Qualtrics
platform. The two datasets were appended together.
Respondents were dropped from the dataset if they
a) indicated they were not a healthcare worker, b)
did not consent to answer the questions, c) were
younger than 21 years of age, d) did not give a
substantive response to any of the 32 opinion
questions, or e) indicated via their job description
that they were not included in the target population
(e.g., veterinarians, receptionists, hospital laundry
workers, orderlies, medical records officers).
Variables from the French dataset were translated
to be compatible with English. Open text responses
were translated using Google Translate, and both
the English and French text was provided to the
qualitative response categorization team.
Respondents were assigned to several categories for the
purpose of reporting results:
1. Job categories:
a. Five broad categories: Physicians;
Nurses; Public Health Professionals;
Allied Health Professionals; and Other
(Persons who answered “other”
entered a free text job title and a
team categorized some of those as
falling in the other four categories
and some as being indeed, other.
The dataset was updated with these
team-corrected classifications.);
2. Care categories
a. Most physicians and nurses were
assigned to a category named “Care”,
b. Exceptions included:
i. Environmental and occupational
health and hygiene professionals,
ii. National immunization program
staff (includes vaccinators),
iii. Nursing professionals (community
and public health),
iv. Public health professionals, who
were assigned to a category named
“Public Health”,
c. All allied health professionals were also
assigned to “Public Health”,
d. The third category consisted of those whose
job category was “Other”;
3. Age categories
a. The age quartiles of the dataset: 21–32;
33–40; 41–50; and 51–87 years of age.
Summarizing Open Text ResponsesOpen text responses were collected for five questions:
1. Job category: Other, please specify
2. Question 28: Other reasons for delaying or
refusing COVID-19 vaccine
3. Question 37: Other factors that contributed to
my opinion on a COVID-19 vaccine
4. Question 39: If you disagree with taking the
flu vaccine, why?
5. Question 41: If you disagree with recommending
the flu vaccine to friends and family, why?
In all cases, French responses were translated
automatically using Google Sheets and the Google
Translate function. Both the French response and English
translation were furnished to the qualitative response
categorization team, which consisted of three pairs
of investigators. Each pair had a member with strong
quantitative skills and a member with strong qualitative
skills. The pairs examined open-text responses to
questions 28, 37, 39, and 41 and categorized them as
reflecting one of four domains from the WHO behavioral
and social drivers of COVID-19 vaccination model, which
was adapted by the team to fit the survey findings (25).
The domains identified in this framework are: thinking
and feeling, motivation, social processes, and practical
issues. The pairs of investigators then collated their
work and conferred to resolve discordant decisions. The
responses were once again analyzed and coded by three
team members. All team members participated in a
further review where a consensus decision was made on
5METHODS

all answers for which there had been doubt about the
final domain and/or construct following the initial review.
Ethics Committee and ConfidentialityThe study protocol was submitted for approval by
the PAHO Ethics Review Committee (PAHOERC). The
study team obtained consent from the participants
who agreed to participate in the survey. The consent
form was available online before the participants had
access to the virtual questionnaire. All study procedures
were described in detail such that the participants
were fully informed of their requirements while in
the study. During this consent process, HCWs were
informed that they were free to choose to take part in
the research study or not. The welcoming information
emphasized that participation was voluntary, that
there was no negative consequence and no expected
appropriate answer to the questions. All potential
participants could agree or decline to participate in
the study. Those who consented to participate in the
study were enrolled.
6 HEALTHCARE WORKERS AND COVID-19 VACCINATION IN THE CARIBBEAN

ResultsA total of 1,197 HCWs completed the survey; all countries
and territories managed to fill their own quota for the sample
size. Table 1 shows the number of respondents by country.
Of the total respondents, 902 (75%) were female and
309 (25%) 21–32 years old. Most (521, or 43%) of the
participants were physicians. The sample is summarized
in Tables 1 and 2 and Figure 1. The number of opinion
questions answered by respondents varied from as
few as 1 to as many as 32. The average was 26 and
the median was 28. Annexes B and C show how many
respondents answered each opinion question.
TABLE 1. Respondents by country and job category
PHYSICIANS NURSES PUBLIC HEALTH
ALLIED PROFESSIONALS
OTHER TOTAL
Antigua and Barbuda 17 7 2 3 0 29
Bahamas 8 22 13 13 23 79
Barbados 43 13 8 13 5 82
Belize 9 21 6 6 5 47
Dominica 1 4 3 4 2 14
Grenada 7 25 5 4 2 43
Guyana 3 3 1 5 1 13
Haiti 59 18 16 7 2 102
Jamaica 151 18 16 27 3 215
Saint Kitts and Nevis 3 62 11 6 4 86
Saint Lucia 1 9 6 2 1 19
Saint Vincent and the Grenadines
1 16 2 3 2 24
Suriname 30 19 7 2 4 62
Trinidad and Tobago 188 93 20 63 18 382
Total 521 330 116 158 72 1,197
7RESULTS

FIGURE 1. Respondents by age, sex, and job category
0
100
200
300
400
500
600
Physicians Nurses Publichealth
Alliedpros
Other
Male Female
0
100
200
300
400
500
600
Physicians Nurses Publichealth
Alliedpros
Other
21–32 33–40 41–50 51–87
TABLE 2. Respondents by age, sex, and job category
PHYSICIANS NURSES PUBLIC HEALTH
ALLIED PROFESSIONALS
OTHER TOTAL
FEMALE MALE OTHER/ MISSING
FEMALE MALE OTHER/ MISSING
FEMALE MALE FEMALE MALE OTHER/ MISSING
FEMALE MALE FEMALE MALE OTHER/ MISSING
Quartile 1: 21–32y 113 39 1 75 5 1 11 5 33 12 0 11 3 243 64 2
Quartile 2: 33–40y 102 34 0 63 3 0 24 5 32 8 0 12 7 233 57 0
Quartile 3: 41–50y 59 45 2 82 4 0 29 14 31 12 0 9 8 210 83 2
Quartile 4: 51–87y 63 54 0 89 5 1 17 10 19 8 0 16 2 204 79 1
Missing age 6 2 1 2 0 0 1 0 1 1 1 2 2 12 5 2
Total 343 174 4 311 17 2 82 34 116 41 1 50 22 902 288 7
Table 3 summarizes the percentage of respondents
in various categories who said they agree or
strongly agree with many of the survey’s opinion
questions. Statistically significant differences, based
on multivariable logistic regression, are marked
with an asterisk (*). In the paragraphs that follow,
key results are described. The full detailed response
summary and regression results for all the opinion
questions may be found in Annex C.
Attitudes to routine vaccines Concerning attitudes to vaccines, respondents displayed
widespread agreement that vaccines in general are
a good way to protect oneself from disease, with no
statistically significant differences among comparison
groups (98%). Respondents also agreed that vaccines are
safe (95%), efficient (97%), and that vaccine information
provided by public health authorities and healthcare
providers is reliable and trustworthy (94%).
8 HEALTHCARE WORKERS AND COVID-19 VACCINATION IN THE CARIBBEAN

TABLE 3. Summary of responses by HCW categories, age, and sex
PERCENT OF RESPONDENTS WHO AGREE OR STRONGLY AGREE WITH:
ALL HCW CATEGORIES AGE QUARTILES SEX
(%) PHYSICIANS** NURSES PUBLIC HEALTH PRO-FESSIONALS
ALLIED HEALTH PRO-FESSIONALS
OTHER 21–32**
33–40
41–50
51–87
MALE** FEM
Q6. General vaccine importance 98 98 98 99 97 95 99 99 97 97 96 98*
Q8. General vaccine safety 95 96 94 95 91 93 94 93 95 97 90 96*
Q9. General vaccine effectiveness 97 97 96 98 97 100 96 96 98 98 95 98*
Q13. New vaccines carry more risk than old
56 48 65* 45 64* 74* 59 55 52 55 51 57
Q15. General fear of adverse events of vaccines
77 73 82* 74 82* 85* 81 76 76 75* 77 78
Q16. Confidence in COVID-19 vaccine effectiveness
92 96 85* 97 82* 93 86 93* 92* 96* 92 92
Q17. Confidence in COVID-19 vaccine development transparency
83 88 76* 92 72* 72* 77 79 82 92* 84 82
Q19. Intend to get vaccinated: ASAP
77 85 66* 77* 62* 75 64 76* 82* 85* 81 75
Q20. Intend to get vaccinated: wait and see
47 36 60* 39 59* 58* 61 49* 42* 35* 41 49
Q21. Intend to get vaccinated: maybe in future
39 29 52* 30 51* 47* 47 37 40 31* 32 41
Q22. Intend to get vaccinated: never
4 4 4 3 3 2 4 3 4 4 8 3*
Q24. (COVID-19 vaccine) Information gap
30 20 45* 22 43* 35* 39 29 30* 22* 28 31
Q26. Lack of trust in COVID-19 vaccine development thoroughness
47 38 60* 34 65* 52 56 45* 47* 40* 43 49
Q27. Fear COVID-19 vaccine may cause COVID-19
21 15 33* 14 24* 21 21 18 21 22 21 21
Q29. Lack of trust in COVID-19 vaccine development pace
62 54 70* 55 73* 65 69 65 57* 54* 57 63
Q31. Importance of opinions of friends and family
29 25 34* 28 33 27 33 30 31 22* 31 28
Q36. Importance of information on social media
30 21 43* 28 35* 39* 38 29 30* 23* 24 32
Q38. Influenza vaccine confidence
77 84 67* 84 69* 68* 79 80 77 75 82 75
Q40. Influenza vaccine recommendation confidence
87 92 83* 91 76* 82 91 88 87 86 89 87
* p < 0.05** Logistic regression reference category
9RESULTS

TABLE 4. Readiness: New vaccines carry more risk than older vaccines
AGREE ORSTRONGLY AGREE (%)
DISAGREE OR
STRONGLY DISAGREE
(%)
N CHI-SQUARE P-VALUE
LOGISTIC REGRESSION
ADJUSTED ODDS RATIO
P-VALUE LOWER BOUND
UPPER BOUND
All 56 44 822
HCW: Physicians 48 52 372 1.0
HCW: Nurses 65 35 221 <0.001 2.0 <0.001 1.4 2.8
HCW: Public health pros 45 55 83 0.9 0.822 0.6 1.5
HCW: Allied pros 64 36 103 1.9 0.005 1.2 3.0
HCW: Other 74 26 43 <0.001 3.2 0.002 1.5 6.5
Physician (General and family) 48 52 211
Physician (Surgical) 55 45 40
Physician (Medical) 43 57 103
Physician (Emergency) 61 39 18 0.364
Nurse (Community and public health) 49 51 73
Nurse (Critical care) 84 16 31
Nurse (Outpatients) 67 33 27
Nurse (Ward) 70 30 79 0.004
Care category: Care 55 45 519
Care category: Public health 54 46 260
Care category: Other 74 26 43 0.037
Sex: Male 51 49 205 1.0
Sex: Female 57 43 613 0.132 1.1 0.602 0.8 1.5
Age Q1: 21–32 59 41 210 1.0
Age Q2: 33–40 55 45 199 0.9 0.465 0.6 1.3
Age Q3: 41–50 52 48 206 0.7 0.155 0.5 1.1
Age Q4: 51–87 55 45 193 0.604 0.8 0.42 0.6 1.3
Note: Colored bars are scaled so if 100% of respondents gave an answer, the entire table cell would be fi lled with color from left to right.
Vaccine readiness Beyond general attitude, HCWs showed some differences
when responding to questions about new vaccines
and COVID-19 vaccines. The paragraphs that follow
summarize those differences. Only differences that were
statistically significant in logistic regression that adjusted
for job category, respondent sex, and respondent
age quartile are described. Full details are available
in Annex C. The sentences below include p-values of
specific statistically significant differences.
Despite the overall agreement on the importance, safety,
and efficacy of vaccines, HCWs displayed some concerns
when it comes to new vaccines. When asked about
general vaccine readiness, 56% of all respondents agreed
that new vaccines carry more risk than older vaccines.
Variations were observed between HCW categories,
where only 48% of physicians vs. 65% of nurses
(p < 0.001), 64% of allied professionals (p = 0.005) and
74% “others” (p = 0.002) agreed that new vaccines carry
more risk (Table 4).
10 HEALTHCARE WORKERS AND COVID-19 VACCINATION IN THE CARIBBEAN

Likewise, 77% of all respondents concurred
that they are concerned about serious adverse
effects of vaccines, with physicians displaying the
least level of agreement (73%) vs. nurses (82%;
p < 0.001), allied professionals (82%; p = 0.022),
and “others” (85%; p = 0.030). Some 81% of the
youngest respondents, age quartile (AQ) 21–32,
were concerned with adverse side effects compared
with 75% of the oldest respondents, AQ 51–87
(p = 0.041) (Table 5).
Attitudes toward COVID-19 vaccines When surveying attitudes and perceptions specifically
pertaining to COVID-19 vaccines, widespread
difference was found when comparing among both
HCW categories and age quartiles. Overall, 92% of
respondents agreed that a COVID-19 vaccine will
protect against severe COVID-19 infection. Physicians
were the most confident among HCWs (96%), and
nurses and allied professionals were least confident
(85% and 82%, respectively; p < 0.001 for both
TABLE 5. Readiness: Concerns about serious adverse effects of vaccines
Note: Colored bars are scaled so if 100% of respondents gave an answer, the entire table cell would be fi lled with color from left to right.
AGREE ORSTRONGLY AGREE (%)
DISAGREE OR
STRONGLY DISAGREE
(%)
N CHI-SQUARE P-VALUE
LOGISTIC REGRESSION
ADJUSTED ODDS RATIO
P-VALUE LOWER BOUND
UPPER BOUND
All 77 23 1129
HCW: Physicians 73 27 494 1.0
HCW: Nurses 82 18 306 0.002 1.9 <0.001 1.3 2.8
HCW: Public health pros 74 26 111 1.1 0.587 0.7 1.8
HCW: Allied pros 82 18 150 1.7 0.022 1.1 2.7
HCW: Other 85 15 68 0.004 2.2 0.03 1.1 4.4
Physician (General and family) 72 28 281
Physician (Surgical) 78 22 50
Physician (Medical) 74 26 140
Physician (Emergency) 70 30 23 0.785
Nurse (Community and public health) 78 22 95
Nurse (Critical care) 87 13 45
Nurse (Outpatients) 83 17 35
Nurse (Ward) 82 18 114 0.629
Care category: Care 76 24 702
Care category: Public health 79 21 359
Care category: Other 85 15 68 0.182
Sex: Male 77 23 270 1.0
Sex: Female 78 22 853 0.845 0.9 0.433 0.6 1.2
Age Q1: 21–32 81 19 295 1.0
Age Q2: 33–40 76 24 267 0.8 0.196 0.5 1.1
Age Q3: 41–50 76 24 280 0.7 0.131 0.5 1.1
Age Q4: 51–87 75 25 271 0.293 0.7 0.041 0.4 1.0
11RESULTS

FIGURE 2. Respondents by job category
38%*
34%*
25%
23%
15%
23%
Allied pros(n = 104)
Nurses(n = 187)
Other(n = 52)
Public health pros(n = 90)
Physicians(n = 415)
All(N = 848)
*Indicates that the portion of respondents disagreeing in this category diff ers from the portion of physicians by an amount that is statistically signifi cant
% who disagree with the statement: "If a new COVID-19 vaccine becomes available, I intend to get it as soon as possible."
categories). The youngest quartile, 21–32 years,
displayed less belief in the effectiveness of a COVID-19
vaccine (86%) than did AQ 33–40 (93%; p = 0.020),
AQ 41–50 (92%; p = 0.010), and AQ 51–87 (96%;
p < 0.001). Similarly, while 83% of respondents overall
were confident in the scientific approval process of
a COVID-19 vaccine, physicians (88%) were more so
than nurses (76%; p < 0.001), allied professionals
(72%; p < 0.001), and “others” (72%; p = 0.007).
Respondents in the oldest AQ, 51–87, (92%) compared
with respondents in the youngest AQ, 21–32, (77%;
p < 0.001) were the most confident.
Vaccine hesitancy In assessing COVID-19 vaccine readiness, of 848
participants, 195 (23%) respondents displayed some
level of vaccine hesitancy. Across HCW categories,
15% of physicians disagreed on receiving a COVID-19
vaccine as soon as possible compared with 34% of
nurses (p < 0.001), 23% of public health professionals
(p = 0.014), 38% of allied professionals (p < 0.001),
and 25% of other professionals (p = 0.089) (Figure 2).
Differences in hesitancy between subcategories of
nurses (p = 0.092) were not significant. However,
there were significant differences within physician
specialties, with clinicians and emergency doctors
being more willing to get the vaccine as soon as
possible, compared with general practitioners and
family doctors (p = 0.007) (Figure 3).
12 HEALTHCARE WORKERS AND COVID-19 VACCINATION IN THE CARIBBEAN

The difference between sexes was not significant, with
19% of males and 25% of females indicating hesitance
(p = 0.731). When comparing across age quartiles,
vaccine hesitancy was most prevalent among younger
HCWs, where only 64% of AQ 21–32, compared with
76% of AQ 33–40 (p = 0.007), 82% of AQ 41–50
(p < 0.001), and 85% of AQ 51–87 (p < 0.001) intended
to get a COVID-19 vaccine as soon as possible (Figure 4).
FIGURE 3. Vaccine hesitancy by HCW subcategory (specialty)
19%
17%
11%
5%
48%
39%
27%
22%
Physician (General and family)(n = 237)
Physician (Surgical)(n = 46)
Physician (Emergency)(n = 18)
Physician (Medical)(n = 114)
Nurse (Critical care)(n = 29)
Nurse (Ward)(n = 66)
Nurse (Community and public health)(n = 60)
Nurse (Outpatients)(n = 23)
% who disagree with the statement: "If a new COVID-19 vaccine becomes available, I intend to get it as soon as possible."
*Indicates that the portion of respondents disagreeing in this category diff ers from the portion of physicians by an amount that is statistically signifi cant
FIGURE 4. Vaccine hesitancy by HCW age group and sex
25%
19%
36%*
24%
18%
15%
Female(n = 602)
Male(n = 239)
Age Q1: 21–3 (n = 208)
Age Q2: 33–40(n = 204)
Age Q3: 41–50(n = 207)
Age Q4: 51–87(n = 215)
% who disagree with the statement: “If a new COVID-19 vaccine becomes available, I intend to get it as soon as possible.”
*Respondents in the youngest quartile were signifi cantly more hesitant than those in any of the older quartiles
13RESULTS

One-third of physicians (36%) wanted to wait to see
how the COVID-19 vaccine affects others, compared
with 60% of nurses (p < 0.001), 59% of allied
professionals (p < 0.001), and 58% of “others”
(p < 0.001). So did 61% of the youngest respondents,
AQ 21–32, compared with 49% of AQ 33–40
(p = 0.011), 42% of AQ 41–50 (p < 0.001), and only
35% of AQ 51–87 (p < 0.001). Similarly, 29% of
physicians compared with 52% of nurses (p < 0.001),
51% of allied professionals (p < 0.001), and 47%
of others (p = 0.005) agreed that while they did not
intend to get a COVID-19 vaccine soon, they might in
the future. So did 47% of the youngest respondents,
AQ 21–32, compared with 31% of the oldest
respondents, AQ 51–87 (p < 0.001). Only 4% of all
participants stated an intention to refuse a COVID-19
vaccine altogether; comparing by gender, 8% of male
respondents compared with 3% of female respondents
agreed that they did not intend ever to get a COVID-19
vaccine (p < 0.001).
Eighty-five percent of participants were confident that
there will be other treatment against COVID-19 soon,
with significant differences within specialty subcategories,
in particular among physicians, with emergency doctors
less confident on the availability of an effective treatment
compared with other specialties (p < 0.001).
One-third of participating HCWs did not know enough
about the vaccines to make a decision, mostly critical
care nurses (Figure 5) and allied health professionals
(p < 0.001) in the younger age groups (Figure 6).
FIGURE 5. Knowledge about the vaccine to make a decision, by nurse subcategory
p-value < 0.001
0 10 20 30 40 50 60 70 80 90
Nurse (Outpatients)
Nurse (Community and public health)
Nurse (Ward)
Nurse (Critical care)
Disagree or Strongly Disagree (%) Agree or Strongly Agree (%)
Q-24: I do not yet know enough about the vaccine to make a decision, by nurse subcategory (N = 1,039)
14 HEALTHCARE WORKERS AND COVID-19 VACCINATION IN THE CARIBBEAN

Gaining natural immunity against the virus was seen as
favorable by 29% of HCWs, mostly nurses compared
with physicians (42% vs. 19%, p < 0.001), and from
critical care nursing (53%, p = 0.04). Almost half of
respondents (47%) agreed or strongly agreed that the
development of the vaccine may have been rushed or
that the vaccine may not have been thoroughly tested,
with more nurses agreeing with that statement (60%,
p < 0.001) (Table 6). There were significant differences
within specialty subcategories among physicians
(p = 0.01) and nurses (p < 0.001), with surgical doctors
and critical care nurses having the highest percentages.
One-fifth of HCWs (21%) believe that vaccines can cause
the disease, the majority being nurses compared with
physicians (33% vs. 15%, p < 0.001).
Factors that contributed to the opinion on COVID-19 vaccinesWhen asked about the reasons behind their attitudes
and perceptions of COVID-19 vaccines, 30% of
respondents agreed that they do not yet know enough
about the vaccine to decide; however, this was true for
only 20% of physicians compared with 45% of nurses
(p < 0.001), 45% of allied professionals (p < 0.001),
and 35% of “other” HCWs (p = 0.008). Across age
quartiles, 39% of AQ 21–32 agreed about not yet
FIGURE 6. Knowledge about the vaccine to make a decision, by age
p-value < 0.001
39
29 3022
61
71 7078
0
10
20
30
40
50
60
70
80
90
Age Q1: 21-32 Age Q2: 33-40 Age Q3: 41-50 Age Q4: 51-87
Agree or Strongly Agree (%) Disagree or Strongly Disagree (%)
Q-24: I do not yet know enough about the vaccine to make a decision
15RESULTS

knowing enough about the vaccines compared with
30% of AQ 41–50 (p = 0.007) and only 22% of AQ
51–87 (p < 0.001). Similarly, 29% of respondents
expressed a preference to gain natural immunity
against SARS-CoV-2. This was true for 19% of
physicians, compared with 42% of nurses (p < 0.001),
29% of public health professionals (p = 0.0175), 39%
of allied professionals (p < 0.001), and 40% of others
(p < 0.001). Some 47% of respondents agreed that
the development of COVID-19 vaccines may have
been rushed, or the vaccines may not have been
thoroughly tested. Some 38% of physicians agreed
with this, compared with 60% of nurses (p < 0.001)
and 65% of allied professionals (p < 0.001). The
youngest respondents, AQ 21–32, with 56% were
more in agreement, compared with 45% of AQ 33–40
(p = 0.049), 47% of AQ 41–50 (p = 0.023), and 40%
of AQ 51–87 (p < 0.001).
TABLE 6. Reasons: Development may be rushed/vaccine may not be thoroughly tested
AGREE ORSTRONGLY AGREE (%)
DISAGREE OR
STRONGLY DISAGREE
(%)
N CHI-SQUARE P-VALUE
LOGISTIC REGRESSION
ADJUSTED ODDS RATIO
P-VALUE LOWER BOUND
UPPER BOUND
All 47 53 916
HCW: Physicians 38 62 421 1.0
HCW: Nurses 60 40 229 <0.001 2.7 <0.001 1.9 3.8
HCW: Public health pros 34 66 92 0.9 0.749 0.6 1.5
HCW: Allied pros 65 35 120 3.0 <0.001 2.0 4.7
HCW: Other 52 48 54 <0.001 1.8 0.054 1.0 3.2
Physician (General and family) 43 57 234
Physician (Surgical) 44 56 45
Physician (Medical) 26 74 125
Physician (Emergency) 41 59 17 0.01
Nurse (Community and public health) 42 58 74
Nurse (Critical care) 75 25 36
Nurse (Outpatients) 52 48 25
Nurse (Ward) 73 27 82 <0.001
Care category: Care 46 54 573
Care category: Public health 49 51 289
Care category: Other 52 48 54 0.554
Sex: Male 43 57 233 1.0
Sex: Female 49 51 678 0.16 0.9 0.665 0.7 1.3
Age Q1: 21–32 56 44 234 1.0
Age Q2: 33–40 45 55 211 0.7 0.049 0.5 1.0
Age Q3: 41–50 47 53 233 0.6 0.023 0.4 0.9
Age Q4: 51–87 40 60 225 0.003 0.5 <0.001 0.3 0.7
Note: Colored bars are scaled so if 100% of respondents gave an answer, the entire table cell would be fi lled with color from left to right.
16 HEALTHCARE WORKERS AND COVID-19 VACCINATION IN THE CARIBBEAN

For 48% of respondents, the country of manufacture of
a COVID-19 vaccine shaped their opinion on the vaccine.
Among physicians, 46% agreed with this statement,
compared with 57% of nurses (p = 0.004). Some 30% of
respondents reported that information they had seen on
social media shaped their opinion of a COVID-19 vaccine.
This was true for only 21% of physicians, compared with
43% of nurses (p < 0.001), 35% of allied professionals
(p = 0.002), and 39% of “other” HCWs (p = 0.006). The
same was observed when comparing respondents across
age quartiles, where 38% of AQ 21–32 agreed that
social media shaped their opinion on COVID-19 vaccine,
compared with 30% of AQ 41–51 (p = 0.030) and 23%
of AQ 51–87 (p < 0.001) (Figure 7).
FIGURE 7. Social media as opinion shaper, by age
Agree or Strongly Agree (%) Disagree or Strongly Disagree (%)
38
3023
62
71 7077
0
10
20
30
40
50
60
70
80
90
Age Q1: 21-32 Age Q2: 33-40 Age Q3: 41-50 Age Q4: 51-87
29
p-value = 0.006
Opinion shapers: Information I’ve seen on social media
Attitudes toward influenza vaccine Some 23% of the respondents would not take the
influenza vaccine and 13% would not recommend
it to family and friends. Nurses were more reluctant
than physicians in both cases (p ≤ 0.001), and there
were statistically significant differences among other
HCW categories (p < 0.001). Females were more
reluctant than males to take the flu vaccine (25%,
p = 0.041) (Table 7), and there were significant
differences between physician subcategories
regarding recommending the influenza vaccine to
friends and family (p = 0.043).
17RESULTS

TABLE 7. Attitudes to taking the influenza vaccine (“I would take the flu vaccine if offered”)
AGREE ORSTRONGLY AGREE (%)
DISAGREE OR
STRONGLY DISAGREE
(%)
N CHI-SQUARE P-VALUE
LOGISTIC REGRESSION
ADJUSTED ODDS RATIO
P-VALUE LOWER BOUND
UPPER BOUND
All 77 23 958
HCW: Physicians 84 16 458 1.0
HCW: Nurses 67 33 227 0.4 <0.001 0.3 0.6
HCW: Public health pros 84 16 94 1.0 0.933 0.6 1.9
HCW: Allied pros 69 31 122 0.5 0.001 0.3 0.7
HCW: Other 68 32 57 <0.001 0.5 0.035 0.3 1.0
Physician (General and family) 86 14 256
Physician (Surgical) 73 27 48
Physician (Medical) 84 16 132
Physician (Emergency) 77 23 22 0.128
Nurse (Community and public health) 69 31 74
Nurse (Critical care) 57 43 35
Nurse (Outpatients) 69 31 29
Nurse (Ward) 68 32 79 0.622
Care category: Care 79 21 608
Care category: Public health 74 26 293
Care category: Other 68 32 57 0.07
Sex: Male 82 18 245 1.0
Sex: Female 75 25 707 0.041 0.8 0.264 0.5 1.2
Age Q1: 21–32 79 21 241 1.0
Age Q2: 33–40 80 20 231 1.0 0.915 0.7 1.6
Age Q3: 41–50 77 23 232 0.9 0.597 0.6 1.4
Age Q4: 51–87 75 25 238 0.547 0.8 0.321 0.5 1.2
18 HEALTHCARE WORKERS AND COVID-19 VACCINATION IN THE CARIBBEAN
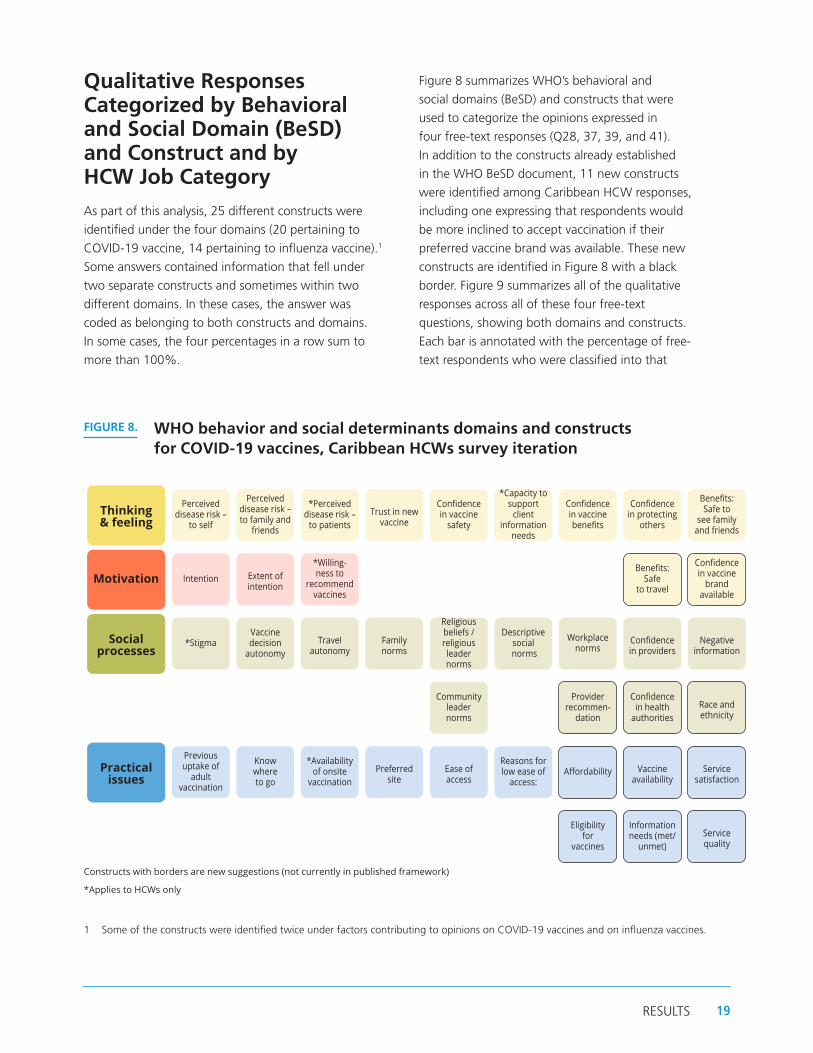
Qualitative Responses Categorized by Behavioral and Social Domain (BeSD) and Construct and by HCW Job Category
As part of this analysis, 25 different constructs were
identified under the four domains (20 pertaining to
COVID-19 vaccine, 14 pertaining to influenza vaccine).1
Some answers contained information that fell under
two separate constructs and sometimes within two
different domains. In these cases, the answer was
coded as belonging to both constructs and domains.
In some cases, the four percentages in a row sum to
more than 100%.
1 Some of the constructs were identified twice under factors contributing to opinions on COVID-19 vaccines and on influenza vaccines.
Figure 8 summarizes WHO’s behavioral and
social domains (BeSD) and constructs that were
used to categorize the opinions expressed in
four free-text responses (Q28, 37, 39, and 41).
In addition to the constructs already established
in the WHO BeSD document, 11 new constructs
were identified among Caribbean HCW responses,
including one expressing that respondents would
be more inclined to accept vaccination if their
preferred vaccine brand was available. These new
constructs are identified in Figure 8 with a black
border. Figure 9 summarizes all of the qualitative
responses across all of these four free-text
questions, showing both domains and constructs.
Each bar is annotated with the percentage of free-
text respondents who were classified into that
FIGURE 8. WHO behavior and social determinants domains and constructs for COVID-19 vaccines, Caribbean HCWs survey iteration
*Applies to HCWs only
Constructs with borders are new suggestions (not currently in published framework)
Thinking & feeling
Perceived disease risk –
to self
Perceived disease risk – to family and
friends
*Perceived disease risk –
to patients
Trust in new vaccine
Confi dence in vaccine
safety
*Capacity to support
client information
needs
Confi dence in vaccine benefi ts
Confi dence in protecting
others
Benefi ts: Safe to
see family and friends
Motivation
Intention
Extent of intention
*Willing-ness to
recommend vaccines
Benefi ts: Safe
to travel
Confi dence in vaccine
brand available
Social processes
*StigmaVaccine decision
autonomy Travel
autonomy
Family norms
Religious beliefs / religious leader norms
Descriptive social
norms
Workplace norms
Confi dence in providers
Negative information
Community leader norms
Provider recommen-
dation
Confi dence in health
authorities Race and ethnicity
Practical issues
Previous uptake of
adult vaccination
Know where to go
*Availability of onsite
vaccination
Preferred site
Ease of access
Reasons for low ease of
access: Aff ordability Vaccine
availability
Service satisfaction
Eligibility for
vaccines
Information needs (met/
unmet) Service quality
19RESULTS

category. The domain-based color schemes adhere
to those used in the WHO BeSD manual.
An overall analysis of the answers submitted for the four
free-text questions showed that respondents’ answers
fit mostly within the thinking and feeling domain.
Specifically, most answers were classified as being related
to their confidence (or lack of) in the vaccines’ benefits
(42%), as well as their perceived low risk of the disease
compared with the perceived risks associated with the
vaccines (28.5%), and their confidence (or lack thereof)
in the vaccines’ ability to protect them (28%) (Figure 9).
FIGURE 9. Qualitative response domains classified using the WHO Behavioral and Social Drivers (BeSD) rubric, all four qualitative questions together
Open text answers from n = 436 respondents were categorized for this fi gure.
0.3%
1.6%
0.3%
3.6%
3.9%
4.7%
4.9%
0.3%
0.3%
0.3%
0.3%
0.5%
1.6%
1.8%
3.4%
3.9%
6.2%
0.3%
1.0%
1.6%
2.1%
15.0%
28.0%
28.5%
42.0%
0% 10% 20% 30% 40% 50%
Extent of intention
Willingness to recommend vaccines
Ease of access
Previous uptake of adult vaccination
Vaccine availability
Information needs
Eligibility for vaccines
Workplace norms
Provider recommendation
Race & ethnicity
Family norms
Descriptive social norms
Religious beliefs & norms
Vaccine decision autonomy
Negative information
Confidence in providers
Confidence in health authorities
Capacity to support client info needs
Benefits: Safe to travel
Confidence in protecting others
Confidence in vaccine brand available
Trust in a new vaccine
Confidence in vaccine safety
Perceived disease risk - to self
Confidence in vaccine benefits
Motivation
Practical Issues
Social Processes
Thinking & Feeling
20 HEALTHCARE WORKERS AND COVID-19 VACCINATION IN THE CARIBBEAN

Attitude toward COVID-19 Vaccines Regarding the two questions related to HCWs’ opinions
on COVID-19 vaccines (Q28 “Other reasons for delaying
or refusing a COVID-19 vaccine” and Q37 “Other factors
in my COVID-19 vaccine opinion”), the respondents’
answers overwhelmingly corresponded to the thinking
and feeling domain (Figure 10). The primary construct
identified as part of the qualitative analysis was related
to doubts regarding vaccine safety (31.4%). Many
respondents pointed to their concerns regarding potential
FIGURE 10. Qualitative response domains classified using the WHO Behavioral and Social Drivers (BeSD) rubric, open text questions about COVID-19 vaccines
Open text answers from n = 277 respondents of Q28 and/or Q37 were categorized for this fi gure.
0.4%
0.4%
5.1%
5.1%
6.9%
0.4%
0.4%
0.4%
0.7%
1.8%
4.7%
5.1%
8.7%
1.4%
2.2%
2.9%
8.7%
20.2%
28.2%
31.4%
0% 5% 10% 15% 20% 25% 30% 35%
Extent of intention
Ease of access
Information needs
Vaccine availability
Eligibility for vaccines
Family norms
Race & ethnicity
Workplace norms
Descriptive social norms
Religious beliefs & norms
Negative information
Confidence in providers
Confidence in health authorities
Benefits: Safe to travel
Confidence in protecting others
Confidence in vaccine brand available
Perceived disease risk - to self
Trust in a new vaccine
Confidence in vaccine benefits
Confidence in vaccine safety
Motivation
Practical Issues
Social Processes
Thinking & Feeling
21RESULTS

long-term side effects caused by the vaccines as a
reason for influencing their opinion and for refusing or
delaying the COVID-19 vaccine. Similarly, an important
number of answers within the thinking and feeling
domain fell under the construct related to confidence
in vaccine benefits (28.2%). These answers pointed to
sentiments of uncertainty on the length of the immunity
provided by the vaccine, as well as the protection (or
lack thereof) against variants of concern. Another
important and significant construct that the respondents
reported was related to trust (or lack thereof) in
the COVID-19 vaccines (20.2%) (Figure 10). As one
respondent described:
“I have issues with the short period of time it took to
produce the current vaccines, as well as issues with the
trial/testing periods.”
It is important to point out that some of the
respondents’ answers to these two questions
indicated a low perceived risk for themselves regarding
COVID-19 (8.7%), directly influencing their willingness
to receive the vaccine. Most of these answers argued
that a low prevalence of the disease in their country
rendered the COVID-19 vaccines unnecessary. Several
respondents listed allergies, prior COVID-19 infection, or
medical conditions as a reason for delaying or refusing a
COVID-19 vaccine.
Another finding extracted from some respondents
pointed to the brand of the COVID-19 vaccine available
to them as reason for delaying or refusing to get
vaccinated (2.9%). This prompted the investigation
team to create a new construct under the think and feel
domain related to confidence in specific vaccine brands,
as these responses insinuated that if a different brand
of the COVID-19 vaccines were made available to these
HCWs, their intent of getting vaccinated would change
toward vaccine acceptance.
Among the responses classified under the social
processes domain, the most influential number of
answers involved HCWs’ confidence (or lack thereof)
in their health authorities (8.7%). Respondents voiced
concerns on issues such as authorities’ handling of the
pandemic and the messaging communicated to the
public. This issue is exacerbated when combined with
vaccine safety concerns, as one respondent indicated:
“Authorities wants to force the vaccines upon citizens
but won’t take any responsibility if anything was to
transpire or happen to you after.”
Another stated: “Dishonesty of public health
officials and denial of obvious adverse events in
some persons.”
Issues related to global equity appeared in some
responses, with participants indicating skepticism
that their countries would already be receiving
quality vaccines. Similarly, one respondent reported,
“Rich nations cheating and bullying poor countries.”
Furthermore, some HCWs reported negative
information as influencing their opinion (4.7%). As
one participant stated:
“I took the first dose and I’m having second thoughts
of taking the second dose, too much news I don’t
know what to believe.”
On the other hand, other HCWs pointed to a lack
of information as influencing their opinion on the
COVID-19 vaccines (5.1%). However, due to the
extremely open-endedness of the question, it was
unclear in the responses from what sources and
on which topics they were hoping to receive more
information. Answers related to the motivational
domain were only identified once under the
questions related to COVID-19 vaccines (0.4%).
It should be noted that in some cases, respondents
listed pregnancy as a reason for not wanting to get
vaccinated; since COVID-19 vaccination was not
offered to pregnant individuals in all countries at the
time of the survey, it is unclear whether respondents
were referring to practical issues (i.e., they would
like to get vaccinated but were unable to) or if they
were referring to an increased risk perception toward
taking the vaccine (i.e., even with the vaccines being
offered to pregnant individuals, they would choose
not to get vaccinated out of fear that the vaccine
might cause damage to them or their fetuses).
22 HEALTHCARE WORKERS AND COVID-19 VACCINATION IN THE CARIBBEAN

Also, although it was not an answer that appeared
often, the study team does wish to highlight here
that some respondents indicated racial concerns
around vaccine safety, indicating that the vaccines had
not been properly tested in all races and ethnicities,
and therefore might not be safe for the Caribbean
population. The topic of trust in authorities among
populations of color must also be considered, as one
participant noted:
“Based on past ethical issues, black people do have
some trust issues which must be addressed to give more
confidence in vaccines.”
Attitude toward Influenza Vaccines For the two questions relating to HCWs’ attitudes
toward influenza vaccines (Question 39, “If you disagree
with getting the flu vaccine for yourself, why?” and
Question 41, “If you disagree with recommending the
flu vaccine, why?”), the majority of answers followed
the same pattern as the questions about COVID-19
vaccines, by corresponding mostly to the thinking and
feeling domain (Figure 11). The dominant concerns
were related to (lack of) confidence in vaccine benefits
(48.6%), where many respondents expressed doubts on
FIGURE 11. Qualitative response domains classified using the WHO Behavioral and Social Drivers (BeSD) rubric, open text questions about influenza vaccine
2.9%
0.5%
1.0%
2.4%
6.7%
0.5%
0.5%
1.4%
3.4%
0.5%
1.9%
12.0%
42.3%
48.6%
0% 10% 20% 30% 40% 50% 60%
Willingness to recommend vaccines
Eligibility for vaccines
Vaccine availability
Information needs
Previous uptake of adult vaccination
Provider recommendation
Confidence in providers
Religious beliefs & norms
Vaccine decision autonomy
Capacity to support client info needs
Trust in a new vaccine
Confidence in vaccine safety
Perceived disease risk - to self
Confidence in vaccine benefits
Motivation
Practical Issues
Social Processes
Thinking & Feeling
Open text answers from n = 208 respondents of Q39 and/or Q41 were categorized for this fi gure
23RESULTS

influenza vaccines’ ability to prevent them from catching
flu. As one respondent described:
“The flu vaccines sometimes have a negative effect
on individuals, and it definitely doesn’t mean you still
can’t catch flu.”
Two other main constructs were (low) perceived
disease risk to oneself (42.3%), as many respondents
did not perceive influenza to be a significant public
health problem in their country, followed by (lack of)
confidence in vaccine safety (12.0%) and concerns
about the side effects of influenza vaccines.
Practical issues were the second most common
domain for influenza vaccines. Most answers related
to previous uptake of adult vaccination (6.7%), as
respondents expressed having a bad experience
with previous vaccination. However, these answers
were also classified under the thinking and feeling
domain, as they signal a lack of confidence in the
vaccines’ safety.
When the qualitative data were analyzed by HCW
category or age group, there was no significant
difference in the domain identification previously done
for factors contributing to respondents’ opinion on
COVID-19 vaccination. However, on one hand the
research team observed a difference between sexes,
where female respondents were more likely to answer
within the thinking and feeling domain (79% of females
vs. 66% of males). On the other hand, more males
expressed answers within the social processes (21% of
males vs. 15% of females) and practical issues (17% of
males vs. 12% of females) domains.
Similarly, no differences were observed in domain
identification for respondents’ attitudes to
influenza vaccines when analyzing the data by
comparison of groups.
24 HEALTHCARE WORKERS AND COVID-19 VACCINATION IN THE CARIBBEAN

DiscussionVaccination is one of public health’s most critical tools in
protecting populations from many dangerous diseases,
including now against COVID-19; however, some HCWs
are not fully convinced of the effectiveness and safety
of these vaccines, which can result in a delay or refusal
to get vaccinated when offered (27). HCWs are the first
priority population for vaccination against COVID-19,
as established by SAGE in the road map for prioritizing
uses of COVID-19 vaccines in the context of limited
supply (28), and they are the most trusted source of
vaccine and vaccination-related information to the
general population (6). The concerns, attitudes, and
intended practices of physicians, nurses, and other HCWs
influence the decision of the public regarding vaccination.
In this study assessing the intention of HCWs to get the
COVID-19 vaccine as soon as possible, it was observed
that 77% of the participants would receive the vaccine
and 23% could be qualified as “vaccine hesitant.”
However, despite 23% of respondents indicating they
would not get vaccinated against COVID-19 as soon
as they had the opportunity, only 4% of respondents
reported that they never intend to get vaccinated.
Nurses were classified as hesitant at a rate twice more
than physicians, and younger age quartiles reported
more hesitancy to COVID-19 vaccination than older
age groups. These findings are consistent with similar
studies carried out elsewhere. In Spain, 22.43% were
hesitant to receive the COVID-19 vaccine, with nurses
reporting hesitancy twice more than physicians (35% vs.
17.5%) (22). Kutter et al. (17) found that 35.6% of
11,760 employees in two hospitals in Philadelphia
had no intention to be vaccinated against COVID-19.
Gagneux-Brunon et al. (10) reported 25.9% vaccine
hesitancy among French HCWs, with a lower
vaccine acceptance among nurses than physicians
(35.3% vs. 7.9%) and those under 30 years (30.5%).
Gadoth et al. (26) found that nurses were more prone
to delay COVID-19 vaccine than physicians.
The study also found that there were important
differences among specialties within professional
categories, especially physicians and nurses. Clinicians
and emergency physicians were more prone to want
to get the vaccine as soon as possible, compared with
general practitioners and family doctors (p = 0.007).
Although not statistically significant, critical care
nurses were more hesitant than outpatient,
community, and public health nurses. As Verger et
al. (21) noted, HCWs are not a homogeneous group,
and most are not immunization experts, which is why
building trust in this population requires providing
credible information from trustworthy sources.
Regarding gender, the study did not find a
difference in responses between men and women,
an association that has been found in various
papers (10, 26, 29). It identified higher willingness
for uptake of a COVID-19 vaccine in the oldest age
group, which is the most vulnerable group in terms
of suffering severe outcomes from COVID-19 (26).
This study utilized as proxy for vaccine hesitancy
the intention to get the vaccine as soon as
possible. Intent to get vaccinated or vaccine
uptake rates were also used in other studies to
describe vaccine hesitancy (11, 14, 15, 17, 21, 29).
Gagneux-Brunon et al. (10) considered vaccine
hesitancy when participants either refused or
postponed vaccination or had doubts about
vaccine efficacy. Other studies consider the
statements on risk of new versus older vaccines
and concerns about serious adverse effects (26)
or a fear of adverse events (16) as proxies
for hesitancy.
More than half of nurses in this study preferred to
wait to see how the COVID-19 vaccine affects others
(60%) or stated that they might get it in the future
(52%). Most respondents agreed that COVID-19
vaccine protects against severe infection and were
confident in the scientific approval process. However,
nurses and allied professionals were less confident,
as were younger age groups.
25DISCUSSION

The percentage of respondents in this study who would
not take the influenza vaccine was the same as those
who showed hesitancy against COVID-19 vaccines (23%).
Previous influenza vaccination behavior had been found
as a predictor of COVID-19 vaccine acceptance in a
study conducted in Hong Kong in March 2020 (30). This
could mean that vaccine hesitancy among HCWs who
participated in this study is not necessarily only hesitancy
regarding COVID-19 vaccination, but regarding adult
vaccination in general.
Vaccine readiness and attitudes to vaccines in general The findings presented in this report show that there
was widespread agreement that vaccines in general are a
good way to protect from disease, that they are safe and
reliable, and that vaccine information provided by public
health authorities and healthcare providers is reliable and
trustworthy. However, HCWs who participated in the
study expressed concerns when it comes to new vaccines,
specifically reporting perceived risk in taking them due
to concerns of serious adverse effects that could cause
harm in the long-term. Similar findings were reported
in other recent studies (15, 31). Nurses and younger
respondents showed more concerns than physicians and
older age groups.
Factors that contributed to the opinion on COVID-19 vaccines There were important gaps in knowledge and
accuracy of information on COVID-19 vaccines among
participating HCWs from the Caribbean. A third
of participants referenced insufficient knowledge
on vaccines to make a decision, and a third agreed
that they preferred natural immunity to COVID-19
vaccination. Almost half thought that the development
of the vaccines may have been rushed or that the
vaccines may not have been thoroughly tested, and
this is one of the concerns also reported in other
studies (32). One-fifth stated that COVID-19 vaccines
can cause the disease. Nurses were less informed or
reported more misinformation on COVID-19 vaccines
than physicians. There were also significant differences
within specialty subcategories, with critical care nurses
having more knowledge gaps than other types of
nurses. This finding was surprising, since critical care
nurses are highly trained professionals that should have
access to accurate information on vaccines; moreover,
they had more probability of being involved in the care
of a COVID-19 patient, meaning one would expect
them to have a clear understanding of the grave
dangers the disease can cause. This finding was not
consistent with other studies. According to Fakonty et
al., ICU staff were less hesitant than HCWs from other
areas (33). Gagneux-Brunon et al. (10) found that
HCWs involved in the care of COVID-19 patients and
considering themselves at risk of disease were more
likely to accept COVID-19 vaccination than HCWs not
caring for COVID-19 patients. However, regarding the
findings of this study, it is important to recognize that
critical care nurses are not a monolith; they bring their
own personal beliefs and perceptions to their jobs, and
these also influence the decisions they make regarding
their own health. Likewise, they also can be exposed
to misinformation about vaccines that can cause
them to doubt their safety, efficacy, and benefits.
Qualitative analysis of open text questions
confirmed and complemented the main findings
in the quantitative component, with respondents
expressing concerns related to perceived
risks – including in the long-term – with taking
COVID-19 vaccines, doubts regarding the vaccines’
ability to effectively protect against COVID-19, and
a lack of information from trusted sources or lack
of trust in authorities, as the study of Verger et
al. (21) reported. Concerns for vaccination safety
were common findings in other studies (21, 29).
There were some contrasting responses regarding
vaccine safety. Gaps in perceived risk of COVID-19
vaccination versus risk of COVID-19 disease were
widened by some respondents who answered that
they did not see COVID-19 as a problem in their
country. The most repeated constructs mentioned
by respondents (33%) were related to confidence
in vaccine safety, benefits, and trust. The most
influential construct under the social processes
domain was the lack of HCWs’ confidence in
their health authorities (10%), with participants
including statements in the open-ended questions
on mandating vaccines, dishonesty, and denial or
hiding of adverse events.
26 HEALTHCARE WORKERS AND COVID-19 VACCINATION IN THE CARIBBEAN

Interpretation of the results Efforts need to be made to increase risk perception
of COVID-19 disease versus all approved vaccines
so that HCWs feel more confident not only getting
vaccinated themselves but also in recommending that
their patients, family, and friends get vaccinated as well.
Messaging also needs to emphasize the importance
of taking the first vaccine that is available and not
delaying vaccination in hopes of receiving a vaccine of
personal preference. Trusted spokespersons should be
used to empathetically communicate critical messages
about vaccine safety and efficacy and the importance of
getting vaccinated with the first vaccine that is offered.
This is especially important in situations where health
authorities and government figures are not trusted
sources of information for all audiences. References
to religious objections for not getting vaccinated, as
indicated in some qualitative responses, highlight
the need to work with religious leaders among these
trusted spokespersons.
Given answers to open-ended questions that allergies,
previous COVID-19 infection, or underlying medical
conditions were reasons for not immediately being
vaccinated against COVID-19, messaging should also
seek to clarify that allergies are not a contraindication
for vaccination, and that many comorbidities in fact
increase the risk of complications from COVID-19
disease, meaning populations with those conditions will
benefit greatly from the protection offered by COVID-19
vaccines. Additionally, the importance of getting
vaccinated against COVID-19 following prior infection
should be clearly communicated.
Likewise, in response to participants’ responses about
not having enough information or not enough research
having been carried out to make sound decisions about
COVID-19 vaccination, results of studies should be
clearly and transparently communicated and explained
to HCWs so they are continuously informed about new
findings on vaccine effectiveness and safety.
Considering the statistically significant hesitancy among
respondents in the youngest age group, a variety of
channels should be employed to reach this audience
with key messages in favor of vaccination. For example,
authorities should explore social media platforms
like Instagram and TikTok in addition to traditional
communications channels.
Reasons for vaccine hesitancy listed in the qualitative
answers that can be classified as misinformation, as
well as the indication that social media is a source
of information for HCWs about COVID-19 vaccines,
show that HCWs would benefit from targeted training
on identifying misinformation and trusted sources
of information related to vaccines and vaccination.
This would enable them to identify misinformation
and thus be better informed themselves and able to
correct rumors they hear from colleagues, patients, and
community members.
Relevance of the study’s findingsThe results of this study could be used to tailor
communication strategies by age group, professional
category, and specialty of HCWs, focusing efforts
on those groups that show more hesitancy toward
COVID-19 vaccines. Training and continuing education
of HCWs – in particular, physicians, and nurses – must
continue so these groups can identify and address
misinformation with their peers, patients, and community
members, and have less anxiety related to the vaccines.
Other groups of HCWs should be empowered as well.
Specific interventions for primary care physicians and
nurses can be implemented, considering that these
professionals have close contact with the public on
health-related matters, including related to vaccination.
Vaccine hesitancy among HCWs follows similar
characteristics to the general population, where social
listening activities and studies have also shown concerns
about the process of developing COVID-19 vaccines
(regarding the speed at which they were developed
and the testing and approval processes); perceived
risks of taking the vaccine, including in the long-term;
and mistrust of authorities. Dispelling doubts among
physicians and nurses could have a positive effect on the
population, which is highly influenced by the opinion of
their healthcare providers.
Inaccurate information spread on social networks
influenced participating HCWs on COVID-19 vaccines.
27DISCUSSION

However, social media can be a powerful tool to provide
accurate information, debunk myths and rumors,
facilitate the exchange of ideas, understand different
population groups’ concerns and doubts, and target
different generations of HCWs in the Caribbean.
A variety of platforms should be considered to ensure
that younger HCWs, who in this study showed more
hesitancy, are reached and engaged as well.
Younger age groups were more hesitant about
COVID-19 vaccination than older age groups of HCWs.
The perception of lower risk to COVID-19 disease
among generally healthy individuals could explain this
phenomenon, as well as the fact that these groups widely
use social media and could be more exposed to fake
news. Similarly, responses to open-ended questions that
referenced concerns about blood clots and adenovirus
vector vaccines could reflect concerns of respondents in
younger age groups, where more cases of Thrombosis
with Thrombocytopenia Syndrome (TTS) have been
reported. It is important to note that these cases of TTS
are extremely rare, and the WHO Strategic Advisory
Group of Experts on Immunization (SAGE) and the
Global Advisory Committee on Vaccine Safety (GACVS)
have both stated that the benefits of these vaccines far
outweigh any potential risks (34).
Nurses were twice more hesitant and less informed
than physicians. Hesitancy among nurses is a major
concern as the nature of their work puts them in
more and longer contact with patients. Efforts in the
short, mid, and long term should emphasize capacity
building and training of nurses in communicating
about vaccination, especially related to vaccine
safety, with users of health services, their families,
and members of their communities. In addition
to education, policy-level interventions must be
considered by national and subnational governments
where vaccine hesitancy among HCWs is affecting
the vaccination of the general public as well.
More research is needed to acknowledge the
multifactorial nature of vaccine hesitancy among
HCWs. There is a variety of individual and social
characteristics that influence vaccination acceptance;
only by understanding and addressing these will
it be possible to ensure a broader coverage of
COVID-19 vaccines.
Strengths and Limitations
This study has several strengths:
• It was widely publicized, and the online survey
was available for 50 days, casting a wide net for
Caribbean HCWs to respond.
• It was available in English and French.
• In Trinidad and Tobago, it was available in paper
form in addition to the website interface.
• Pretest work resulted in confusing phrases
being identified and adjusted for clarity within
the survey tool.
• Free text responses were independently
categorized by several teams. Disagreements
were resolved after consultation with the
Behavioral and Social Drivers (BeSD) team
from WHO Headquarters and further internal
survey team review.
• Some consistent contrasting patterns in responses
are evident between physicians and nurses and
between the youngest and oldest respondents.
• Even without underlying differences, 5% of
hypothesis tests are expected to yield p-values
below 0.05. This work reports 224 chi-square
p-values, so 11 or 12 would be expected to
have p-values below 0.05 even if there were no
underlying differences. In this analysis, 93 of the
224 comparisons yielded a p-value below 0.05, so
it seems likely that there are very real differences
of opinion between subgroups in these data.
It also has several limitations:
• The sample is not likely to be perfectly representative
of Caribbean HCWs.
• The open invitation to participate was circulated
through numerous professional networks, but it is not
possible to know what portion of Caribbean HCWs
heard about the survey in time to participate, nor
whether those who heard are similar in demographics
and attitude to those who did not hear.
28 HEALTHCARE WORKERS AND COVID-19 VACCINATION IN THE CARIBBEAN
• Similarly, it is not possible to know what portion
of those who learned of the survey decided to
participate, and why; likewise, the reasons are not
known why those who did not participate did not.
• Because the sample is likely to be clustered by
profession and by location of health facilities, the
responses to questions are likely to be correlated
with each other – persons in the same country or
professional organization or the same health facility
are subject to similar sources of information and
are more likely to give responses similar to their
colleagues than to those given by people from
other job categories or locations. It is not possible
to know the locations of the respondents, so it is
not possible to account for spatial clustering in the
analysis. Analyses of correlated data that cannot
account for correlation are likely to yield smaller
p-values than those that are able to account for the
correlation, so there is a possibility that some of the
statistically significant p-values here do not reflect
truly significant differences.
• Due to the nature of the survey, answers received
for the four free-text questions were limited to the
information provided by the respondents. Some of
these included one-word responses. There was no
way of following up with respondents to obtain
further explanation or information on what was
entered in the survey. This meant that the analysis
of these questions required some interpretation
from the team on the intent and meaning behind
the entries, inserting assumptions into the analysis.
• Understanding that the survey took place between
March and April 2021 and the rapidly changing
epidemiological situation in some countries, it
is important to note that some of the attitudes
and perceptions regarding perceived severity of
COVID-19 disease described here could have
changed as well.
• When the survey instrument was initially
developed, COVID-19 vaccines were not yet
available; however, by the time the instrument was
implemented, vaccines were available in almost
all participating countries. Some respondents
indicated the survey questions were confusing
because they posed COVID-19 vaccination as a
hypothetical, while they themselves had already
been vaccinated.
• The survey was rolled out during an incredibly
busy time for Caribbean HCWs, as they were
involved with vaccination campaigns and general
pandemic response. This may have impacted the
survey response rate.
29DISCUSSION

RecommendationsBased on the WHO BeSD framework as well as the results
of the survey, Table 8 outlines possible interventions
to be implemented at country level to improve vaccine
acceptance among HCWs.
As discussed in the “Interpretation of results” section
in the Discussion above, considering the majority of
responses fall under the “think and feel” domain and
constructs related to low confidence in vaccine safety,
efficacy, and benefits, PAHO suggests focusing on
interventions that increase risk perception of COVID-19
as a disease in relation to COVID-19 vaccination. At the
same time, interventions should seek to increase HCWs’
understanding and acceptance of the safety, efficacy,
and benefits of vaccination. Educational campaigns
and provider and institutional recommendations can be
employed to facilitate these objectives.
Additionally, because trust is such a critical issue for
the immunization program, further interventions
may be considered to address study findings under
the “social processes” domain related to lack of
confidence in health authorities. Such efforts might
include transparent, timely communication from
authorities on COVID-19 vaccination, or collaboration
with trusted leaders in HCW communities who can
advocate for vaccination.
For additional information on Table 8, including likely
impact on vaccine uptake and strength of evidence,
please see the WHO Guidance Data for Action:
Achieving high uptake of COVID-19 vaccines.
For examples of messaging to adapt for communication
strategies, see Annex E.
30 HEALTHCARE WORKERS AND COVID-19 VACCINATION IN THE CARIBBEAN
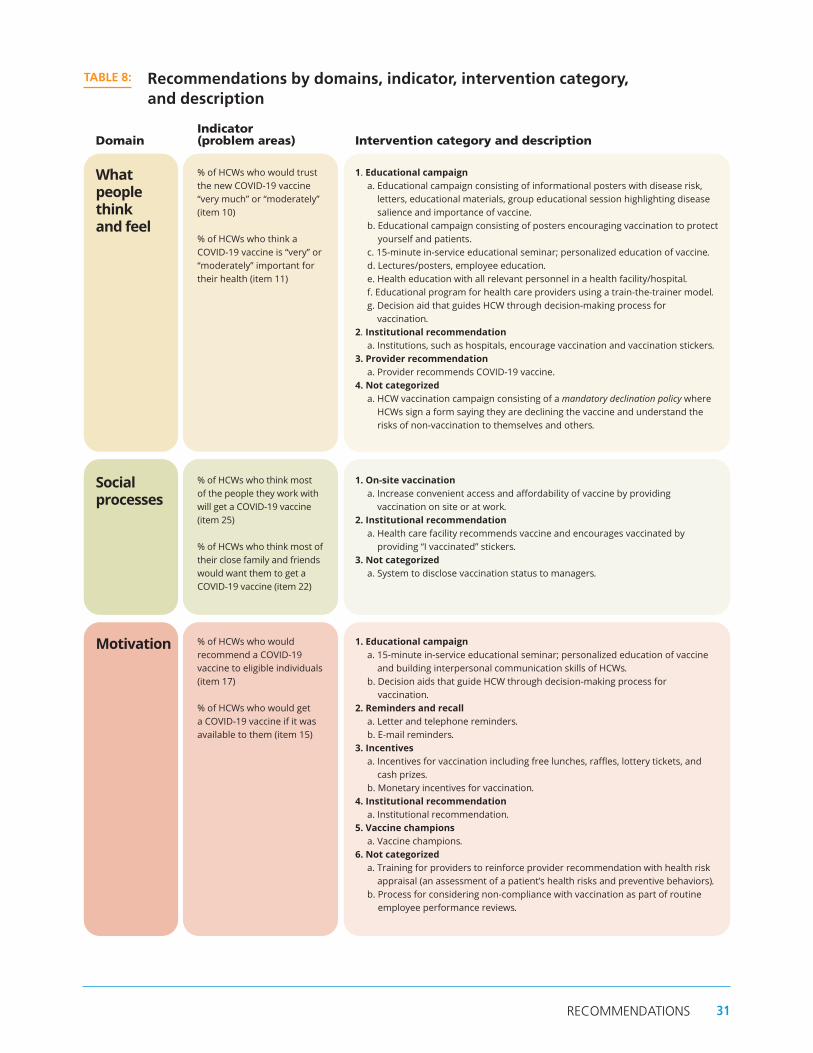
DomainIndicator (problem areas) Intervention category and description
What people think and feel
% of HCWs who would trust the new COVID-19 vaccine “very much” or “moderately” (item 10)
% of HCWs who think a COVID-19 vaccine is “very” or “moderately” important for their health (item 11)
1. Educational campaign a. Educational campaign consisting of informational posters with disease risk,
letters, educational materials, group educational session highlighting disease salience and importance of vaccine.
b. Educational campaign consisting of posters encouraging vaccination to protect yourself and patients.
c. 15-minute in-service educational seminar; personalized education of vaccine. d. Lectures/posters, employee education. e. Health education with all relevant personnel in a health facility/hospital.f. Educational program for health care providers using a train-the-trainer model.g. Decision aid that guides HCW through decision-making process for
vaccination.2. Institutional recommendation
a. Institutions, such as hospitals, encourage vaccination and vaccination stickers.3. Provider recommendation
a. Provider recommends COVID-19 vaccine.4. Not categorized
a. HCW vaccination campaign consisting of a mandatory declination policy where HCWs sign a form saying they are declining the vaccine and understand the risks of non-vaccination to themselves and others.
Social processes
% of HCWs who think most of the people they work with will get a COVID-19 vaccine (item 25)
% of HCWs who think most of their close family and friends would want them to get a COVID-19 vaccine (item 22)
1. On-site vaccination a. Increase convenient access and affordability of vaccine by providing
vaccination on site or at work. 2. Institutional recommendation
a. Health care facility recommends vaccine and encourages vaccinated by providing “I vaccinated” stickers.
3. Not categorized a. System to disclose vaccination status to managers.
Motivation % of HCWs who would recommend a COVID-19 vaccine to eligible individuals (item 17) % of HCWs who would get a COVID-19 vaccine if it was available to them (item 15)
1. Educational campaign a. 15-minute in-service educational seminar; personalized education of vaccine
and building interpersonal communication skills of HCWs. b. Decision aids that guide HCW through decision-making process for
vaccination. 2. Reminders and recall
a. Letter and telephone reminders. b. E-mail reminders.
3. Incentives a. Incentives for vaccination including free lunches, raffles, lottery tickets, and
cash prizes. b. Monetary incentives for vaccination.
4. Institutional recommendation a. Institutional recommendation.
5. Vaccine champions a. Vaccine champions.
6. Not categorized a. Training for providers to reinforce provider recommendation with health risk
appraisal (an assessment of a patient’s health risks and preventive behaviors). b. Process for considering non-compliance with vaccination as part of routine
employee performance reviews.
TABLE 8: Recommendations by domains, indicator, intervention category, and description
31RECOMMENDATIONS

References 1. Caribbean Public Health Agency. CARPHA Situation
Report no. 156 - May 10, 2021, Coronavirus Disease (COVID-19) Pandemic [Internet]. [Port of Spain]: CARPHA; 2021 [cited 2021 May 14]. Available from: https://www.carpha.org/Portals/0/Documents/COVID%20Situation%20Reports/Situation%20Report%20156%20-%20May%2010,%202021.pdf
2. Economic Commission for Latin America and the Caribbean; Pan American Health Organization. Health and the economy: a convergence needed to address COVID-19 and retake the path of sustainable development in Latin America and the Caribbean. [Internet]. Santiago and Washington, DC: ECLAC, PAHO: 2020 [cited 2021 Mar 15]. Available from: https://iris.paho.org/bitstream/handle/10665.2/52535/PAHOHSSCOVID-19200027_eng.pdf
3. Caribbean Public Health Agency. CARPHA COVID-19 Vaccine Update - May 3, 2021 [Internet]. [Port of Spain]: CARPHA; 2021 [cited 2021 May 4]. Available from: https://carpha.org/Portals/0/Documents/COVID-19%20Vaccine%20Updates/CARPHA%20COVID-19%20Vaccine%20Update%20017%20May%203,%202021.pdf
4. Woods NK, Vargas I, McCray-Miller M, Ham AD, Chesser AK. SARS-CoV2, the COVID-19 Pandemic and Community Perceptions. J Prim Care Community Health [Internet]. 2021 [cited 2021 Apr 19];12:1–5. Available from: https://journals.sagepub.com/doi/10.1177/2150132721995451
5. Puri N, Coomes EA, Haghbayan H, Gunaratne K. Social media and vaccine hesitancy: new updates for the era of COVID-19 and globalized infectious diseases. Hum Vaccin Immunother [Internet]. 2020 Nov 1 [cited 2021 Apr 19];16(11):2586–93. Available from: https://doi.org/10.1080/21645515.2020.1780846
6. Hamel L, Kirzinger A, Muñana C, Brodie M. KFF COVID-19 Vaccine Monitor: December 2020 [Internet]. KFF; 2020 [cited 2021 Jul 2]. Available from: https://www.kff.org/coronavirus-covid-19/report/kff-covid-19-vaccine-monitor-december-2020/
7. Surgo Ventures. U.S. Healthcare Workers: COVID-19 Vaccine Uptake & Attitudes [Internet]. Surgo; 2021 [cited 2021 Jul 2]. Available from: https://surgoventures.org/resource-library/survey-healthcare-workers-and-vaccine-hesitancy
8. Shalby C, Baumgaertner E, Branson-Potts H, Reyes-Velarde A, Dolan J. Some healthcare workers refuse to take COVID-19 vaccine, even with priority access [Internet]. Los Angeles Times. 2020 [cited 2021 Jul 2]. Available from: https://www.latimes.com/california/story/2020-12-31/healthcare-workers-refuse-covid-19-vaccine-access
9. Dror AA, Eisenbach N, Taiber S, Morozov NG, Mizrachi M, Zigron A, et al. Vaccine hesitancy: the next challenge in the fight against COVID-19. Eur J Epidemiol [Internet]. 2020 Aug 1 [cited 2021 Apr 19];35(8):775–9. Available from: https://doi.org/10.1007/s10654-020-00671-y
10. Gagneux-Brunon A, Detoc M, Bruel S, Tardy B, Rozaire O, Frappe P, et al. Intention to get vaccinations against COVID-19 in French healthcare workers during the first pandemic wave: a cross-sectional survey. J Hosp Infect [Internet]. 2021 Feb 1 [cited 2021 Jul 2];108:168–73. Available from: https://www.journalofhospitalinfection.com/article/S0195-6701(20)30544-2/abstract
11. Kwok KO, Li K-K, Wei WI, Tang A, Wong SYS, Lee SS. Influenza vaccine uptake, COVID-19 vaccination intention and vaccine hesitancy among nurses: A survey. Int J Nurs Stud [Internet]. 2021 Feb 1 [cited 2021 Apr 19];114:103854. Available from: https://www.sciencedirect.com/science/article/pii/S002074892030345X
12. Lin C, Tu P, Beitsch LM. Confidence and Receptivity for COVID-19 Vaccines: A Rapid Systematic Review. Vaccines [Internet]. 2021 Jan [cited 2021 Apr 19];9(1):16. Available from: https://www.mdpi.com/2076-393X/9/1/16
13. Freeman D, Loe BS, Chadwick A, Vaccari C, Waite F, Rosebrock L, et al. COVID-19 vaccine hesitancy in the UK: the Oxford coronavirus explanations, attitudes, and narratives survey (Oceans) II. Psychol Med [Internet]. 2020;1–15. Available from: https://www.cambridge.org/core/article/covid19-vaccine-hesitancy-in-the-uk-the-oxford-coronavirus-explanations-attitudes-and-narratives-survey-oceans-ii/C30FDB5C3D87123F28E351FDAAD5351A
32 HEALTHCARE WORKERS AND COVID-19 VACCINATION IN THE CARIBBEAN

14. Schwarzinger M, Watson V, Arwidson P, Alla F, Luchini S. COVID-19 vaccine hesitancy in a representative working-age population in France: a survey experiment based on vaccine characteristics. Lancet Public Health [Internet]. 2021 Apr 1 [cited 2021 Apr 19];6(4):e210–21. Available from: https://www.thelancet.com/journals/lanpub/article/PIIS2468-2667(21)00012-8/abstract
15. Paul E, Steptoe A, Fancourt D. Attitudes towards vaccines and intention to vaccinate against COVID-19: Implications for public health communications. Lancet Reg Health - Europe [Internet]. 2021 Feb 1 [cited 2021 Apr 19];1:100012. Available from: https://www.sciencedirect.com/science/article/pii/S2666776220300120
16. Urrunaga-Pastor D, Bendezu-Quispe G, Herrera-Añazco P, Uyen-Cateriano A, Toro-Huamanchumo CJ, Rodriguez-Morales AJ, et al. Cross-sectional analysis of vaccine intention, perceptions and hesitancy across Latin America and the Caribbean. Travel Med Infect Dis. 2021 Apr 16;102059.
17. Kuter BJ, Browne S, Momplaisir FM, Feemster KA, Shen AK, Green-McKenzie J, et al. Perspectives on the receipt of a COVID-19 vaccine: A survey of employees in two large hospitals in Philadelphia. Vaccine [Internet]. 2021 Mar 19 [cited 2021 Apr 19];39(12):1693–700. Available from: https://www.sciencedirect.com/science/article/pii/S0264410X21001857
18. Khubchandani J, Sharma S, Price JH, Wiblishauser MJ, Sharma M, Webb FJ. COVID-19 Vaccination Hesitancy in the United States: A Rapid National Assessment. J Community Health. 2021 Apr;46(2):270–7.
19. Guzman-Holst A, DeAntonio R, Prado-Cohrs D, Juliao P. Barriers to vaccination in Latin America: A systematic literature review. Vaccine [Internet]. 2020 Jan 16 [cited 2021 Apr 19];38(3):470–81. Available from: https://www.sciencedirect.com/science/article/pii/S0264410X1931477X
20. Jarrett C, Wilson R, O’Leary M, Eckersberger E, Larson HJ. Strategies for addressing vaccine hesitancy – A systematic review. Vaccine [Internet]. 2015 Aug [cited 2021 Apr 19];33(34):4180–90. Available from: https://linkinghub.elsevier.com/retrieve/pii/S0264410X15005046
21. Verger P, Scronias D, Dauby N, Adedzi KA, Gobert C, Bergeat M, et al. Attitudes of healthcare workers towards COVID-19 vaccination: a survey in France and French-speaking parts of Belgium and Canada, 2020. Euro Surveill [Internet]. 2021 Jan 21 [cited 2021 Apr 19];26(3):2002047. Available from: https://www.eurosurveillance.org/content/10.2807/1560-7917.ES.2021.26.3.2002047
22. Eguia H, Vinciarelli F, Bosque-Prous M, Kristensen T, Saigí-Rubió F. Spain’s Hesitation at the Gates of a COVID-19 Vaccine. Vaccines [Internet]. 2021 Feb [cited 2021 Apr 19];9(2):170. Available from: https://www.mdpi.com/2076-393X/9/2/170
23. Fokoun C. Strategies implemented to address vaccine hesitancy in France: A review article. Hum Vaccin Immunother [Internet]. 2018 Jul 3 [cited 2021 Apr 19];14(7):1580–90. Available from: https://doi.org/10.1080/21645515.2018.1458807
24. Castañeda-Vasquez DE, Ruiz-Padilla JP, Botello-Hernandez E. Vaccine Hesitancy against SARS-CoV-2 in Health Personnel of Northeastern Mexico and its Determinants. J Occup Environ Med [Internet]. 2021 Apr 12 [cited 2021 Apr 19];Publish Ahead of Print. Available from: https://journals.lww.com/joem/Abstract/9000/Vaccine_Hesitancy_against_SARS_CoV_2_in_Health.97927.aspx
25. World Health Organization; United Nations Children’s Fund. Data for action: achieving high uptake of COVID-19 vaccines. Geneva: WHO; 2021.
26. Gadoth A, Halbrook M, Martin-Blais R, Gray A, Tobin NH, Ferbas KG, et al. Assessment of COVID-19 vaccine acceptance among healthcare workers in Los Angeles. medRxiv [Internet]. 2020 Nov 19 [cited 2021 Jun 15];2020.11.18.20234468. Available from: https://www.medrxiv.org/content/10.1101/2020.11.18.20234468v1
27. European Centre for Disease Prevention and Control. Vaccine hesitancy among healthcare workers and their patients in Europe [Internet]. Solna: ECDC; 2015 [cited 2021 Aug 14]. Available from: https://www.ecdc.europa.eu/en/publications-data/vaccine-hesitancy-among-healthcare-workers-and-their-patients-europe
28. World Health Organization. WHO SAGE Roadmap For Prioritizing Uses Of COVID-19 Vaccines In The Context Of Limited Supply [Internet]. Geneva: WHO; 2021 [cited 2021 Aug 14]. Available from: https://www.who.int/publications-detail-redirect/who-sage-roadmap-for-prioritizing-uses-of-covid-19-vaccines-in-the-context-of-limited-supply
33REFERENCES

29. Fares S, Elmnyer MM, Mohamed SS, Elsayed R. COVID-19 Vaccination Perception and Attitude among Healthcare Workers in Egypt. J Prim Care Community Health [Internet]. 2021 Jan 1 [cited 2021 May 4];12:21501327211013304. Available from: https://doi.org/10.1177/21501327211013303
30. Wang K, Wong ELY, Ho KF, Cheung AWL, Chan EYY, Yeoh EK, et al. Intention of nurses to accept coronavirus disease 2019 vaccination and change of intention to accept seasonal influenza vaccination during the coronavirus disease 2019 pandemic: A cross-sectional survey. Vaccine [Internet]. 2020 Oct 21 [cited 2021 Aug 14];38(45). Available from: https://doi.org/10.1016/j.vaccine.2020.09.021
31. Sherman SM, Smith LE, Sim J, Amlôt R, Cutts M, Dasch H, et al. COVID-19 vaccination intention in the UK: results from the COVID-19 vaccination acceptability study (CoVAccS), a nationally representative cross-sectional survey. Hum Vaccin Immunother [Internet]. [cited 2021 Jul 2];17(6):1612–21. Available from: https://www.ncbi.nlm.nih.gov/pmc/articles/PMC8115754/
32. Pogue K, Jensen JL, Stancil CK, Ferguson DG, Hughes SJ, Mello EJ, et al. Influences on Attitudes Regarding Potential COVID-19 Vaccination in the United States. Vaccines (Basel). 2020 Oct 3;8(4):E582.
33. Fakonti G, Kyprianidou M, Toumbis G, Giannakou K. Attitudes and Acceptance of COVID-19 Vaccination Among Nurses and Midwives in Cyprus: A Cross-Sectional Survey. Front Public Health [Internet]. 2021 [cited 2021 Aug 14];9:481. Available from: https://www.frontiersin.org/article/10.3389/fpubh.2021.656138
34. World Health Organization. Statement of the Strategic Advisory Group of Experts (SAGE) on Immunization: Continued review of emerging evidence on AstraZeneca COVID-19 Vaccines [Internet]. Geneva: WHO; 2021 [cited 2021 Aug 14]. Available from: https://www.who.int/news/item/22-04-2021-statement-of-the-strategic-advisory-group-of-experts-(sage)-on-immunization-continued-review-of-emerging-evidence-on-astrazeneca-covid-19-vaccines
34 HEALTHCARE WORKERS AND COVID-19 VACCINATION IN THE CARIBBEAN

AnnexesA. Questionnaire
B. Number of Responses, by Question
C. Summary of Responses Including Colored Bars and Chi-Square
and Logistic Regression P-Values, by Question
D. Survey Pilot: Additional Information
E. Messaging for Caribbean Healthcare Workers
Based on Survey Results
35ANNEXES

Annex A. Questionnaire
48
Annex A. Questionnaire
CCOONNCCEERRNNSS,, AATTTTIITTUUDDEESS,, AANNDD IINNTTEENNDDEEDD PPRRAACCTTIICCEESS OOFF HHEEAALLTTHHCCAARREE WWOORRKKEERRSS TTOO CCOOVVIIDD--1199 VVAACCCCIINNEE IINN TTHHEE CCAARRIIBBBBEEAANN
Thank you very much for participating in this survey for healthcare workers. The questionnaire has a duration of no more than eight (8) minutes. No. _______
1 Country where you work: ______________
2 Sex: Male Female Other
3. Age: _____
4 Job title/Post: ___________________ 5. HCW Category:
Please choose the box with the response that best fits your personal concerns, attitudes and intended practices:
Strongly
Agree Agree Don't Know Disagree
Strongly Disagree
Attitudes to vaccines 6 Vaccines are important for my health
7 Getting vaccines is a good way to protect myself from disease
8 Overall, vaccines are safe 9 Overall, vaccines are effective
10 Getting vaccinated is important for the health of others in my community
11 The information I receive about vaccines from public health authorities/ my healthcare provider is reliable and trustworthy
12 Generally, I do what my doctor or health care provider recommends about vaccines for myself and my family
Vaccine readiness Strongly
Agree Agree Don't Know Disagree
Strongly Disagree
13 New vaccines carry more risk than older vaccines
14 I would recommend a COVID-19 vaccine to friends and family
36 HEALTHCARE WORKERS AND COVID-19 VACCINATION IN THE CARIBBEAN

49
15 I am concerned about serious adverse effects of vaccines
Attitudes towards COVID-19 vaccine Strongly
Agree Agree Don't Know Disagree
Strongly Disagree
16 A coronavirus (COVID−19) vaccine will protect me from severe COVID disease
17 I am confident in the scientific approval process for a new coronavirus (COVID−19) vaccine
18 I would be willing to participate in a vaccine trial for a coronavirus (COVID−19) vaccine
If a new coronavirus (COVID−19) vaccine becomes publicly available:
19 I intend to get it as soon as possible
20 I intend to wait to see how it affects others before I get it
21 I do not intend on getting it soon, but might sometime in the future
22 I do not intend to ever get the vaccine
Please indicate how you feel about the statements below
Strongly Agree Agree Don't
Know Disagree Strongly
Disagree
23 I am confident there will be other effective treatments soon
24 I do not yet know enough about the vaccine to make a decision
25 I want to gain natural immunity to the virus that causes COVID−19
26 Development of the vaccine may be rushed/the vaccine may not be thoroughly tested prior to approval
27 I believe vaccines may give you the disease they are designed to protect against
28 Other reasons for delaying or refusing COVID-19 vaccine: Attitudes towards COVID-19 vaccine
The following factors contributed to my opinion on a COVID−19 vaccine:
Strongly Agree Agree Don't
Know Disagree Strongly
Disagree
29 The pace at which the vaccine was researched and developed
30 The unfolding & frequently evolving science of SARS−CoV−2
31 Actions and opinions of my friends and family regarding the vaccine
32 The relationship between coverage rates and community transmission
37ANNEXES

50
33 My own research on COVID−19 vaccines 34 The country in which a vaccine is manufactured 35 The potential cost of a COVID−19 vaccine 36 Information I’ve seen on social media. 37 Other factors:
Attitudes towards influenza vaccine Strongly Agree Agree Don't
Know Disagree Strongly Disagree
38 I would take the flu vaccine if offered 39 If you disagree, what are the reasons why? __________________________________________
Strongly Agree Agree Don't
Know Disagree Strongly Disagree
40 I would recommend the flu vaccine to friends and family
41 If you disagree, what are the reasons why? _____________________________________________
Thanks again for your participation!
Please, feel free to share this survey with other healthcare workers who may be interested in participating.
38 HEALTHCARE WORKERS AND COVID-19 VACCINATION IN THE CARIBBEAN

Annex B. Number of Responses, by Question
39ANNEXES

All 69 29 2 0 98 2 1 159
HCW: Physicians 78 20 1 0 98 2 516 1.0
HCW: Nurses 58 40 2 0 98 2 320 0.649 0.6 0.372 0.2 1.9
HCW: Public Health Pros 72 27 1 0 99 1 113 2.0 0.525 0.2 16.2
HCW: Allied Pros 65 32 3 0 97 3 146 0.5 0.27 0.1 1.7
HCW: Other 48 47 3 2 95 5 64 0.362 0.3 0.102 0.1 1.3
Physician (General and family) 78 21 1 1 98 2 292
Physician (Surgical) 68 30 2 0 98 2 53
Physician (Medical) 82 16 2 0 98 2 147
Physician (Emergency) 79 21 0 0 100 0 24 0.917
Nurse (Community and public health) 68 31 0 1 99 1 100
Nurse (Critical care) 48 48 4 0 96 4 46
Nurse (Outpatients) 69 28 3 0 97 3 36
Nurse (Ward) 48 50 3 0 97 3 119 0.647
Care category: Care 71 27 2 0 98 2 733
Care category: Public health 68 30 2 0 98 2 362
Care category: Other 48 47 3 2 95 5 64 0.355
Sex: Male 73 23 3 1 96 4 277 1.0
Sex: Female 67 31 1 0 98 2 876 0.018 2.9 0.026 1.1 7.5
Age Q1: 21–32 67 33 1 0 99 1 296 1.0
Age Q2: 33–40 70 29 1 0 99 1 278 0.5 0.387 0.1 2.6
Age Q3: 41–50 68 29 2 0 97 3 292 0.3 0.101 0.1 1.3
Age Q4: 51–87 71 26 2 1 97 3 278 0.16 0.2 0.081 0.1 1.2
TABLE Q-6. Attitudes: Vaccines are important for my health
STRONGLY AGREE
(%)
AGREE (%)
DIS-AGREE
(%)
STRONGLY DISAGREE
(%)
AGREE OR STRONGLY
AGREE (%)
DISAGREE OR STRONGLY DISAGREE
(%)
N CHI-SQUARE P-VALUE
LOGISTIC REGRESSION
ADJUSTED ODDS RATIO
P-VALUE LOWER BOUND
UPPER BOUND
ANNEX C
Summary of Responses Including Colored Bars and Chi-Square and Logistic Regression P-Values, by Question
Each table in this annex summarizes responses to a
single survey question. The rows represent subgroups
of respondents. The first four columns summarize the
proportion who answered Strongly agree, Agree, Disagree,
and Strongly disagree. The next two columns consolidate
the responses into two categories: Strongly agree and
Agree versus Disagree and Strongly disagree. The next
column indicates the number of persons in each subgroup
who responded to the question. The next column lists
chi-square p-values that test the hypothesis that the
percentage who Strongly agree or Agree is the same:
a) Between nurses and physicians
b) Across all categories of healthcare workers
c) Among categories of physicians
d) Among categories of nurses
e) Among care categories
f) Between men and women
g) Among age quartiles.
P-values smaller than 0.05 are listed in a bold font and
indicate a statistically significant difference.
The final four columns show results from multivariable
logistic regression, where the outcome is 1 if the
respondent selected Strongly agree or Agree and is
0 if they selected Disagree or Strongly disagree. The
regression uses three categorical predictors: healthcare
worker category (physician is the reference group);
sex (male is the reference); and age quartile (youngest
is the reference group). Each table lists odds ratios,
p-values, and 95% confidence intervals for the odds
ratios. P-values smaller than 0.05 are listed in a bold
font and indicate a statistically significant result
when simultaneously adjusting for differences in job
category, sex, and age.
40 HEALTHCARE WORKERS AND COVID-19 VACCINATION IN THE CARIBBEAN

All 67 30 2 1 98 2 1 143
HCW: Physicians 77 21 1 1 98 2 507 1.0
HCW: Nurses 56 41 3 1 96 4 312 0.072 0.4 0.115 0.1 1.2
HCW: Public Health Pros 72 27 1 0 99 1 113 1.7 0.642 0.2 13.7
HCW: Allied Pros 63 33 3 1 96 4 147 0.5 0.236 0.1 1.6
HCW: Other 48 48 2 2 97 3 64 0.196 0.4 0.272 0.1 2.0
Physician (General and family) 78 20 1 1 98 2 287
Physician (Surgical) 67 33 0 0 100 0 52
Physician (Medical) 79 19 1 0 99 1 144
Physician (Emergency) 79 21 0 0 100 0 24 0.629
Nurse (Community and public health) 67 32 0 1 99 1 96
Nurse (Critical care) 45 51 2 2 96 4 47
Nurse (Outpatients) 65 32 3 0 97 3 34
Nurse (Ward) 47 47 5 1 94 6 116 0.293
Care category: Care 69 28 2 1 98 3 720
Care category: Public health 67 31 2 1 98 2 359
Care category: Other 48 48 2 2 97 3 64 0.903
Sex: Male 72 25 2 1 97 3 272 1.0
Sex: Female 66 32 2 1 98 2 865 0.482 1.8 0.255 0.7 4.8
Age Q1: 21–32 64 34 1 1 98 2 292 1.0
Age Q2: 33–40 66 33 0 1 99 1 278 1.6 0.543 0.4 6.7
Age Q3: 41–50 68 30 2 0 98 2 285 0.7 0.589 0.2 2.3
Age Q4: 51–87 73 24 2 1 97 3 272 0.478 0.6 0.393 0.2 1.9
TABLE Q-7. Attitudes: Vaccines are a good way to protect myself from disease
STRONGLY AGREE
(%)
AGREE (%)
DIS-AGREE
(%)
STRONGLY DISAGREE
(%)
AGREE OR STRONGLY
AGREE (%)
DISAGREE OR STRONGLY DISAGREE
(%)
N CHI-SQUARE P-VALUE
LOGISTIC REGRESSION
ADJUSTED ODDS RATIO
P-VALUE LOWER BOUND
UPPER BOUND
All 41 53 4 2 95 5 1 075
HCW: Physicians 47 48 3 2 96 4 495 1.0
HCW: Nurses 34 61 5 1 94 6 286 0.472 0.5 0.073 0.2 1.1
HCW: Public Health Pros 45 50 5 0 95 5 102 0.8 0.642 0.3 2.2
HCW: Allied Pros 35 57 5 4 91 9 136 0.5 0.088 0.2 1.1
HCW: Other 34 59 5 2 93 7 56 0.364 0.7 0.606 0.2 2.5
Physician (General and family) 45 51 2 2 95 5 281
Physician (Surgical) 45 47 4 4 92 8 51
Physician (Medical) 51 46 4 0 96 4 140
Physician (Emergency) 65 35 0 0 100 0 23 0.435
Nurse (Community and public health) 47 53 0 0 100 0 93
Nurse (Critical care) 33 55 13 0 88 13 40
Nurse (Outpatients) 23 74 0 3 97 3 31
Nurse (Ward) 26 64 8 2 91 9 106 0.008
Care category: Care 42 53 4 2 94 6 685
Care category: Public health 41 54 4 1 95 5 334
Care category: Other 34 59 5 2 93 7 56 0.818
Sex: Male 44 46 7 3 90 10 261 1.0
Sex: Female 40 56 3 1 96 4 809 <0.001 3.1 <0.001 1.7 5.8
Age Q1: 21–32 36 59 4 1 94 6 267 1.0
Age Q2: 33–40 40 53 5 2 93 7 262 0.7 0.353 0.3 1.5
Age Q3: 41–50 42 53 4 1 95 5 273 1.2 0.608 0.6 2.7
Age Q4: 51–87 48 48 2 1 97 3 260 0.349 1.7 0.216 0.7 4.1
TABLE Q-8. Attitudes: Vaccines are safe
STRONGLY AGREE
(%)
AGREE (%)
DIS-AGREE
(%)
STRONGLY DISAGREE
(%)
AGREE OR STRONGLY
AGREE (%)
DISAGREE OR STRONGLY DISAGREE
(%)
N CHI-SQUARE P-VALUE
LOGISTIC REGRESSION
ADJUSTED ODDS RATIO
P-VALUE LOWER BOUND
UPPER BOUND
41ANNEXES

All 46 51 2 1 97 3 1 081
HCW: Physicians 52 44 2 1 97 3 502 1.0
HCW: Nurses 39 58 3 1 96 4 281 0.899 0.6 0.237 0.2 1.4
HCW: Public Health Pros 47 51 2 0 98 2 108 1.6 0.56 0.3 7.0
HCW: Allied Pros 42 55 2 1 97 3 132 2.0 0.352 0.5 9.0
HCW: Other 40 60 0 0 100 0 58 0.594 1.0
Physician (General and family) 52 44 2 2 95 5 287
Physician (Surgical) 50 48 2 0 98 2 50
Physician (Medical) 50 48 1 1 98 2 142
Physician (Emergency) 74 26 0 0 100 0 23 0.399
Nurse (Community and public health) 53 46 1 0 99 1 95
Nurse (Critical care) 41 51 5 3 92 8 37
Nurse (Outpatients) 35 61 3 0 97 3 31
Nurse (Ward) 27 68 4 1 95 5 101 0.236
Care category: Care 47 49 2 1 96 4 685
Care category: Public health 47 51 2 0 98 2 338
Care category: Other 40 60 0 0 100 0 58 0.122
Sex: Male 48 47 4 2 95 5 257 1.0
Sex: Female 46 52 2 1 98 2 818 0.011 3.2 0.005 1.4 7.0
Age Q1: 21–32 41 55 2 1 96 4 283 1.0
Age Q2: 33–40 45 51 3 1 96 4 264 0.8 0.578 0.3 1.9
Age Q3: 41–50 47 51 2 0 98 2 265 2.0 0.215 0.7 6.0
Age Q4: 51–87 54 44 1 1 98 2 257 0.295 2.1 0.176 0.7 6.4
TABLE Q-9. Attitudes: Vaccines are effective
STRONGLY AGREE
(%)
AGREE (%)
DIS-AGREE
(%)
STRONGLY DISAGREE
(%)
AGREE OR STRONGLY
AGREE (%)
DISAGREE OR STRONGLY DISAGREE
(%)
N CHI-SQUARE P-VALUE
LOGISTIC REGRESSION
ADJUSTED ODDS RATIO
P-VALUE LOWER BOUND
UPPER BOUND
All 63 35 2 0 98 2 1 143
HCW: Physicians 74 25 1 0 99 1 513 1.0
HCW: Nurses 54 44 2 0 98 2 308 0.24 0.3 0.061 0.1 1.1
HCW: Public Health Pros 60 39 1 0 99 1 114 0.8 0.875 0.1 7.7
HCW: Allied Pros 55 41 3 1 96 4 144 0.2 0.048 0.1 1.0
HCW: Other 42 53 3 2 95 5 64 0.042 0.2 0.077 0.0 1.2
Physician (General and family) 72 27 1 0 99 1 292
Physician (Surgical) 73 27 0 0 100 0 51
Physician (Medical) 77 22 1 0 99 1 147
Physician (Emergency) 87 13 0 0 100 0 23 0.81
Nurse (Community and public health) 67 31 2 0 98 2 99
Nurse (Critical care) 49 49 2 0 98 2 43
Nurse (Outpatients) 60 37 3 0 97 3 35
Nurse (Ward) 43 55 2 0 98 2 112 0.983
Care category: Care 67 32 1 0 99 1 719
Care category: Public health 60 38 2 0 98 3 360
Care category: Other 42 53 3 2 95 5 64 0.077
Sex: Male 65 32 3 0 97 3 275 1.0
Sex: Female 63 36 1 0 99 1 863 0.043 3.1 0.04 1.1 9.2
Age Q1: 21–32 62 37 1 0 99 1 297 1.0
Age Q2: 33–40 62 37 1 0 99 1 276 1.2 0.785 0.3 5.7
Age Q3: 41–50 61 38 1 0 99 1 282 1.1 0.916 0.3 4.4
Age Q4: 51–87 68 30 2 0 98 2 272 0.732 0.7 0.518 0.2 2.4
TABLE Q-10. Attitudes: Vaccines are important for the health of others
STRONGLY AGREE
(%)
AGREE (%)
DIS-AGREE
(%)
STRONGLY DISAGREE
(%)
AGREE OR STRONGLY
AGREE (%)
DISAGREE OR STRONGLY DISAGREE
(%)
N CHI-SQUARE P-VALUE
LOGISTIC REGRESSION
ADJUSTED ODDS RATIO
P-VALUE LOWER BOUND
UPPER BOUND
All 38 54 7 1 92 8 1 144
HCW: Physicians 44 50 5 1 94 6 505 1.0
HCW: Nurses 31 60 8 1 91 9 306 0.086 0.6 0.044 0.3 1.0
HCW: Public Health Pros 41 53 6 0 94 6 115 0.9 0.904 0.4 2.2
HCW: Allied Pros 33 54 12 1 87 13 150 0.5 0.033 0.3 0.9
HCW: Other 25 66 9 0 91 9 68 0.071 0.7 0.534 0.3 2.0
Physician (General and family) 44 49 5 2 94 6 286
Physician (Surgical) 32 57 11 0 89 11 53
Physician (Medical) 47 50 3 0 97 3 144
Physician (Emergency) 50 45 0 5 95 5 22 0.216
Nurse (Community and public health) 43 52 5 0 95 5 96
Nurse (Critical care) 26 60 12 2 86 14 43
Nurse (Outpatients) 25 72 3 0 97 3 36
Nurse (Ward) 24 65 10 1 89 11 112 0.153
Care category: Care 39 54 6 1 93 7 712
Care category: Public health 38 53 9 0 91 9 364
Care category: Other 25 66 9 0 91 9 68 0.661
Sex: Male 39 53 7 1 91 9 279 1.0
Sex: Female 37 55 7 1 93 7 859 0.532 1.3 0.41 0.7 2.2
Age Q1: 21–32 36 58 5 1 94 6 290 1.0
Age Q2: 33–40 33 57 9 1 90 10 275 0.5 0.053 0.3 1.0
Age Q3: 41–50 36 56 8 0 92 8 287 0.7 0.305 0.4 1.4
Age Q4: 51–87 46 49 5 0 95 5 274 0.105 1.2 0.638 0.6 2.5
TABLE Q-12. Attitudes: I do what my care provider recommends about vaccines
STRONGLY AGREE
(%)
AGREE (%)
DIS-AGREE
(%)
STRONGLY DISAGREE
(%)
AGREE OR STRONGLY
AGREE (%)
DISAGREE OR STRONGLY DISAGREE
(%)
N CHI-SQUARE P-VALUE
LOGISTIC REGRESSION
ADJUSTED ODDS RATIO
P-VALUE LOWER BOUND
UPPER BOUND
42 HEALTHCARE WORKERS AND COVID-19 VACCINATION IN THE CARIBBEAN

All 39 55 4 2 94 6 1 031
HCW: Physicians 45 49 4 2 94 6 468 1.0
HCW: Nurses 33 60 5 2 93 7 285 0.573 0.5 0.059 0.3 1.0
HCW: Public Health Pros 42 58 0 0 100 0 100 1.0
HCW: Allied Pros 34 57 8 1 91 9 120 0.7 0.495 0.3 1.7
HCW: Other 26 67 5 2 93 7 58 0.062 1.0 0.988 0.3 3.5
Physician (General and family) 46 48 4 3 94 6 267
Physician (Surgical) 42 53 2 2 95 5 43
Physician (Medical) 44 50 4 1 94 6 140
Physician (Emergency) 56 39 6 0 94 6 18 0.973
Nurse (Community and public health) 46 51 3 0 97 3 95
Nurse (Critical care) 21 68 5 5 89 11 38
Nurse (Outpatients) 23 74 3 0 97 3 35
Nurse (Ward) 26 63 9 2 89 11 101 0.107
Care category: Care 40 53 5 2 93 7 656
Care category: Public health 40 55 4 0 96 4 317
Care category: Other 26 67 5 2 93 7 58 0.318
Sex: Male 44 46 6 4 90 10 244 1.0
Sex: Female 38 58 4 1 95 5 781 0.002 2.8 0.001 1.5 5.1
Age Q1: 21–32 34 58 6 2 92 8 258 1.0
Age Q2: 33–40 40 54 3 2 95 5 242 1.4 0.375 0.7 2.9
Age Q3: 41–50 35 59 4 2 94 6 263 1.4 0.39 0.7 2.8
Age Q4: 51–87 48 49 2 1 96 4 254 0.229 2.4 0.036 1.1 5.4
TABLE Q-11. Attitudes: Vaccine information is reliable and trustworthy
STRONGLY AGREE
(%)
AGREE (%)
DIS-AGREE
(%)
STRONGLY DISAGREE
(%)
AGREE OR STRONGLY
AGREE (%)
DISAGREE OR STRONGLY DISAGREE
(%)
N CHI-SQUARE P-VALUE
LOGISTIC REGRESSION
ADJUSTED ODDS RATIO
P-VALUE LOWER BOUND
UPPER BOUND
All 38 54 7 1 92 8 1 144
HCW: Physicians 44 50 5 1 94 6 505 1.0
HCW: Nurses 31 60 8 1 91 9 306 0.086 0.6 0.044 0.3 1.0
HCW: Public Health Pros 41 53 6 0 94 6 115 0.9 0.904 0.4 2.2
HCW: Allied Pros 33 54 12 1 87 13 150 0.5 0.033 0.3 0.9
HCW: Other 25 66 9 0 91 9 68 0.071 0.7 0.534 0.3 2.0
Physician (General and family) 44 49 5 2 94 6 286
Physician (Surgical) 32 57 11 0 89 11 53
Physician (Medical) 47 50 3 0 97 3 144
Physician (Emergency) 50 45 0 5 95 5 22 0.216
Nurse (Community and public health) 43 52 5 0 95 5 96
Nurse (Critical care) 26 60 12 2 86 14 43
Nurse (Outpatients) 25 72 3 0 97 3 36
Nurse (Ward) 24 65 10 1 89 11 112 0.153
Care category: Care 39 54 6 1 93 7 712
Care category: Public health 38 53 9 0 91 9 364
Care category: Other 25 66 9 0 91 9 68 0.661
Sex: Male 39 53 7 1 91 9 279 1.0
Sex: Female 37 55 7 1 93 7 859 0.532 1.3 0.41 0.7 2.2
Age Q1: 21–32 36 58 5 1 94 6 290 1.0
Age Q2: 33–40 33 57 9 1 90 10 275 0.5 0.053 0.3 1.0
Age Q3: 41–50 36 56 8 0 92 8 287 0.7 0.305 0.4 1.4
Age Q4: 51–87 46 49 5 0 95 5 274 0.105 1.2 0.638 0.6 2.5
TABLE Q-12. Attitudes: I do what my care provider recommends about vaccines
STRONGLY AGREE
(%)
AGREE (%)
DIS-AGREE
(%)
STRONGLY DISAGREE
(%)
AGREE OR STRONGLY
AGREE (%)
DISAGREE OR STRONGLY DISAGREE
(%)
N CHI-SQUARE P-VALUE
LOGISTIC REGRESSION
ADJUSTED ODDS RATIO
P-VALUE LOWER BOUND
UPPER BOUND
43ANNEXES

All 17 38 36 8 56 44 822
HCW: Physicians 12 36 43 9 48 52 372 1.0
HCW: Nurses 25 40 29 7 65 35 221 <0.001 2.0 <0.001 1.4 2.8
HCW: Public Health Pros 11 34 41 14 45 55 83 0.9 0.822 0.6 1.5
HCW: Allied Pros 21 43 29 7 64 36 103 1.9 0.005 1.2 3.0
HCW: Other 28 47 21 5 74 26 43 <0.001 3.2 0.002 1.5 6.5
Physician (General and family) 13 36 44 8 48 52 211
Physician (Surgical) 15 40 40 5 55 45 40
Physician (Medical) 10 33 48 10 43 57 103
Physician (Emergency) 11 50 17 22 61 39 18 0.364
Nurse (Community and public health) 19 30 41 10 49 51 73
Nurse (Critical care) 32 52 13 3 84 16 31
Nurse (Outpatients) 19 48 33 0 67 33 27
Nurse (Ward) 32 38 23 8 70 30 79 0.004
Care category: Care 17 38 37 8 55 45 519
Care category: Public health 17 37 36 10 54 46 260
Care category: Other 28 47 21 5 74 26 43 0.037
Sex: Male 18 34 38 11 51 49 205 1.0
Sex: Female 17 40 36 7 57 43 613 0.132 1.1 0.602 0.8 1.5
Age Q1: 21–32 19 40 37 4 59 41 210 1.0
Age Q2: 33–40 16 39 34 11 55 45 199 0.9 0.465 0.6 1.3
Age Q3: 41–50 17 34 39 9 52 48 206 0.7 0.155 0.5 1.1
Age Q4: 51–87 17 39 35 9 55 45 193 0.604 0.8 0.42 0.6 1.3
TABLE Q-13. Readiness: New vaccines carry more risk than older vaccines
STRONGLY AGREE
(%)
AGREE (%)
DIS-AGREE
(%)
STRONGLY DISAGREE
(%)
AGREE OR STRONGLY
AGREE (%)
DISAGREE OR STRONGLY DISAGREE
(%)
N CHI-SQUARE P-VALUE
LOGISTIC REGRESSION
ADJUSTED ODDS RATIO
P-VALUE LOWER BOUND
UPPER BOUND
All 46 42 7 4 88 12 1 008
HCW: Physicians 57 35 5 4 92 8 477 1.0
HCW: Nurses 32 54 8 5 87 13 254 0.033 0.4 0.001 0.2 0.7
HCW: Public Health Pros 54 40 4 1 95 5 94 1.3 0.547 0.5 3.6
HCW: Allied Pros 36 43 17 4 79 21 127 0.3 <0.001 0.2 0.6
HCW: Other 27 54 11 9 80 20 56 <0.001 0.4 0.022 0.2 0.9
Physician (General and family) 52 37 6 5 89 11 268
Physician (Surgical) 63 31 4 2 94 6 48
Physician (Medical) 65 31 3 1 96 4 140
Physician (Emergency) 57 33 5 5 90 10 21 0.142
Nurse (Community and public health) 40 54 4 2 94 6 85
Nurse (Critical care) 18 56 18 9 74 26 34
Nurse (Outpatients) 31 53 13 3 84 16 32
Nurse (Ward) 32 52 9 7 84 16 87 0.023
Care category: Care 50 40 6 5 89 11 643
Care category: Public health 42 46 9 3 88 12 309
Care category: Other 27 54 11 9 80 20 56 0.132
Sex: Male 50 35 8 6 86 14 256 1.0
Sex: Female 45 45 7 3 89 11 746 0.096 1.8 0.011 1.1 2.9
Age Q1: 21–32 40 44 9 7 84 16 246 1.0
Age Q2: 33–40 44 44 8 4 87 13 236 1.3 0.329 0.8 2.2
Age Q3: 41–50 44 46 8 2 90 10 255 1.9 0.023 1.1 3.3
Age Q4: 51–87 58 36 4 2 94 6 253 0.006 3.1 <0.001 1.6 5.7
TABLE Q-14. Readiness: I would recommend a COVID-19 vaccine to friends and family
STRONGLY AGREE
(%)
AGREE (%)
DIS-AGREE
(%)
STRONGLY DISAGREE
(%)
AGREE OR STRONGLY
AGREE (%)
DISAGREE OR STRONGLY DISAGREE
(%)
N CHI-SQUARE P-VALUE
LOGISTIC REGRESSION
ADJUSTED ODDS RATIO
P-VALUE LOWER BOUND
UPPER BOUND
44 HEALTHCARE WORKERS AND COVID-19 VACCINATION IN THE CARIBBEAN

All 25 53 19 3 77 23 1 129
HCW: Physicians 18 55 23 5 73 27 494 1.0
HCW: Nurses 35 48 16 2 82 18 306 0.002 1.9 <0.001 1.3 2.8
HCW: Public Health Pros 26 48 23 4 74 26 111 1.1 0.587 0.7 1.8
HCW: Allied Pros 25 57 15 3 82 18 150 1.7 0.022 1.1 2.7
HCW: Other 29 56 13 1 85 15 68 0.004 2.2 0.03 1.1 4.4
Physician (General and family) 17 54 24 4 72 28 281
Physician (Surgical) 32 46 22 0 78 22 50
Physician (Medical) 15 59 21 5 74 26 140
Physician (Emergency) 13 57 13 17 70 30 23 0.785
Nurse (Community and public health) 27 51 20 2 78 22 95
Nurse (Critical care) 49 38 13 0 87 13 45
Nurse (Outpatients) 31 51 17 0 83 17 35
Nurse (Ward) 37 46 15 3 82 18 114 0.629
Care category: Care 24 52 20 4 76 24 702
Care category: Public health 26 52 19 3 79 21 359
Care category: Other 29 56 13 1 85 15 68 0.182
Sex: Male 24 53 17 6 77 23 270 1.0
Sex: Female 25 53 20 2 78 22 853 0.845 0.9 0.433 0.6 1.2
Age Q1: 21–32 28 53 17 2 81 19 295 1.0
Age Q2: 33–40 24 53 20 3 76 24 267 0.8 0.196 0.5 1.1
Age Q3: 41–50 23 54 21 3 76 24 280 0.7 0.131 0.5 1.1
Age Q4: 51–87 24 50 20 5 75 25 271 0.293 0.7 0.041 0.4 1.0
TABLE Q-15. Readiness: I am concerned about serious adverse effects of vaccines
STRONGLY AGREE
(%)
AGREE (%)
DIS-AGREE
(%)
STRONGLY DISAGREE
(%)
AGREE OR STRONGLY
AGREE (%)
DISAGREE OR STRONGLY DISAGREE
(%)
N CHI-SQUARE P-VALUE
LOGISTIC REGRESSION
ADJUSTED ODDS RATIO
P-VALUE LOWER BOUND
UPPER BOUND
All 49 43 6 3 92 8 909
HCW: Physicians 57 39 2 1 96 4 446 1.0
HCW: Nurses 39 46 10 5 85 15 221 <0.001 0.2 <0.001 0.1 0.3
HCW: Public Health Pros 49 48 2 1 97 3 86 0.9 0.878 0.3 3.2
HCW: Allied Pros 36 46 15 3 82 18 111 0.2 <0.001 0.1 0.4
HCW: Other 38 56 2 4 93 7 45 <0.001 0.7 0.66 0.2 3.2
Physician (General and family) 53 41 4 2 94 6 248
Physician (Surgical) 61 35 2 2 96 4 46
Physician (Medical) 65 35 0 0 100 0 133
Physician (Emergency) 47 53 0 0 100 0 19 0.024
Nurse (Community and public health) 53 42 4 1 95 5 74
Nurse (Critical care) 13 52 19 16 65 35 31
Nurse (Outpatients) 45 48 7 0 93 7 29
Nurse (Ward) 34 45 13 8 79 21 77 <0.001
Care category: Care 51 41 5 3 92 8 591
Care category: Public health 45 45 8 2 90 10 273
Care category: Other 38 56 2 4 93 7 45 0.533
Sex: Male 51 41 5 3 92 8 231 1.0
Sex: Female 48 44 6 3 92 8 673 0.747 1.4 0.281 0.8 2.7
Age Q1: 21–32 41 45 11 3 86 14 222 1.0
Age Q2: 33–40 52 42 4 2 93 7 213 2.2 0.02 1.1 4.4
Age Q3: 41–50 43 50 4 4 92 8 224 2.3 0.01 1.2 4.5
Age Q4: 51–87 59 37 3 1 96 4 237 0.001 4.3 <0.001 2.0 9.2
TABLE Q-16. COVID-19: A COVID−19 vaccine will protect me from severe COVID disease
STRONGLY AGREE
(%)
AGREE (%)
DIS-AGREE
(%)
STRONGLY DISAGREE
(%)
AGREE OR STRONGLY
AGREE (%)
DISAGREE OR STRONGLY DISAGREE
(%)
N CHI-SQUARE P-VALUE
LOGISTIC REGRESSION
ADJUSTED ODDS RATIO
P-VALUE LOWER BOUND
UPPER BOUND
45ANNEXES
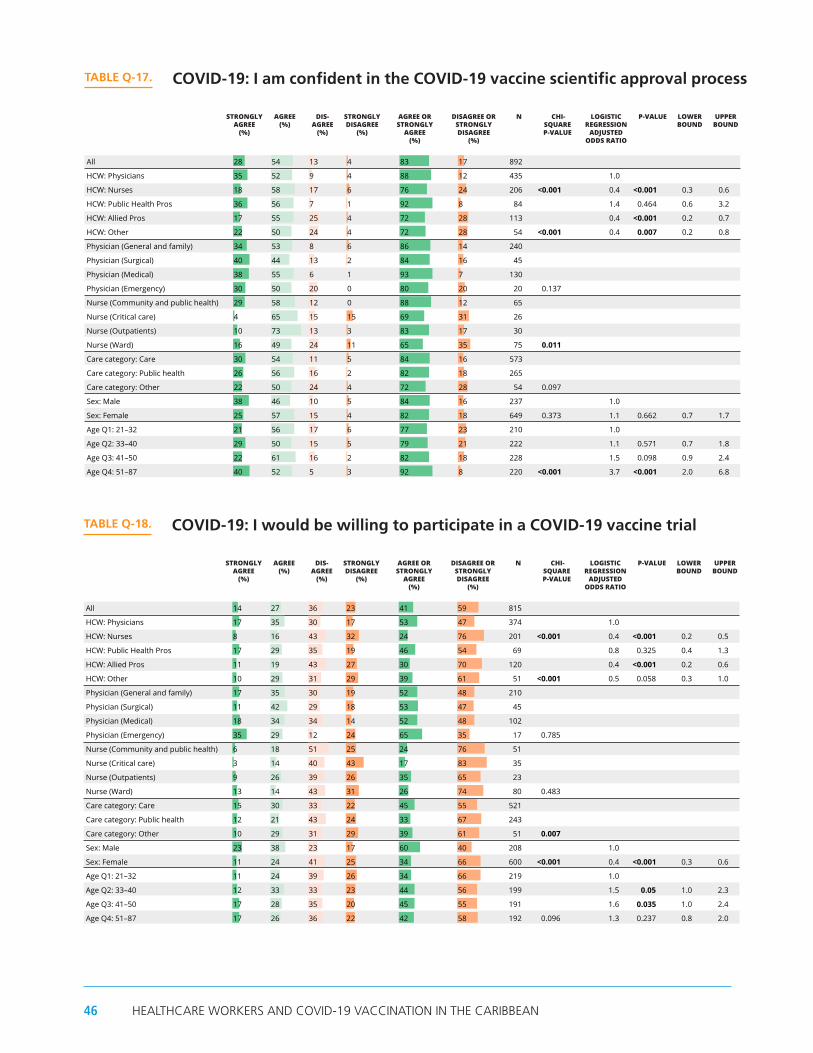
All 28 54 13 4 83 17 892
HCW: Physicians 35 52 9 4 88 12 435 1.0
HCW: Nurses 18 58 17 6 76 24 206 <0.001 0.4 <0.001 0.3 0.6
HCW: Public Health Pros 36 56 7 1 92 8 84 1.4 0.464 0.6 3.2
HCW: Allied Pros 17 55 25 4 72 28 113 0.4 <0.001 0.2 0.7
HCW: Other 22 50 24 4 72 28 54 <0.001 0.4 0.007 0.2 0.8
Physician (General and family) 34 53 8 6 86 14 240
Physician (Surgical) 40 44 13 2 84 16 45
Physician (Medical) 38 55 6 1 93 7 130
Physician (Emergency) 30 50 20 0 80 20 20 0.137
Nurse (Community and public health) 29 58 12 0 88 12 65
Nurse (Critical care) 4 65 15 15 69 31 26
Nurse (Outpatients) 10 73 13 3 83 17 30
Nurse (Ward) 16 49 24 11 65 35 75 0.011
Care category: Care 30 54 11 5 84 16 573
Care category: Public health 26 56 16 2 82 18 265
Care category: Other 22 50 24 4 72 28 54 0.097
Sex: Male 38 46 10 5 84 16 237 1.0
Sex: Female 25 57 15 4 82 18 649 0.373 1.1 0.662 0.7 1.7
Age Q1: 21–32 21 56 17 6 77 23 210 1.0
Age Q2: 33–40 29 50 15 5 79 21 222 1.1 0.571 0.7 1.8
Age Q3: 41–50 22 61 16 2 82 18 228 1.5 0.098 0.9 2.4
Age Q4: 51–87 40 52 5 3 92 8 220 <0.001 3.7 <0.001 2.0 6.8
TABLE Q-17. COVID-19: I am confident in the COVID-19 vaccine scientific approval process
STRONGLY AGREE
(%)
AGREE (%)
DIS-AGREE
(%)
STRONGLY DISAGREE
(%)
AGREE OR STRONGLY
AGREE (%)
DISAGREE OR STRONGLY DISAGREE
(%)
N CHI-SQUARE P-VALUE
LOGISTIC REGRESSION
ADJUSTED ODDS RATIO
P-VALUE LOWER BOUND
UPPER BOUND
All 14 27 36 23 41 59 815
HCW: Physicians 17 35 30 17 53 47 374 1.0
HCW: Nurses 8 16 43 32 24 76 201 <0.001 0.4 <0.001 0.2 0.5
HCW: Public Health Pros 17 29 35 19 46 54 69 0.8 0.325 0.4 1.3
HCW: Allied Pros 11 19 43 27 30 70 120 0.4 <0.001 0.2 0.6
HCW: Other 10 29 31 29 39 61 51 <0.001 0.5 0.058 0.3 1.0
Physician (General and family) 17 35 30 19 52 48 210
Physician (Surgical) 11 42 29 18 53 47 45
Physician (Medical) 18 34 34 14 52 48 102
Physician (Emergency) 35 29 12 24 65 35 17 0.785
Nurse (Community and public health) 6 18 51 25 24 76 51
Nurse (Critical care) 3 14 40 43 17 83 35
Nurse (Outpatients) 9 26 39 26 35 65 23
Nurse (Ward) 13 14 43 31 26 74 80 0.483
Care category: Care 15 30 33 22 45 55 521
Care category: Public health 12 21 43 24 33 67 243
Care category: Other 10 29 31 29 39 61 51 0.007
Sex: Male 23 38 23 17 60 40 208 1.0
Sex: Female 11 24 41 25 34 66 600 <0.001 0.4 <0.001 0.3 0.6
Age Q1: 21–32 11 24 39 26 34 66 219 1.0
Age Q2: 33–40 12 33 33 23 44 56 199 1.5 0.05 1.0 2.3
Age Q3: 41–50 17 28 35 20 45 55 191 1.6 0.035 1.0 2.4
Age Q4: 51–87 17 26 36 22 42 58 192 0.096 1.3 0.237 0.8 2.0
TABLE Q-18. COVID-19: I would be willing to participate in a COVID-19 vaccine trial
STRONGLY AGREE
(%)
AGREE (%)
DIS-AGREE
(%)
STRONGLY DISAGREE
(%)
AGREE OR STRONGLY
AGREE (%)
DISAGREE OR STRONGLY DISAGREE
(%)
N CHI-SQUARE P-VALUE
LOGISTIC REGRESSION
ADJUSTED ODDS RATIO
P-VALUE LOWER BOUND
UPPER BOUND
All 13 34 39 14 47 53 1 008
HCW: Physicians 9 27 45 19 36 64 452 1.0
HCW: Nurses 18 42 29 11 60 40 259 <0.001 3.1 <0.001 2.2 4.3
HCW: Public Health Pros 10 29 47 14 39 61 98 1.3 0.241 0.8 2.1
HCW: Allied Pros 20 39 32 9 59 41 137 2.7 <0.001 1.8 4.1
HCW: Other 18 40 37 5 58 42 62 <0.001 2.6 <0.001 1.5 4.5
Physician (General and family) 10 32 44 13 42 58 252
Physician (Surgical) 15 21 50 15 35 65 48
Physician (Medical) 5 21 46 29 25 75 131
Physician (Emergency) 14 19 38 29 33 67 21 0.013
Nurse (Community and public health) 6 39 44 10 46 54 79
Nurse (Critical care) 29 53 5 13 82 18 38
Nurse (Outpatients) 14 43 36 7 57 43 28
Nurse (Ward) 22 44 22 13 65 35 101 0.001
Care category: Care 13 32 39 17 45 55 629
Care category: Public health 14 36 39 11 50 50 317
Care category: Other 18 40 37 5 58 42 62 0.06
Sex: Male 13 28 42 18 41 59 249 1.0
Sex: Female 14 36 38 13 49 51 754 0.018 1.0 0.805 0.8 1.4
Age Q1: 21–32 19 42 30 9 61 39 251 1.0
Age Q2: 33–40 12 37 40 11 49 51 243 0.6 0.011 0.4 0.9
Age Q3: 41–50 13 29 42 16 42 58 249 0.4 <0.001 0.3 0.6
Age Q4: 51–87 10 25 44 21 35 65 251 <0.001 0.3 <0.001 0.2 0.5
TABLE Q-20. COVID-19 vaccine: I intend to wait to see how it affects others before I get it
STRONGLY AGREE
(%)
AGREE (%)
DIS-AGREE
(%)
STRONGLY DISAGREE
(%)
AGREE OR STRONGLY
AGREE (%)
DISAGREE OR STRONGLY DISAGREE
(%)
N CHI-SQUARE P-VALUE
LOGISTIC REGRESSION
ADJUSTED ODDS RATIO
P-VALUE LOWER BOUND
UPPER BOUND
46 HEALTHCARE WORKERS AND COVID-19 VACCINATION IN THE CARIBBEAN

All 28 54 13 4 83 17 892
HCW: Physicians 35 52 9 4 88 12 435 1.0
HCW: Nurses 18 58 17 6 76 24 206 <0.001 0.4 <0.001 0.3 0.6
HCW: Public Health Pros 36 56 7 1 92 8 84 1.4 0.464 0.6 3.2
HCW: Allied Pros 17 55 25 4 72 28 113 0.4 <0.001 0.2 0.7
HCW: Other 22 50 24 4 72 28 54 <0.001 0.4 0.007 0.2 0.8
Physician (General and family) 34 53 8 6 86 14 240
Physician (Surgical) 40 44 13 2 84 16 45
Physician (Medical) 38 55 6 1 93 7 130
Physician (Emergency) 30 50 20 0 80 20 20 0.137
Nurse (Community and public health) 29 58 12 0 88 12 65
Nurse (Critical care) 4 65 15 15 69 31 26
Nurse (Outpatients) 10 73 13 3 83 17 30
Nurse (Ward) 16 49 24 11 65 35 75 0.011
Care category: Care 30 54 11 5 84 16 573
Care category: Public health 26 56 16 2 82 18 265
Care category: Other 22 50 24 4 72 28 54 0.097
Sex: Male 38 46 10 5 84 16 237 1.0
Sex: Female 25 57 15 4 82 18 649 0.373 1.1 0.662 0.7 1.7
Age Q1: 21–32 21 56 17 6 77 23 210 1.0
Age Q2: 33–40 29 50 15 5 79 21 222 1.1 0.571 0.7 1.8
Age Q3: 41–50 22 61 16 2 82 18 228 1.5 0.098 0.9 2.4
Age Q4: 51–87 40 52 5 3 92 8 220 <0.001 3.7 <0.001 2.0 6.8
TABLE Q-17. COVID-19: I am confident in the COVID-19 vaccine scientific approval process
STRONGLY AGREE
(%)
AGREE (%)
DIS-AGREE
(%)
STRONGLY DISAGREE
(%)
AGREE OR STRONGLY
AGREE (%)
DISAGREE OR STRONGLY DISAGREE
(%)
N CHI-SQUARE P-VALUE
LOGISTIC REGRESSION
ADJUSTED ODDS RATIO
P-VALUE LOWER BOUND
UPPER BOUND
All 39 38 16 7 77 23 848
HCW: Physicians 49 37 11 4 85 15 415 1.0
HCW: Nurses 26 40 22 12 66 34 187 <0.001 0.3 <0.001 0.2 0.5
HCW: Public Health Pros 39 38 18 6 77 23 90 0.5 0.014 0.3 0.9
HCW: Allied Pros 33 29 27 12 62 38 104 0.3 <0.001 0.2 0.5
HCW: Other 17 58 15 10 75 25 52 <0.001 0.5 0.089 0.3 1.1
Physician (General and family) 46 35 14 5 81 19 237
Physician (Surgical) 46 37 15 2 83 17 46
Physician (Medical) 57 38 3 3 95 5 114
Physician (Emergency) 44 44 6 6 89 11 18 0.007
Nurse (Community and public health) 23 50 22 5 73 27 60
Nurse (Critical care) 17 34 28 21 52 48 29
Nurse (Outpatients) 30 48 17 4 78 22 23
Nurse (Ward) 29 32 23 17 61 39 66 0.092
Care category: Care 44 36 13 7 80 20 541
Care category: Public health 33 37 22 8 70 30 255
Care category: Other 17 58 15 10 75 25 52 0.006
Sex: Male 45 36 12 7 81 19 239 1.0
Sex: Female 37 38 18 7 75 25 602 0.053 0.9 0.731 0.6 1.4
Age Q1: 21–32 33 31 23 13 64 36 208 1.0
Age Q2: 33–40 37 39 17 7 76 24 204 1.9 0.007 1.2 2.9
Age Q3: 41–50 37 44 14 4 82 18 207 2.8 <0.001 1.7 4.5
Age Q4: 51–87 49 36 11 4 85 15 215 <0.001 3.5 <0.001 2.1 5.6
TABLE Q-19. COVID-19 vaccine: I intend to get it as soon as possible
STRONGLY AGREE
(%)
AGREE (%)
DIS-AGREE
(%)
STRONGLY DISAGREE
(%)
AGREE OR STRONGLY
AGREE (%)
DISAGREE OR STRONGLY DISAGREE
(%)
N CHI-SQUARE P-VALUE
LOGISTIC REGRESSION
ADJUSTED ODDS RATIO
P-VALUE LOWER BOUND
UPPER BOUND
All 13 34 39 14 47 53 1 008
HCW: Physicians 9 27 45 19 36 64 452 1.0
HCW: Nurses 18 42 29 11 60 40 259 <0.001 3.1 <0.001 2.2 4.3
HCW: Public Health Pros 10 29 47 14 39 61 98 1.3 0.241 0.8 2.1
HCW: Allied Pros 20 39 32 9 59 41 137 2.7 <0.001 1.8 4.1
HCW: Other 18 40 37 5 58 42 62 <0.001 2.6 <0.001 1.5 4.5
Physician (General and family) 10 32 44 13 42 58 252
Physician (Surgical) 15 21 50 15 35 65 48
Physician (Medical) 5 21 46 29 25 75 131
Physician (Emergency) 14 19 38 29 33 67 21 0.013
Nurse (Community and public health) 6 39 44 10 46 54 79
Nurse (Critical care) 29 53 5 13 82 18 38
Nurse (Outpatients) 14 43 36 7 57 43 28
Nurse (Ward) 22 44 22 13 65 35 101 0.001
Care category: Care 13 32 39 17 45 55 629
Care category: Public health 14 36 39 11 50 50 317
Care category: Other 18 40 37 5 58 42 62 0.06
Sex: Male 13 28 42 18 41 59 249 1.0
Sex: Female 14 36 38 13 49 51 754 0.018 1.0 0.805 0.8 1.4
Age Q1: 21–32 19 42 30 9 61 39 251 1.0
Age Q2: 33–40 12 37 40 11 49 51 243 0.6 0.011 0.4 0.9
Age Q3: 41–50 13 29 42 16 42 58 249 0.4 <0.001 0.3 0.6
Age Q4: 51–87 10 25 44 21 35 65 251 <0.001 0.3 <0.001 0.2 0.5
TABLE Q-20. COVID-19 vaccine: I intend to wait to see how it affects others before I get it
STRONGLY AGREE
(%)
AGREE (%)
DIS-AGREE
(%)
STRONGLY DISAGREE
(%)
AGREE OR STRONGLY
AGREE (%)
DISAGREE OR STRONGLY DISAGREE
(%)
N CHI-SQUARE P-VALUE
LOGISTIC REGRESSION
ADJUSTED ODDS RATIO
P-VALUE LOWER BOUND
UPPER BOUND
47ANNEXES

All 8 31 35 27 39 61 996
HCW: Physicians 7 22 36 35 29 71 456 1.0
HCW: Nurses 9 43 30 19 52 48 254 <0.001 2.7 <0.001 1.9 3.8
HCW: Public Health Pros 7 23 46 24 30 70 96 1.1 0.598 0.7 1.9
HCW: Allied Pros 14 37 31 18 51 49 131 2.6 <0.001 1.7 3.9
HCW: Other 7 41 36 17 47 53 59 <0.001 2.2 0.005 1.3 3.9
Physician (General and family) 7 25 36 32 32 68 252
Physician (Surgical) 6 25 39 29 31 69 51
Physician (Medical) 7 15 35 43 22 78 130
Physician (Emergency) 4 17 35 43 22 78 23 0.189
Nurse (Community and public health) 4 38 34 25 41 59 80
Nurse (Critical care) 24 43 14 19 68 32 37
Nurse (Outpatients) 0 43 43 13 43 57 30
Nurse (Ward) 13 44 29 14 57 43 95 0.028
Care category: Care 8 28 34 30 36 64 627
Care category: Public health 9 34 36 22 43 57 310
Care category: Other 7 41 36 17 47 53 59 0.064
Sex: Male 9 23 37 31 32 68 244 1.0
Sex: Female 8 33 34 25 41 59 747 0.007 1.2 0.273 0.9 1.7
Age Q1: 21–32 9 38 31 22 47 53 255 1.0
Age Q2: 33–40 9 29 39 23 37 63 241 0.7 0.052 0.5 1.0
Age Q3: 41–50 9 31 35 25 40 60 251 0.7 0.072 0.5 1.0
Age Q4: 51–87 6 24 32 37 31 69 236 0.002 0.5 <0.001 0.3 0.7
TABLE Q-21. COVID-19 vaccine: I do not intend to get it soon, but might in the future
STRONGLY AGREE
(%)
AGREE (%)
DIS-AGREE
(%)
STRONGLY DISAGREE
(%)
AGREE OR STRONGLY
AGREE (%)
DISAGREE OR STRONGLY DISAGREE
(%)
N CHI-SQUARE P-VALUE
LOGISTIC REGRESSION
ADJUSTED ODDS RATIO
P-VALUE LOWER BOUND
UPPER BOUND
All 2 2 37 59 4 96 965
HCW: Physicians 2 3 28 68 4 96 463 1.0
HCW: Nurses 3 2 51 45 4 96 228 0.968 2.0 0.133 0.8 4.8
HCW: Public Health Pros 1 2 32 65 3 97 96 0.9 0.856 0.3 3.2
HCW: Allied Pros 2 2 43 54 3 97 126 0.4 0.285 0.1 2.0
HCW: Other 2 0 52 46 2 98 52 0.875 0.6 0.592 0.1 4.4
Physician (General and family) 1 5 33 61 6 94 257
Physician (Surgical) 4 0 23 72 4 96 47
Physician (Medical) 1 1 21 77 2 98 136
Physician (Emergency) 0 0 22 78 0 100 23 0.268
Nurse (Community and public health) 1 0 43 56 1 99 75
Nurse (Critical care) 10 0 53 37 10 90 30
Nurse (Outpatients) 0 7 44 48 7 93 27
Nurse (Ward) 2 2 60 35 5 95 85 0.231
Care category: Care 2 3 34 61 5 95 613
Care category: Public health 1 1 40 58 3 97 300
Care category: Other 2 0 52 46 2 98 52 0.239
Sex: Male 3 5 28 65 8 92 236 1.0
Sex: Female 2 1 40 57 3 97 725 <0.001 0.2 <0.001 0.1 0.5
Age Q1: 21–32 2 3 36 60 4 96 238 1.0
Age Q2: 33–40 1 2 41 56 3 97 236 0.7 0.536 0.3 2.0
Age Q3: 41–50 1 2 44 52 4 96 247 0.7 0.426 0.3 1.8
Age Q4: 51–87 2 2 27 69 4 96 232 0.908 0.8 0.561 0.3 1.9
TABLE Q-22. COVID-19 vaccine: I do not intend to ever get the vaccine
STRONGLY AGREE
(%)
AGREE (%)
DIS-AGREE
(%)
STRONGLY DISAGREE
(%)
AGREE OR STRONGLY
AGREE (%)
DISAGREE OR STRONGLY DISAGREE
(%)
N CHI-SQUARE P-VALUE
LOGISTIC REGRESSION
ADJUSTED ODDS RATIO
P-VALUE LOWER BOUND
UPPER BOUND
48 HEALTHCARE WORKERS AND COVID-19 VACCINATION IN THE CARIBBEAN

All 21 64 11 3 85 15 682
HCW: Physicians 17 65 15 3 82 18 298 1.0
HCW: Nurses 24 64 9 3 88 12 178 0.116 1.8 0.044 1.0 3.2
HCW: Public Health Pros 28 58 10 4 86 14 69 1.3 0.441 0.6 2.8
HCW: Allied Pros 27 63 9 1 90 10 90 2.0 0.069 0.9 4.3
HCW: Other 15 72 6 6 87 13 47 0.311 1.5 0.411 0.6 3.7
Physician (General and family) 20 64 14 2 84 16 174
Physician (Surgical) 18 68 15 0 85 15 34
Physician (Medical) 13 71 12 4 84 16 76
Physician (Emergency) 7 36 43 14 43 57 14 0.001
Nurse (Community and public health) 24 65 8 4 88 12 51
Nurse (Critical care) 25 64 11 0 89 11 28
Nurse (Outpatients) 25 61 14 0 86 14 28
Nurse (Ward) 21 65 8 6 86 14 63 0.954
Care category: Care 19 64 13 3 84 16 424
Care category: Public health 26 62 9 3 88 12 211
Care category: Other 15 72 6 6 87 13 47 0.309
Sex: Male 26 61 11 2 87 13 179 1.0
Sex: Female 19 66 12 4 85 15 499 0.439 0.7 0.157 0.4 1.2
Age Q1: 21–32 23 62 13 2 85 15 179 1.0
Age Q2: 33–40 21 67 9 3 88 12 154 1.3 0.465 0.7 2.4
Age Q3: 41–50 19 65 13 4 84 16 170 0.8 0.59 0.5 1.5
Age Q4: 51–87 20 64 11 4 85 15 168 0.759 0.9 0.778 0.5 1.7
TABLE Q-23. Reasons: I am confident there will be other effective treatments soon
STRONGLY AGREE
(%)
AGREE (%)
DIS-AGREE
(%)
STRONGLY DISAGREE
(%)
AGREE OR STRONGLY
AGREE (%)
DISAGREE OR STRONGLY DISAGREE
(%)
N CHI-SQUARE P-VALUE
LOGISTIC REGRESSION
ADJUSTED ODDS RATIO
P-VALUE LOWER BOUND
UPPER BOUND
All 9 22 47 23 30 70 1 039
HCW: Physicians 6 14 51 29 20 80 478 1.0
HCW: Nurses 13 32 40 15 45 55 263 <0.001 3.8 <0.001 2.7 5.5
HCW: Public Health Pros 8 13 54 25 22 78 97 1.3 0.394 0.7 2.2
HCW: Allied Pros 12 30 38 20 43 57 138 3.2 <0.001 2.1 4.9
HCW: Other 6 29 59 6 35 65 63 <0.001 2.2 0.008 1.2 4.0
Physician (General and family) 6 18 52 24 25 75 267
Physician (Surgical) 12 12 44 33 23 77 52
Physician (Medical) 3 6 52 39 9 91 136
Physician (Emergency) 0 17 52 30 17 83 23 0.002
Nurse (Community and public health) 4 31 45 20 35 65 83
Nurse (Critical care) 24 37 29 11 61 39 38
Nurse (Outpatients) 6 15 67 12 21 79 33
Nurse (Ward) 17 39 31 14 55 45 96 <0.001
Care category: Care 9 19 47 25 28 72 657
Care category: Public health 9 25 45 21 34 66 319
Care category: Other 6 29 59 6 35 65 63 0.092
Sex: Male 8 20 45 28 28 72 250 1.0
Sex: Female 9 22 48 21 31 69 782 0.315 0.8 0.187 0.6 1.1
Age Q1: 21–32 10 28 45 16 39 61 267 1.0
Age Q2: 33–40 9 20 51 19 29 71 248 0.7 0.057 0.5 1.0
Age Q3: 41–50 10 20 49 22 30 70 261 0.6 0.007 0.4 0.9
Age Q4: 51–87 4 18 45 33 22 78 246 <0.001 0.4 <0.001 0.3 0.6
TABLE Q-24. Reasons: I do not yet know enough about the vaccine to make a decision
STRONGLY AGREE
(%)
AGREE (%)
DIS-AGREE
(%)
STRONGLY DISAGREE
(%)
AGREE OR STRONGLY
AGREE (%)
DISAGREE OR STRONGLY DISAGREE
(%)
N CHI-SQUARE P-VALUE
LOGISTIC REGRESSION
ADJUSTED ODDS RATIO
P-VALUE LOWER BOUND
UPPER BOUND
49ANNEXES
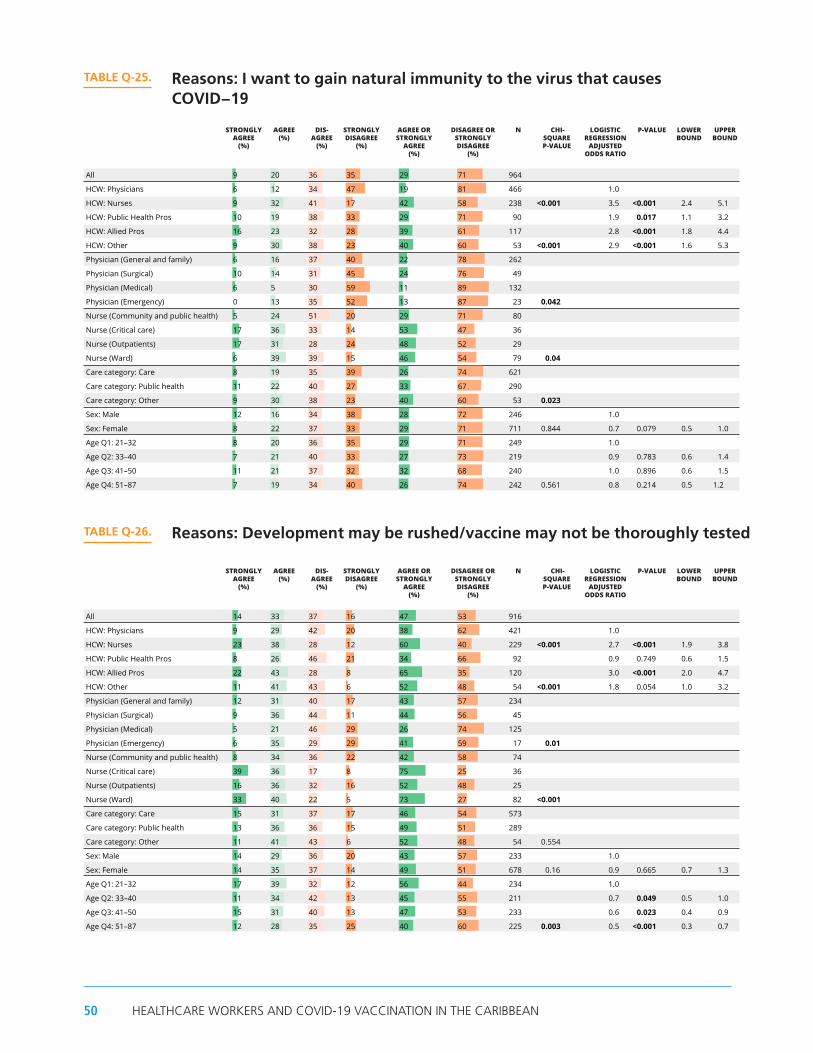
All 9 20 36 35 29 71 964
HCW: Physicians 6 12 34 47 19 81 466 1.0
HCW: Nurses 9 32 41 17 42 58 238 <0.001 3.5 <0.001 2.4 5.1
HCW: Public Health Pros 10 19 38 33 29 71 90 1.9 0.017 1.1 3.2
HCW: Allied Pros 16 23 32 28 39 61 117 2.8 <0.001 1.8 4.4
HCW: Other 9 30 38 23 40 60 53 <0.001 2.9 <0.001 1.6 5.3
Physician (General and family) 6 16 37 40 22 78 262
Physician (Surgical) 10 14 31 45 24 76 49
Physician (Medical) 6 5 30 59 11 89 132
Physician (Emergency) 0 13 35 52 13 87 23 0.042
Nurse (Community and public health) 5 24 51 20 29 71 80
Nurse (Critical care) 17 36 33 14 53 47 36
Nurse (Outpatients) 17 31 28 24 48 52 29
Nurse (Ward) 6 39 39 15 46 54 79 0.04
Care category: Care 8 19 35 39 26 74 621
Care category: Public health 11 22 40 27 33 67 290
Care category: Other 9 30 38 23 40 60 53 0.023
Sex: Male 12 16 34 38 28 72 246 1.0
Sex: Female 8 22 37 33 29 71 711 0.844 0.7 0.079 0.5 1.0
Age Q1: 21–32 8 20 36 35 29 71 249 1.0
Age Q2: 33–40 7 21 40 33 27 73 219 0.9 0.783 0.6 1.4
Age Q3: 41–50 11 21 37 32 32 68 240 1.0 0.896 0.6 1.5
Age Q4: 51–87 7 19 34 40 26 74 242 0.561 0.8 0.214 0.5 1.2
TABLE Q-25. Reasons: I want to gain natural immunity to the virus that causes COVID−19
STRONGLY AGREE
(%)
AGREE (%)
DIS-AGREE
(%)
STRONGLY DISAGREE
(%)
AGREE OR STRONGLY
AGREE (%)
DISAGREE OR STRONGLY DISAGREE
(%)
N CHI-SQUARE P-VALUE
LOGISTIC REGRESSION
ADJUSTED ODDS RATIO
P-VALUE LOWER BOUND
UPPER BOUND
All 14 33 37 16 47 53 916
HCW: Physicians 9 29 42 20 38 62 421 1.0
HCW: Nurses 23 38 28 12 60 40 229 <0.001 2.7 <0.001 1.9 3.8
HCW: Public Health Pros 8 26 46 21 34 66 92 0.9 0.749 0.6 1.5
HCW: Allied Pros 22 43 28 8 65 35 120 3.0 <0.001 2.0 4.7
HCW: Other 11 41 43 6 52 48 54 <0.001 1.8 0.054 1.0 3.2
Physician (General and family) 12 31 40 17 43 57 234
Physician (Surgical) 9 36 44 11 44 56 45
Physician (Medical) 5 21 46 29 26 74 125
Physician (Emergency) 6 35 29 29 41 59 17 0.01
Nurse (Community and public health) 8 34 36 22 42 58 74
Nurse (Critical care) 39 36 17 8 75 25 36
Nurse (Outpatients) 16 36 32 16 52 48 25
Nurse (Ward) 33 40 22 5 73 27 82 <0.001
Care category: Care 15 31 37 17 46 54 573
Care category: Public health 13 36 36 15 49 51 289
Care category: Other 11 41 43 6 52 48 54 0.554
Sex: Male 14 29 36 20 43 57 233 1.0
Sex: Female 14 35 37 14 49 51 678 0.16 0.9 0.665 0.7 1.3
Age Q1: 21–32 17 39 32 12 56 44 234 1.0
Age Q2: 33–40 11 34 42 13 45 55 211 0.7 0.049 0.5 1.0
Age Q3: 41–50 15 31 40 13 47 53 233 0.6 0.023 0.4 0.9
Age Q4: 51–87 12 28 35 25 40 60 225 0.003 0.5 <0.001 0.3 0.7
TABLE Q-26. Reasons: Development may be rushed/vaccine may not be thoroughly tested
STRONGLY AGREE
(%)
AGREE (%)
DIS-AGREE
(%)
STRONGLY DISAGREE
(%)
AGREE OR STRONGLY
AGREE (%)
DISAGREE OR STRONGLY DISAGREE
(%)
N CHI-SQUARE P-VALUE
LOGISTIC REGRESSION
ADJUSTED ODDS RATIO
P-VALUE LOWER BOUND
UPPER BOUND
50 HEALTHCARE WORKERS AND COVID-19 VACCINATION IN THE CARIBBEAN

All 5 15 42 37 21 79 955
HCW: Physicians 4 11 40 44 15 85 469 1.0
HCW: Nurses 8 25 43 25 33 67 236 <0.001 3.0 <0.001 2.0 4.5
HCW: Public Health Pros 2 12 39 47 14 86 90 1.0 0.921 0.5 1.8
HCW: Allied Pros 7 17 44 32 24 76 112 1.7 0.041 1.0 2.9
HCW: Other 4 17 52 27 21 79 48 <0.001 1.4 0.38 0.7 3.1
Physician (General and family) 5 10 43 41 16 84 264
Physician (Surgical) 8 16 37 39 24 76 49
Physician (Medical) 2 11 35 51 14 86 133
Physician (Emergency) 0 4 43 52 4 96 23 0.131
Nurse (Community and public health) 6 16 44 34 22 78 82
Nurse (Critical care) 18 25 39 18 43 57 28
Nurse (Outpatients) 0 25 46 29 25 75 28
Nurse (Ward) 10 32 43 15 43 57 87 0.017
Care category: Care 6 15 41 38 21 79 621
Care category: Public health 5 15 43 37 20 80 286
Care category: Other 4 17 52 27 21 79 48 0.961
Sex: Male 6 15 37 42 21 79 242 1.0
Sex: Female 5 15 43 36 21 79 707 0.926 0.7 0.077 0.5 1.0
Age Q1: 21–32 7 13 43 36 21 79 245 1.0
Age Q2: 33–40 4 15 46 36 18 82 228 0.9 0.804 0.6 1.5
Age Q3: 41–50 5 16 42 37 21 79 226 1.0 0.95 0.6 1.6
Age Q4: 51–87 6 16 36 42 22 78 242 0.82 1.0 0.904 0.7 1.6
TABLE Q-27. Reasons: I believe vaccines may give you the disease
STRONGLY AGREE
(%)
AGREE (%)
DIS-AGREE
(%)
STRONGLY DISAGREE
(%)
AGREE OR STRONGLY
AGREE (%)
DISAGREE OR STRONGLY DISAGREE
(%)
N CHI-SQUARE P-VALUE
LOGISTIC REGRESSION
ADJUSTED ODDS RATIO
P-VALUE LOWER BOUND
UPPER BOUND
All 15 47 31 7 62 38 972
HCW: Physicians 11 43 38 8 54 46 446 1.0
HCW: Nurses 22 48 24 6 70 30 246 <0.001 2.1 <0.001 1.5 3.0
HCW: Public Health Pros 11 45 32 13 55 45 92 1.1 0.673 0.7 1.8
HCW: Allied Pros 20 53 21 6 73 27 131 2.2 <0.001 1.4 3.5
HCW: Other 9 56 33 2 65 35 57 <0.001 1.5 0.159 0.8 2.8
Physician (General and family) 11 46 37 6 57 43 254
Physician (Surgical) 14 40 40 7 53 47 43
Physician (Medical) 10 40 39 12 49 51 126
Physician (Emergency) 17 39 35 9 57 43 23 0.539
Nurse (Community and public health) 14 43 33 10 57 43 81
Nurse (Critical care) 34 40 20 6 74 26 35
Nurse (Outpatients) 10 68 16 6 77 23 31
Nurse (Ward) 30 46 20 4 76 24 84 0.027
Care category: Care 15 45 33 7 60 40 608
Care category: Public health 16 48 28 9 63 37 307
Care category: Other 9 56 33 2 65 35 57 0.611
Sex: Male 12 45 34 9 57 43 236 1.0
Sex: Female 16 47 30 7 63 37 731 0.116 1.1 0.753 0.8 1.5
Age Q1: 21–32 18 51 26 5 69 31 250 1.0
Age Q2: 33–40 13 52 30 5 65 35 225 0.9 0.416 0.6 1.3
Age Q3: 41–50 11 46 37 6 57 43 241 0.6 0.005 0.4 0.8
Age Q4: 51–87 15 39 33 13 54 46 239 0.002 0.5 <0.001 0.3 0.7
TABLE Q-29. Opinion shapers: The pace at which the vaccine was researched and developed
STRONGLY AGREE
(%)
AGREE (%)
DIS-AGREE
(%)
STRONGLY DISAGREE
(%)
AGREE OR STRONGLY
AGREE (%)
DISAGREE OR STRONGLY DISAGREE
(%)
N CHI-SQUARE P-VALUE
LOGISTIC REGRESSION
ADJUSTED ODDS RATIO
P-VALUE LOWER BOUND
UPPER BOUND
51ANNEXES

All 23 62 11 4 85 15 932
HCW: Physicians 23 65 10 3 87 13 447 1.0
HCW: Nurses 25 58 14 3 83 17 224 0.104 0.7 0.102 0.4 1.1
HCW: Public Health Pros 18 59 16 7 77 23 88 0.5 0.026 0.3 0.9
HCW: Allied Pros 26 64 6 4 90 10 123 1.4 0.35 0.7 2.8
HCW: Other 10 66 20 4 76 24 50 0.013 0.6 0.181 0.3 1.3
Physician (General and family) 21 65 11 3 86 14 248
Physician (Surgical) 22 69 7 2 91 9 45
Physician (Medical) 24 65 8 2 89 11 133
Physician (Emergency) 33 48 5 14 81 19 21 0.502
Nurse (Community and public health) 21 53 24 3 74 26 68
Nurse (Critical care) 35 45 13 6 81 19 31
Nurse (Outpatients) 10 69 21 0 79 21 29
Nurse (Ward) 29 62 6 4 90 10 84 0.055
Care category: Care 24 63 10 3 87 13 602
Care category: Public health 23 60 13 5 82 18 280
Care category: Other 10 66 20 4 76 24 50 0.031
Sex: Male 19 62 14 5 81 19 227 1.0
Sex: Female 24 63 11 3 86 14 700 0.055 1.5 0.065 1.0 2.3
Age Q1: 21–32 24 66 9 1 90 10 232 1.0
Age Q2: 33–40 20 68 10 2 89 11 220 0.9 0.738 0.5 1.6
Age Q3: 41–50 23 61 13 3 84 16 231 0.7 0.198 0.4 1.2
Age Q4: 51–87 22 56 14 8 78 22 233 0.002 0.5 0.004 0.3 0.8
TABLE Q-30. Opinion shapers: The unfolding & frequently evolving science of SARS−CoV−2
STRONGLY AGREE
(%)
AGREE (%)
DIS-AGREE
(%)
STRONGLY DISAGREE
(%)
AGREE OR STRONGLY
AGREE (%)
DISAGREE OR STRONGLY DISAGREE
(%)
N CHI-SQUARE P-VALUE
LOGISTIC REGRESSION
ADJUSTED ODDS RATIO
P-VALUE LOWER BOUND
UPPER BOUND
All 5 24 49 23 29 71 958
HCW: Physicians 5 20 47 28 25 75 448 1.0
HCW: Nurses 5 29 51 15 34 66 240 0.016 1.7 0.004 1.2 2.4
HCW: Public Health Pros 2 26 47 25 28 72 92 1.2 0.461 0.7 2.0
HCW: Allied Pros 7 26 48 20 33 67 123 1.4 0.102 0.9 2.2
HCW: Other 2 25 56 16 27 73 55 0.152 1.1 0.767 0.6 2.1
Physician (General and family) 7 21 44 27 29 71 242
Physician (Surgical) 2 18 54 26 20 80 50
Physician (Medical) 3 20 48 29 23 77 132
Physician (Emergency) 4 8 54 33 13 88 24 0.194
Nurse (Community and public health) 0 21 63 16 21 79 80
Nurse (Critical care) 14 33 44 8 47 53 36
Nurse (Outpatients) 6 26 48 19 32 68 31
Nurse (Ward) 6 36 44 14 42 58 81 0.012
Care category: Care 6 23 47 24 29 71 606
Care category: Public health 3 25 51 20 29 71 297
Care category: Other 2 25 56 16 27 73 55 0.946
Sex: Male 8 24 41 27 31 69 220 1.0
Sex: Female 4 24 51 21 28 72 732 0.355 0.7 0.074 0.5 1.0
Age Q1: 21–32 5 28 47 20 33 67 243 1.0
Age Q2: 33–40 5 24 52 18 30 70 229 0.9 0.497 0.6 1.3
Age Q3: 41–50 5 27 44 24 31 69 236 0.9 0.49 0.6 1.3
Age Q4: 51–87 5 17 51 27 22 78 235 0.048 0.5 0.004 0.4 0.8
TABLE Q-31. Opinion shapers: Actions and opinions of friends and family
STRONGLY AGREE
(%)
AGREE (%)
DIS-AGREE
(%)
STRONGLY DISAGREE
(%)
AGREE OR STRONGLY
AGREE (%)
DISAGREE OR STRONGLY DISAGREE
(%)
N CHI-SQUARE P-VALUE
LOGISTIC REGRESSION
ADJUSTED ODDS RATIO
P-VALUE LOWER BOUND
UPPER BOUND
52 HEALTHCARE WORKERS AND COVID-19 VACCINATION IN THE CARIBBEAN

All 23 62 11 4 85 15 932
HCW: Physicians 23 65 10 3 87 13 447 1.0
HCW: Nurses 25 58 14 3 83 17 224 0.104 0.7 0.102 0.4 1.1
HCW: Public Health Pros 18 59 16 7 77 23 88 0.5 0.026 0.3 0.9
HCW: Allied Pros 26 64 6 4 90 10 123 1.4 0.35 0.7 2.8
HCW: Other 10 66 20 4 76 24 50 0.013 0.6 0.181 0.3 1.3
Physician (General and family) 21 65 11 3 86 14 248
Physician (Surgical) 22 69 7 2 91 9 45
Physician (Medical) 24 65 8 2 89 11 133
Physician (Emergency) 33 48 5 14 81 19 21 0.502
Nurse (Community and public health) 21 53 24 3 74 26 68
Nurse (Critical care) 35 45 13 6 81 19 31
Nurse (Outpatients) 10 69 21 0 79 21 29
Nurse (Ward) 29 62 6 4 90 10 84 0.055
Care category: Care 24 63 10 3 87 13 602
Care category: Public health 23 60 13 5 82 18 280
Care category: Other 10 66 20 4 76 24 50 0.031
Sex: Male 19 62 14 5 81 19 227 1.0
Sex: Female 24 63 11 3 86 14 700 0.055 1.5 0.065 1.0 2.3
Age Q1: 21–32 24 66 9 1 90 10 232 1.0
Age Q2: 33–40 20 68 10 2 89 11 220 0.9 0.738 0.5 1.6
Age Q3: 41–50 23 61 13 3 84 16 231 0.7 0.198 0.4 1.2
Age Q4: 51–87 22 56 14 8 78 22 233 0.002 0.5 0.004 0.3 0.8
TABLE Q-30. Opinion shapers: The unfolding & frequently evolving science of SARS−CoV−2
STRONGLY AGREE
(%)
AGREE (%)
DIS-AGREE
(%)
STRONGLY DISAGREE
(%)
AGREE OR STRONGLY
AGREE (%)
DISAGREE OR STRONGLY DISAGREE
(%)
N CHI-SQUARE P-VALUE
LOGISTIC REGRESSION
ADJUSTED ODDS RATIO
P-VALUE LOWER BOUND
UPPER BOUND
All 5 24 49 23 29 71 958
HCW: Physicians 5 20 47 28 25 75 448 1.0
HCW: Nurses 5 29 51 15 34 66 240 0.016 1.7 0.004 1.2 2.4
HCW: Public Health Pros 2 26 47 25 28 72 92 1.2 0.461 0.7 2.0
HCW: Allied Pros 7 26 48 20 33 67 123 1.4 0.102 0.9 2.2
HCW: Other 2 25 56 16 27 73 55 0.152 1.1 0.767 0.6 2.1
Physician (General and family) 7 21 44 27 29 71 242
Physician (Surgical) 2 18 54 26 20 80 50
Physician (Medical) 3 20 48 29 23 77 132
Physician (Emergency) 4 8 54 33 13 88 24 0.194
Nurse (Community and public health) 0 21 63 16 21 79 80
Nurse (Critical care) 14 33 44 8 47 53 36
Nurse (Outpatients) 6 26 48 19 32 68 31
Nurse (Ward) 6 36 44 14 42 58 81 0.012
Care category: Care 6 23 47 24 29 71 606
Care category: Public health 3 25 51 20 29 71 297
Care category: Other 2 25 56 16 27 73 55 0.946
Sex: Male 8 24 41 27 31 69 220 1.0
Sex: Female 4 24 51 21 28 72 732 0.355 0.7 0.074 0.5 1.0
Age Q1: 21–32 5 28 47 20 33 67 243 1.0
Age Q2: 33–40 5 24 52 18 30 70 229 0.9 0.497 0.6 1.3
Age Q3: 41–50 5 27 44 24 31 69 236 0.9 0.49 0.6 1.3
Age Q4: 51–87 5 17 51 27 22 78 235 0.048 0.5 0.004 0.4 0.8
TABLE Q-31. Opinion shapers: Actions and opinions of friends and family
STRONGLY AGREE
(%)
AGREE (%)
DIS-AGREE
(%)
STRONGLY DISAGREE
(%)
AGREE OR STRONGLY
AGREE (%)
DISAGREE OR STRONGLY DISAGREE
(%)
N CHI-SQUARE P-VALUE
LOGISTIC REGRESSION
ADJUSTED ODDS RATIO
P-VALUE LOWER BOUND
UPPER BOUND
All 12 63 19 6 75 25 723
HCW: Physicians 12 63 19 5 76 24 334 1.0
HCW: Nurses 9 65 20 5 74 26 188 0.745 0.9 0.636 0.6 1.4
HCW: Public Health Pros 13 60 20 8 73 28 80 0.8 0.455 0.5 1.4
HCW: Allied Pros 17 65 12 6 82 18 84 1.7 0.127 0.9 3.2
HCW: Other 5 57 24 14 62 38 37 0.203 0.5 0.047 0.2 1.0
Physician (General and family) 12 62 21 5 74 26 188
Physician (Surgical) 15 67 15 3 82 18 33
Physician (Medical) 13 67 14 5 80 20 97
Physician (Emergency) 0 56 25 19 56 44 16 0.141
Nurse (Community and public health) 8 61 28 3 69 31 61
Nurse (Critical care) 3 73 20 3 77 23 30
Nurse (Outpatients) 16 56 24 4 72 28 25
Nurse (Ward) 11 69 12 8 80 20 65 0.528
Care category: Care 12 64 18 6 76 24 459
Care category: Public health 13 63 19 6 75 25 227
Care category: Other 5 57 24 14 62 38 37 0.171
Sex: Male 11 58 25 6 69 31 190 1.0
Sex: Female 12 65 17 6 77 23 530 0.021 1.5 0.051 1.0 2.2
Age Q1: 21–32 8 67 20 5 75 25 170 1.0
Age Q2: 33–40 13 66 14 6 80 20 172 1.3 0.307 0.8 2.2
Age Q3: 41–50 10 64 21 6 73 27 196 1.0 0.888 0.6 1.6
Age Q4: 51–87 16 57 20 7 73 27 174 0.457 1.0 0.886 0.6 1.6
TABLE Q-32. Opinion shapers: Relationship between coverage rates and community transmission
STRONGLY AGREE
(%)
AGREE (%)
DIS-AGREE
(%)
STRONGLY DISAGREE
(%)
AGREE OR STRONGLY
AGREE (%)
DISAGREE OR STRONGLY DISAGREE
(%)
N CHI-SQUARE P-VALUE
LOGISTIC REGRESSION
ADJUSTED ODDS RATIO
P-VALUE LOWER BOUND
UPPER BOUNDSTRONGLY
AGREE (%)
AGREE (%)
DIS-AGREE
(%)
STRONGLY DISAGREE
(%)
AGREE OR STRONGLY
AGREE (%)
DISAGREE OR STRONGLY DISAGREE
(%) N
CHI-SQUARE P-VALUE
LOGISTIC REGRESSION
ADJUSTED ODDS RATIO P-VALUE
LOWER BOUND
UPPER BOUND
All 27 61 9 3 88 12 960
HCW: Physicians 29 60 8 3 89 11 447 1.0
HCW: Nurses 26 63 9 2 89 11 235 0.825 0.9 0.653 0.5 1.5
HCW: Public Health Pros 25 61 10 4 86 14 97 0.7 0.24 0.4 1.3
HCW: Allied Pros 28 63 7 2 91 9 125 1.2 0.606 0.6 2.4
HCW: Other 20 55 21 4 75 25 56 0.017 0.3 0.001 0.2 0.7
Physician (General and family) 28 61 9 2 89 11 250
Physician (Surgical) 27 60 11 2 87 13 45
Physician (Medical) 34 59 5 2 93 7 129
Physician (Emergency) 22 61 9 9 83 17 23 0.337
Nurse (Community and public health) 22 70 8 0 92 8 76
Nurse (Critical care) 26 53 16 5 79 21 38
Nurse (Outpatients) 23 67 10 0 90 10 30
Nurse (Ward) 30 59 7 4 89 11 81 0.218
Care category: Care 29 60 8 3 89 11 604
Care category: Public health 26 64 8 2 90 10 300
Care category: Other 20 55 21 4 75 25 56 0.006
Sex: Male 29 57 10 4 86 14 231 1.0
Sex: Female 27 63 9 2 89 11 723 0.149 1.4 0.133 0.9 2.3
Age Q1: 21–32 26 61 10 3 87 13 248 1.0
Age Q2: 33–40 25 63 11 0 89 11 236 1.2 0.5 0.7 2.1
Age Q3: 41–50 22 65 9 4 87 13 238 1.1 0.678 0.7 1.9
Age Q4: 51–87 35 56 7 3 90 10 223 0.692 1.5 0.174 0.8 2.7
TABLE Q-33. Opinion shapers: My own research on COVID−19 vaccines
STRONGLY AGREE
(%)
AGREE (%)
DIS-AGREE
(%)
STRONGLY DISAGREE
(%)
AGREE OR STRONGLY
AGREE (%)
DISAGREE OR STRONGLY DISAGREE
(%)
N CHI-SQUARE P-VALUE
LOGISTIC REGRESSION
ADJUSTED ODDS RATIO
P-VALUE LOWER BOUND
UPPER BOUND
53ANNEXES

All 10 38 41 11 48 52 904
HCW: Physicians 11 35 41 13 46 54 428 1.0
HCW: Nurses 12 45 35 8 57 43 214 0.007 1.7 0.004 1.2 2.4
HCW: Public Health Pros 10 39 39 12 49 51 92 1.2 0.361 0.8 2.0
HCW: Allied Pros 7 38 44 11 45 55 111 1.1 0.754 0.7 1.6
HCW: Other 3 37 54 5 41 59 59 0.051 0.9 0.632 0.5 1.5
Physician (General and family) 12 36 41 11 48 52 236
Physician (Surgical) 11 43 41 5 55 45 44
Physician (Medical) 8 34 42 17 42 58 125
Physician (Emergency) 13 13 48 26 26 74 23 0.092
Nurse (Community and public health) 15 39 41 5 54 46 74
Nurse (Critical care) 10 45 38 7 55 45 29
Nurse (Outpatients) 4 43 39 13 48 52 23
Nurse (Ward) 13 51 29 7 64 36 75 0.459
Care category: Care 11 38 39 12 49 51 565
Care category: Public health 10 39 41 10 49 51 280
Care category: Other 3 37 54 5 41 59 59 0.476
Sex: Male 11 33 42 13 44 56 218 1.0
Sex: Female 9 40 41 10 49 51 679 0.2 1.0 0.825 0.8 1.4
Age Q1: 21–32 12 36 44 8 48 52 231 1.0
Age Q2: 33–40 9 42 40 9 51 49 221 1.2 0.421 0.8 1.7
Age Q3: 41–50 9 36 41 15 45 55 226 0.8 0.354 0.6 1.2
Age Q4: 51–87 10 39 39 12 49 51 209 0.578 1.0 0.873 0.7 1.5
TABLE Q-34. Opinion shapers: The country in which a vaccine is manufactured
STRONGLY AGREE
(%)
AGREE (%)
DIS-AGREE
(%)
STRONGLY DISAGREE
(%)
AGREE OR STRONGLY
AGREE (%)
DISAGREE OR STRONGLY DISAGREE
(%)
N CHI-SQUARE P-VALUE
LOGISTIC REGRESSION
ADJUSTED ODDS RATIO
P-VALUE LOWER BOUND
UPPER BOUND
All 6 26 52 16 32 68 854
HCW: Physicians 6 23 54 17 29 71 418 1.0
HCW: Nurses 7 31 48 14 39 61 192 0.022 1.7 0.007 1.2 2.5
HCW: Public Health Pros 5 32 48 16 36 64 88 1.5 0.118 0.9 2.4
HCW: Allied Pros 5 24 53 18 29 71 99 1.1 0.844 0.6 1.7
HCW: Other 4 25 61 11 28 72 57 0.146 1.0 0.987 0.5 1.9
Physician (General and family) 8 28 51 13 36 64 227
Physician (Surgical) 2 21 60 17 23 77 47
Physician (Medical) 4 18 55 22 22 78 121
Physician (Emergency) 9 0 70 22 9 91 23 0.004
Nurse (Community and public health) 10 27 51 12 37 63 67
Nurse (Critical care) 4 35 50 12 38 62 26
Nurse (Outpatients) 0 38 46 17 38 63 24
Nurse (Ward) 8 35 42 15 43 57 65 0.911
Care category: Care 6 26 52 16 32 68 541
Care category: Public health 6 27 51 16 34 66 256
Care category: Other 4 25 61 11 28 72 57 0.69
Sex: Male 8 23 52 17 31 69 212 1.0
Sex: Female 6 27 53 15 32 68 636 0.67 0.9 0.585 0.6 1.3
Age Q1: 21–32 6 27 53 14 33 67 227 1.0
Age Q2: 33–40 7 31 49 12 39 61 205 1.3 0.169 0.9 2.0
Age Q3: 41–50 5 27 50 18 32 68 211 0.9 0.544 0.6 1.3
Age Q4: 51–87 5 20 57 18 25 75 197 0.033 0.6 0.048 0.4 1.0
TABLE Q-35. Opinion shapers: The potential cost of a COVID−19 vaccine
STRONGLY AGREE
(%)
AGREE (%)
DIS-AGREE
(%)
STRONGLY DISAGREE
(%)
AGREE OR STRONGLY
AGREE (%)
DISAGREE OR STRONGLY DISAGREE
(%)
N CHI-SQUARE P-VALUE
LOGISTIC REGRESSION
ADJUSTED ODDS RATIO
P-VALUE LOWER BOUND
UPPER BOUND
54 HEALTHCARE WORKERS AND COVID-19 VACCINATION IN THE CARIBBEAN

All 10 38 41 11 48 52 904
HCW: Physicians 11 35 41 13 46 54 428 1.0
HCW: Nurses 12 45 35 8 57 43 214 0.007 1.7 0.004 1.2 2.4
HCW: Public Health Pros 10 39 39 12 49 51 92 1.2 0.361 0.8 2.0
HCW: Allied Pros 7 38 44 11 45 55 111 1.1 0.754 0.7 1.6
HCW: Other 3 37 54 5 41 59 59 0.051 0.9 0.632 0.5 1.5
Physician (General and family) 12 36 41 11 48 52 236
Physician (Surgical) 11 43 41 5 55 45 44
Physician (Medical) 8 34 42 17 42 58 125
Physician (Emergency) 13 13 48 26 26 74 23 0.092
Nurse (Community and public health) 15 39 41 5 54 46 74
Nurse (Critical care) 10 45 38 7 55 45 29
Nurse (Outpatients) 4 43 39 13 48 52 23
Nurse (Ward) 13 51 29 7 64 36 75 0.459
Care category: Care 11 38 39 12 49 51 565
Care category: Public health 10 39 41 10 49 51 280
Care category: Other 3 37 54 5 41 59 59 0.476
Sex: Male 11 33 42 13 44 56 218 1.0
Sex: Female 9 40 41 10 49 51 679 0.2 1.0 0.825 0.8 1.4
Age Q1: 21–32 12 36 44 8 48 52 231 1.0
Age Q2: 33–40 9 42 40 9 51 49 221 1.2 0.421 0.8 1.7
Age Q3: 41–50 9 36 41 15 45 55 226 0.8 0.354 0.6 1.2
Age Q4: 51–87 10 39 39 12 49 51 209 0.578 1.0 0.873 0.7 1.5
TABLE Q-34. Opinion shapers: The country in which a vaccine is manufactured
STRONGLY AGREE
(%)
AGREE (%)
DIS-AGREE
(%)
STRONGLY DISAGREE
(%)
AGREE OR STRONGLY
AGREE (%)
DISAGREE OR STRONGLY DISAGREE
(%)
N CHI-SQUARE P-VALUE
LOGISTIC REGRESSION
ADJUSTED ODDS RATIO
P-VALUE LOWER BOUND
UPPER BOUND
All 4 26 41 28 30 70 950
HCW: Physicians 3 19 43 36 21 79 440 1.0
HCW: Nurses 8 35 41 16 43 57 248 <0.001 2.9 <0.001 2.0 4.2
HCW: Public Health Pros 1 27 32 40 28 72 90 1.6 0.098 0.9 2.6
HCW: Allied Pros 6 29 42 23 35 65 115 2.1 0.002 1.3 3.3
HCW: Other 2 37 47 14 39 61 57 <0.001 2.4 0.006 1.3 4.3
Physician (General and family) 3 21 43 33 24 76 239
Physician (Surgical) 0 24 43 33 24 76 49
Physician (Medical) 2 14 43 41 16 84 129
Physician (Emergency) 0 9 43 48 9 91 23 0.127
Nurse (Community and public health) 4 30 49 18 34 66 80
Nurse (Critical care) 11 40 34 14 51 49 35
Nurse (Outpatients) 3 35 42 19 39 61 31
Nurse (Ward) 13 38 38 13 50 50 88 0.122
Care category: Care 4 24 41 30 28 72 605
Care category: Public health 4 29 40 27 33 67 288
Care category: Other 2 37 47 14 39 61 57 0.12
Sex: Male 4 20 38 38 24 76 217 1.0
Sex: Female 4 28 42 26 32 68 727 0.023 1.1 0.565 0.8 1.6
Age Q1: 21–32 6 32 37 25 38 62 251 1.0
Age Q2: 33–40 4 25 48 23 29 71 216 0.7 0.09 0.5 1.1
Age Q3: 41–50 3 27 41 29 30 70 234 0.6 0.03 0.4 1.0
Age Q4: 51–87 3 20 41 36 23 77 233 0.006 0.5 <0.001 0.3 0.7
TABLE Q-36. Opinion shapers: Information I´ve seen on social media.
STRONGLY AGREE
(%)
AGREE (%)
DIS-AGREE
(%)
STRONGLY DISAGREE
(%)
AGREE OR STRONGLY
AGREE (%)
DISAGREE OR STRONGLY DISAGREE
(%)
N CHI-SQUARE P-VALUE
LOGISTIC REGRESSION
ADJUSTED ODDS RATIO
P-VALUE LOWER BOUND
UPPER BOUND
All 42 35 18 5 77 23 958
HCW: Physicians 51 33 14 3 84 16 458 1.0
HCW: Nurses 30 37 26 7 67 33 227 <0.001 0.4 <0.001 0.3 0.6
HCW: Public Health Pros 47 37 10 6 84 16 94 1.0 0.933 0.6 1.9
HCW: Allied Pros 34 35 22 9 69 31 122 0.5 0.001 0.3 0.7
HCW: Other 23 46 23 9 68 32 57 <0.001 0.5 0.035 0.3 1.0
Physician (General and family) 49 37 11 3 86 14 256
Physician (Surgical) 44 29 23 4 73 27 48
Physician (Medical) 56 28 14 2 84 16 132
Physician (Emergency) 55 23 23 0 77 23 22 0.128
Nurse (Community and public health) 41 28 27 4 69 31 74
Nurse (Critical care) 14 43 31 11 57 43 35
Nurse (Outpatients) 34 34 21 10 69 31 29
Nurse (Ward) 28 41 25 6 68 32 79 0.622
Care category: Care 45 35 16 4 79 21 608
Care category: Public health 40 34 19 7 74 26 293
Care category: Other 23 46 23 9 68 32 57 0.07
Sex: Male 46 36 16 3 82 18 245 1.0
Sex: Female 40 35 18 6 75 25 707 0.041 0.8 0.264 0.5 1.2
Age Q1: 21–32 37 42 17 4 79 21 241 1.0
Age Q2: 33–40 41 39 16 4 80 20 231 1.0 0.915 0.7 1.6
Age Q3: 41–50 39 38 18 5 77 23 232 0.9 0.597 0.6 1.4
Age Q4: 51–87 50 24 18 7 75 25 238 0.547 0.8 0.321 0.5 1.2
TABLE Q-38. Influenza: I would take the flu vaccine if offered
STRONGLY AGREE
(%)
AGREE (%)
DIS-AGREE
(%)
STRONGLY DISAGREE
(%)
AGREE OR STRONGLY
AGREE (%)
DISAGREE OR STRONGLY DISAGREE
(%)
N CHI-SQUARE P-VALUE
LOGISTIC REGRESSION
ADJUSTED ODDS RATIO
P-VALUE LOWER BOUND
UPPER BOUND
55ANNEXES

All 45 43 10 3 87 13 932
HCW: Physicians 51 40 7 2 92 8 453 1.0
HCW: Nurses 36 47 14 3 83 17 211 0.001 0.5 0.008 0.3 0.8
HCW: Public Health Pros 51 40 7 2 91 9 92 1.0 0.909 0.4 2.1
HCW: Allied Pros 36 40 19 5 76 24 120 0.3 <0.001 0.2 0.5
HCW: Other 29 54 11 7 82 18 56 <0.001 0.6 0.249 0.3 1.4
Physician (General and family) 52 41 5 2 93 7 254
Physician (Surgical) 38 44 17 2 81 19 48
Physician (Medical) 55 38 6 1 93 7 130
Physician (Emergency) 52 43 5 0 95 5 21 0.043
Nurse (Community and public health) 46 45 7 1 92 8 71
Nurse (Critical care) 28 55 17 0 83 17 29
Nurse (Outpatients) 41 44 7 7 85 15 27
Nurse (Ward) 29 47 21 3 76 24 76 0.097
Care category: Care 47 42 9 2 89 11 590
Care category: Public health 43 42 12 3 85 15 286
Care category: Other 29 54 11 7 82 18 56 0.139
Sex: Male 48 40 9 2 89 11 236 1.0
Sex: Female 43 44 10 3 87 13 690 0.522 0.9 0.81 0.6 1.6
Age Q1: 21–32 41 50 8 2 91 9 232 1.0
Age Q2: 33–40 41 47 9 3 88 12 233 0.7 0.271 0.4 1.3
Age Q3: 41–50 44 43 11 1 87 13 221 0.8 0.381 0.4 1.4
Age Q4: 51–87 54 32 11 3 86 14 230 0.513 0.6 0.136 0.4 1.2
TABLE Q-40. Influenza: I would recommend the flu vaccine to friends and family
STRONGLY AGREE
(%)
AGREE (%)
DIS-AGREE
(%)
STRONGLY DISAGREE
(%)
AGREE OR STRONGLY
AGREE (%)
DISAGREE OR STRONGLY DISAGREE
(%)
N CHI-SQUARE P-VALUE
LOGISTIC REGRESSION
ADJUSTED ODDS RATIO
P-VALUE LOWER BOUND
UPPER BOUND
56 HEALTHCARE WORKERS AND COVID-19 VACCINATION IN THE CARIBBEAN

Annex D. Survey Pilot Additional Information
SURVEY PILOT“Concerns, attitudes, and intended practices
of healthcare workers to COVID-19 vaccination
in the Caribbean”
PILOT OBJECTIVETo improve the quality of the survey “Concerns,
attitudes, and intended practices of healthcare workers
to COVID-19 vaccination in the Caribbean,” to ensure
questions and response options are understood as
intended, are well-adapted to a local context, and
measure what they are designed to measure.
METHODSCognitive interviewing (CI) was used to pilot the survey.
CI is a process for “improving the quality of a survey, to
ensure questions and response options are understood
as intended, are well-adapted to a local context, and
measure what they are designed to measure”(3).
Participants for CI were recruited from the target
population. The main investigators scheduled separate
interviews with a total of seven participants from two
countries, Barbados and Dominica, and followed the
steps detailed below for each survey item (each survey
question and its corresponding response options), one
item at a time.
The seven cognitive interviews with healthcare workers
were conducted via video conference. The interviewers
were Dr. E. Benjamin Puertas, M.D., M.P.H., Dr.P.H.,
Subregional Advisor Human Resources for Health,
Subregional Program for the Caribbean, PAHO/WHO;
Dr. Karen Broome-Toppin, M.D., Advisor Immunization,
Subregional Program for the Caribbean, PAHO/WHO;
Mrs. Fiona Harris-Glenville, R.N., Dr.P.H Candidate,
Intern Human Resources for Health, Subregional
Program for the Caribbean, PAHO/WHO; Dr. Nina Rise,
M.D., M.P.H Candidate, Intern Human Resources for
Health, Subregional Program for the Caribbean, PAHO/
WHO. The interviewers introduced the purpose of the
survey and survey pilot and explained the process of
the survey pilot interview to the interviewees. For each
question, interviewees identified the Likert scale answer
best representing their personal attitude (“Strongly
agree”; “Agree”; “Don’t know”; “Disagree”; “Strongly
disagree”). Nine questions had been preidentified by
the research team as containing words or terms that
could potentially be misinterpreted and/or interpreted
differently among interviewees (Table D.1).
57ANNEXES

TABLE D.1. Questions identified for probing
Question 8 Overall, vaccines are safe.
Question 9 Overall, vaccines are effective.
Question 11 The information I receive about vaccines from public health authorities/my healthcare provider is reliable and trustworthy.
Question 13 New vaccines carry more risk than older vaccines.
Question 15 I am concerned about serious adverse effects of vaccines.
Question 17 I am confident in the scientific approval process for a new coronavirus (COVID-19) vaccine.
Question 18 I would be willing to participate in a vaccine trial for a coronavirus (COVID-19) vaccine.
Question 25 I want to gain natural immunity to the virus that causes COVID-19.
Question 32 The relationship between coverage rates and community transmission.*
The words and terms highlighted in bold are the those
identified as having a potential for misinterpretation.
*Question 32 is to be understood in the context
that, “The relationship between coverage rates and
community transmission contributed to my opinion on
the COVID-19 vaccine.”
These questions were subjected to the following
cognitive interviewing steps:
1. Ask the respondent the question (including response
options) and allow them to answer.
2. Ask the respondent about the question they just
answered, using probes to understand if …
• The question is easy to understand and
it makes sense:
“In your own words, what is this question
asking?” or “what does this question mean to
you?” to check the item was well understood.
• The ideas or words in the question and response
options are easy to understand:
Ask generally, “Did this question make sense to
you? Why/why not?” or probe around specific
words or concepts that may be difficult to
understand. “What do you think of when you
hear the phrase ‘getting vaccines’?”
• The response options make sense and allow for
meaningful answers:
“Do the response options fit in with the sort of
answer you want to give?”
• There are any response options that are missing:
“Was there anything missing from the
list of response options?” to check the
options are adequate.
• The question and response options are relevant in
the country or region:
Ask generally, “Did the response options offered
make sense to you? Why/why not?” or probe
around specific words or concepts that could be
interpreted differently “What do you think of
when you hear the phrase ‘vaccination clinic’?”
Interviewees were encouraged to share their opinions
on any question in the questionnaire as well as the
questionnaire as a whole. Their opinions were recorded in
a “General comments” section of the survey pilot.
RESULTSOverall, interviewees reported that the questions
were “clear,” and the tool was “understandable,”
“straightforward,” and “thorough” (Table D.2).
58 HEALTHCARE WORKERS AND COVID-19 VACCINATION IN THE CARIBBEAN

TABLE D.2. Compilation of general comments
I.1 Not familiar with the abbreviation HCW (Question 5). Thought the questions were relevant, but the survey altogether lengthy. Recommends an “unsure” or “undecided” option on the Likert scale in addition to “don’t know.”
I.2 Interviewee requested further explanation about question #12. Thought the questions were clear and straight to the point.
I.3 As a healthcare worker, I am strongly for the vaccine. I have already been vaccinated myself. Good questionnaire. Questions were clear.
I.4 The survey is straightforward and understandable.
I.5 -
I.6 Offer definitions of certain terms: Coverage rates and Community transmission.
I.7 The questionnaire is pretty thorough and clear.
The majority of words or terms that were probed (safe;
effective; reliable, trustworthy; risk; adverse effects;
scientific approval; vaccine trial; natural immunity) were
well understood, with interviewees demonstrating a
clear and coherent comprehension of the meaning of
the words/terms. Two of seven interviewees were unsure
of the meaning of the terms “coverage rates” and
“community transmission” used in Question 32.
IMPLICATIONSAs a result of the uncertainty among some of the
interviewees regarding the meanings of “coverage
rates” and “community transmission,” the investigators
decided to modify Question 32 in the tool, providing
the respondents with a pop-up box containing the
World Health Organization (WHO) definitions of the
terms (Table D.3).
TABLE D.3. WHO definitions of “vaccination coverage rates” and “community transmission”
Vaccination coverage rates
The proportion of a target population that has been vaccinated with a certain dose of the vaccine in a certain time period.
Community transmission
Experiencing larger outbreaks of local transmission defined through an assessment of factors including, but not limited to: large numbers of cases not linkable to transmission chains; large numbers of cases from sentinel lab surveillance; and/or multiple unrelated clusters in several areas of the country/territory/area.
For the complete report, please write to Dr. E. Benjamin
Puertas, PAHO Advisor in Human Resources for Health in
the Caribbean: [email protected].
59ANNEXES

Annex E. Messaging for Caribbean Healthcare Workers Based on Survey ResultsConcerns, Attitudes, and Intended Practices of HCWs to COVID-19 Vaccination in the Caribbean
Messaging for Caribbean Healthcare Workers Based on Survey Results
Concern Objective Topline messages Supporting messages
The vaccine doesn’t
work, I’ll have
to continue with
protective measures
anyway.
- Reinforce efficacy
of vaccines in
preventing severe
illness and death.
- Remind public health
measures aren’t for
forever.
- All vaccines against COVID-19 that
have been listed by WHO are extremely
safe and effective at preventing death
and severe illness.
- WHO recommends that people who
are fully vaccinated should continue
to follow public health measures
like masking and physical distancing
until more people are protected
against COVID-19.
- Vaccination for everyone who is eligible
is key to ending the pandemic.
- All vaccines go through clinical trial
phases with tens of thousands of
people of different ages and ethnicities
before they are approved for use in the
population. These trials aim to ensure
the safety and ability of the vaccine to
protect against the disease.
- Only those vaccines that are safe
and have proven to be effective at
preventing the disease are approved to
be used in the population.
- Although data show us that vaccines
work well in preventing people
from getting sick, researchers are
still learning about how well the
vaccines stop the spread of COVID-19
between people. This is why WHO
still recommends public health
measures that have been used since
the start of the pandemic to stop the
spread of the virus.
- Real-world data are showing us
that the vaccines are extremely
effective and safe.
60 HEALTHCARE WORKERS AND COVID-19 VACCINATION IN THE CARIBBEAN
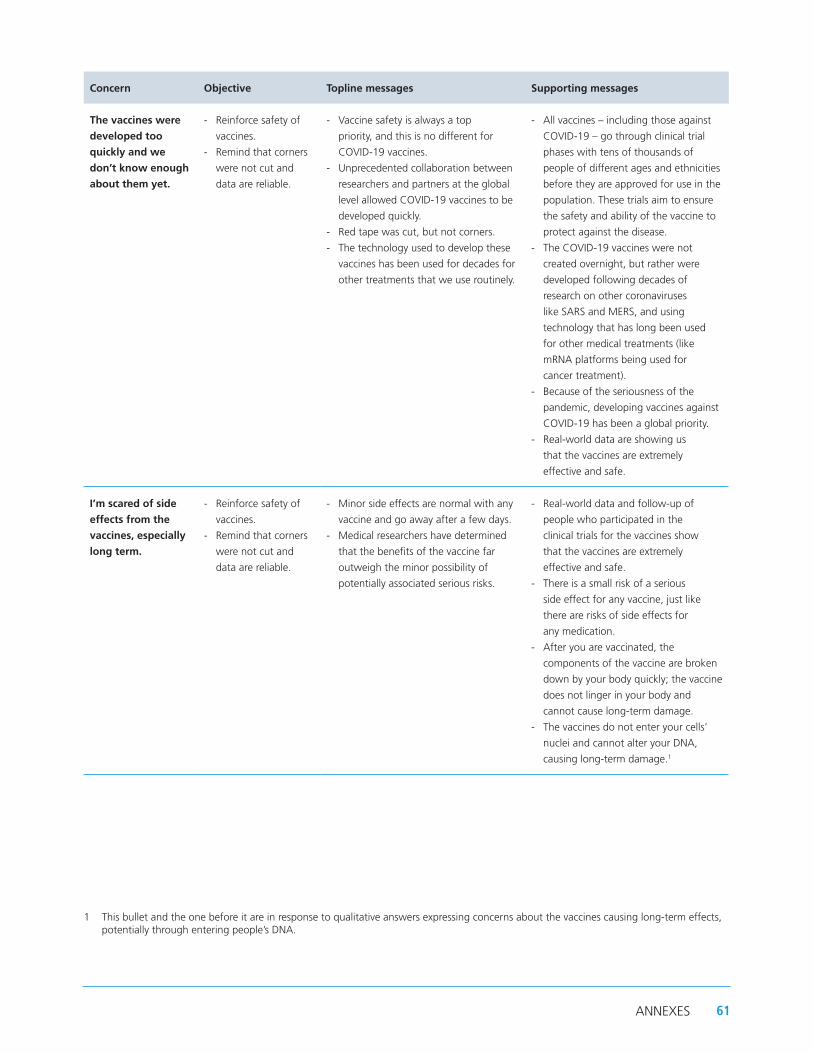
Concern Objective Topline messages Supporting messages
The vaccines were
developed too
quickly and we
don’t know enough
about them yet.
- Reinforce safety of
vaccines.
- Remind that corners
were not cut and
data are reliable.
- Vaccine safety is always a top
priority, and this is no different for
COVID-19 vaccines.
- Unprecedented collaboration between
researchers and partners at the global
level allowed COVID-19 vaccines to be
developed quickly.
- Red tape was cut, but not corners.
- The technology used to develop these
vaccines has been used for decades for
other treatments that we use routinely.
- All vaccines – including those against
COVID-19 – go through clinical trial
phases with tens of thousands of
people of different ages and ethnicities
before they are approved for use in the
population. These trials aim to ensure
the safety and ability of the vaccine to
protect against the disease.
- The COVID-19 vaccines were not
created overnight, but rather were
developed following decades of
research on other coronaviruses
like SARS and MERS, and using
technology that has long been used
for other medical treatments (like
mRNA platforms being used for
cancer treatment).
- Because of the seriousness of the
pandemic, developing vaccines against
COVID-19 has been a global priority.
- Real-world data are showing us
that the vaccines are extremely
effective and safe.
I’m scared of side
effects from the
vaccines, especially
long term.
- Reinforce safety of
vaccines.
- Remind that corners
were not cut and
data are reliable.
- Minor side effects are normal with any
vaccine and go away after a few days.
- Medical researchers have determined
that the benefits of the vaccine far
outweigh the minor possibility of
potentially associated serious risks.
- Real-world data and follow-up of
people who participated in the
clinical trials for the vaccines show
that the vaccines are extremely
effective and safe.
- There is a small risk of a serious
side effect for any vaccine, just like
there are risks of side effects for
any medication.
- After you are vaccinated, the
components of the vaccine are broken
down by your body quickly; the vaccine
does not linger in your body and
cannot cause long-term damage.
- The vaccines do not enter your cells’
nuclei and cannot alter your DNA,
causing long-term damage.1
1 This bullet and the one before it are in response to qualitative answers expressing concerns about the vaccines causing long-term effects, potentially through entering people’s DNA.
61ANNEXES

Concern Objective Topline messages Supporting messages
I don’t want
the vaccine
that’s available
to me/ I don’t
trust the vaccine
manufacturer.
- Reinforce efficacy
of vaccines in
preventing severe
illness and death.
- The best vaccine is the one that is
available to you first.
- Data have shown us that all approved
vaccines are extremely safe and
effective at preventing serious
disease and death.
- Waiting for your “favorite” or preferred
vaccine puts you at risk for longer.
- The sooner you are vaccinated with any
of the approved vaccines, the sooner
you can be protected from a serious
case of COVID-19 and death.
- All of the approved vaccines can help
us fight the pandemic.
- All vaccine manufacturers must
follow the same processes for getting
authorization by WHO; there are no
exceptions. This includes presenting
detailed data on their safety and
efficacy. Only vaccines that have proved
these will be approved.
I don’t trust my
government’s/
WHO’s handling of
the pandemic and
the vaccine rollout.2
- Reinforce global
collaboration efforts
for the development
of the vaccines.
- Show personal
reasons why
trusted individuals
have chosen to be
vaccinated.
- Data have shown us that all approved
vaccines are extremely safe and
effective at preventing serious
disease and death.
- Safety monitoring continues
after vaccines are introduced in
the population.
- The vaccines are a result of global
collaboration to fight the pandemic.
- For main and supporting messages,
suggest using a trusted leader
(according to the target audience)
to deliver them.
- For supporting messages, suggest
adding personal reasons why this
leader chose to get vaccinated.
I don’t need a
vaccine because my
religion will protect
me.
- Remind people of
the moral obligation
to get vaccinated to
protect others.
- Getting vaccinated is the most effective
way to protect you from COVID-19.
- Getting vaccinated helps your
community by keeping health
services functioning.
- We have a moral duty to
get vaccinated.
- Health services have been
overwhelmed because of the
pandemic. When fewer people are
hospitalized due to COVID-19, health
services can focus on providing
other services.
- The socioeconomic effects of the
pandemic have also hurt people,
including by worsening their health.
- Getting vaccinated is doing our part
to protect our communities, help our
health systems, and support people’s
individual economies.
- Note: Include specific messages using
religious denomination to explain the
need for COVID-19 vaccines.
2 Suggest that these messages be shared via trusted spokespersons (local leaders, community health workers, religious leaders, local media, other healthcare workers, etc.).
62 HEALTHCARE WORKERS AND COVID-19 VACCINATION IN THE CARIBBEAN

Concern Objective Topline messages Supporting messages
COVID-19 is not
a problem in my
country. We don’t
need a vaccine.
- Increase risk
perception for
COVID-19 at the
individual and health
system level.
- In a globalized world, it is very
easy for disease to spread across
country borders.
- COVID-19 will not be defeated until
everyone is safe.
- Our public health response must not
leave anyone or any country behind.
- PAHO encourages people to get
vaccinated against COVID-19 with
whichever vaccine is offered to them by
their national health authorities when
they are eligible.
I have allergies. - Clarify that people
with allergies can still
be vaccinated.
- People with allergies can take the
COVID-19 vaccine unless they
have had a severe allergic reaction
(anaphylaxis) to any component of the
COVID-19 vaccine.
- Anyone with severe allergic reactions
to foods, oral medications, latex, pets,
insects, and environmental triggers may
still get vaccinated against COVID-19.
- People with a severe allergic
reaction (anaphylaxis) to any vaccine
or injectable (intramuscular or
intravenous) medication should
consult with their health provider
to assess risk prior to receiving the
COVID-19 vaccine.
- People with severe allergies require a
30-minute observation period after
vaccination, while all others must be
observed for 15 minutes. Vaccine
clinics have safety protocols in place to
respond to any adverse reactions.
- Only a very small percentage of the
population is severely allergic to the
components of the COVID-19 vaccines.
I’m breastfeeding. - Clarify that
breastfeeding
persons can still be
vaccinated.
- There is no contraindication for
breastfeeding persons to be vaccinated
against COVID-19.
- The vaccines against COVID-19
are safe for both the breastfeeding
person and the child.
- Persons who are breastfeeding can still
get vaccinated against COVID-19 when
it is their turn.
- Discontinuing breastfeeding is not
recommended, as this offers substantial
health benefits to lactating women and
their breastfed children.
63ANNEXES
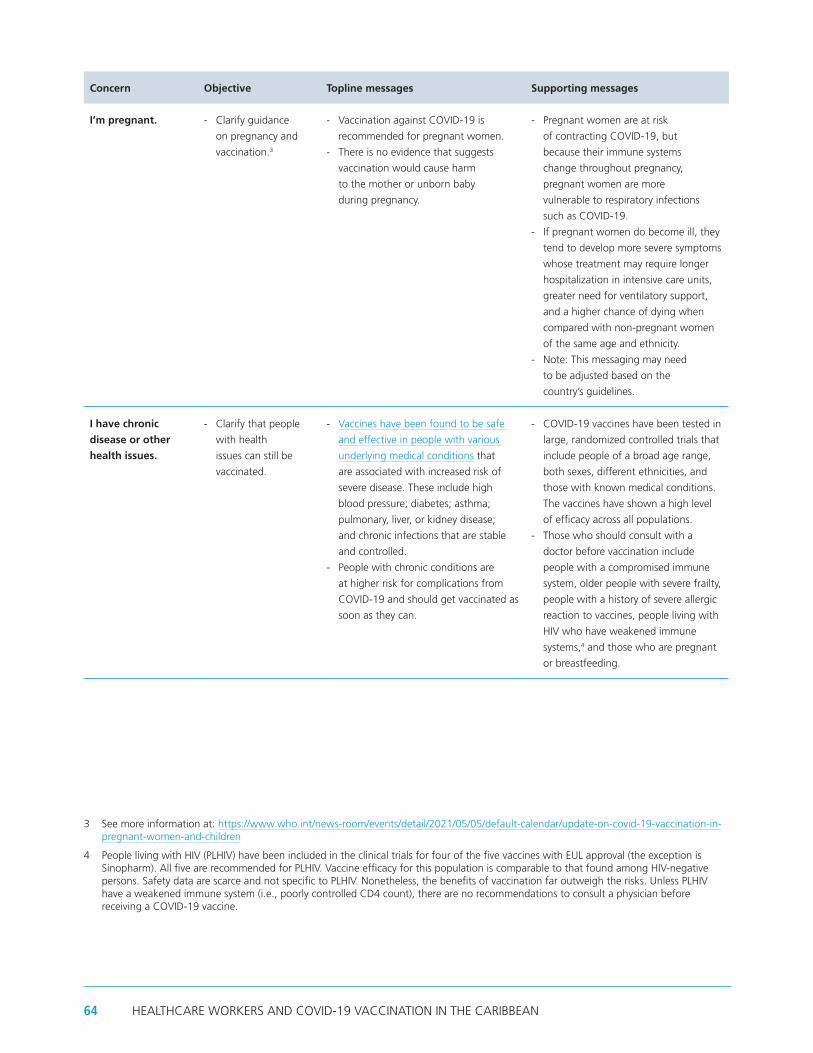
Concern Objective Topline messages Supporting messages
I’m pregnant. - Clarify guidance
on pregnancy and
vaccination.3
- Vaccination against COVID-19 is
recommended for pregnant women.
- There is no evidence that suggests
vaccination would cause harm
to the mother or unborn baby
during pregnancy.
- Pregnant women are at risk
of contracting COVID-19, but
because their immune systems
change throughout pregnancy,
pregnant women are more
vulnerable to respiratory infections
such as COVID-19.
- If pregnant women do become ill, they
tend to develop more severe symptoms
whose treatment may require longer
hospitalization in intensive care units,
greater need for ventilatory support,
and a higher chance of dying when
compared with non-pregnant women
of the same age and ethnicity.
- Note: This messaging may need
to be adjusted based on the
country’s guidelines.
I have chronic
disease or other
health issues.
- Clarify that people
with health
issues can still be
vaccinated.
- Vaccines have been found to be safe
and effective in people with various
underlying medical conditions that
are associated with increased risk of
severe disease. These include high
blood pressure; diabetes; asthma;
pulmonary, liver, or kidney disease;
and chronic infections that are stable
and controlled.
- People with chronic conditions are
at higher risk for complications from
COVID-19 and should get vaccinated as
soon as they can.
- COVID-19 vaccines have been tested in
large, randomized controlled trials that
include people of a broad age range,
both sexes, different ethnicities, and
those with known medical conditions.
The vaccines have shown a high level
of efficacy across all populations.
- Those who should consult with a
doctor before vaccination include
people with a compromised immune
system, older people with severe frailty,
people with a history of severe allergic
reaction to vaccines, people living with
HIV who have weakened immune
systems,4 and those who are pregnant
or breastfeeding.
3 See more information at: https://www.who.int/news-room/events/detail/2021/05/05/default-calendar/update-on-covid-19-vaccination-in-pregnant-women-and-children
4 People living with HIV (PLHIV) have been included in the clinical trials for four of the five vaccines with EUL approval (the exception is Sinopharm). All five are recommended for PLHIV. Vaccine efficacy for this population is comparable to that found among HIV-negative persons. Safety data are scarce and not specific to PLHIV. Nonetheless, the benefits of vaccination far outweigh the risks. Unless PLHIV have a weakened immune system (i.e., poorly controlled CD4 count), there are no recommendations to consult a physician before receiving a COVID-19 vaccine.
64 HEALTHCARE WORKERS AND COVID-19 VACCINATION IN THE CARIBBEAN

Concern Objective Topline messages Supporting messages
I’ve already had
COVID-19, I don’t
need a vaccine.
- Clarify that people
who have had
COVID-19 should
still be vaccinated.
- People who have already been
infected with SARS-CoV-2 should still
get vaccinated unless told otherwise
by their health care provider.
- It is still not known how long the
immunity from the disease lasts.
- Some people get infected with
SARS-CoV-2 a second time, which
makes getting vaccinated even
more important.
- Even if you had a previous infection,
the vaccine acts as a booster that
strengthens the immune response.
65ANNEXES

66 HEALTHCARE WORKERS AND COVID-19 VACCINATION IN THE CARIBBEAN


www.paho.org
Concerns, Attitudes, and Intended Practices of Healthcare Workers to COVID-19 Vaccination in the Caribbean
Co
ncern
s, Attitu
des, an
d In
tend
ed Practices o
f Health
care Wo
rkers to C
OV
ID-19 V
accinatio
n in
the C
aribb
ean