conceptual green infrastructure design in the point … · conceptual green infrastructure design...
TRANSCRIPT

Conceptual Green Infrastructure Design in the Point Breeze Neighborhood, City of Pittsburgh
2012 GREEN INFRASTRUCTURE COMMUNITY PARTNERS 3 Rivers Wet Weather
Pittsburgh, Pennsylvania
December 2015
EPA EP-C-11-009

ii
About the Green Infrastructure Technical Assistance Program
Stormwater runoff is a major cause of water pollution in urban areas. When rain falls in undeveloped areas, soil and plants absorb and filter the water. When rain falls on our roofs, streets, and parking lots, however, the water cannot soak into the ground. In most urban areas, stormwater is drained through engineered collection systems (storm sewers) and discharged into nearby water bodies. The stormwater carries trash, bacteria, heavy metals, and other pollutants from the urban landscape, polluting the receiving waters. Higher flows also can cause erosion and flooding in urban streams, damaging habitat, property, and infrastructure.
Green infrastructure uses vegetation, soils, and natural processes to manage water and create healthier urban environments. At the scale of a city or county, green infrastructure refers to the patchwork of natural areas that provides habitat, flood protection, cleaner air, and cleaner water. At the scale of a neighborhood or site, green infrastructure refers to stormwater management systems that mimic nature by soaking up and storing water. Green infrastructure can be a cost-effective approach for improving water quality and helping communities stretch their infrastructure investments further by providing multiple environmental, economic, and community benefits. This multi-benefit approach creates sustainable and resilient water infrastructure that supports and revitalizes urban communities.
The U.S. Environmental Protection Agency (EPA) encourages communities to use green infrastructure to help manage stormwater runoff, reduce sewer overflows, and improve water quality. EPA recognizes the value of working collaboratively with communities to support broader adoption of green infrastructure approaches. Technical assistance is a key component to accelerating the implementation of green infrastructure across the nation and aligns with EPA’s commitment to provide community focused outreach and support in the President’s Priority Agenda Enhancing the Climate Resilience of America’s Natural Resources. Creating more resilient systems will become increasingly important in the face of climate change. As more intense weather events or dwindling water supplies stress the performance of the nation’s water infrastructure, green infrastructure offers an approach to increase resiliency and adaptability.
For more information about Green Infrastructure, visit http://www.epa.gov/greeninfrastructure.

iii
Acknowledgements
Principal EPA Team
Kenneth Hendrickson, USEPA Region 3 Dominique Lueckenhoff, USEPA Region 3 Christopher Kloss, USEPA Tamara Mittman, USEPA
Community Team
Beth Dutton, 3 Rivers Wet Weather John W. Schombert, 3 Rivers Wet Weather
Consultant Team
Dan Christian, Tetra Tech Valerie Novaes, Tetra Tech Anne Thomas, Tetra Tech
This report was developed under EPA Contract No. EP-C-11-009 as part of the 2012 EPA Green Infrastructure Community Partner Program.
Cover photo by Richard Prescott, Keller Williams.

iv
Contents
About the Green Infrastructure Technical Assistance Program ................................................................... ii Acknowledgements ...................................................................................................................................... iii Executive Summary ....................................................................................................................................... 1 1. Introduction .......................................................................................................................................... 2 2. Nine Mile Run Sewershed: Frick Museum and Surrounding Area Project Site .................................... 4
2.1. Existing Site Conditions ................................................................................................................. 5 2.2. Proposed Site Design .................................................................................................................... 6
3. Goals ...................................................................................................................................................... 6 3.1. Project Goals ................................................................................................................................. 7 3.2. Design Goals .................................................................................................................................. 7
4. Green Infrastructure Toolbox ............................................................................................................... 7 4.1. Vegetated Green Infrastructure Practices .................................................................................... 8 4.2. Permeable Pavement .................................................................................................................... 9
5. Green Infrastructure Conceptual Design ............................................................................................ 10 5.1. Analytical Methods ..................................................................................................................... 10 5.2. Recommended Sizing and Layout ............................................................................................... 11
5.2.1. Frick Museum Parking Lot .................................................................................................. 11 5.2.2. S. Homewood Avenue ........................................................................................................ 12 5.2.3. Le Roi Road ......................................................................................................................... 13 5.2.4. Osage Lane and Roycrest Place .......................................................................................... 14 5.2.5. Card Lane and Lang Court .................................................................................................. 15 5.2.6. Summary of Project Sites ................................................................................................... 16
6. Green Infrastructure Practice Technical Specifications ...................................................................... 20 6.1. Common Design Elements .......................................................................................................... 20
6.1.1. Site Evaluation and Soil Infiltration Testing ........................................................................ 20 6.1.2. Underdrain ......................................................................................................................... 20
6.2. Design Elements .......................................................................................................................... 20 6.3. Bioretention ................................................................................................................................ 21
6.3.1. Soil Media ........................................................................................................................... 21 6.3.2. Grading ............................................................................................................................... 22 6.3.3. Plant Selection .................................................................................................................... 23
6.4. Permeable Pavement .................................................................................................................. 25 7. Operations and Maintenance ............................................................................................................. 27 8. Green Infrastructure Practice Cost Estimates ..................................................................................... 28 9. Conclusion ........................................................................................................................................... 35 10. References ........................................................................................................................................... 35 Appendix – Site Reconnaissance Checklist and Map
v
Tables
Table 5-1. Subcatchment Delineations and Required Storage Volume ...................................................... 11 Table 5-2. Green Infrastructure Practice Sizing and Storage ...................................................................... 16 Table 5-3. Green Infrastructure Practice Cross-Sections ............................................................................ 17 Table 7-1. Bioretention Operations and Maintenance Considerations ...................................................... 27 Table 7-2. Permeable Pavement Operations and Maintenance Considerations ....................................... 28 Table 8-1. Frick Museum Private Parking Lot – Bioretention Planter Box .................................................. 29 Table 8-2. Frick Museum Private Parking Lot – Permeable Pavement Parking Stalls................................. 29 Table 8-3. S. Homewood Avenue – Curb Extension Bioretention .............................................................. 30 Table 8-4. S. Homewood Avenue – Traffic Island Bioretention .................................................................. 31 Table 8-5. Le Roi Road - Center Median Bioretention ................................................................................ 31 Table 8-6. Le Roi Road – Permeable Pavement Parking Strips ................................................................... 32 Table 8-7. Osage Lane - Permeable Alley .................................................................................................... 32 Table 8-8. Roycrest Place – Permeable Pavement Parking Strips............................................................... 33 Table 8-9. Card Lane – Permeable Pavement Parking Strips ...................................................................... 33 Table 8-10. Lang Court – Permeable Pavement Parking Strips .................................................................. 34 Table 8-11. Annual Maintenance Cost Estimate ......................................................................................... 34
Figures
Figure 1-1. Site Location Map ....................................................................................................................... 3 Figure 2-1. Point Breeze Neighborhood within the City of Pittsburgh ......................................................... 4 Figure 2-2. Frick Museum and Surrounding Area Project Boundary ............................................................ 4 Figure 2-3. South Homewood Avenue adjacent to Frick Park ...................................................................... 6 Figure 2-4. Le Roi Road ................................................................................................................................. 6 Figure 4-1. Bioretention in Median ............................................................................................................... 9 Figure 4-2. Curb-extension Bioretention ...................................................................................................... 9 Figure 4-3. Permeable Interlocking Concrete Paver Parking Lane.............................................................. 10 Figure 4-4. Permeable Interlocking Concrete Paver Parking Stalls ............................................................. 10 Figure 5-1. Permeable Pavement Proposed in Parking Stalls on Left ......................................................... 12 Figure 5-2. Bioretention Proposed Behind Curb on Left............................................................................. 12 Figure 5-3. Bioretention Proposed as Curb- Extension on S. Homewood Avenue ..................................... 13 Figure 5-4. Bioretention Proposed in Traffic Circle at S. Homewood Avenue and Reynolds Street .......... 13 Figure 5-5. Bioretention Proposed in Median on Le Roi Road ................................................................... 14 Figure 5-6. Permeable Parking Strips Proposed on Le Roi Road ................................................................. 14 Figure 5-7. Permeable Pavement Proposed along Roycrest Place ............................................................. 15 Figure 5-8. Permeable Pavement Proposed across Osage Lane ................................................................. 15 Figure 5-9. Permeable Pavement Parking Strips Proposed along Lang Court ............................................ 15 Figure 5-10. Permeable Pavement Parking Strips Proposed along Card Lane ........................................... 15 Figure 5-11. Proposed Green Infrastructure Practice Placement – North Project Area ............................ 18 Figure 5-12. Proposed Green Infrastructure Practice Placement – South Project Area............................. 19 Figure 6-1. Bioretention Planted with Turf Grass ....................................................................................... 23 Figure 6-2. Planter Box Style Bioretention Cross-Section ........................................................................... 24 Figure 6-3. Curb-extension Bioretention Cross-Section ............................................................................. 24 Figure 6-4. Permeable Parking Strip Cross-Section..................................................................................... 26 Figure 6-5. Permeable Alley Cross-Section ................................................................................................. 26

1
Executive Summary
The City of Pittsburgh, like many East Coast metropolitan areas, is served by a combined sewer system constructed in the 1800s. This type of system collects stormwater along with wastewater and carries it to a publically owned water treatment works. In 2008, the city entered into a consent decree to address combined sewer overflows (CSOs); part of this agreement required the development of a Long Term Control Plan (LTCP). The LTCP includes a variety of measures, including the use of green infrastructure practices to reduce stormwater runoff, promote infiltration, and provide other benefits.
The organization 3 Rivers Wet Weather (3RWW) was created to help address these issues. Recognizing the opportunity to achieve multiple environmental and livability goals by addressing green infrastructure early in the Wet Weather Plan planning process, 3RWW sought technical assistance from EPA. Using tools to guide site selection, 3RWW identified three sites in the Pittsburgh community for further analysis, including a model conceptual design for green infrastructure practices at each site.
One of these project sites is a historic residential neighborhood that includes the Frick Museum, the Frick Art & Historical Center, the Frick mansion, and a 5-acre complex of lawns and gardens. The site is adjacent to Frick Park, a 561-acre municipal park providing an extensive wildlife habitat accessible through its network of trails. Based on the project and design goals, an EPA team developed a conceptual stormwater management design that would complement and enhance the Wet Weather Plan to reduce CSOs in the Pittsburgh area.
The conceptual design was intended to achieve the project goals of reducing stormwater volume to the combined sewer system while improving drainage and water quality with a combination of bioretention and permeable pavement. The design also achieves aesthetic appeal by adding natural vegetative features. The conceptual design includes:
• Permeable pavement and bioretention in the Frick Museum parking lot.
• Curb-extension bioretention and traffic circle bioretention on S. Homewood Avenue.
• Bioretention in the median and permeable parking strips on Le Roi Road.
• Permeable parking strips on Roycrest Place.
• Permeable alley on Osage Lane.
• Permeable parking strips on Card Lane.
• Permeable parking strips on Lang Court.
The other two sites (Sussex Avenue in Brookline and Windermere Drive in Swisshelm Park) are addressed in separate reports.

2
1. Introduction
The Greater Pittsburgh Area is located on the Allegheny Plateau, where the confluence of the Allegheny River from the northeast and the Monongahela River from the southeast form the Ohio River. The rivers and mountains form the backdrop for the area’s economy and livelihood. In addition to being used for swimming, boating, and fishing, the three rivers provide drinking water for the community.
The City of Pittsburgh and surrounding municipalities were built with a combined sewer system serving its older urban core areas. Combined sewers convey sewage and stormwater flows in a single pipe sewer system, allowing combined sewer overflows (CSOs) to Pittsburgh waterways during wet weather. Addressing the sewage overflow problems is a priority for the region, including the Allegheny County Sanitary Authority (ALCOSAN), which provides wastewater treatment services to 83 municipalities in the county.
In January 2008, ALCOSAN entered into a consent decree with the United States Environmental Protection Agency (EPA), Pennsylvania Department of Environmental Protection (DEP), and the Allegheny County Health Department (ACHD). The consent decree is a legal, binding document that requires ALCOSAN to meet a series of requirements for planning, design and construction, operation and permitting with the purpose of improving water quality in receiving waters and protecting designated waterway uses that include drinking water, recreation, aquatic life, and others. The consent decree requires that ALCOSAN reduce CSO discharges into the Ohio, Allegheny, and Monongahela Rivers, and their tributary streams of Chartiers Creek, Saw Mill Run, and Turtle Creek.
This commitment to reduce CSOs and improve water quality and recreation has led the municipalities to consider the use of green infrastructure for stormwater management and CSO reduction.
The 3 Rivers Wet Weather (3RWW) nonprofit was created in 1998 to help Allegheny County municipalities address the region’s wet weather overflow problem. As part of their mission, 3RWW created the RainWays® tool to aid residents and engineers in determining the effects of proposed green infrastructure projects on CSO discharges. This tool is available at http://www.3riverswetweather.org/green-infrastructure.
Using RainWays® and EPA’s System for Urban Stormwater Treatment and Analysis IntegratioN (SUSTAIN) best management practice siting tool, 3RWW conducted a study assessing the feasibility of using green infrastructure within the City of Pittsburgh, Borough of West View, and Borough of Millvale. These areas are typical of the greater Pittsburgh area with moderate slopes and a constrained urban setting. Three sewersheds in the city (Nine Mile Run, McNeilly Run, and Girty’s Run) were evaluated for potential green infrastructure projects on municipal, commercial and residential properties. 3RWW then developed a planning-level methodology to identify potential locations for green infrastructure projects within SUSTAIN, then used the RainWays® tool to analyze flow reduction and costs for implementation. From this study, 12 candidate sites were chosen for further analysis.
After investigating the 12 candidate sites in March of 2013, three of the sites (two in Nine Mile Run and one in McNeilly Run) were selected as green infrastructure conceptual design projects as part of the 2012 EPA Green Infrastructure Community Partners Program. The goal was to determine model sites with the highest likelihood of success in managing stormwater and contributing toward the reduction of CSOs within the ALCOSAN system. The selection process weighed the following long-term as well as near-term considerations:

3
Long-Term Considerations
• Probability of neighborhood acceptance
• Maintainability
• Visibility
• Contribution toward CSO reductions
• Potential for excessive/debilitating pollutant loads from tributary area (e.g., hot spots and unpaved driveways)
• Frequent flooding
Near-Term Considerations
• Constructability and functionality
• Relative cost compared to other green infrastructure practices
• Existing pavement conditions (pavement needing resurfacing gets priority).
One of the selected project sites was the Frick Museum and surrounding area within the Nine Mile Run Sewershed (City of Pittsburgh, Point Breeze Neighborhood). Refer to Figure 1-1 for the project location.
This project will enhance the space in the Point Breeze Neighborhood by providing stormwater treatment facilities, a “green” amenity in a public space, and an educational opportunity for local residents. The project will serve as a model for other existing urban neighborhoods in the greater Pittsburgh area and will demonstrate a range of appropriate green infrastructure tools that can be implemented elsewhere within the region.
Figure 1-1. Site Location Map

4
2. Nine Mile Run Sewershed: Frick Museum and Surrounding Area Project Site
The project site is located in the Point Breeze neighborhood within the Nine Mile Run Sewershed (see Figure 2-1 and Figure 2-2). The neighborhood is located in the central east part of the City of Pittsburgh between the Allegheny River and the Monongahela River. The project site is located in a historic residential neighborhood featuring the Frick Museum, which is part of the Frick Art & Historical Center, a 5-acre complex of lawns, gardens, museums, and the Frick mansion. The site is also adjacent to Frick Park, a 561-acre municipal park providing an extensive wildlife habitat accessible through its network of trails. Drainage from the project site would naturally flow to Frick Park, as would most of the Nine Mile Run Sewershed, but presently most stormwater is captured by the upstream combined sewer system resulting in diminished flows to the park and its streams.
Using green infrastructure concepts at the block scale will help improve water quality, increase flow to Frick Park, and help decrease CSOs by decreasing the peak flow rate and stormwater volume to the combined sewer system. In addition, the community could experience several other benefits often associated with green infrastructure, including increased property values, enhanced enjoyment of surroundings, a greater sense of well-being, and reduced crime. Information gained from this project will help promote similar projects throughout the greater Pittsburgh area.
Figure 2-1. Point Breeze Neighborhood within the City of Pittsburgh
Figure 2-2. Frick Museum and Surrounding Area Project Boundary

5
2.1. Existing Site Conditions
The project site is a mixture of single-family residences (~1/8-acre lots) and institutional buildings, highly visible due to the presence of the Frick Museum. The neighborhood is organized in a medium density configuration with houses that are situated close to the street. Lots are typically small such that minimal stormwater retention is expected. Refer to the Appendix for a copy of the completed site reconnaissance checklist and accompanying map for this area.
Most of the streets have curb and gutter facilities and a few alleys are present (see Figure 2-3 and Figure 2-4). Stormwater typically sheet flows off the ground surface into stormwater catch basins that tie directly into the combined sewer system. During small rain events, the stormwater is directed to the ALCOSAN wastewater treatment plant and treated before being released to the Ohio River. During larger rain events, the combined sewer system is overwhelmed and a mixture of sanitary sewage and stormwater is discharged untreated to the local waterways within Frick Park and the Monongahela River. Pollutants from the area are anticipated to include bacteria, nutrients, and heavy metals, typical of urban areas.
An analysis of the site topography indicates that surface water generally flows northeast to southwest on the site. The existing stormwater drainage network currently drains to Nine Mile Run, which flows within and downstream of Frick Park. The site elevations range from approximately 970 to 995 feet with several steep roads and topographic depressions. The predominant soil type suggests well-draining soil with good potential for removing stormwater from the combined sewer system (see below for a more detailed discussion). There are no known potential soil contamination issues within the project contributing area. The area is not designated as a groundwater recharge area, and there are no environmentally sensitive areas within the project limits.
All road and alley rights-of-way are owned and maintained by the City of Pittsburgh. Maintenance of the Frick Museum parking lot is the responsibility of Frick Art & Historical Center, Inc. The parking lot is well-maintained and sediment sources are minimal. The perimeter of the lot is landscaped and manicured.
Coordination with Frick Art & Historical Center, Inc. is needed for further implementation of the proposed conceptual design. Preliminary conversations with staff have indicated that they are very interested in retrofitting the parking lot with green infrastructure in the future. The likelihood of neighborhood acceptance of green infrastructure practices is high. As a result of the education and outreach efforts of the local Nine Mile Run Watershed Association, many residents have some understanding of green infrastructure and are likely to accept proposed practices.

6
Figure 2-3. South Homewood Avenue adjacent to Frick Park
Figure 2-4. Le Roi Road
2.2. Proposed Site Design
The goals of the field reconnaissance conducted for all three Pittsburgh-area sites on March 4-5, 2013 were to 1) verify the feasibility of implementing the proposed green infrastructure practices from the 3RWW RainWays®, and SUSTAIN study, 2) generate ideas for incorporating practical green infrastructure practices, and 3) further assess the drainage area based on catch basin locations. A variety of green infrastructure practices were deemed feasible throughout the area within the right-of-way as well as on institutional property.
As described below, the project team used the 3RWW RainWays® and SUSTAIN to develop proposed green infrastructure practices for the area that included a mixture of permeable pavement and bioretention within the street/alley right-of-way as well as on the Frick Museum property. Green infrastructure practices on residential properties were not considered for this demonstration effort.
Much of the potential area within the right-of-way has typical urban constraints, including buried utilities and narrow rights-of-way; therefore, it is important to choose green infrastructure practices that can demonstrate success within this environment. The selected practices also need to translate easily to other locations within the Pittsburgh area, recognizing any lessons learned as well as special design techniques for constructing on moderate slopes (5 to 10 percent). See section 6 for a description of the placement and design of the proposed green infrastructure practices.
3. Goals
3RWW is providing direct assistance to 83 municipalities to coordinate the development of their consent order-required “feasibility studies,” which analyze alternatives for the reduction, conveyance, or storage of wet weather flows within the communities. These feasibility studies specify the proposed actions (including both gray and green infrastructure) that municipalities served by ALCOSAN will implement to reduce CSOs. As these studies are integrated into the ALCOSAN Long-Term Control Plan (LTCP), the vision is to ensure that green infrastructure is evaluated and included in the municipal plans where cost-effective and appropriate. There is a sense of urgency in the timing of implementation of green infrastructure; the City’s LTCP is already under development and will be the blueprint for the construction of a system that will be required to mitigate sewer overflows in the ALCOSAN service area

7
by 2026. 3RWW will work directly with the municipalities through the existing Feasibility Study Working Group of about 25 municipal engineers who represent more than 70 of the 83 communities. Green infrastructure evaluation projects (such as the conceptual design presented in this report) are one of the mechanisms being used to emphasize the importance of green infrastructure and at the same time bring familiarity to those likely to plan for and design green infrastructure to mitigate sewer overflows.
3.1. Project Goals
Green infrastructure concepts and practices are intended to approximate the hydrologic conditions of the site prior to development through infiltration, evaporation, and detention of stormwater runoff. More specifically, the green infrastructure planned for this project is intended to assist in reducing CSOs while also improving drainage and water quality in the neighborhood. Secondary goals of the project are to improve the aesthetic appeal of the neighborhood while maintaining the historic character of the area. These goals will be accomplished through implementation of permeable pavement and bioretention within the project area on S. Homewood Avenue, Le Roi Road, Roycrest Place, Osage Lane, Card Lane, Lang Court, and the Frick Museum parking lot.
3.2. Design Goals
In accordance with the consent decree, ALCOSAN is working toward a target of no more than four overflows per sewer system regulator per year. Regulator structures direct all the dry weather flow to the ALCOSAN system and control the quantity of flow diverted to the ALCOSAN treatment plant during wet weather conditions. Modeling efforts during a previous study of the ALCOSAN system calculated overflow volumes for each event and ranked them from largest to smallest.
The project site is upstream of regulator M-47-OF. The model information was analyzed at this overflow point, and it was found that the fifth largest overflow event had a rainfall depth of 1.41 inches. (CSO requirements in Pennsylvania allow for four CSO events per year, so designing to control the fifth largest precipitation event will meet the requirements.) The allowable peak flow rate from the regulator drainage area to comply with this overflow event is 0.0019 cubic feet per second (cfs) per acre of drainage area (i.e., 164 cubic feet per day per acre or 1,230 gallons per day per acre). This is essentially the capacity at the regulator, normalized over the drainage area, when the hydraulic grade line is at the crest of the overflow weir. Since 0.0019 cfs per acre is such a slow release rate, it is likely that the existing 72-hour facility dewatering requirement (to prevent mosquito infestations) will govern the release rate of the practice.
For purposes of the conceptual design, the green infrastructure practices are sized to store the runoff resulting from 1.41 inches of rainfall from the tributary drainage area discounting release rates. This is standard design practice and will result in a slightly over-sized system; the sizing of the project would be reviewed as part of the final design.
4. Green Infrastructure Toolbox
Green infrastructure utilizes the natural features of the site in conjunction with the goals of the site development. Multiple controls can be incorporated into the development of the site to complement and enhance the proposed layout while also providing water quality treatment and volume reduction. Green infrastructure practices are those methods that provide control and/or treatment of stormwater runoff on or near locations where the runoff initiates. Typical large-scale practices include approaches such as vegetated infiltration basins and stormwater wetlands. Smaller scale practices include

8
approaches such as permeable pavement and bioretention facilities. The green infrastructure practices identified as appropriate for the project area include vegetated green infrastructure practices (i.e., bioretention) and permeable pavement. To assist planners and designers in going forward with these conceptual designs, the following discussion addresses constraints and opportunities associated with each applicable green infrastructure practice.
4.1. Vegetated Green Infrastructure Practices
Vegetated green infrastructure practices are vegetated, depressed areas with a fill soil (often engineered soil media) that infiltrate stormwater and remove pollutants through a variety of physical, biological, and chemical treatment processes. Vegetated green infrastructure practices can be large-scale controls treating several acres or small-scale controls placed in parking medians, rights-of-way, and other locations within impervious areas. The following section discusses bioretention as a small-scale control for this project.
Bioretention: Bioretention typically consists of vegetation, a ponding area, mulch layer, and soil media. The depressed area is planted with small- to medium-sized vegetation including trees, shrubs, grasses, and perennials and may incorporate a vegetated groundcover or mulch that can withstand urban environments and tolerate periodic inundation and dry periods. Runoff intercepted by the practice is temporarily captured in the depression and then filtered through the soil (often engineered soil) media. Pollutants are removed through a variety of physical, biological, and chemical treatment processes. Pretreatment of stormwater flowing into the bioretention area is recommended to remove large debris, trash, and larger particulates. Pretreatment may include a grass filter strip, sediment forebay, or grass swale. Ponding areas can be designed to increase flow retention and provide flood control.
Bioretention is well suited for removing stormwater pollutants from runoff, particularly for smaller wet weather events. Bioretention can be used to partially or completely meet stormwater management requirements on smaller sites. Bioretention areas are best suited for areas that would typically be dedicated to landscaping and can be designed to capture roof runoff, parking lot runoff, or sidewalk and street runoff (as shown in Figure 4-1 and Figure 4-2). Bioretention is especially useful in this project area to encourage walkability and green space within the right-of-way and museum parking lot.

9
Figure 4-1. Bioretention in Median
Source: Aaron Volkening
Figure 4-2. Curb-extension Bioretention
Source: Environmental Services, City of Portland, OR
4.2. Permeable Pavement
Conventional pavement results in increased surface runoff rates and volumes relative to pre-developed conditions. Permeable pavement, in contrast, works by allowing streets, parking lots, sidewalks, and other impervious surfaces to utilize the underlying soil’s natural infiltration capacity while maintaining the structural and functional features of the materials they replace. Permeable pavement contains small voids that allow water to drain through the pavement to a layer of aggregate and then infiltrate into the soil. If the native soils below the permeable pavement do not have enough percolation capacity, underdrains can be included to direct the stormwater to other downstream control systems. Permeable pavement can be developed using modular paving systems (e.g., concrete pavers, grid pavers, grass-pave, or gravel-pave) or poured-in-place solutions (e.g., pervious concrete or pervious asphalt).
Permeable pavement reduces the volume of stormwater runoff by converting an impervious area to a treatment unit. The aggregate sub-base can provide water quality improvements through filtering and enhance additional chemical and biological processes. The volume reduction and water treatment capabilities of permeable pavement are effective at reducing stormwater pollutant loads.
Permeable pavement can be used to replace traditional impervious pavement for most pedestrian and vehicular applications. Composite designs that use conventional asphalt or concrete in high-traffic areas adjacent to permeable pavement along shoulders or in parking areas can be implemented to provide a cost-effective solution to meet both transportation and stormwater management requirements. Permeable pavement is most often used in constructing pedestrian walkways, sidewalks, driveways, low-volume roadways, and parking areas of office buildings, recreational facilities, and shopping centers (Figure 4-3 and Figure 4-4). Permeable pavement is a suitable green infrastructure choice within the project area because it can be used without decreasing street parking or pedestrian walkways in narrow rights-of-way, such as alleys. It is also a convenient choice for parking lot pavement as it does not cause a reduction in parking capacity.

10
Figure 4-3. Permeable Interlocking Concrete Paver Parking Lane
Figure 4-4. Permeable Interlocking Concrete Paver Parking Stalls
5. Green Infrastructure Conceptual Design
This section addresses the selection, layout, and design of the green infrastructure practices for the project site. The selection and proposed layout of the controls within the project area are based on the 3RWW RainWays® and SUSTAIN study, determining the effects of green infrastructure on CSO volume reduction, and a field reconnaissance to verify feasibility and identify additional opportunities. The design method is described in section 5.1 and the conceptual layout and sizing practices are discussed in section 5.2. Detailed design information is summarized and presented in section 6.
5.1. Analytical Methods
Since a primary goal of this project is to alleviate CSO issues, the design of the green infrastructure practices is intended to retain a runoff volume resulting from 1.41 inches of rainfall from the tributary drainage area, disregarding release rates. The runoff curve number method was used to calculate runoff. Required storage volumes from the tributary drainage areas to the green infrastructure practices are presented in Table 5-1.
The subcatchment areas for the proposed green infrastructure practices were derived from topographic data (provided by 3RWW) and field visits. Note that these data will need to be validated as part of the final design. The soil was represented as medium-infiltrating soil (Hydrologic Soil Group B) per the Natural Resources Conservation Service Soil Survey data provided by 3RWW. Actual soil infiltration rates will need to be determined as part of the final design (see section 6).
The final conceptual sizing of the green infrastructure practices was based on available surface area and a projected design cross-section to ensure that the practice, at a minimum, could capture the required storage volume for the regulator capacity. Storage within the practice took into account void space within the soil media and aggregate storage layer but not the required 72-hour dewatering time, infiltration, and evapotranspiration. Therefore, during final design, these parameters should be taken into account; which would help decrease the practice sizes. It was also assumed that perforated underdrains that are included in the conceptual designs would have a downstream valve at the outlet, which would be regulated to meet dewatering requirements as needed. With Type B soils, an

11
underdrain is not imperative but is useful for future flow monitoring or as a failsafe should underlying soils become clogged.
Table 5-1. Subcatchment Delineations and Required Storage Volume
Subcatchment
Subcatchment Drainage Area
(acres)
Required Storage Volume for Regulator Capacity
(cubic feet) Frick Museum parking lot - bioretention 0.36 1,272 Frick Museum parking lot - permeable parking stalls 0.89 2,228 S. Homewood Avenue curb-extension bioretention 0.19 702 S. Homewood Avenue - traffic island bioretention 2.18 4,563 Le Roi Road - bioretention median 0.15 474 Le Roi Road - permeable parking strips 0.24 446 Osage Lane - permeable alley 0.09 404 Roycrest Place - permeable parking strips 1.00 2,505 Card Lane - permeable parking strips 0.54 1,591 Lang Court - permeable parking strips 0.46 1,533
5.2. Recommended Sizing and Layout
The conceptual layout and sizing of the green infrastructure practices within the project area are discussed in this section. The cross-section designs used for the sizing of the practices are in section 6.
Within the discussion below, note that the water storage volume is the product of the surface area of the practice and the equivalent storage depth. Equivalent storage depth is the sum of the surface ponding depth and the product of the void space and applicable underlying layers. The soil layer, bedding layer, and aggregate storage layer void space are 20 percent, 30 percent, and 40 percent, respectively. Storage volume indicates the green infrastructure practice volume, discounting the underlying soil infiltration rate, required to meet the design criteria. The cross-section of the final design can vary from the conceptual design cross-section as long as the water storage volume capacity is maintained.
5.2.1. Frick Museum Parking Lot
Proposed green infrastructure practices within the parking lot include a combination of permeable pavement and bioretention. Permeable pavement is proposed in the parking stalls adjacent to the landscape island (see Figure 5-1 and Figure 5-2). This alignment would capture the sheet flow from the majority of the parking lot. Permeable interlocking concrete pavers, pervious asphalt, or pervious concrete would be the best options for this application. Based on the available area of 3,600 square feet within the parking stalls and an equivalent water storage depth of 0.8 feet, the available storage volume is 2,880 cubic feet. This is enough storage to capture and treat 0.90 inches of runoff from the fifth largest storm event (1.41 inches) over the drainage area. The equivalent water storage depth assumes 24 inches of aggregate storage.
Bioretention is proposed adjacent to the sidewalk on the southeast side of the museum building and should be sized to capture runoff from the drive lane and parallel parking on northwest side of the island. The bioretention area would provide a dual-function landscaped area and stormwater management system in a highly visible location. The available surface area is 750 square feet (5 feet

12
wide by 150 feet long). The equivalent water storage depth is 1.7 feet based on a cross-section with 6 inches of surface storage, 24 inches of engineered soil, and 24 inches of aggregate storage. This provides 1,275 cubic feet of storage. This is enough storage to capture and treat 0.98 inches of runoff from the fifth largest storm event (1.41 inches) over the drainage area.
Figure 5-1. Permeable Pavement Proposed in Parking Stalls on Left
Figure 5-2. Bioretention Proposed Behind Curb on Left
5.2.2. S. Homewood Avenue
Green infrastructure practices proposed for S. Homewood Avenue include a curb-extension bioretention practice adjacent to Frick Park and bioretention within the traffic circle. The curb-extension bioretention would collect runoff from a portion of S. Homewood Avenue near the entrance to the cemetery. The traffic circle bioretention would collect flow from the front yards and road of the 200 block of S. Homewood (see Figure 5-3 and Figure 5-4). The gutter flow would need to be directed to the bioretention circle, most likely by providing a shallow trench drain directing flow to the bioretention area. An overflow catch basin would be required within the traffic circle.
The curb-extension bioretention is designed to be 240 square feet (6 feet wide by 40 feet long) and will not impede street side parking or the flow of traffic. The practice can capture and treat 1.1 inches of runoff from the fifth largest storm event (1.41 inches) over the drainage area with 6 inches of surface storage, 24 inches of engineered soil, 24 inches of aggregate storage under the practice, and 36 inches of aggregate storage under the adjacent sidewalk.
The traffic circle bioretention will be able to accommodate the design criteria for the regulator with a capture and treatment runoff depth of 0.6 inch in a cross-section including 12 inches of surface storage, 36 inches of engineered soil, and 42 inches of aggregate. This cross-section is fairly deep due to the large tributary drainage area relative to the available surface area of the practice. To reduce the depth of the practice, the aggregate storage could extend under the road.

13
Figure 5-3. Bioretention Proposed as Curb- Extension on S. Homewood Avenue
Figure 5-4. Bioretention Proposed in Traffic Circle at S. Homewood Avenue and Reynolds Street
5.2.3. Le Roi Road
Proposed green infrastructure practices along Le Roi Road include a combination of permeable pavement and bioretention. Permeable pavement parking strips are proposed along the outside curb in the parking lane (opposite from the center median). This configuration of permeable pavement would capture the sheet flow from the center line of Le Roi Road to the outside curb line (see Figure 5-5 and Figure 5-6). Permeable interlocking concrete pavers would be the best option for this application. Based on the available area of 1,920 square feet within the parking lane and an equivalent water storage depth of 0.55 feet, the available storage volume is 1,050 cubic feet. This is enough storage to capture and treat 1.2 inches over the drainage area, well beyond the depth required by the design criteria. Twelve inches of aggregate storage was assumed as a minimum to represent the requirement for structural support of the road. During design, the structural requirement may vary from this assumption. The equivalent water storage depth assumes 6 inches of bedding layer and 12 inches of aggregate storage.
Bioretention is proposed in the center median in the section, where there are no mature street trees, and captures sheet flow from the center line of Le Roi Road to the inside curb line. The bioretention area would provide an opportunity to incorporate native plants and flowers in a mixed-use neighborhood. Based on the available area of 400 square feet (10 feet wide by 40 feet long) and an equivalent water storage depth of 1.3 feet, the available storage volume is 520 cubic feet. This is enough storage to capture and treat 0.95 inch of runoff from the fifth largest storm event (1.41 inches) over the drainage area. The equivalent water storage depth assumes 6 inches of surface storage, 24 inches of engineered soil, and 12 inches of aggregate storage.
The permeable pavement and bioretention could be installed together or alone. If only one project is selected, bioretention provides similar benefits in terms of storage capacity but provides more obvious aesthetic benefits.

14
Figure 5-5. Bioretention Proposed in Median on Le Roi Road
Figure 5-6. Permeable Parking Strips Proposed on Le Roi Road
5.2.4. Osage Lane and Roycrest Place
Roycrest Place is a short residential street that dead ends into Osage Lane with a small vegetated median separating the two streets. Proposed green infrastructure practices for these streets include permeable pavement parking strips along Roycrest Place and permeable pavement along Osage Lane (see Figure 5-7 and Figure 5-8). Since Osage Lane is configured as a narrow alley, concrete pervious pavement is proposed to replace the entire width of the alley.
Based on the available area in the alley (15 feet wide by 370 feet long) and an equivalent water storage depth of 0.4 feet, the available water storage volume is 2,220 cubic feet. This is enough storage to capture and treat 6.5 inches of runoff from the drainage area, well beyond the depth required by the design criteria. Twelve inches of aggregate storage was assumed as a minimum to represent the requirement for structural support of the permeable concrete road. During design, the structural requirement may vary from this assumption.
Permeable interlocking concrete pavers are proposed along the curb of Roycrest Place and will capture street runoff. An available surface area of 3,600 square feet (6 feet wide on each side of the road by 300 feet long) and an equivalent water storage depth of 0.75 feet can store a volume of 2,700 cubic feet. This green infrastructure practice can capture and treat 0.75 inch of runoff from the fifth largest storm event (1.41 inches) over the drainage area. The equivalent water storage depth is based on 6 inches of bedding layer and 18 inches of aggregate storage.

15
Figure 5-7. Permeable Pavement Proposed along Roycrest Place
Figure 5-8. Permeable Pavement Proposed across Osage Lane
5.2.5. Card Lane and Lang Court
Card Lane and Lang Court are short residential streets where permeable pavement is proposed as permeable parking strips along the curb line (see Figure 5-9 and Figure 5-10). This configuration would capture sheet flow from the roadway and a small amount from front yards. Permeable interlocking concrete pavers would be the best option for this application. Based on the available area along Card Lane of 2,350 square feet (390 feet by 6 feet; 3 feet on each side of the road) within the parking lane and an equivalent water storage depth of 0.75 feet, the available storage volume is 1,755 cubic feet. This is enough storage to capture and treat 0.89 inches of runoff from the fifth largest storm event (1.41 inches) over the drainage area. The equivalent water storage depth assumes 6 inches of bedding layer and 18 inches of aggregate storage.
Figure 5-9. Permeable Pavement Parking Strips Proposed along Lang Court
Figure 5-10. Permeable Pavement Parking Strips Proposed along Card Lane
The available area along Lang Court is 1,740 square feet (290 feet by 6 feet; 3 feet on each side of the road) within the parking lanes with an equivalent water storage depth of 0.95 feet based on 6 inches of bedding layer and 24 inches of aggregate storage. This equates to an available storage volume of 1,653 cubic feet. This is enough storage to capture and treat 0.6 inches of runoff from the fifth largest storm event (1.41 inches) over the drainage area.

16
5.2.6. Summary of Project Sites
Table 5-2 and Table 5-3 provide a detailed description of available storage capacity and cross-section depths for each of the green infrastructure practice sites described above. Figure 5-11 and Figure 5-12 show the placement of the practices.
Table 5-2. Green Infrastructure Practice Sizing and Storage
Green Infrastructure
Practice Location
Description Location Width
(ft) Length
(ft)
SurfaceArea (sq ft)
Equivalent Water
Storage Depth (ft)3
Available Water
Storage Volume (cu ft)4
Runoff Depth Stored
(in)5
Bioretention Frick Museum Private parking lot 5 150 750 1.7 1,275 1.0
Permeable Pavement - parking stalls
Frick Museum Private parking lot 15 240 3,600 0.8 2,880 0.9
Curb-Extension Bioretention
S. Homewood Ave Right-of-way 6 40 240 3.2 2 770 1.1
Bioretention S. Homewood Ave Traffic Island 45 1 NA 1,590 3.0 4,770 0.6
Bioretention Le Roi Road Center Median 10 40 400 1.3 520 1.0 Permeable Pavement - parking strips
Le Roi Road Right-of-way 6 320 1,920 0.55 1,050 1.2
Permeable Pavement - Alley Osage Lane Right-of-way 15 370 5,550 0.4 2,220 6.5
Permeable Pavement – Parking Strips
Roycrest Place Right-of-way 12 300 3,600 0.75 2,700 0.75
Permeable Pavement - Parking Strips
Card Lane Right-of-way 6 390 2,340 0.75 1,760 0.9
Permeable Pavement - Parking Strips
Lang Court Right-of-way 6 290 1,740 0.95 1,650 1.0
1The assumed width of the traffic island bioretention is the diameter of the island. 2Equivalent water storage depth for the curb-extension bioretention takes into account the aggregate storage under the sidewalk that is not included in the surface area square footage. 3Equivalent Water Storage Depth: Ponding Depth x void space + Engineered Soil Depth x void space + Bedding Depth x void space + Aggregate Storage Depth x void space [Example Calculation: (0.5’ x 1.0) + (1.5’ x 0.2) + (0 x 0.3) + (0 x 0.4) = 0.8 feet equivalent depth] 4Available Water Storage Volume: Surface Area x Equivalent Water Storage Depth 5Runoff Depth Stored: Available Water Storage Volume/Surface Area and converted to inches

17
Table 5-3. Green Infrastructure Practice Cross-Sections
Green Infrastructure Practice
Location Description Location
Ponding Depth
(in)
Engineered Soil Depth
(in)
Bedding Depth
(in)
Aggregate Storage Depth
(in)
Bioretention Frick Museum Private parking lot 6 24 NA 24
Permeable Pavement - parking stalls Frick Museum Private parking
lot 0 0 0 24
Curb-Extension Bioretention
S. Homewood Ave Right-of-way 6 24 NA
24 plus 36 in. under sidewalk
Bioretention1 S. Homewood Ave Traffic Island 12 36 NA 42
Bioretention Le Roi Road Center Median 6 24 NA 12 Permeable Pavement - parking strips Le Roi Road Right-of-way 0 0 6 12
Permeable Pavement - Alley Osage Lane Right-of-way 0 0 0 12
Permeable Pavement – Parking Strips Roycrest Place Right-of-way 0 0 6 18
Permeable Pavement - Parking Strips Card Lane Right-of-way 0 0 6 18
Permeable Pavement - Parking Strips Lang Court Right-of-way 0 0 6 24
1 To meet the design criteria, the traffic island facility would need to be unusually deep due to the constraints of the circular median. Alternatively, aggregate storage could be placed under the road in addition to the circular median to reduce the facility depth.

18
Figure 5-11. Proposed Green Infrastructure Practice Placement – North Project Area

19
Figure 5-12. Proposed Green Infrastructure Practice Placement – South Project Area
20
6. Green Infrastructure Practice Technical Specifications
This section describes the conceptual design of the green infrastructure practices as proposed in section 5. The Pennsylvania Stormwater Best Management Practices Manual includes design guidance for manygreen infrastructure practices and should be referenced in any final design steps. The following is additional information, which may be helpful in the design of bioretention and permeable pavement applications.
6.1. Common Design Elements
The following sections describe design elements that are common to both bioretention and permeable pavement projects. Specific design elements for each practice are described separately below.
6.1.1. Site Evaluation and Soil Infiltration Testing
Site evaluation and soil infiltration testing is necessary to determine the suitability of a site for infiltration and gather data for the design of the infiltration practice. The Pennsylvania Stormwater Best Management Practices Manual, Appendix C – Site Evaluation and Soil Testing, should be referenced for evaluation and testing methods.
Expansive soils with a high shrink-swell potential are not prevalent in the Pittsburgh area, but if these soils are found at the site, the green infrastructure practice design should include underdrains and impermeable barriers where the controls are adjacent to infrastructure such as roads and buildings. Drainage should always be directed away from building foundations and road subgrades.
6.1.2. Underdrain
If the native soils underneath a green infrastructure practice are low-permeability soils, an underdrain may be required and should meet the following criteria:
• The type of perforated pipe is not critical to the function of the green infrastructure practice aslong as the total opening area of the perforations exceeds the expected flow capacity of theunderdrain and does not limit infiltration through the soil media. The perforations can be placedclosest to the invert of the pipe to achieve maximum potential for draining the facility. If ananaerobic zone is intended, the perforation can be placed at the top of the pipe.
• Place the underdrain within a pocket of drainage stone a minimum of 4 inches thick on all sides.
• The underdrain should drain freely and discharge to the existing sewer infrastructure.Alternatively, the underdrain outlet can be upturned to provide an internal sump (internal waterstorage) to improve infiltration and water quality. The optimal elevation of the underdrain invertshould be no less than 1.5 feet from the surface of the basin to provide an aerobic root zone forplants and to prevent previously-sorbed pollutants from mobilizing.
• Install a valve at the downstream end of the underdrain, where the system connects back to thesewer system. The valve may be used as a passive device to adjust the allowable release rate.
6.2. Design Elements
The green infrastructure siting was based on multiple factors including 1) effectiveness as a demonstration site, 2) multi-use asset for the surrounding neighborhood, 3) potential for volume reduction for CSO issues, and 4) ancillary benefits such as aesthetic improvement. The potential for green infrastructure practice demonstration was evaluated based on the proximity to parks, schools,

21
museums, or other features that would attract the public and acceptability in the neighborhood. The design also considered the potential for applying the green infrastructure design similarly throughout the greater Pittsburgh area.
The conceptual design of the practices takes into account the approximate soil infiltration rate, drainage area, runoff coefficient, and allowable peak flow rates based on the downstream combined sewer regulator. Additional design parameters for bioretention include the surface storage depth, planting soil depth, aggregate storage depth, and void space ratios of the soil and aggregate. Permeable pavement design parameters include pavement thickness, aggregate storage depth, and the applicable void space ratios. As this project moves into final design other considerations will include buried utilities, connection to the combined sewer system, and topography based on a survey.
6.3. Bioretention
Bioretention areas should have the following design features:
• For unlined systems, maintain a minimum of 5 feet between the green infrastructure practice andany adjacent buildings and at least 10-15 feet between the green infrastructure practice and anyadjacent basement.
• The design of the practice should consider the allowable release rate back to the combined sewer.This rate is dicated by the regulator capacity (refer to section 3) and also the recommendedmaximum facility dewater time of 72 hours. Both flow rates should be calculated and the rate thatmeets both design criteria will ultimately dictate the design of the practice. Dewateringmechanisms include infiltration through underlying soils as well as flow through an underdrainsystem. Use of an underdrain system is very effective in areas with low infiltration capacity soils.
• Utilize native and noninvasive plant species tolerant of urban environments, salt, and frequentinundation, and place a maximum of 3 inches of mulch on the surface of the soil.
• For the aggregate storage layer, use clean coarse aggregate AASHTO #4, #5, or equivalent.
• The filter layer placed between the soil media and the storage layer is recommended to be 2 to4 inches of clean medium sand (ASTM c-33) over 2 to 3 inches of #8 or #78 washed stone.
• Include an overflow structure with a non-erosive overflow channel to safely pass flows thatexceed the capacity of the facility; or design the facility as an off-line system where only thedesign volume enters the bioretention area.
• Inclusion of a pretreatment mechanism such as a grass filter strip, sediment forebay, or grassswale upstream of the practice to enhance the treatment capacity of the unit.
6.3.1. Soil Media
A minimum of 12-18 inches of engineered soil mixture is recommended in most cases for bioretention practices. This may be either an engineered soil mixture to replace the existing soil or a compost amendment to the existing soil. The soil media is typically specified to meet the growth requirements of the selected vegetation while still meeting the hydraulic requirements of the system.
Engineered Soil Mixture: Recognizing that there are many possible variations in soil media, the following is one example:
The engineered soil mixture is a blend of loamy soil, sand, and compost that is 30-40 percent compost (by volume). The expected infiltration rate should range from 1 to 2 inches per hour.

22
A particle gradation analysis of the blended material, including compost, should be conducted in conformance with ASTM C117/C136 (AASHTO T11/T27). The gradation of the blended material should meet the following gradation criteria:
Sieve Size Percent Passing 1 inch 100 #4 75-100 #10 40-100 #40 15-50 #100 5-25 #200 5-15
Other design criteria that should be considered:
• Soil media must have an appropriate amount of organic material to support plant growth. Organicmatter is considered an additive to help vegetation establish and contributes to sorption ofpollutants and should be between 5-10 percent. Additional organic matter can be added to thesoil to increase the water holding capacity. Organic materials will oxidize over time, causing anincrease in ponding that could adversely affect the performance of the bioretention area. Organicmaterial should consist of aged bark fines, or similar organic material. Organic material should notconsist of manure or animal compost. Newspaper mulch has been shown to be an acceptableadditive.
• pH should be between 5–8, cation exchange capacity should be greater than 5 milliequivalent/100 gsoil.
• High phosphorus concentrations are common in compost and when applied to a bioretentionarea, can result in leaching of phosphorus. When an overabundance of phosphorus enterswaterways, it can cause unhealthy balances of aquatic life. All bioretention media should beanalyzed for background levels of nutrients. Total phosphorus should not exceed the industrystandard of 15 ppm.
Compost Amendment: It may be possible to restore the surface soils by adding approximately 2.5 inches of compost over the surface of the site (King County 2005) and breaking up the soil with a subsoiler or ripper attached to a tow vehicle (Kees 2008). It may also be beneficial to amend the existing subsurface soil with compost to enhance the infiltration rate. This practice increases infiltration rates and also helps reduce cations and toxicants in the water. The disadvantage is that nutrient leaching occurs for a period of time (Pitt et al. 1999). Establishing native plants with extensive root systems will also help provide channels to promote infiltration in the subsurface soil.
6.3.2. Grading
Bioretention systems function best when the top soil layer is flat. A flat surface allows for even infiltration throughout the system and reduces runoff velocities, thereby minimizing the potential for erosion. Design and construction of long, linear bioretention systems with a flat surface can be problematic when the surrounding terrain is sloped due to the required grading. Terracing the system is one approach to maintaining a flat soil layer while minimizing the required earthwork. Clay check dams and existing driveway approaches are two possible approaches to terracing. The system may be designed with a longitudinal slope similar to a swale, however special attention is required. Storage

23
volume calculations should assume a flat water surface profile if the soil layer is sloped. Care is needed to ensure sufficient infiltration capacity through the engineered soil layer and to guard against surface erosion.
6.3.3. Plant Selection
For the green infrastructure practice to function properly and be attractive, vegetation selection is crucial. Appropriate vegetation will have the following characteristics:
• Plant materials must be tolerant of drought, ponding fluctuations, salt, and saturated soil conditions for 10 to 48 hours.
• Native plant species or hardy cultivars that are not invasive and do not require chemical inputs are recommended to be used to the maximum extent practicable.
• For native plant species, refer to the Pennsylvania Stormwater Best Management Practices Manual; Appendix B (http://www.elibrary.dep.state.pa.us/dsweb/Get/Document-76385/363-0300-002%20Appendix%20B.pdf).
• Turf grass systems may also be used. The advantage of turf grass systems is the reduced maintenance requirements. Figure 6-1 shows an example of a bioretention system planted with turf grass and street trees. Figure 6-2 shows a typical design for a planter box, while Figure 6-3 shows a typical design for a curb extension.
Figure 6-1. Bioretention Planted with Turf Grass
Source: Tetra Tech

24
Figure 6-2. Planter Box Style Bioretention Cross-Section
Figure 6-3. Curb-extension Bioretention Cross-Section

25
6.4. Permeable Pavement
Figure 6-4 and Figure 6-5 show a typical design for permeable pavement practices. General guidelines for applying permeable pavement are as follows:
• Permeable pavement can be developed using modular systems (e.g., concrete pavers, grid pavers, grass-pave, or gravel-pave) or poured-in-place solutions (e.g., pervious concrete or pervious asphalt).
• Permeable pavement can be substituted for conventional pavement in parking areas, low-volume/low-speed roadways, pedestrian areas, and driveways if the grades, native soils, drainage characteristics, and groundwater conditions of the paved areas are suitable.
• Permeable pavement is not appropriate for stormwater hotspots where hazardous materials are loaded, unloaded, or stored, unless the sub-base layers are completely enclosed by an impermeable liner.
• The bedding layer and sub-base structural layers should provide an adequate construction platform and base for the overlying pavement layers.
• If permeable pavement is installed over low-permeability soils or temporary surface flooding is a concern, an underdrain should be installed to ensure water removal from the sub-base reservoir and pavement.
• The infiltration rate of the soils or an installed underdrain should drain the sub-base within 72 hours.
• An impermeable liner can be installed between the sub-base and the native soil to prevent water infiltration when clay soils have a high shrink-swell potential or if a high water table or bedrock layer exists.
• Measures should be taken to protect permeable pavement from high sediment loads, particularly fine sediment, to reduce maintenance. Typical maintenance includes removing sediment with a vacuum truck.
• A reinforced concrete transition (width of 12-18 inches) is required where permeable pavement meets adjacent non-concrete pavement or soil.
• For interlocking or grid-type pavers use fine aggregate, coarse sand, or top soil and grass in openings
• Bedding layer immediately beneath the permeable pavement: – Permeable Interlocking Concrete Pavers: 1.5 to 3 inches of AASHTO #8 or #78 washed stone – Concrete and Plastic Grid Pavers: 1 to 1.5 inches of bedding sand – Pervious Concrete and Asphalt: None
• Structural layer or aggregate layer beneath the bedding layer: – 12 to 30 inches of clean aggregate AASHTO #56 or equivalent; thickness depends on
strength/storage needed; install 30 millimeter geotextile liner or filter layer where aggregate meets soil
• Design for projected traffic loads using AASHTO methods.
• When evaluating the potential placement of permeable pavement, avoid areas adjacent to mature trees as their root systems may be impacted when excavating for the structural/aggregate and sub-base layers (minimum 12 inches)

26
Figure 6-4. Permeable Parking Strip Cross-Section
Figure 6-5. Permeable Alley Cross-Section

27
7. Operations and Maintenance
Maintenance activities for landscaped practices such as bioretention are generally similar to maintenance activities for any garden. The focus is to remove trash and monitor the health of the plants, replacing or thinning plants as needed. Over time, a natural soil horizon should develop which will assist in plant and root growth. An established plant and soil system will help in improving water quality and keeping the practice drained. The biological and physical processes over time will lengthen the facility’s life span and reduce the need for extensive maintenance.
The primary maintenance requirement for permeable pavement consists of regular inspection for clogging and vacuuming with a vacuum sweeper or equivalent.
Table 7-1 and Table 7-2 outline the recommended maintenance tasks, their associated frequencies, and other notes.
Table 7-1. Bioretention Operations and Maintenance Considerations
Task Frequency Maintenance notes Monitor infiltration and drainage
1 time/year Measure infiltration rate after construction to establish a baseline for future comparison. Inspect drainage time (< 72 hours). Recalculate infiltration rate every 2–3 years. Turning over or replacing the media (top 2–3 inches) might be necessary to improve infiltration (at least 0.5 inch/hour).
Pruning 1–2 times/year Nutrients in runoff often cause bioretention vegetation to flourish.
Mowing As needed Frequency depends on the location, plant selection, and desired aesthetic appeal.
Mulching 1–2 times/year Recommend maintaining 1–3 inches uniform mulch layer by replacement or redistributing in plant bed.
Mulch removal 1 time/2–3 years Mulch accumulation reduces available water storage volume. Removal of mulch also increases surface infiltration rate of fill soil.
Watering 1 time/2–3 days for first 1–2 months; as needed after establishment
If drought conditions exist, watering after the initial year might be required.
Fertilization 1 time initially One-time spot fertilization for first year vegetation. Remove and replace dead plants
1 time/year Within the first year, 30 percent of plants can die. Survival rates increase with time.
Inlet inspection Once after first rain of the season, then monthly during the rainy season
Check for sediment accumulation to ensure that flow into the retention area is as designed. Remove any accumulated sediment.
Outlet inspection Once after first rain of the season, then monthly during the rainy season
Check for erosion at the outlet and remove any accumulated mulch or sediment. May need to clean out the underdrain to remove any accumulated sediment and debris.
Miscellaneous upkeep 12 times/year Tasks include spot weeding, trash collection, plant health, and removing mulch from the overflow device.

28
Table 7-2. Permeable Pavement Operations and Maintenance Considerations
Task Frequency Maintenance notes Impervious to Pervious interface
Once after first rain of the season, then monthly during the rainy season
Check for sediment and debris accumulation to ensure that sediment loads are not flowing onto permeable pavement. Remove any accumulated sediment, vegetative debris, or trash. Stabilize any exposed soil.
Vacuum-assisted sweeping 2 times/year as needed or as needed to maintain infiltration rates.
Recommended times of the year include shortly after the last snowmelt, to clean up debris left from snow piles, and in the late fall after most leaves have fallen. Perform ASTM 1701 Standard Test Method for Infiltration Rate of In-Place Pervious Concrete as needed. Equipment Costs: Vacuum truck attachment (Bunyan Infiltration Restoration Device [BIRD] $7,300 - $11,200 Walk-behind vacuum sweeper $5,000 to $12,000 Vacuum-assisted street sweeper vehicle $170,000 to $220,000
Replace fill materials (applies to pervious pavers only)
1-2 times/year (and after any vacuum truck sweeping)
Fill materials will need to be replaced after each sweeping and as needed to keep voids with the paver surface.
Miscellaneous upkeep 4 times/year or as needed for aesthetics
Tasks include trash collection, sweeping, and spot weeding.
8. Green Infrastructure Practice Cost Estimates
The cost estimates for constructing the green infrastructure practices at each of the sites are found in Table 8-1 through Table 8-10. Cost information was derived from bid tabulation data published by various public agencies and compared against projects constructed in the Pittsburgh area. All cost estimates assume retrofit of the green infrastructure practices and are based on the sizing information from section 6. Retrofit costs take into account pavement removal and subsequent pavement replacement or patching. A 30 percent contingency has been added to all costs. Costs do not include engineering fees, legal fees, soil erosion control, or construction management.
Annual maintenance costs are also included in Table 8-11.
29
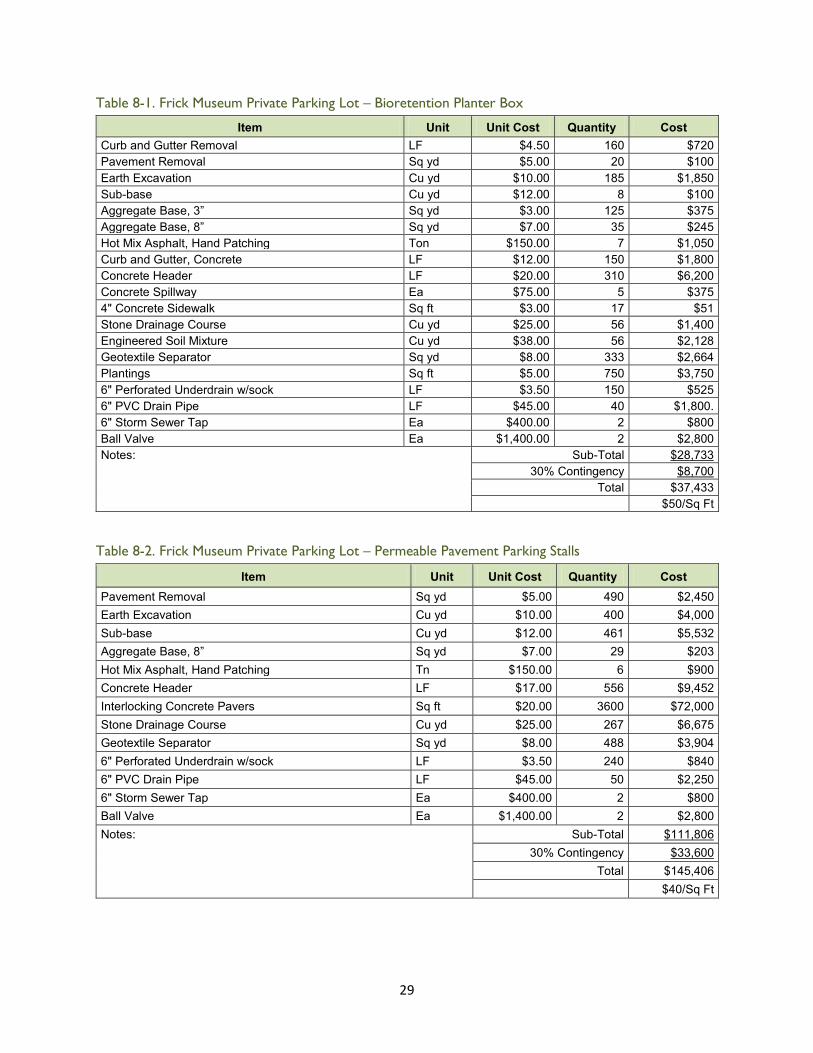
Table 8-1. Frick Museum Private Parking Lot – Bioretention Planter Box
Item Unit Unit Cost Quantity Cost Curb and Gutter Removal LF $4.50 160 $720 Pavement Removal Sq yd $5.00 20 $100 Earth Excavation Cu yd $10.00 185 $1,850 Sub-base Cu yd $12.00 8 $100 Aggregate Base, 3” Sq yd $3.00 125 $375 Aggregate Base, 8” Sq yd $7.00 35 $245 Hot Mix Asphalt, Hand Patching Ton $150.00 7 $1,050 Curb and Gutter, Concrete LF $12.00 150 $1,800 Concrete Header LF $20.00 310 $6,200 Concrete Spillway Ea $75.00 5 $375 4" Concrete Sidewalk Sq ft $3.00 17 $51 Stone Drainage Course Cu yd $25.00 56 $1,400 Engineered Soil Mixture Cu yd $38.00 56 $2,128 Geotextile Separator Sq yd $8.00 333 $2,664 Plantings Sq ft $5.00 750 $3,750 6" Perforated Underdrain w/sock LF $3.50 150 $525 6" PVC Drain Pipe LF $45.00 40 $1,800. 6" Storm Sewer Tap Ea $400.00 2 $800 Ball Valve Ea $1,400.00 2 $2,800 Notes: Sub-Total $28,733
30% Contingency $8,700 Total $37,433
$50/Sq Ft
Table 8-2. Frick Museum Private Parking Lot – Permeable Pavement Parking Stalls
Item Unit Unit Cost Quantity Cost Pavement Removal Sq yd $5.00 490 $2,450 Earth Excavation Cu yd $10.00 400 $4,000 Sub-base Cu yd $12.00 461 $5,532 Aggregate Base, 8” Sq yd $7.00 29 $203 Hot Mix Asphalt, Hand Patching Tn $150.00 6 $900 Concrete Header LF $17.00 556 $9,452 Interlocking Concrete Pavers Sq ft $20.00 3600 $72,000 Stone Drainage Course Cu yd $25.00 267 $6,675 Geotextile Separator Sq yd $8.00 488 $3,904 6" Perforated Underdrain w/sock LF $3.50 240 $840 6" PVC Drain Pipe LF $45.00 50 $2,250 6" Storm Sewer Tap Ea $400.00 2 $800 Ball Valve Ea $1,400.00 2 $2,800 Notes: Sub-Total $111,806
30% Contingency $33,600 Total $145,406
$40/Sq Ft

30
Table 8-3. S. Homewood Avenue – Curb Extension Bioretention
Item Unit Unit Cost Quantity Cost Curb and Gutter, Remove LF $4.50 50 $225 Sidewalk, Remove Sq yd $5.00 28 $140 Pavement Remove Sq yd $5.00 45 $225 Earth Excavation Cu yd $10.00 61 $608 Sub-base Cu yd $12.00 4 $45 Aggregate Base, 3” Sq yd $3.00 262 $786 Aggregate Base, 8” Sq yd $7.00 25 $175 Hot Mix Asphalt, Hand Patching Tn $150.00 5 $750 Curb and Gutter, Concrete LF $12.00 56 $672 Concrete Spillway Ea $75.00 2 $150 4" Concrete Sidewalk Sq ft $3.00 250 $750 Stone Drainage Course Cu yd $25.00 36 $889 Engineered Soil Mixture Cu yd $38.00 20 $760 Plantings Sq ft $5.00 240 $1,200 Parkway Restoration Sq yd $8.00 10 $80 6" Perforated Underdrain w/sock LF $3.50 40 $140 6" PVC Drain Pipe LF $45.00 25 $1,125 6" Storm Sewer Tap Ea $400.00 1 $400 Ball Valve Ea $1,400.00 1 $1,400 Notes: Assume 3 foot existing parkway and replacement of existing sidewalk for installation. Includes underdrain with one outlet.
Sub-Total $10,520 30% Contingency $3,156
Total $13,676 $58/Sq Ft

31
Table 8-4. S. Homewood Avenue – Traffic Island Bioretention
Item Unit Unit Cost Quantity Cost Curb and Gutter Removal LF $4.50 10 $45 Pavement Removal Sq yd $5.00 67 $335 Earth Excavation Cu yd $10.00 486 $4,860 Sub-base Cu yd $12.00 15 $177 Aggregate Base, 3” Sq yd $3.00 1 $3 Aggregate Base, 8” Sq yd $7.00 28 $196 Hot Mix Asphalt, Hand Patching Tn $150.00 6 $825 Curb and Gutter, Concrete LF $12.00 10 $120 Concrete Spillway Ea $75.00 2 $150 Concrete Encased Corrugated Metal Pipe (CMP) Slotted Trench Drain, 15" LF $100.00 60 $6,000
Stone Drainage Course Cu yd $25.00 206 $5,155 Engineered Soil Mixture Cu yd $38.00 177 $6,716 Plantings Sq ft $5.00 1590 $7,953 6" Perforated Underdrain w/sock LF $3.50 45 $158 6" PVC Drain Pipe LF $45.00 100 $4,500 6" Storm Sewer Tap Ea $400.00 2 $800 Ball Valve Ea $1,400.00 2 $2,800 Notes: Assume two underdrain outlets to catch basins. Install curb inlets where underdrain leaves to outlet. No curb removal except for underdrain outlets, all excavation within island. Trench drains to discharge to island adjacent to spillways utilizing same curb cuts.
Sub-Total $40,793
30% Contingency $12,238
Total $53,031
$33/Sq Ft
Table 8-5. Le Roi Road - Center Median Bioretention
Item Unit Unit Cost Quantity Cost Curb and Gutter, Sawcut LF $50.00 8 $400 Earth Excavation Cu yd $10.00 59 $593 Sub-base Cu yd $12.00 4 $45 Concrete Spillway Ea $75.00 2 $150 Stone Drainage Course Cu yd $25.00 15 $371 Engineered Soil Mixture Cu yd $38.00 30 $1,126 Plantings Sq ft $5.00 400.0 $2,000 Parkway Restoration Sq yd $8.00 15 $120 6" Perforated Underdrain w/sock LF $3.50 20 $70 6" Storm Sewer Tap Ea $400.00 1 $400 Ball Valve Ea $1,400.00 1 $1,400 Notes: Bioretention to be confined completely within center median. Curb heads cut for spillways. Underdrain to connect to catch basins.
Sub-Total $6,675 30% Contingency $2,100
Total $8,775 $22/Sq Ft
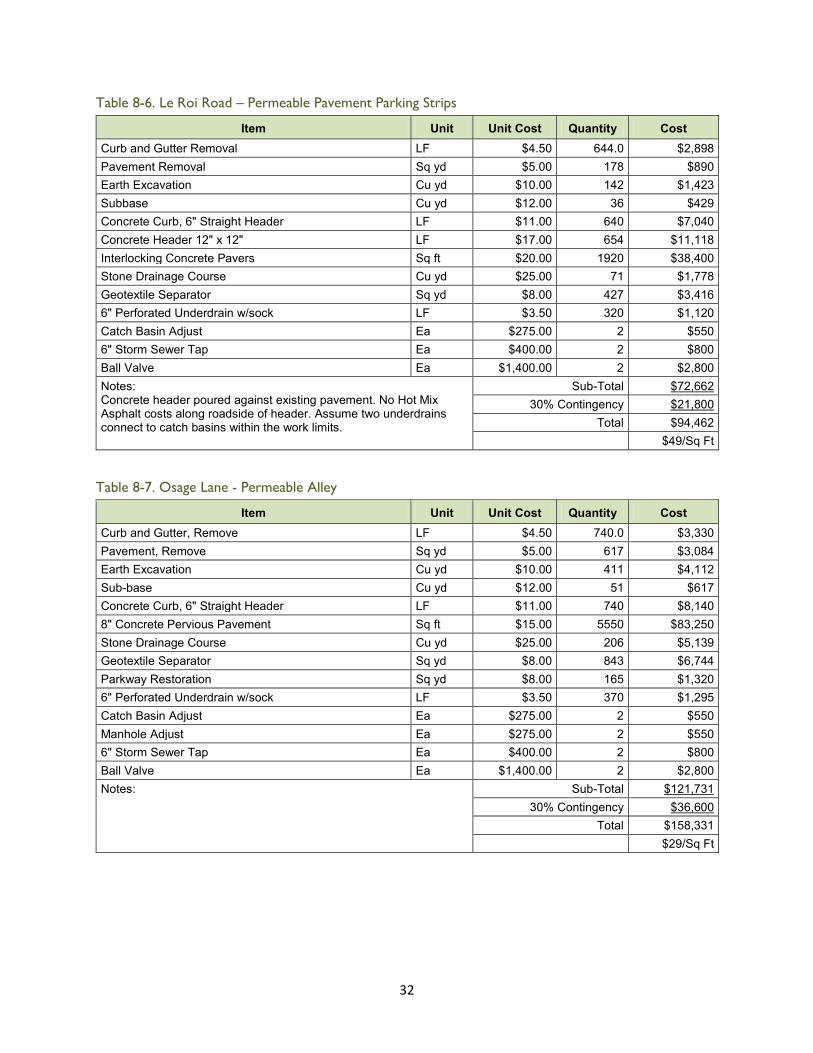
32
Table 8-6. Le Roi Road – Permeable Pavement Parking Strips
Item Unit Unit Cost Quantity Cost Curb and Gutter Removal LF $4.50 644.0 $2,898 Pavement Removal Sq yd $5.00 178 $890 Earth Excavation Cu yd $10.00 142 $1,423 Subbase Cu yd $12.00 36 $429 Concrete Curb, 6" Straight Header LF $11.00 640 $7,040 Concrete Header 12" x 12" LF $17.00 654 $11,118 Interlocking Concrete Pavers Sq ft $20.00 1920 $38,400 Stone Drainage Course Cu yd $25.00 71 $1,778 Geotextile Separator Sq yd $8.00 427 $3,416 6" Perforated Underdrain w/sock LF $3.50 320 $1,120 Catch Basin Adjust Ea $275.00 2 $550 6" Storm Sewer Tap Ea $400.00 2 $800 Ball Valve Ea $1,400.00 2 $2,800 Notes: Concrete header poured against existing pavement. No Hot Mix Asphalt costs along roadside of header. Assume two underdrains connect to catch basins within the work limits.
Sub-Total $72,662 30% Contingency $21,800
Total $94,462 $49/Sq Ft
Table 8-7. Osage Lane - Permeable Alley
Item Unit Unit Cost Quantity Cost Curb and Gutter, Remove LF $4.50 740.0 $3,330 Pavement, Remove Sq yd $5.00 617 $3,084 Earth Excavation Cu yd $10.00 411 $4,112 Sub-base Cu yd $12.00 51 $617 Concrete Curb, 6" Straight Header LF $11.00 740 $8,140 8" Concrete Pervious Pavement Sq ft $15.00 5550 $83,250 Stone Drainage Course Cu yd $25.00 206 $5,139 Geotextile Separator Sq yd $8.00 843 $6,744 Parkway Restoration Sq yd $8.00 165 $1,320 6" Perforated Underdrain w/sock LF $3.50 370 $1,295 Catch Basin Adjust Ea $275.00 2 $550 Manhole Adjust Ea $275.00 2 $550 6" Storm Sewer Tap Ea $400.00 2 $800 Ball Valve Ea $1,400.00 2 $2,800 Notes: Sub-Total $121,731
30% Contingency $36,600 Total $158,331
$29/Sq Ft

33
Table 8-8. Roycrest Place – Permeable Pavement Parking Strips
Item Unit Unit Cost Quantity Cost Curb and Gutter, Remove LF $4.50 600 $2,700 Pavement, Remove Sq yd $5.00 400 $2,000 Earth Excavation Cu yd $10.00 333 $3,334 Sub-base Cu yd $12.00 50 $600 Concrete Curb, 6" Straight Header LF $11.00 600 $6,600 Concrete Header 12" x 12" LF $17.00 600 $10,200 Interlocking Concrete Pavers Sq ft $20.00 3600 $72,000 Stone Drainage Course Cu yd $25.00 200 $5,000 Geotextile Separator Sq yd $8.00 400 $3,200 6" Perforated Underdrain w/sock LF $3.50 600 $2,100 Catch Basin Adjust Ea $275.00 4 $1,100 6" Storm Sewer Tap Ea $400.00 4 $1,600 Ball Valve Ea $1,400.00 4 $5,600 Notes: Concrete header poured against existing pavement; no Hot Mix Asphalt costs along roadside of header. Assume two underdrains connect to catch basins within the work limits.
Sub-Total $116,034 30% Contingency $34,900
Total $150,934 $42/Sq Ft
Table 8-9. Card Lane – Permeable Pavement Parking Strips
Item Unit Unit Cost Quantity Cost Curb and Gutter, Remove LF $4.50 780 $3,510 Pavement, Remove Sq yd $5.00 217 $1,085 Earth Excavation Cu yd $10.00 217 $2,167 Sub-base Cu yd $12.00 43 $522 Concrete Curb, 6" Straight Header LF $11.00 780 $8,580 Concrete Header 12" x 12" LF $17.00 796 $13,532 Interlocking Concrete Pavers Sq ft $20.00 2340 $46,800 Stone Drainage Course Cu yd $25.00 130 $3,250 Geotextile Separator Sq yd $8.00 520 $4,160 6" Perforated Underdrain w/sock LF $3.50 780 $2,730 Catch Basin Adjust Ea $275.00 4 $1,100 6" Storm Sewer Tap Ea $400.00 4 $1,600 Ball Valve Ea $1,400.00 4 $5,600 Notes: Sub-Total $94,636
30% Contingency $28,400 Total $123,036
$53/Sq Ft

34
Table 8-10. Lang Court – Permeable Pavement Parking Strips
Item Unit Unit Cost Quantity Cost Curb and Gutter, Remove LF $4.50 580.0 $2,610 Pavement, Remove Sq yd $5.00 161 $805 Earth Excavation Cu yd $10.00 193 $1,933 Sub-base Cu yd $12.00 32 $388 Concrete Curb, 6" Straight Header LF $11.00 580 $6,380 Concrete Header 12" x 12" LF $17.00 596 $10,132 Interlocking Concrete Pavers Sq ft $20.00 1740 $34,800 Stone Drainage Course Cu yd $25.00 129 $3,222 Geotextile Separator Sq yd $8.00 387 $3,096 6" Perforated Underdrain w/sock LF $3.50 580 $2,030 Catch Basin Adjust Ea $275.00 4 $1,100 6" Storm Sewer Tap Ea $400.00 4 $1,600 Ball Valve Ea $1,400.00 4 $5,600 Notes: Sub-Total $68,848
30% Contingency $20,700 Total $89,600
$55/Sq Ft
Annual routine maintenance costs were adapted from Water Environment Research Foundation (WERF) estimates to account for the scale of the green infrastructure practice (WERF 2009). Typical routine maintenance is similar to maintenance for landscaped areas, parks, or standard asphalt streets. Maintenance activities for the proposed green infrastructure practices may already be accounted for in existing budgets for current maintenance and upkeep activities.
Table 8-11. Annual Maintenance Cost Estimate
Green Infrastructure Practice Location
Description Surface Area (square feet)
Average Annual Unit Cost
(per Sq Ft/year)
Average Annual Routine
Maintenance Cost
Bioretention Frick Museum 750 $2.28 $1,700 Permeable Pavement - parking stalls Frick Museum 3,600 $0.67 $2,400
Curb-Extension Bioretention S. Homewood Ave 240 $2.28 $550 Bioretention S. Homewood Ave 2,040 $2.28 $4,700 Bioretention Le Roi Road 400 $2.28 $900 Permeable Pavement - Parking Strips Le Roi Road 1,920 $0.67 $1,300
Permeable Pavement - Alley Osage Lane 5,550 $0.67 $3,700 Permeable Pavement – Parking Strips Roycrest Place 3,600 $0.67 $2,400
Permeable Pavement - Parking Strips Card Lane 2,340 $0.67 $1,600
Permeable Pavement - Parking Strips Lang Court 1,740 $0.67 $1,200

35
9. Conclusion
Like many older communities with a combined sewer system, Pittsburgh has historically faced problems with CSOs. As part of implementing its LTCP, 3RWW sought model conceptual designs for green infrastructure practices at three typical sites within the community. These site designs would serve multiple purposes; first, as a preliminary design for a site-level project that will help reduce CSOs at the project site and second, as a template or pilot project for integrating green infrastructure practices at other sites throughout the community. The Frick Museum site is one of three selected by 3RWW for a model design and the analysis demonstrates that green infrastructure approaches such as bioretention and permeable pavement can be retrofitted into urban neighborhoods to assist in reducing CSOs.
Green infrastructure can be incorporated into stormwater strategies (particularly in retrofits) as municipalities seek to reduce CSOs by reducing stormwater inflow to combined sewer systems. In addition to meeting stormwater management goals, this conceptual design illustrates how green infrastructure can help create a more attractive and livable landscape that weaves functional natural elements into the built environment.
10. References
Kees, Gary. 2008. Using subsoiling to reduce soil compaction. Tech. Rep. 0834–2828–MTDC. Missoula, MT: U.S.
King County Department of Development & Environmental Services. 2005. Achieving the Post-Construction Soil Standard.
Pitt, R., Lantrip, J., Harrison, R. 1999. Infiltration through Disturbed Urban Soils and Compost-Amended Soil Effects on Runoff Quality and Quantity. EPA/600/X-99/XXX. National Risk Management Research Laboratory, Office of Research and Development, U. S. EPA.
Water Environment Research Foundation (WERF). 2009. User’s Guide to the BMP and LID Whole Life Cost Models. SW2R08. Version 2.0. Alexandria, VA.

APPENDIX
Site Reconnaissance Checklist and Map


