conceptual design the logical framework we would like to acknowledge the support of the project...
TRANSCRIPT

Conceptual Design The Logical Framework
We would like to acknowledge the support of the Project Management Institute and the International Institute for Learning, Inc. for permitting the
use of their intellectual property in this curriculum.

Module 2 ObjectivesBy the end of this module you will be able to:• Explain why Logical Frameworks are useful in the
development context• Develop LogFrame description statements that
reflect causal logic• Develop indicators that correspond to the LogFrame
description statements

Exercise• What experience do you have working with
Logical Frameworks? • For what purposes have you used Logical
Frameworks?

Purposes of a Logical Framework• A systematic tool –
for designing, planning, implementing, and monitoring and evaluating a project (or program).
• A tool for organizing thinking—for relating inputs to the implementation of activities, activities to the
production of outputs, outputs to the achievement of a defined purpose, and purpose to a high-level goal or impact.
• A tool for identifying and assessing risks — by listing critical assumptions inherent in project design and implementation.
• A tool for measuring project progress —through objectively verifiable indicators and means of verification. • A tool for developing consensus and communicating a
project’s intent and strategy

Causal Logic ModelingCausal Logic Modeling
– A systematic tool that visually shows, through a graphic illustration or picture, how a particular initiative occurs through logical relationships.
Project Description
Indicators Source of Verification
Assumptions
Label?
Label?
Label?
Label?

LogFrame Variations
Don’t over-focus on the language and the variations of the various LogFrame matrix models. The important lesson is to learn to think through projects using a logic model.

An Alternative LogFrame Format

The Logic of LogFrames Project
DescriptionIndicators Source of
VerificationAssumptions
Goal
Objective(s)/Outcome(s)
Deliverables/Outputs
Activities
If the OBJECTIVES are accomplished;
Then this should contribute to the overall goal
If DELIVERABLES are produced;
Then the OBJECTIVES are accomplished
If adequate RESOURCES/INPUTS are provided;
Then the ACTIVITIES can be conducted
If the ACTIVITIES are conducted;
Then RESULTS can be produced
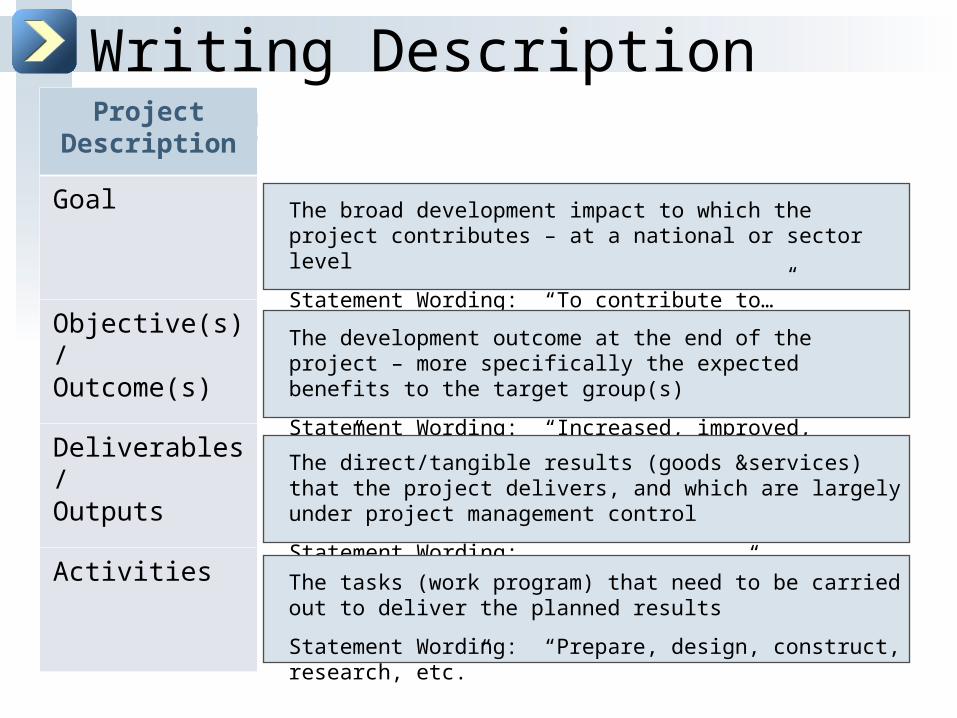
Writing Description StatemetnsProject
Description
Goal
Objective(s)/Outcome(s)
Deliverables/Outputs
Activities
The broad development impact to which the project contributes – at a national or sector level
Statement Wording: “To contribute to…”
The development outcome at the end of the project – more specifically the expected benefits to the target group(s)
Statement Wording: “Increased, improved, etc.”
The direct/tangible results (goods &services) that the project delivers, and which are largely under project management control
Statement Wording: “delivered/produced/conducted, etc.”
The tasks (work program) that need to be carried out to deliver the planned results
Statement Wording: “Prepare, design, construct, research, etc.”

Examples of Goal Statements

From Objective Tree to Logframe

Developing StatementsObjective Hierarchy
Goal To contribute to improved health, particularly of under 5s
Objective(s)/Outcome(s)
1. Improved river water quality
Deliverables/Outputs
1.1 Reduced volume of fecal waste discharged into the river system1.2 Reduced volume of household refuse directly dumped into the river system
Activities 1.1.1 Conduct baseline survey of households1.1.2 Prepare and deliver public awareness campaign1.1.3 Prepare engineering specifications for latrines and increased
sewage network.1.1.4 Etc.1.2.1 Prepare and deliver public awareness campaign1.2.2 Etc.

Developing StatementsObjective Hierarchy
Examples of How to Develop Statements
Goal To contribute to improved health, particularly of under 5s
Objective(s)/Outcome(s)
1. Improved river water quality
Deliverables/Outputs
1.1 Reduced volume of fecal waste discharged into the river system1.2 Reduced volume of household refuse directly dumped into the river system
Activities 1.1.1 Conduct baseline survey of households1.1.2 Prepare and deliver public awareness campaign1.1.3 Prepare engineering specifications for latrines and increased
sewage network.1.1.4 Etc.1.2.1 Prepare and deliver public awareness campaign1.2.2 Etc.

The Logic of LogFramesProject
DescriptionIndicators Source of
VerificationAssumptions
Goal
Objective(s)/Outcome(s)
Deliverables/Outputs
Activities
If the horizontal
logic is followed AND assumptions
hold true; Then the
project will likely
succeed.

Identifying Assumptions
Objective(s)Improved river water quality
Goal:To contribute to improved health, particularly of under 5s
Outcome 1Reduced volume of fecal waste discharged into the river system
Assumption(s)
Assumption(s)

Illustrative Assumptions partial build out
Project Description Indicators Source of Verification Assumptions
To contribute to improved health, particularly of under 5s and the general health of the river ecosystem.
Improved quality of river water.
-The Clean River legislation is introduced by the EPA and enforced--Up river water quality remains unchanged
1.1 Reduced volume of fecal waste discharged into river1.2 Reduced volume of household refuse directly dumped into the river system
-Waste water treatment meets national standards-fishing cooperatives meet obligations to establish waste collection systems
1.1.1 Conduct baseline survey of households1.1.2 Prepare and deliver public awareness campaign1.1.3 Prepare engineering specifications for latrines and expanded sewage network.1.1.4 Etc.1.2.1 Etc.
-Municipal budgets for improvements to sewage systems remain unchanged.
Go
alO
bje
ctiv
es/
Ou
tco
mes
Del
ive
rab
les/
Ou
tpu
tsA
ctiv
itie
s

Adding Indicators
Project Description
Indicators Source of Verification
Assumptions
Goal
Objective(s)/Outcomes
Deliverables/Outputs
Activities
“an instrument which gives you information” The English Language Dictionary
“A quantitative or qualitative factor or variable that provides a simple and reliable means to measure achievement, to reflect changes connected to an intervention, or to help assess the performance of a development actor” OECD/DAC (DAC Glossary of Key Terms in Evaluation, May 2002)
“a variable, which purpose it is to measure change in a phenomena or process” USAID
“a description of the project’s objectives in terms of quantity, quality, target group(s), time and place” OECD
DEFINITIONS

SMART Indicators
S Specific
M Measurable
A Achievable Or: acceptable, applicable, appropriate, attainable or agreed upon (to stress the importance of common understanding)
R Relevant Or: reliable, realistic (when achievable/attainable is not used)
T Time-bound

Direct vs. Indirect IndicatorsDirect indicatorsThese indicators directly pinpoint at the subject of interest. This is often the case with operational and more technical subjects. What the manager wants to know, can be (and generally is) measured directly.
Indirect indicators (Proxy indicators)Indirect indicators (or proxy-indicators) refer in an indirect way to the subject of interest. There can be several reasons to formulate indirect indicators:•The subject of interest cannot be measured directly. This is particularly the case for more qualitative subjects, like behavioral change, etc.;•The subject of analysis can be measured directly, but it is too sensitive to do so, for example level of income, “safe sex”, etc.;•The use of an indirect indicator can be more cost-effective than the use of a direct one. An indirect indicator may very well represent the right balance between level of reliability of information and the efforts needed to obtain the data.

Avoid Reinventing the WheelConsiderable efforts to formulate indicators are being undertaken in most of the programmatic areas of international development, relief and conservation. Some of these might be led by donors, interagency initiatives, NGOs that specialize in Monitoring and Evaluation, and within your agencies.
When developing indicators for the Delta River case, for example, the FANTA Project has a technical assistance document that focuses on impact indicators for Water and Sanitation.
http://www.fantaproject.org/downloads/pdfs/watsan.pdf

FANTA Project Indicators
Improved Hand Washing BehaviorNumber of food preparers and childcare
workers who report and demonstrate appropriate hand washing behavior
Divided ByTotal number of food preparers and child
caregivers interviewed
Food and Nutrition Technical Assistance

Source of Verification (SoV)
Project Description
Indicators Source of Verification
Assumptions
Goal
Objective(s)
Results
Activities
Discussions on the Source of Verification for indicators (where to find the information or how to collect it)often lead to:
• Reformulation of the indicator. • In the worst case that the information
referred to in the indicator cannot be obtained, the indicator becomes useless and a new one should be formulated.

Activity Indicators & SoVsProject
Description Indicators
Goal
Objective(s)/Outcome(s)
Deliverables/Outputs
Activities Activity indicators are the easiest ones to formulate and collect because they focus on implementation progress as reflected in project and partner staff work plans, project events, and corresponding budget expenditures. They answer basic questions like:•Was the Activity completed with acceptable quality? •Was it completed as planned regarding numbers and types of items purchased and distributed? •Were the meetings held? Were the numbers and gender of people in the target groups trained or otherwise involved? Activity indicators are typically measured through administrative, management, trainer, and financial tracking and record-keeping systems, supplemented with written summaries and reports.

Output Indicators & SoVsProject
DescriptionIndicators
Goal
Objective(s)/Outcome(s)
Deliverables/ Outputs
Output indicators allow project management to track what is to be delivered, when, and, most importantly, to what effect. They are generally measured in terms of immediate effects of goods and services delivered, such as: •pre/post-training scores on tests (written or verbal skills, simple assessments, etc.)•creation of certain structures, documents, systems (kilometers of roads or number of schools rehabilitated)•and so on.
Activities
Questions Answered: “How will we know if the deliverables have been delivered?” Include appropriate details about quantity, quality and time.

Objectives Indicators & SoVsProject
DescriptionIndicators
Goal
Objective(s)/Outcome(s)
• Objectives indicators focus on demonstrable evidence of a behavioral change, such as adoption or uptake, coverage or reach of Outputs.
• Objectives indicators normally can only be collected by the project itself – because they are specific to behavioral changes in response to interventions by/in the specific project and its action area. Secondary sources rarely exist at this level. Tracking Objectives indicators begins as soon as Results have begun being delivered and have had a reasonable amount of time to take effect.
• Start with “light” monitoring. Then do more, or more targeted monitoring depending on your findings.
Deliverables/ Outputs
Activities
Questions Answered: “How will we know if the Objective(s) have been delivered?” Include appropriate details about quantity, quality and time.

Goal Indicators & SoVsProject
DescriptionIndicators
Goal Many organizations do not require that the Project Manager measure impact of the project against the goal – asserting that Project managers generally have no direct influence over the contribution the project makes to the overall objective, and can only be expected to monitor the broader policy and program environment to help ensure the project continues to be contextually relevant.
Performance indicator statements and associated data are drawn from appropriate, already-existing sources such as Amnesty International, FAO, Freedom House, IFPRI, Transparency International, World Bank, UN, national government reports, etc.
Objective(s)/Outcome(s)
Deliverables/ Outputs
Activities

A LogFrame Matrix Example partial build out
Project Description Indicators Source of Verification Assumptions
To contribute to improved health, particularly of under 5s and the general health of the river ecosystem.
Incidence of water-borne diseases reduced by 30% by 2012, specifically among low income families who live by the river.
Municipal hospital and clinic records collected by mobile health teams.
Improved quality of river water.
Concentration of e. coli reduced by 20% (compared to levels in 2003) and meets national health and sanitation standards by 2012.
Monthly water quality surveys conducted by the EPA and the River Authority.
-The Clean River legislation is introduced by the EPA and enforced--Up river water quality remains unchanged
1.1 Reduced volume of fecal waste discharged into river1.2 Reduced volume of household refuse directly dumped into the river system
1.1 60% of household fecal waste is disposed of via latrines or sewage connections.1.2 …
1.1 Annual sample survey conducted by municipality between 2009 and 2012.1.2
-Waste water treatment meets national standards-fishing cooperatives meet obligations to establish waste collection systems
1.1.1 Conduct baseline survey of households1.1.2 Prepare and deliver public awareness campaign1.1.3 Prepare engineering specifications for latrines and expanded sewage network.1.1.4 Etc.1.2.1 Etc.
1.1.1 Baseline data (Knowledge Practice Coverage) for household waste management exists1.1.2 Schedule of visits of mobile teams completed1.1.3 Engineering plans approved by Ministry of Public WorksEtc.
1.1.1 6 month progress report1.1.2 Extension team progress reports1.1.3 Approved project charter from the Ministry of Public WorksEtc.
-Municipal budgets for improvements to sewage systems remain unchanged.
Go
alO
bje
ctiv
es/
Ou
tco
mes
Del
ive
rab
les/
Ou
tpu
tsA
ctiv
itie
s