conceptual design of a single-aisle turboelectric
TRANSCRIPT

Conceptual Design of a Single-Aisle
Turboelectric Commercial Transport with Fuselage
Boundary Layer Ingestion
Jason R. Welstead∗
NASA Langley Research Center, Hampton, VA 23681, United States of America
and James L. Felder†
NASA Glenn Research Center, Cleveland, OH 44145, United States of America
A single-aisle commercial transport concept with a turboelectric propulsion system ar-chitecture was developed assuming entry into service in 2035 and compared to a similartechnology conventional configuration. The turboelectric architecture consisted of two un-derwing turbofans with generators extracting power from the fan shaft and sending it to arear fuselage, axisymmetric, boundary layer ingesting fan. Results indicate that the turbo-electric concept has an economic mission fuel burn reduction of 7%, and a design missionfuel burn reduction of 12% compared to the conventional configuration. An exploration ofthe design space was performed to better understand how the turboelectric architecturechanges the design space, and system sensitivities were run to determine the sensitivity ofthrust specific fuel consumption at top of climb and propulsion system weight to the motorpower, fan pressure ratio, and electrical transmission efficiency of the aft boundary layeringesting fan.
Nomenclature
CL = lift coefficientCp = pressure coefficientD = DragHPC = high pressure compressorHPT = high pressure turbineL = liftLPC = low pressure compressorLPT = low pressure turbineM̄ = mass-averaged Mach numberMN = Mach numberN+3 = third generation concept with expected entry into service near 2035Nc = corrected fan speedP̄t = mass-averaged total pressurePt = total pressurepsia = pounds per square inch absoluteRTO = rolling takeoffT4 = turbine inlet total temperatureTSFC = thrust specific fuel consumptionW = mass flow rate
∗Aerospace Engineer, ASAB, NASA Langley Research Center, 1 N Dryden St. M/S 442, Hampton, VA 23681, MemberAIAA.†Aerospace Engineer, LTA, NASA Glenn Research Center, 21000 Brookpark Rd, Cleveland, OH 44145
1 of 17
American Institute of Aeronautics and Astronautics

I. Introduction
Emerging technologies are resulting in a potential paradigm shift in how future commercial transportaircraft are designed. The current production tube-and-wing aircraft with underwing engines have been
the norm since the introduction of the Boeing 707 in the late 1950’s,1 but with technology advancementsin composites and electric components, such as batteries and motors, that trend is changing. NASA’sAdvanced Air Transport Technology (AATT) project, previously the Fixed-Wing project, and SubsonicFixed Wing project prior to that, has the long term goal of drastically reducing fuel burn, emissions, andnoise beyond the current yearly incremental improvements. Advanced, efficient electrical components withhigh power densities could lead to a bifurcation point where highly efficient design concepts divert fromhistorical trends.
A technology that could lead to a drastic shift in aircraft design is the turboelectric propulsion ar-chitecture. In this architecture, hydrocarbon fuel-burning turbomachinery is coupled to a generator thatdistributes power to propulsors positioned to provide synergistic propulsion-airframe integration (PAI). Allpower comes from the fuel and is not provided by any on board energy storage devices, such as batteries.This turboelectric distributed propulsion (TeDP) architecture decouples the power producing componentsfrom the thrust producing components allowing the two to be widely separated, with each operating at peakefficiency conditions rather than a compromise between the two, increasing the overall thermal efficiency.This architecture opens the door for completely new system architectures never before possible.
A detrimental effect that must be modeled is the efficiency loss due to the power conversion from me-chanical to electrical, transmission of electrical power, and the conversion from electrical power back tomechanical power. However, this system architecture enables technologies to help overcome the efficiencylosses. Examples include distributed fans, which increases the effective bypass ratio while reducing fan pres-sure ratio (FPR), and boundary layer ingestion (BLI), which increases the overall vehicle efficiency througha propulsive efficiency increase and reduced vehicle wake dissipation.
A single-aisle turboelectric aircraft with an aft boundary layer propulsor (STARC-ABL) was developedas a possible concept that takes minimal advantage of the turboelectric architecture and the ability todistribute the power. The concept is a tube-and-wing configuration with two underwing mounted turbofans.Attached to each turbofan is a generator that extracts mechanical power from the fan shaft and converts itto electrical power. Electrical wires send it to a rear mounted boundary layer ingesting, electrically poweredfan. The STARC-ABL concept was developed as a first look at the turboelectric propulsion architecturefor a single-aisle class commercial transport, and to determine if a benefit exists for a mostly conventionalconfiguration with moderate distribution of propulsion power, or if all the system benefits are lost due toelectrical system losses and can only be overcome with a fully distributed propulsion system.
The STARC-ABL concept was sized for a mission similar to current day Boeing 737-800 or Airbus A320configurations. The concept mission definition, performance requirements, and a description of the STARC-ABL concept are given in Section II, along with a relevant advanced technology tube-and-wing conventionalconcept similar to the Boeing Refined SUGAR (Subsonic Ultra Green Aircraft Research) concept.2–7 Theturboelectric propulsion architecture and modeling is described in Section III. Finally, results and discussionfollow in Section IV concerning the impact of the turboelectric architecture on the design space and anexploration of system sensitivities.
II. Concept Descriptions and Modeling
Two single-aisle commercial transport concepts were developed assuming an entry into service in the 2035timeframe (N+3), a baseline N+3 conventional configuration (N3CC) and a turboelectric concept (STARC-ABL). Both concepts utilized technologies that were assumed to be at technology readiness level (TRL8) 6by the year 2025, mission profiles that use advanced air traffic management, and were similar in wing-bodyconfiguration with two underwing propulsors. Key differences between the concepts were the turboelectricarchitecture, the rear fuselage BLI fan employed by the STARC-ABL concept, and the T-tail empennageresulting from the rear fuselage fan placement. Having the greatest commonality between the concepts wasdetermined to be the best way to evaluate the impact of the turboelectric propulsion system architecturewith a rear fuselage BLI fan.
2 of 17
American Institute of Aeronautics and Astronautics

A. Mission Definition and Performance Requirements
The mission definition and performance requirements for the STARC-ABL and N3CC were based uponthe Refined SUGAR concept developed by Boeing.2,3 As a concept similar in passenger count and technologyassumptions, the Refined SUGAR was a natural choice in selecting comparable performance requirementsand a reference mission.
The mission used to size the baseline configuration and the turboelectric concept assumes advancementsin air traffic management that allow for more optimized flight trajectories with less time spent performingground operations. The mission profile shown in Fig. 1 was created to provide a mission similar to theRefined SUGAR N+3 mission profile.3 The mission profile had an optimized climb segment not subject toairspeed constraints, a cruise climb segment that allowed the vehicle to fly at the optimal altitude for specificrange, and an optimized descent. Taxi in and taxi out operations time were reduced to 4 minutes. Thereserve mission was also modified to account for future operations. The flight fuel allowance was droppedfrom 5% to 3%, and the hold time was reduced from 30 minutes to 10 minutes. The 200 nm alternate airportdistance remained unchanged.
The design mission for both the N3CC and STARC-ABL concepts was 3,500 nm at a fixed-cruise Mach of0.70 operating at an optimal altitude to maximize specific range. While 3,500 nautical miles was the requireddesign mission range, the configurations were sized to minimize the economic mission (900 nm) block fuel.The takeoff field length requirement was less than 8,190 feet, a distance calculated as the greater of thebalanced field length or 115% of the field length to clear a 35 foot obstacle with all engines operating. Thistakeoff field length requirement was matched to the Refined SUGAR requirement.3 The propulsion systemwas required to have sufficient thrust to meet the second segment climb and missed approach gradients inthe event of a single engine failure, and have adequate thrust to meet the initial cruise altitude capability(ICAC) requirement, meaning that the vehicle was capable of climbing higher than the optimal startingcruise altitude subject to a 300 foot per minute minimum rate of climb requirement. The landing fieldlength requirement was the same as the takeoff field length (8,190 ft), and the approach velocity was limitedto 140 knots.
Taxi
Out
(4 m
in)
Take
off (
2 m
in)
Opt
imiz
ed C
limb
Cru
ise
Clim
b
Opt
imiz
ed D
esce
nt
Appr
oach
/Lan
d (4
min
)
Taxi
In (4
min
)
3% F
light
Fue
l Allo
wan
ce
Mis
sed
Appr
oach
(2 m
in)
Opt
imiz
ed C
limb
Opt
imiz
ed C
ruis
e
Opt
imiz
ed D
esce
nt
Appr
oach
/Lan
d (4
min
)
10 m
in h
old
@ 1
,500
ft
Mission Reserve
Figure 1: Mission profile for N+3 concepts as modeled in FLOPS.
B. N+3 Conventional Configuration (N3CC) Baseline
A model similar to the Boeing Refined SUGAR was developed using in-house tools including Open VehicleSketch Pad (OpenVSP)9,10 for modeling the geometry and calculating wetted areas, a horizontal and verticaltail sizing routine based upon wing and fuselage geometry,11 and the Flight Optimization System (FLOPS)for mission analysis and performance.12 The Refined SUGAR-like model was developed using data fromRefs. 2–7, and had an engine model developed by Georgia Tech based upon the gFan+. High level data forthe gFan+ is described in Ref. 6. The Refined SUGAR was a single-aisle advanced tube-and-wing conceptdesigned to carry 154 passengers in a two class seating arrangement, cruise at Mach 0.70 with a range of
3 of 17
American Institute of Aeronautics and Astronautics

3,500 nm, and an overall geometry similar to the current day 737-800. The Refined SUGAR concept wasdesigned for entry into services (EIS) in the 2035 timeframe and had numerous advanced technologies toreduce fuel burn, noise, and emissions. Advanced technologies included fuselage riblets for reduced viscousdrag, advanced airfoils with laminar flow, a moderately high aspect ratio wing as the Refined SUGARwas span constrained to the current 737-800 span, advanced composite materials, and NextGen air trafficmanagement (ATM) allowing optimized flight profiles. A complete list of technologies can be found in Ref. 2.
A complete, self-consistent dataset was not available for the Refined SUGAR as the concept evolvedthroughout the development. As such, a model was pieced together using published data, and any unknownparameters were filled with assumed values and then tweaked to help tune the model to the published data.
The aircraft geometry was modeled in OpenVSP and FLOPS using data tables and the three-viewdrawing from the SUGAR Phase I final report.3 Any unknown geometry inputs were estimated usingvalues from an in-house 737-800like FLOPS model. FLOPS internal weight estimation routines were used tocalculate an initial component weight for all the subsystems, and then calibration factors were used to tunethe FLOPS component weights to the SUGAR Phase I “as-drawn” weight statement.2,3 The aerodynamicswere estimated using FLOPS internal routine originally based upon the Empirical Drag Technique (EDET).13
Aerodynamic data for a single condition was available for the “as-drawn” Phase I design at Mach 0.74, analtitude of 38,408 feet, and a lift coefficient of 0.675. Technology factors were included in the FLOPSaerodynamics inputs to account for the 7% fuselage drag reduction due to riblets, and 50% laminar flow onthe upper surface of the wing.
The original engine model used in the Refined SUGAR-like model was based upon the gFan+ engineand developed at Georgia Tech, but the full lineage of the engine model was unknown. To alleviate thisuncertainty in the engine model and to use a consistent engine model between the conventional configurationand the turboelectric configuration, an N+3 engine model was developed in the Numerical Propulsion SystemSimulation (NPSS)a using publicly available data to provide similar performance to the gFan+. Using thesame engine model for both concepts eliminates discrepancies in system performance resulting from differingengine models, while eliminating the uncertainty in the model lineage. The N+3 engine model will bedescribed in greater detail in Section III. With a new engine model, the baseline configuration was sized byvarying wing area and sea level static (SLS) thrust, becoming the N+3 Conventional Configuration (N3CC).A comparison of the Refined SUGAR concept data to the NASA Refined SUGAR-like and N3CC models isgiven in Table 1.
Table 1: Comparison of the sized N+3 conventional configuration to published data.
Parameter Units Refined NASA Refined N+3 Conventional
SUGAR5 SUGAR-like Configuration
TOGW lb 132,100 132,630 129,260
OEW lb 75,300 76,000 73,690
Wing Area ft2 1,420 1,390 1,220
Thrust (total, SLS) lb 38,600 37,680 41,020
Optimal CL - 0.595 0.66 0.59
L/D @ Opt. CL - 22.3 22.1 21.3
Mid Cruise TSFC lb/hr/lb 0.451 0.452 0.438
900 nm Block Fuel/Seat lb/seat 42.34 41.72 39.53
C. STARC-ABL Concept
The STARC-ABL concept was derived from the N3CC configuration with key differences being theturboelectric propulsion architecture coupled with resized turbofans to meet system thrust requirements,an axisymmetric rear fuselage BLI fan (aft-fan), a T-tail to accommodate the aft-fan, and a resized wingto meet the mission and performance requirements. Figure 2 shows the STARC-ABL concept as modeledin the parametric geometry tool, OpenVSP. Wing area and thrust were varied to size the STARC-ABLconcept, subject to the performance requirement discussed previously, with minimizing economic block fuel
ahttp://www.swri.org/npss/default.htm
4 of 17
American Institute of Aeronautics and Astronautics

burn being the objective for the Design Explorer optimizer in ModelCenter®b, a multidisciplinary analysisframework.
Figure 2: STARC-ABL isometric view as modeledin OpenVSP. Key features include the rear fuse-lage BLI fan, the T-tail empennage, and the re-duced size turbofans allowed by the turboelectricpropulsion system.
The STARC-ABL concept utilizes the turboelectricpropulsion architecture in a minimalist way; only partialdistribution of power was utilized in the concept withthe twin turbofans still providing a significant amountof thrust, 80% during takeoff and 55% at the top of climb(TOC) condition. The turboelectric architecture enablesthe decoupling of the power producing elements from thethrust producing elements giving the potential for distri-bution of the propulsors. This concept allowed for theimplementation of the turboelectric architecture with-out the added system complexity of a fully distributedpropulsion system, which would include numerous addi-tional electrical system components, motors, and fans.Instead, this simplified implementation of the turboelec-tric architecture in the STARC-ABL concept enableda first glance analysis to determine if any performancebenefits exist without fully distributed propulsion.
Several simplifying assumptions were made to elimi-nate the necessity for higher order tools that would dras-tically increase the analysis time. The emphasis of this effort was to take a first look at the concept to de-termine if any potential benefits exist using a turboelectric architecture with moderately distributed power.No detailed aerodynamic shaping of the rear fuselage and fuselage fan nacelle was performed. A nominalshape was developed in OpenVSP and the wetted areas were calculated for the viscous drag calculation inFLOPS. The surface area covered by the rear fuselage nacelle was subtracted from the surface area addedby the external portion of the nacelle, resulting in a net wetted area increase. The surface area inside thenacelle was accounted for in the propulsion system model.
An important consideration for a turboelectric architecture is the thermal management and heat rejectionsystems as they reduce the system total efficiency. The losses due to the thermal management system (TMS)were ignored as there was no conceptual level way to estimate the thermal management system requirements.A rough order of magnitude weight estimate was included to capture the weight penalty based on the specificpower (kW thermal/kg) of the TMS for a high power electrical system used in a “more electric” aircraft,but the power requirements of a thermal management system were not modeled. Modeling of the thermalmanagement system would require significant tool development and was beyond the scope of this work.
A conventional electrical system was assumed to avoid dependence on a complex cryogenic cooling systemto achieve any sort of system benefit. As such, a set of conservative component electrical efficiencies werechosen resulting in a total electrical system efficiency of 90%, accounting for all the losses between the turbinegenerator and the aft-fan. The aft-fan was designed to operate at a constant 3500 horsepower at high throttlesettings, and the motor horsepower was reduced at low throttle settings due to operational constraints of thelow pressure compressor (LPC) in the turbofan core. This simplified throttling schedule for the aft-fan maynot be the optimal throttling for this configuration, but the constant power setting was chosen to reduce thenumber of design variables in the propulsion architecture. A more complex throttling scheme may provideincreased system benefits.
As mentioned previously, no higher-order tools such as computation fluid dynamics (CFD) were usedin the analysis of the N3CC or STARC-ABL concepts. Given that the STARC-ABL concept has a rearfuselage BLI fan, a method for capturing the boundary layer effects without a viscous CFD analysis of theaircraft fuselage and tail cone, with the aft BLI fan included in the flow field, had to be developed. Twoviscous CFD solutions for the aft region of a modified Boeing fuselage6 were readily available and were usedto generate the boundary layer profiles, one at takeoff and one at top of climb. This boundary layer datawas normalized in such a way as to allow it to be used at other flight conditions, giving an initial estimateof the boundary layer at different axial locations along the tail cone without further CFD analysis. Thisdrastically simplified the analysis and allowed for rapid exploration of the design space, but implies that theaccuracy of this analysis relies heavily upon the validity of the Boeing CFD solution. The CFD solution and
bhttp://www.phoenix-int.com/modelcenter/integrate.php
5 of 17
American Institute of Aeronautics and Astronautics

boundary layer profiles are explained in greater detail in Section III.
III. Propulsion System Architecture and Modeling
The Georgia Tech implementation of the GE hFan engine7 was used for creating a model of the tur-boelectric propulsion system, and the turbofan component of the model was used in both the N3CC andSTARC-ABL. This removed any potential modeling discrepancies and differing assumptions associated withtwo separate turbofan models. The hFan engine was used on the hybrid electric Boeing SUGAR Volt aircraft,and contained the same technology assumptions as the gFan+ (a model of which was also created by GeorgiaTech). The Georgia Tech model of the hFan was modified to replace the motor with a generator. The aft-fanpropulsor was located on the tail cone of the aircraft such that the nozzle exit plane extends slightly past thetip of the bare tail cone. Figure 3 shows the cross sections for the turbofan engine with generator (genFan)and the motor driven aft BLI propulsor (aft-fan). The cross section of the genFan was not redrawn and soserves only as illustration of a potential configuration. The aft-fan cross section was calculated by NPSS andWATE++ (Weight Analysis of Turbine Engines)14 from the speeds, pressures, temperatures and flow ratesobtained from the thermodynamic cycle of the aft-fan, also modeled by NPSS.
Generator 62”
111"
24”
90"
81"
(a) Turbofan configuration with aft generator pulling powerfrom the fan shaft.
Generator 62”
111"
24”
90"
81"
(b) Electric motor driven aft-fan located at the tip of the air-craft tail cone.
Figure 3: Conceptual drawings of the turbofan and rear fuselage propulsor for the turboelectric propulsionsystem.
The diameter of the inner surface of the flow passages in the aft-fan was set to equal the diameter of thebare tail cone of the baseline aircraft. The axial location of the inlet was determined by the computed lengthof the entire propulsor. This was critical because the flow conditions of the boundary layer vary with the axiallocation, especially as the flow nears the tip of the tail cone. As such the thermodynamic performance andthe flow path computation were tightly coupled. The key design pressure ratios, temperatures, efficiencies,specific powers and specific weights for the genFan and aft-fan are listed in Table 2.
Table 2: Design assumption for the propulsion system architecture using assumptions based upon the publicdomain version of the Georgia Tech GE hFan.7
Turbofan Pressure Ratio or Efficiency Electrical/TMS Specific Power or Efficiency
Component Total Temperature Component Specific Weight
Fan 1.45 93.9% Generator 8 hp/lb 96.0%
LPC 1.45 92.0% Motor 8 hp/lb 96.0%
HPC 27.9 90.6% Inverter 10 hp/lb 98.0%
HPT 2800 °R 92.5% Cable 3.9 kg/m 99.6%
LPT 1690 °R 94.1% Circuit Protection 33kg/MW -
Tail Cone Fan 1.25 95.7% TMS 0.68 kW/kg -
Central to the analysis of any boundary layer ingesting propulsion system is an accurate representation
6 of 17
American Institute of Aeronautics and Astronautics
of the boundary layer velocity and total pressure profiles at the inlet of the BLI propulsion system. The flowregime in the tail cone region is especially complex due to the effects of diffusion of the airstream into thetail cone region being superimposed on the viscous boundary layer coming from the cylindrical section of thefuselage. This interaction makes it difficult if not impossible to determine an equivalent flat plate distancesuch that flat-plate boundary layer estimation methods can be used.
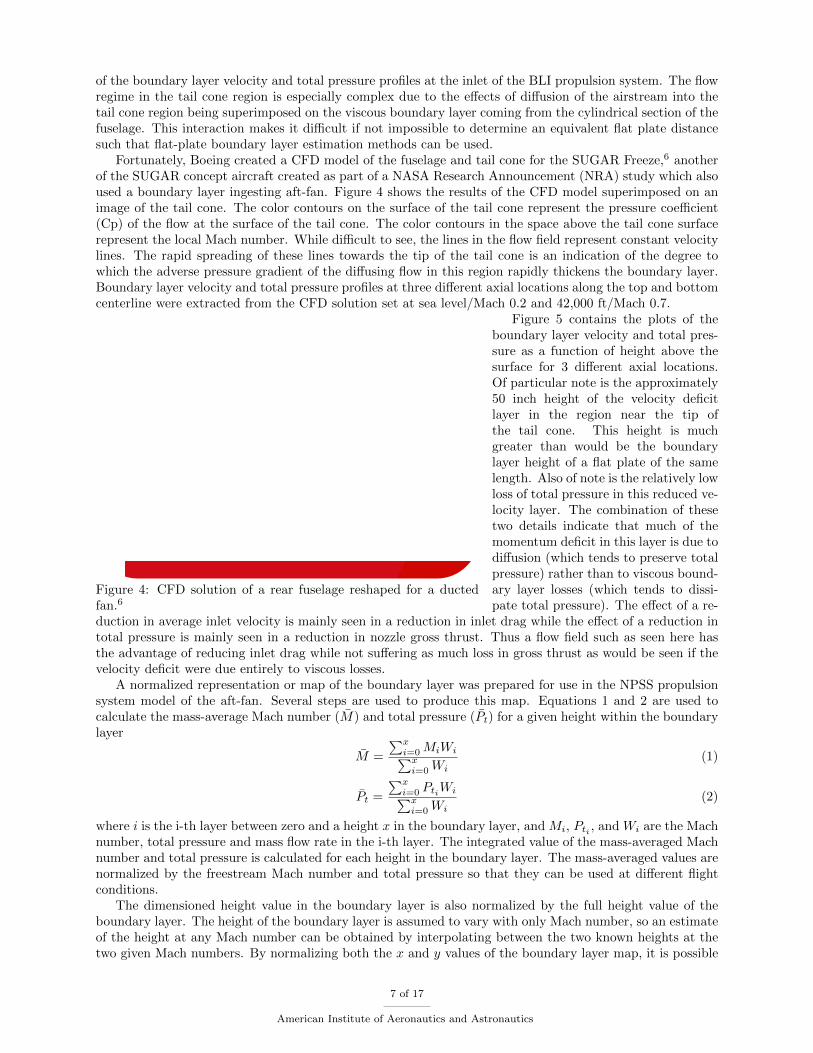
Fortunately, Boeing created a CFD model of the fuselage and tail cone for the SUGAR Freeze,6 anotherof the SUGAR concept aircraft created as part of a NASA Research Announcement (NRA) study which alsoused a boundary layer ingesting aft-fan. Figure 4 shows the results of the CFD model superimposed on animage of the tail cone. The color contours on the surface of the tail cone represent the pressure coefficient(Cp) of the flow at the surface of the tail cone. The color contours in the space above the tail cone surfacerepresent the local Mach number. While difficult to see, the lines in the flow field represent constant velocitylines. The rapid spreading of these lines towards the tip of the tail cone is an indication of the degree towhich the adverse pressure gradient of the diffusing flow in this region rapidly thickens the boundary layer.Boundary layer velocity and total pressure profiles at three different axial locations along the top and bottomcenterline were extracted from the CFD solution set at sea level/Mach 0.2 and 42,000 ft/Mach 0.7.
Figure 4: CFD solution of a rear fuselage reshaped for a ductedfan.6
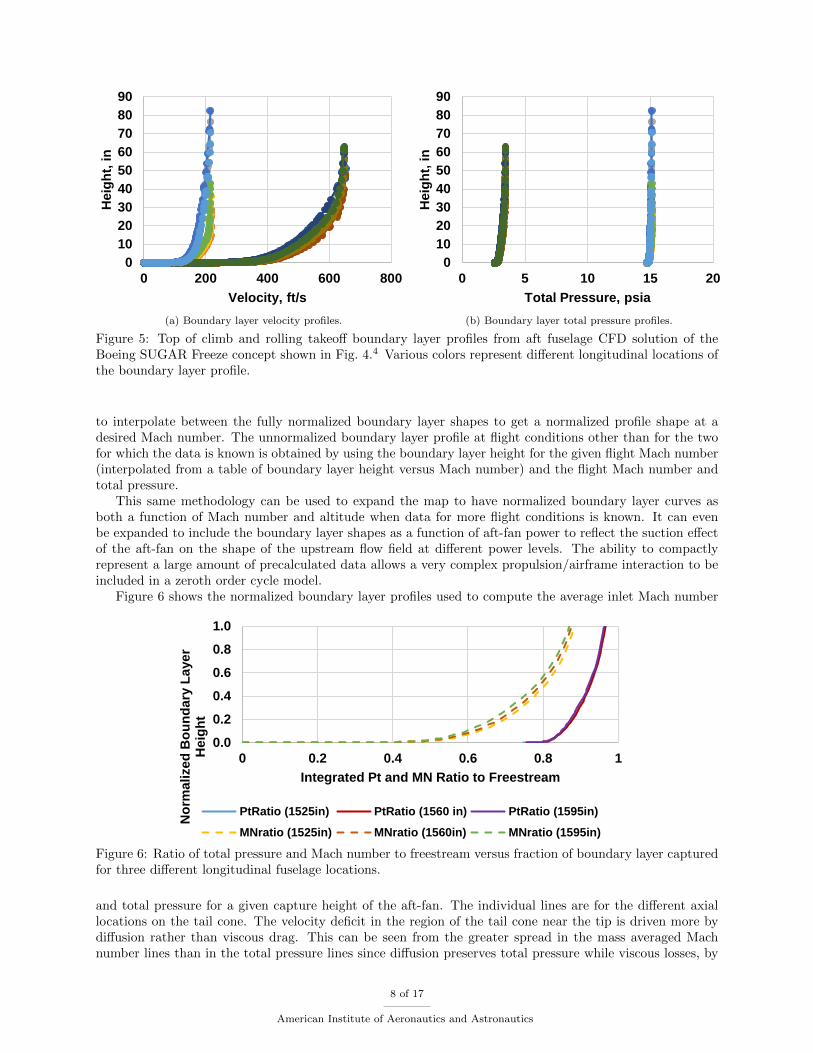
Figure 5 contains the plots of theboundary layer velocity and total pres-sure as a function of height above thesurface for 3 different axial locations.Of particular note is the approximately50 inch height of the velocity deficitlayer in the region near the tip ofthe tail cone. This height is muchgreater than would be the boundarylayer height of a flat plate of the samelength. Also of note is the relatively lowloss of total pressure in this reduced ve-locity layer. The combination of thesetwo details indicate that much of themomentum deficit in this layer is due todiffusion (which tends to preserve totalpressure) rather than to viscous bound-ary layer losses (which tends to dissi-pate total pressure). The effect of a re-
duction in average inlet velocity is mainly seen in a reduction in inlet drag while the effect of a reduction intotal pressure is mainly seen in a reduction in nozzle gross thrust. Thus a flow field such as seen here hasthe advantage of reducing inlet drag while not suffering as much loss in gross thrust as would be seen if thevelocity deficit were due entirely to viscous losses.
A normalized representation or map of the boundary layer was prepared for use in the NPSS propulsionsystem model of the aft-fan. Several steps are used to produce this map. Equations 1 and 2 are used tocalculate the mass-average Mach number (M̄) and total pressure (P̄t) for a given height within the boundarylayer
M̄ =
∑xi=0 MiWi∑xi=0 Wi
(1)
P̄t =
∑xi=0 PtiWi∑xi=0 Wi
(2)
where i is the i-th layer between zero and a height x in the boundary layer, and Mi, Pti , and Wi are the Machnumber, total pressure and mass flow rate in the i-th layer. The integrated value of the mass-averaged Machnumber and total pressure is calculated for each height in the boundary layer. The mass-averaged values arenormalized by the freestream Mach number and total pressure so that they can be used at different flightconditions.
The dimensioned height value in the boundary layer is also normalized by the full height value of theboundary layer. The height of the boundary layer is assumed to vary with only Mach number, so an estimateof the height at any Mach number can be obtained by interpolating between the two known heights at thetwo given Mach numbers. By normalizing both the x and y values of the boundary layer map, it is possible
7 of 17
American Institute of Aeronautics and Astronautics
0102030405060708090
0 200 400 600 800
Hei
ght,
in
Velocity, ft/s
0102030405060708090
0 5 10 15 20
Hei
ght,
in
Total Pressure, psia(a) Boundary layer velocity profiles.
0102030405060708090
0 200 400 600 800
Hei
ght,
in
Velocity, ft/s
0102030405060708090
0 5 10 15 20
Hei
ght,
in
Total Pressure, psia(b) Boundary layer total pressure profiles.
Figure 5: Top of climb and rolling takeoff boundary layer profiles from aft fuselage CFD solution of theBoeing SUGAR Freeze concept shown in Fig. 4.4 Various colors represent different longitudinal locations ofthe boundary layer profile.
to interpolate between the fully normalized boundary layer shapes to get a normalized profile shape at adesired Mach number. The unnormalized boundary layer profile at flight conditions other than for the twofor which the data is known is obtained by using the boundary layer height for the given flight Mach number(interpolated from a table of boundary layer height versus Mach number) and the flight Mach number andtotal pressure.
This same methodology can be used to expand the map to have normalized boundary layer curves asboth a function of Mach number and altitude when data for more flight conditions is known. It can evenbe expanded to include the boundary layer shapes as a function of aft-fan power to reflect the suction effectof the aft-fan on the shape of the upstream flow field at different power levels. The ability to compactlyrepresent a large amount of precalculated data allows a very complex propulsion/airframe interaction to beincluded in a zeroth order cycle model.
Figure 6 shows the normalized boundary layer profiles used to compute the average inlet Mach number
0.0
0.2
0.4
0.6
0.8
1.0
0 0.2 0.4 0.6 0.8 1
Nor
mal
ized
Bou
ndar
y La
yer
Hei
ght
Integrated Pt and MN Ratio to Freestream
PtRatio (1525in) PtRatio (1560 in) PtRatio (1595in)
MNratio (1525in) MNratio (1560in) MNratio (1595in)
0.0
0.2
0.4
0.6
0.8
1.0
0.0 0.2 0.4 0.6 0.8 1.0Frac
tion
of B
ound
ary
Laye
r Ca
ptur
ed
Fraction of Total Momentum Deficit Captured
Baseline System
Figure 6: Ratio of total pressure and Mach number to freestream versus fraction of boundary layer capturedfor three different longitudinal fuselage locations.
and total pressure for a given capture height of the aft-fan. The individual lines are for the different axiallocations on the tail cone. The velocity deficit in the region of the tail cone near the tip is driven more bydiffusion rather than viscous drag. This can be seen from the greater spread in the mass averaged Machnumber lines than in the total pressure lines since diffusion preserves total pressure while viscous losses, by
8 of 17
American Institute of Aeronautics and Astronautics

definition, do not.The difference between the average velocity for a given capture height in Fig. 6 and the freestream velocity
represents the momentum deficit for the flow up to that height. As more of the boundary layer is captured,more of the total momentum deficit is captured. Figure 7 plots the fraction of the total momentum capturedas a function of the fraction of the boundary layer captured. Since the velocity curve in the boundary layer
follows a(1/7)th
order power curve, the momentum capture versus boundary layer capture curve is obviouslyvery nonlinear. The result is that the momentum deficit in the bottom 10% of the boundary layer is muchlarger than in the top 10% of the boundary layer. From Fig. 7 it can be seen that capturing 20% of theboundary layer captures 40% of the total momentum deficit. Capturing an additional 20% of the boundarylayer only captures an additional 25% of the momentum deficit.
0.0
0.2
0.4
0.6
0.8
1.0
0 0.2 0.4 0.6 0.8 1
Frac
tion
of B
ound
ary
Laye
r C
aptu
red
Integrated Pt and MN Ratio to Freestream
PtRatio (1525in) PtRatio (1560 in) PtRatio (1595in)
MNratio (1525in) MNratio (1560in) MNratio (1595in)
0.0
0.2
0.4
0.6
0.8
1.0
0.0 0.2 0.4 0.6 0.8 1.0Frac
tion
of B
ound
ary
Laye
r Ca
ptur
ed
Fraction of Total Momentum Deficit Captured
Baseline System
Figure 7: Fraction of momentum deficit captured by the rear BLI fan versus fraction of boundary layercaptured. Arrows on graph show the baseline system with less than 50% of the boundary layer capturedcorresponds to over 70% of the momentum deficit captured.
For a given fan pressure ratio, the shaft power to the fan, and hence motor power, increases with increasingboundary layer capture. A power of 3500 horsepower was selected for this study as the maximum power thatcould be reasonably extracted from the turbofan engines. This amount of power was sufficient to capture45% of the total boundary layer height. However, this was sufficient to capture 70% of the total momentumdeficit. Capturing the entire boundary layer would require considerably more power, which might not beworth the extra weight and losses in the electrical system to capture, assuming that the turbofan enginescould direct more power away from the fans and to the generators. In fact it is likely that there is anoptimum fraction of the boundary layer to capture that is less than 100%.
With a reasonable estimate of the boundary layer shape in hand, an NPSS model that contained boththe underwing engines and the aft-fan was created. A summary of the resulting design is given in Table 3and compared to the baseline turbofan performance. This model was sized to meet or exceed the thrustrequired by the aircraft at the top of climb (TOC) and rolling takeoff (RTO) flight condition. The TOC flightcondition is 37,574 ft at a Mach number of 0.7 and ISA standard day with total vehicle thrust required of6797 lb. The RTO condition is sea level at a Mach number of 0.2153 and ISA hot day (+27 °R) with a totalvehicle thrust required of 28,342 lb. The motor driving the aft-fan was assumed to have a continuous ratedpower of 3500 horsepower in the baseline configuration. The combination of all the individual componentefficiencies in the electrical power transmission system gives a fan turbine shaft to aft-fan shaft efficiencyof 90.4%. As a result, the generator size was set at 1935 horsepower each or 3870 horsepower total. Thetotal propulsion system was sized at the TOC condition such that the aft-fan was running at 100% correctedspeed at input power of 3500 horsepower. The underwing generator turbofans (genFans) were then sized toprovide the remaining thrust required while also driving the generators. The result is that thrust from theindividual genFan is only 2030 lb at TOC as compared to the 3400 lb required of each baseline turbofanon the N3CC. Thus, the diameter of the fan as well as nacelle of the genFans is smaller. However, the coreairflow rate is not substantially different due to the need for the fan turbine to generate nearly the sametotal shaft power. The model was executed off-design to make sure that the required RTO thrust was metor exceeded. If the thrust produced at the RTO was less than the required value, the design thrust at the
9 of 17
American Institute of Aeronautics and Astronautics

Table 3: Propulsion system performance for both the baseline and turboelectric systems. The thrust andhorsepower values for the baseline and generator/turbofans are the total of both turbofans. Propulsionsystem thrust requirements for sizing were TOC thrust = 6,800 lb, and RTO thrust = 28,340 lb.
Baseline Generator BLI Tail Cone STARC-ABL
Turbofans Turbofans Propulsor System
units TOC RTO TOC RTO TOC RTO TOC RTO
Thrust lb 6,800 34,920 4,060 22,780 3,210 5,560 7,260 28,350
TSFC lb/hr/lb 0.4410 0.2922 - - - - 0.3875 0.3032
Thrust/HP lb/hp 0.64 0.99 0.60 0.86 0.92 1.60 0.72 0.96
OPR - 58.0 51.0 58.0 49.6 1.25 1.08 - -
BPR - 11.3 11.9 6.4 6.9 - - 14.4 13.3
FPR - 1.45 1.39 1.45 1.49 1.25 1.08 - -
%Nc - 100% 93.2% 100% 100% 100% 62.1% - -
LPT Power hp 5,960 19,490 4,940 14,840 - - - -
Fan Power hp 5,320 17,705 3,005 12,900 3,500 3,500 - -
Generator/Motor hp - - 3,870 3,870 3,500 3,500 - -
TOC point was increased until the RTO thrust was sufficient. For the 3500 horsepower baseline motor size,the thrust lapse rate of the total system is such that the RTO thrust is the more constraining and so theTOC design thrust had to be increased to 7260 lb, 463 lb more than the required thrust.
The power management scheme used to determine the maximum system thrust was to match the genFanto the design fan percent corrected speed with constraints on maximum turbine inlet temperature (T4) whilethe aft-fan was run at a constant 3500 horsepower, regardless of altitude or speed. Running the aft-fan at3500 horsepower resulted in 100% corrected fan speed for the aft-fan at the TOC sizing point, but only 62%at the RTO point. This was because the power required to run the fan at a given corrected speed increasedconsiderably as the altitude decreased and air density increased. To run the aft-fan at the same correctedspeed at the RTO point as the TOC point would require a considerably larger and thus heavier electricalpower system. However, as a result of operating the aft-fan at a constant shaft power, the percentage of thethrust from the genFans increased from about 56% of the total at the TOC point to 80% at the RTO points.This is likely why the RTO thrust ended up being the more constraining of the two required thrust values.
At part power the propulsion system was matched to a fraction of the genFan fan max power correctedspeed and a percentage the aft-fan motor rated power. Due to the effects of boundary layer ingestion theamount of thrust per shaft hp is higher in the aft-fan than it is in the genFans, about 0.92 lb/hp versus 0.67lb/hp. In order to keep as much of the part power thrust coming from the more efficient thrust source foras long as possible, the aft-fan motor power was maintained at the maximum while the thrust of the overallsystem was reduced. The limiting factor is that as the fuel flow is reduced in the genFans while the generatorpower remains constant, the low pressure compressor (LPC) is driven towards stall. Once a minimum LPCstall margin was reached, the power to the aft-fan was reduced in order to stay at that minimum stall margin.
Table 4 presents a summary of the size and weight of the baseline turbofan in the N3CC and the non-electrical portions of the turboelectric aft BLI fan system in the STARC-ABL. Table 5 details the designassumptions for specific power, efficiency, and size for the electrical system of the STARC-ABL system, theresulting weights of the major components, and the total weight of the electrical system. Table 6 gives thetotal propulsion system weight. The most startling result is that the total system weight of the turboelectricsystem (two genFans, one aft BLI fan, electrical system and TMS) is actually less than the weight of thebaseline turbofan system (two baseline turbofans). This is not as impossible as it might seem at first glance.While the electrical propulsion system adds 2930 lb to the system and the non-electrical portions of theaft BLI fan add another 2070 lb for a total of 5000 lb not present in a conventional turbofan system, thecombined weight of the two genFans without the generators is 8460 lb less than the two base turbofans. Thisis due mostly to the fact that the size of the turbofan fans is reduced from 70 to 52 inches in diameter. Alsothe nacelle and thrust reverser for the genFans are smaller and lighter. The result is that the total systemweight is 3460 lb lighter.
10 of 17
American Institute of Aeronautics and Astronautics

Table 4: Non-electric propulsion system component sizes and weights.
Component Baseline Turbofan Generator/Turbofan BLI Propulsor
Fan Diameter 70 in 52 in 81 in
Nacelle Max Diameter 78 in 58 in 90 in
Nacelle Length 156 in 115 in 111 in
Bare Engine Weight 4,460 lb 2,510 lb 1,370 lb
Nacelle Weight 3,910 lb 1,630 lb 700 lb
Total Pod Weight 8,370 lb 4,140 lb 2,070 lb
Table 5: Electric system sizing and weight estimates.
Component Assumption Efficiency Size Weight
Electric Motor 8 hp/lb 96.0% 3,500 hp 440 lb
Inverter 10 hp/lb 98.0% 3,500 hp 350 lb
Generator (2) 8 hp/lb 96.0% 2 @ 1,137 hp 480 lb
Cable (2×93’) 3.85 kg/m 99.6% 1.44 MW 480 lb
750V/1926 amps
Circuit Protection 0.5*Cable Weight - - 240 lb
TMS 0.68 kW/kg - 279 kW 910 lb
Total System - - - 2,930 lb
Table 6: Total propulsion system weight.
Subsystem Baseline STARC-ABL
Turbofan Propulsion System
Non-electrical 16,750 lb 10,370 lb
Electrical - 1,990
TMS - 910 lb
Total 16,750 lb 13,270 lb
A much more detailed examination of the weightof the turbofan engines in the two systems will have tobe done before it is known whether the total propulsionsystem weight is in fact less than the baseline turbofansand if so whether it is to this degree or not. A GeorgiaTech correlation based weight estimation method wasused to estimate the weight of both the baseline tur-bofan and the genFan turbofan.15 Future analysis willuse the WATE++14 detailed weight and flow path esti-mating tools built into NPSS to give a more analyticalestimate of the STARC-ABL propulsion system weightas well as the baseline turbofan system weight. Regardless, however, of whether the total system weight isindeed over 3000 lb lighter, is roughly the same, or is actually heavier than the baseline turbofan system,the primary takeaway is that the aft BLI fan system is not simply adding weight to the baseline turbofan.There are parts of the propulsion system which become lighter as a result of adding an aft BLI fan to thepropulsion system. The final system weight will then depend on the balance between the changes that addweight to the system with those that remove weight from the system. What is certain is that the final systemweight will be less than what it would be if the electrical system and the aft BLI fan were simply added tothe baseline turbofan weight.
The above analysis is based on both propulsion systems being designed to the same thrust requirements.When the vehicle is re-optimized around the lower fuel weight that results from the better fuel efficiency ofthe aft BLI fan propulsion system, the takeoff gross weight (TOGW) will likely be less than the baselinesystem leading to a lower required thrust. A lower required thrust means that the entire propulsion systemsize and thus weight is reduced. So even if the thrust to weight of the aft BLI fan is less than the baselineturbofan, the propulsion system weight of an optimized STARC-ABL aircraft system could still end up lessthan that of the baseline system.
11 of 17
American Institute of Aeronautics and Astronautics

Table 7: Comparison of the sized N3CC and STARC-ABL concepts.
Parameter Units N3CC STARC-ABL % Change
TOGW lb 129,260 133,370 3.2%
OEW lb 73,690 80,480 9.2%
Wing Area ft2 1,220 1,680 37.7%
Thrust (total, SLS) lb 41,020 35,280 -14.0%
AR - 11.02 8.29 -24.8%
SOC CL - 0.59 0.45 -23.7%
L/D @ SOC CL - 21.4 22.3 4.2%
SOC TSFC lb/hr/lb 0.437 0.373 -14.6%
900 nm Block Fuel/seat lb/seat 39.53 36.86 -6.8%
3500 nm Block Fuel lb 22,050 19,350 -12.2%
IV. Results and Discussion
Table 7 compares the sized STARC-ABL concept to the N3CC concept. The first item of note is thesignificant TSFC improvement and fuel burn reduction on both the economic mission and design missionranges. The turboelectric propulsion architecture resulted in nearly a 15% improvement in TSFC at thestart of cruise condition. This translates into 7% and 12% block fuel burn savings for the economic anddesign missions, respectively. This was despite an OEW and TOGW increase from the N3CC configurationdue to the larger wing and empennage surfaces. The SLS thrust of the engines were able to be reduceddue to the addition of the rear fuselage BLI fan, an extremely efficient thrust producing device due to theingested boundary layer and the lack of power lapse with altitude.
A key benefit that was captured in this analysis was the reduced turbofan size and weight. This resultedfrom the lack of power lapse as a function of altitude in the electric motor, and the increase in propulsiveefficiency of the aft-fan allowing the underwing turbofans to be downsized. As the fan diameter was decreased,the turbofan system weights, including the nacelle, decreased dramatically. This reduction in turbofan weightoffsets the additional component weights for the turboelectric system, resulting in a net propulsion systemweight reduction. As noted in the previous discussion of the weight savings of the STARC-ABL propulsionsystem, more detailed analysis is necessary before concluding that the turboelectric system is conclusivelylighter. The decrease in turbofan size also provided a wetted area reduction for the nacelle, which resultedin an additional viscous drag benefit.
Not all of the potential benefits of the STARC-ABL concept were captured in the analysis. One benefit ofBLI not captured in this analysis is a reduction in total wake dissipation. Although only a secondary effectwhen compared to the propulsive efficiency increase due to BLI,16 inclusion of this effect would improvethe overall system fuel burn benefit. As mentioned previously, no aerodynamic shaping of rear fuselage andnacelle was performed. It is possible that the fuselage shape leading toward the rear nacelle, and the nacelleouter mold line, could be shaped to provide a static pressure field that would result in a forward axial force,or thrust. Finally, an electrical rather than mechanical connection of the turbine and aft-fan, combined withthe ability of electrical machines to independently vary the torque and speed, allows the motor and generatorto shift the operating line of the genFan fan, LPC, LPT, and the aft-fan. Also, the ratio of the genFan fanshaft speed to the aft-fan shaft speed can be varied during operation allowing each system to operate atits own optimal operating point. This has the potential to allow increase turbomachinery efficiency andoperability at off-design conditions. It is believed that these unmodeled benefits would offset (whether fullyor not is unknown) the system penalties associated with a thermal management system, maintaining a totalsystem fuel burn benefit for the STARC-ABL concept.
A. Design Space Exploration
The STARC-ABL and N3CC concepts were similar in gross weight, approximately 4,000 pounds differ-ence, but their wing geometries are quite different. Reviewing Table 7, the wing area of the STARC-ABL issignificantly larger than the N3CC at 1,680 square feet compared to 1,220 square feet. The increase in wing
12 of 17
American Institute of Aeronautics and Astronautics

24
23
22
21
20
19
18
16
17Thru
st, p
er e
ngin
e lb
(103 )
1100
1200
1300
1400
1500
1600
1700
1800
1900
2000
Wing Area, ft2
Eco
nom
ic B
lock
Fue
l, lb
(102 )
63
62
61
60
59
58
57
56
55
54
1100
1200
1300
1400
1500
1600
1700
1800
1900
2000
Wing Area, ft2
Eco
nom
ic B
lock
Fue
l, lb
(102 )
100
95
90
85
80
75
70
65
60
24
23
22
21
20
19
18
16
17Thru
st, p
er e
ngin
e lb
(103 )
(a) N3CC design space.
24
23
22
21
20
19
18
16
17Thru
st, p
er e
ngin
e lb
(103 )
1100
1200
1300
1400
1500
1600
1700
1800
1900
2000
Wing Area, ft2
Eco
nom
ic B
lock
Fue
l, lb
(102 )
63
62
61
60
59
58
57
56
55
54
1100
1200
1300
1400
1500
1600
1700
1800
1900
2000
Wing Area, ft2
Eco
nom
ic B
lock
Fue
l, lb
(102 )
100
95
90
85
80
75
70
65
60
24
23
22
21
20
19
18
16
17Thru
st, p
er e
ngin
e lb
(103 )
(b) STARC-ADL design space.
Figure 8: Design space of the N3CC (Fig. 8a) and the STARC-ABL (Fig. 8b) with the contours showing theeconomic mission block fuel burn as functions of wing area and static thrust. The optimized configurationshighlighted are by the star. Constraints lines include the balance field length (red), approach velocity (black),initial cruise altitude capability (orange), and second segment climb thrust requirement (blue).
area resulted in an aspect ratio decrease for the STARC-ABL due to the imposed span constraint. Through-out the development of the STARC-ABL concept, several optimizations were run using Design Explorer thatconsistently resulted in a wing area increase. Design Explorer is an excellent optimizer that is capable offinding an optimum solution in a noisy and discontinuous design space. However, due to the methods usedin the Design Explorer optimizer it is difficult to perceive design space shape. As such, it was desired togain better insight as to why the addition of the turboelectric propulsion architecture consistently causedthe STARC-ABL wing area to increase nearly 40%.
To visualize the design space, a matrix of 1500 designs were run for both the N3CC and STARC-ABLconcepts varying wing area from 1100 to 2000 square feet and sea level static thrust per engine from 16,000to 24,000 pounds. Figure 8 shows the result of this design space exploration. The contour plots weregenerated using a large data visualization software called Rave,17 a tool developed in the Aerospace SystemsDesign Laboratory at Georgia Techc. Clearly shown in Fig. 8 is the drastically different color contour shapeindicating the economic mission block fuel burn. The yellow star on each of the plots shows the optimizedresult from the Design Explorer optimizer. Four constraint lines are drawn in Fig. 8a and Fig. 8b showing theminimum performance requirements of FAR Part 25 takeoff field length (red, must be less than 8,190 feet),second segment climb performance (blue, must have sufficient thrust to maintain the minimum requiredgradient with a single engine), approach velocity (black, must be less than 140 knots), and ICAC (orange,must have sufficient thrust to climb higher than the optimal starting cruise altitude). Each data point inthe contour plots was discrete, and therefore it should be noted that the constraint lines are representativeand have been smoothed for clarity (the one exception being the ICAC constraint line in Fig. 8a).
It is clear that changing from the conventional propulsion system of the N3CC concept to the turboelectricpropulsion system of the STARC-ABL drastically changes the shape of the design space. The shape of theeconomic block fuel burn contours changes from being equally sensitive to thrust and wing area (Fig. 8a)to being mostly sensitive to SLS thrust (Fig. 8b). The other major design space change was the relief ofthe ICAC constraint, which allowed the required SLS thrust to be decreased providing a significant fuelburn benefit. For the N3CC, approach velocity, ICAC, and takeoff field length were all active constraints onthe design, whereas for the STARC-ABL only takeoff field length was active with the contours driving theoptimal design location on the curve in the thrust/wing area designs space.
chttp://www.rave.gatech.edu/index.shtml
13 of 17
American Institute of Aeronautics and Astronautics
B. System Sensitivities
A nominal turboelectric architecture was designed using a set of conservative simplifying assumptions.The simplifying assumptions were made to enable a rapid analysis of the STARC-ABL concept, and toprovide a set of baseline assumptions for component N+3 technology advancements. Due to the uncertaintyin some of the technology assumptions, it was desired to know the sensitivity of the predicted performance tothese assumptions. An understanding of the system performance to the assumptions also provides guidancefor future technology development.
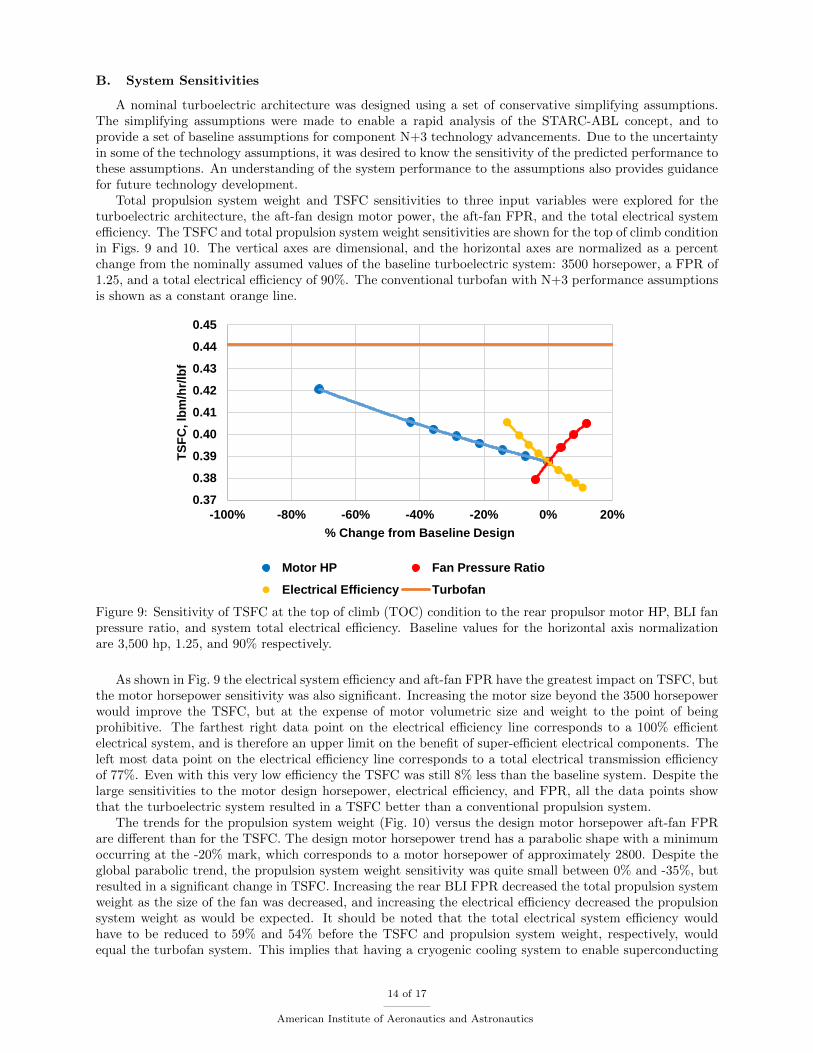
Total propulsion system weight and TSFC sensitivities to three input variables were explored for theturboelectric architecture, the aft-fan design motor power, the aft-fan FPR, and the total electrical systemefficiency. The TSFC and total propulsion system weight sensitivities are shown for the top of climb conditionin Figs. 9 and 10. The vertical axes are dimensional, and the horizontal axes are normalized as a percentchange from the nominally assumed values of the baseline turboelectric system: 3500 horsepower, a FPR of1.25, and a total electrical efficiency of 90%. The conventional turbofan with N+3 performance assumptionsis shown as a constant orange line.
0.37
0.38
0.39
0.40
0.41
0.42
0.43
0.44
0.45
-100% -80% -60% -40% -20% 0% 20%
TSFC
, lbm
/hr/l
bf
% Change from Baseline Design
Motor HP Fan Pressure Ratio
Electrical Efficiency Turbofan
Figure 9: Sensitivity of TSFC at the top of climb (TOC) condition to the rear propulsor motor HP, BLI fanpressure ratio, and system total electrical efficiency. Baseline values for the horizontal axis normalizationare 3,500 hp, 1.25, and 90% respectively.
As shown in Fig. 9 the electrical system efficiency and aft-fan FPR have the greatest impact on TSFC, butthe motor horsepower sensitivity was also significant. Increasing the motor size beyond the 3500 horsepowerwould improve the TSFC, but at the expense of motor volumetric size and weight to the point of beingprohibitive. The farthest right data point on the electrical efficiency line corresponds to a 100% efficientelectrical system, and is therefore an upper limit on the benefit of super-efficient electrical components. Theleft most data point on the electrical efficiency line corresponds to a total electrical transmission efficiencyof 77%. Even with this very low efficiency the TSFC was still 8% less than the baseline system. Despite thelarge sensitivities to the motor design horsepower, electrical efficiency, and FPR, all the data points showthat the turboelectric system resulted in a TSFC better than a conventional propulsion system.
The trends for the propulsion system weight (Fig. 10) versus the design motor horsepower aft-fan FPRare different than for the TSFC. The design motor horsepower trend has a parabolic shape with a minimumoccurring at the -20% mark, which corresponds to a motor horsepower of approximately 2800. Despite theglobal parabolic trend, the propulsion system weight sensitivity was quite small between 0% and -35%, butresulted in a significant change in TSFC. Increasing the rear BLI FPR decreased the total propulsion systemweight as the size of the fan was decreased, and increasing the electrical efficiency decreased the propulsionsystem weight as would be expected. It should be noted that the total electrical system efficiency wouldhave to be reduced to 59% and 54% before the TSFC and propulsion system weight, respectively, wouldequal the turbofan system. This implies that having a cryogenic cooling system to enable superconducting
14 of 17
American Institute of Aeronautics and Astronautics

electrical components is unnecessary for the success of the STARC-ABL concept.
10000
11000
12000
13000
14000
15000
16000
17000
18000
-100% -80% -60% -40% -20% 0% 20%
Wei
ght,
lb
% Change from Baseline Design
Motor HP Fan Pressure Ratio
Electrical Efficiency Turbofan
Figure 10: Sensitivity of the total propulsion system weight to design motor horsepower, rear BLI fanpressure ratio, and total electrical system efficiency. Baseline values for the horizontal axis normalizationare 3,500 hp, 1.25, and 90% respectively.
V. Conclusions
An N+3 single-aisle class commercial transport concept was developed that employs a turboelectricpropulsion system architecture. The propulsion system architecture consists of two underwing turbofanswith generators extracting power from the fan shaft and transmitting it to a rear fuselage, axisymmetricboundary layer ingesting fan. The single-aisle turboelectric aircraft with an aft boundary layer propulsor(STARC-ABL) represents one of the most basic uses of the turboelectric architecture, but was a solid startingpoint to gain understanding on how the turboelectric architecture changes the design space. For a point ofcomparison, an N+3 conventional configuration (N3CC) model was also developed to be representative of a737-800like aircraft in the 2035 timeframe.
Results indicate that a significant fuel burn benefit can be obtained with the turboelectric architectureusing conservative technology assumptions, especially conventional electrical components with moderateefficiencies. The STARC-ABL has a 7% block fuel burn reduction for the economic mission, and 12% blockfuel burn reduction for the design mission. Key sources of this benefit are the increase in propulsion systemefficiency from the rear fuselage BLI fan that ingests only a portion of the boundary layer, and the downsizingof the underwing turbofans, which helps offset the weight of the additional turboelectric system components.
A matrix of thrust and wing area inputs were analyzed to visualize the design space and gain insight asto how the turboelectric propulsion system changes the shape of the design space. From this visualizationit became clear that the economic block fuel contours changed from being equally sensitive to thrust andwing area for the N3CC to the STARC-ABL mostly being sensitive to thrust. The ICAC constraint was alsoalleviated in the STARC-ABL concept allowing the economic block fuel contours and takeoff field lengthrequirements to drive the optimal design.
Finally, a sensitivity analysis was run to better understand the relationship of the system benefits tosome of the turboelectric system design assumptions, and to indicate the technology levels required to makethe STARC-ABL concept viable, providing a technology development road map. It was found that TSFCwas sensitive to the selected aft-fan motor horsepower, aft-fan FPR, and total electrical system efficiency,but all designs explored still had a TSFC better than the conventional N+3 turbofan. The total propulsionsystem weight was also found to be sensitive to FPR and the electrical system efficiency, but was fairlyinsensitive to rear motor horsepower over a broad range of horsepower (from 2275 to 3500 horsepower).The propulsion system weights do contain some uncertainty due to the modeling methods used and require
15 of 17
American Institute of Aeronautics and Astronautics

additional scrutiny, but the trend of the turbofan weight reduction offsetting some or all of the turboelectriccomponents should remain.
Overall, this research has shown that the STARC-ABL concept may be a good first candidate for aturboelectric propulsion system architecture that provides significant fuel burn benefits when compared toa similar technology conventional configuration.
Acknowledgments
This work was completed with support from the Systems Analysis and Integration group under theAdvanced Air Transport Technology (AATT) project in the Advanced Air Vehicles Program. The authorswould like to thank Bill Haller (NASA Glenn Research Center), Mark Guynn (NASA Langley ResearchCenter), and Chris Droney (Boeing Research and Technology) for their support of this research.
References
1 “707/720 Commercial Transport: Historical Snapshot,” 2015, http://www.boeing.com/history/
products/707.page.
2 Bradley, M. K., Droney, C. K., Paisley, D., Roth, B., Gowda, S., and Kirby, M., “SUGAR Phase 1Final Review,” April 2010, http://aviationweek.typepad.com/files/boeing_sugar_phase_i_final_review_v5.pdf.
3 Bradley, M. K. and Droney, C. K., “Subsonic Ultra Green Aircraft Research: Phase I Final Report,”Contractor Report NASA/CR-2011-216847, NASA Langley Research Center, Hampton, VA, April 2011.
4 Bradley, M. K. and Droney, C. K., “Subsonic Ultra Green Aircraft Research: Phase II: N+4 AdvancedConcept Development,” Contractor Report NASA/CR-2012-217556, NASA Langley Research Center,Hampton, VA, May 2012.
5 Bradley, M. K., Droney, C. K., and Allen, T., “Boeing N+3 SUGAR: Final Update Presentation,” (Un-published).
6 Bradley, M. K., Droney, C. K., and Allen, T. J., “Subsonic Ultra Green Aircraft Research Phase II: TrussBraced Wing Design Exploration,” Contractor Report NASA/CR-2015-218704/Volume I, NASA LangleyResearch Center, Hampton, VA, April 2015.
7 Bradley, M. K. and Droney, C. K., “Subsonic Ultra Green Aircraft Research Phase II: Hybrid ElectricDesign Exploration,” Contractor Report NASA/CR-2015-218704/Volume II, NASA Langley ResearchCenter, Hampton, VA, April 2015.
8 NASA Procedural Requirements 7123.1B, NASA Systems Engineering Processes and Requirements, Ap-pendix J: Technology Readiness Levels, April 2013.
9 Hahn, A. S., “Vehicle Sketch Pad: A Parametric Geometry Modeler for Conceptual Aircraft Design,”48th AIAA Aerospace Sciences Meeting , American Insittue of Aeronautics and Astronautics, Orlando,FL, 2010, pp. 1 – 11, AIAA-2010-0657.
10 Hahn, A. S., “Vehicle Sketch Pad Aircraft Modeling Strategies,” 61st AIAA Aerospace Sciences Meeting ,American Insittue of Aeronautics and Astronautics, Grapevine, TX, 2013, pp. 1 – 9, AIAA-2013-0331.
11 Morris, J. and Ashford, D., “Fuselage Configuration Studies,” SAE Technical Paper 670370, Society ofAutomotive Engineers, 1967.
12 McCullers, L., “Aircraft Configuration Optimization Including Optimized Flight Profiles,” Tech. Rep.NASA CP-2327, NASA, 1984.
13 Feagin, R. C. and Morrison, W. D., “Delta Method, An Empirical Drag Buildup Technique,” ContractorReport NASA/CR-151971, Lockheed-California Co., Burbank, CA, December 1978.
16 of 17
American Institute of Aeronautics and Astronautics
14 Tong, M. and Naylor, B., “An Object-Oriented Computer Code for Aircraft Engine Weight Estimation,”Tech. Rep. NASA/TM-2009-215656, NASA Glenn Research Center, 2009.
15 Welge, H. R. et al., “N+2 Supersonic Concept Development and Systems Integration,” Contractor ReportNASA/CR-2010-216842, NASA Langley Research Center, Hampton, VA, August 2010.
16 Uranga, A., Drela, M., and Greitzer, E., “Power Balance Assessment of BLI Benefits for Civil Aircraft,”SciTech 2015, January 2015, (Oral Presentation).
17 Daskilewicz, M. J. and German, B. J., “RAVE: A Graphically Driven Framework for Agile Design-DecisionSupport,” 13th AIAA/ISSMO Multidisciplinary Analysis Optimization Conference, American Institue ofAeronautics and Astronautics, Fort Worth, TX, 2010, AIAA-2012-3993.
17 of 17
American Institute of Aeronautics and Astronautics