“concepts and theories of gis in business”...
TRANSCRIPT
1
“CONCEPTS AND THEORIES OF GIS IN BUSINESS”
Peter Keenan Dept of Management Information Systems UCD Business Schools University College Dublin Belfield, Dublin 4 Ireland. Tel +353 1 716-4727 Fax +353 1 716-4783 Email : [email protected]
2
CONCEPTS AND THEORIES OF GIS IN BUSINESS
Abstract This chapter looks at the concepts and theories underlying the application of GIS in business. It discusses the role of information technology in business generally and how GIS is related to other business systems. Different views of GIS use are introduced and the chapter suggests that decision support applications of GIS are more relevant to most businesses than purely operational applications. Porter’s value chain approach is used to assess the potential of GIS to contribute to management. GIS is seen as an emerging technology that will increase importance in business in the future.
INTRODUCTION
Introduction
Information technology (IT) has had a powerful impact on the business world in the last fifty
years. IT has facilitated the transformation of business and has allowed new business forms
to come into existence. This transformation has reflected the potential of IT both as a cost
saving mechanism and as a tool for supporting business decision-making. New developments
such as the Internet and mobile applications have an important ongoing impact on business,
continuing the process of transformation started by the punched card fifty years earlier.
Geographic Information Systems (GISs) are an area of IT application with a significantly
different history from other types of information system. GIS based applications are now
becoming widespread in business, playing a role that reflects both the similarity of GIS to
other forms of IT and the distinct characteristics of spatial applications.
Origins of Geographic and Business use of IT
Business use of information technology started in the 1950’s in payroll, billing and invoice
processing applications. These applications exploited data processing techniques that had
been previously used by government agencies such as the US Census Bureau. GIS has its
origins in the use of IT for geographic related activities in North America in the same period.
These early applications were typically government orientated, such as transport planning in

3
Detroit and Chicago and the Canada Geographic Information System (CGIS) (Coppock &
Rhind, 1991).
Early business applications of IT employed relatively simple processing that could be
automated using the comparatively crude computer technology of the period. One example
was payroll processing, where only four or five simple calculations were required for each
individual. This computerization of simple numeric processing was an automation of clerical
work, analogous to the automation of manufacturing in the earlier part of the twentieth
century. The high cost of computing in this period meant that this type of application was
mainly confined to large organizations with a high volume of transactions. While these early
data processing applications were relatively unsophisticated, they had a significant impact as
they concerned activities critical to business. Data processing techniques allowed these
critical operations to be performed faster, more accurately and above all more cheaply than
manual methods. Despite the relatively high cost of computing at this time, significant cost
reductions could be achieved by this automation of the clerical processes required for the
day-to-day operation of all businesses. Consequently, early business applications of IT had a
widespread impact on routine accounting operations, but were initially much less important
in other departments of the organization. In a similar way, the early applications of
geographic computer processing were only of interest to the small number of companies
involved in map-making, surveying or similar geography based activities. For example, in the
oil industry GIS had a role in exploration at an early stage, but would not have been used in
marketing in this sector until much more recently. Many early private sector organizations
provided consultancy services or GIS software to the public sector. One example would be
Tomlinson Associates set up in 1977 in Ottawa, Canada by Roger Tomlinson, one of the

4
pioneers of GIS. Another example of an early GIS commercial organization would be the
Environmental Systems Research Institute established in 1969. This later became ESRI,
which is now the main player in the GIS software market.
Development of IT towards decision applications
As IT became more capable and less expensive, business use of computing moved from the
automation of clerical processes to decision support applications. This change exploited the
superior interaction made possible by time-sharing computers and the developments in data
organization made possible by developments in database management software. The data
available in organizations was initially used to produce regular reports in the form of a
Management Information System (MIS). The introduction of improved user interfaces in the
1970’s facilitated the introduction of Decision Support Systems (DSSs). These systems
constitute a flexible user-friendly interface linked to problem databases and specific models.
As the name suggests, DSSs aim to support, rather than replace, the decision-maker
(Sprague, 1980). This form of IT became of interest to managers throughout the organization,
as these systems could support decision-making in diverse business functions such as
marketing or human resource planning. IT use therefore began to spread throughout all of the
business functions, a trend facilitated by the introduction of user-friendly personal computers
in the 1980s. Improved networking allowed these machines to be connected together and this
has allowed access from a variety of applications to centralized resources such as databases.
Modern business applications continue to exploit the rapidly increasing computational power
of the computer; but also derive increasing benefits from the ability of IT to store and
organize data (databases), distribute the information derived (networking), and present that
information in an interactive format (interfaces). This trend also found expression in the
5
development of systems such as Executive Information Systems (EIS) that provide executive
management with an overview of business activity within the organization and of
competitive forces on the outside.
A similar sequence of developments occurred within GIS, although largely independently
from other forms of IT. The distinct development of GIS was partially a consequence of the
much larger amounts of data required for spatial applications when compared to business
data processing. This meant that the evolution from automation applications to decision
support applications was delayed by ten to fifteen years for GIS when compared to traditional
business systems (Densham, 1991). Nevertheless, as computer technology became more
powerful, the functionality of GIS software greatly increased. This trend, combined with the
lower cost of GIS hardware, has facilitated more ambitious spatial applications. Modern GIS
provides distinctive database techniques, specialized data processing and a sophisticated
interface for dealing with spatial data.
Consequently, interest in decision support in the GIS field grew in the 1980s when the
concept of a Spatial Decision Support System (SDSS) was introduced (Armstrong, Densham,
& Rushton, 1986). SDSS was built around GIS with the inclusion of appropriate decision
models. By the end of the 1980s SDSS was a recognized area within the GIS community
(Densham, 1991). Over time decision support applications have found increasing acceptance
as an application of GIS and spatial applications have come to constitute an increasing
proportion of DSS applications (Keenan, 2003). These applications typically require the
synthesis of spatial techniques with other business orientated decision-making approaches
based on accounting, financial or operations research techniques.

6
Initially GIS software was run on mainframe computers, then on relatively expensive
graphics workstations. However, as computer performance improved in the 1990s it has
become possible to run GIS software on standard personal computers. This meant that the
machines commonly used in businesses were sufficiently powerful to do some useful work
with spatial data. Powerful GIS software is now readily available on the Microsoft Windows
platform, which is widely used in business and is familiar to business users. GIS vendors
have also recognized the market potential of business applications and GIS software has
evolved to meet the needs of this broader set of users, facilitating the design of business
applications.
These developments show a clear trend. Early applications of IT had a cost reduction role,
similar to other forms of mass production. However, it was quickly realized that computer
technology has a dual nature, it can be used to automate, but as a by-product of this
automation it can also produce large amounts of information about the process being
automated. In a widely cited book, Zuboff (1988) coins the term informate to describe the
ability of technology to provide information about processes as well as automating them. GIS
has also been seen as an informating technology (Madon & Sahay, 1997; Snellen, 2001), as it
moves from data processing applications to decision oriented applications. The informating
role of GIS is particularly evident in a business context, where decision-makers value the
problem visualization provided by a map, rather than the map itself.
7
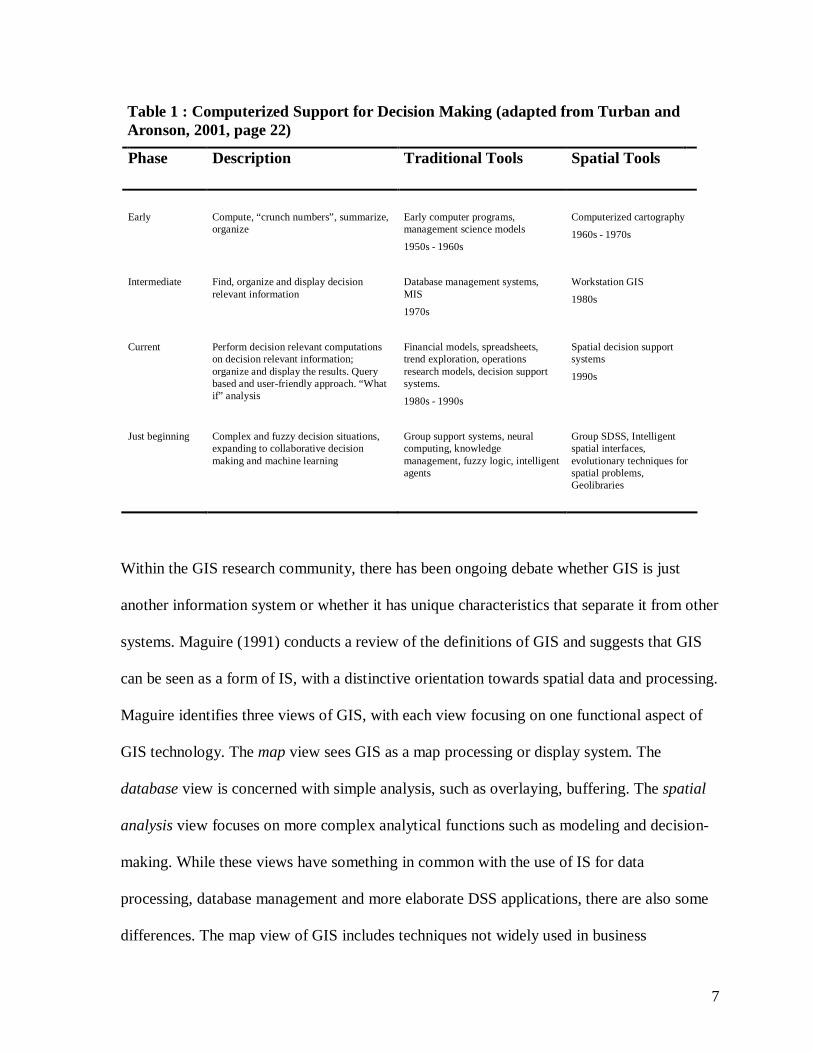
Within the GIS research community, there has been ongoing debate whether GIS is just
another information system or whether it has unique characteristics that separate it from other
systems. Maguire (1991) conducts a review of the definitions of GIS and suggests that GIS
can be seen as a form of IS, with a distinctive orientation towards spatial data and processing.
Maguire identifies three views of GIS, with each view focusing on one functional aspect of
GIS technology. The map view sees GIS as a map processing or display system. The
database view is concerned with simple analysis, such as overlaying, buffering. The spatial
analysis view focuses on more complex analytical functions such as modeling and decision-
making. While these views have something in common with the use of IS for data
processing, database management and more elaborate DSS applications, there are also some
differences. The map view of GIS includes techniques not widely used in business
Table 1 : Computerized Support for Decision Making (adapted from Turban and Aronson, 2001, page 22)
Phase Description Traditional Tools Spatial Tools
Early
Compute, “crunch numbers”, summarize, organize
Early computer programs, management science models
1950s - 1960s
Computerized cartography
1960s - 1970s
Intermediate Find, organize and display decision relevant information
Database management systems, MIS
1970s
Workstation GIS
1980s
Current Perform decision relevant computations on decision relevant information; organize and display the results. Query based and user-friendly approach. “What if” analysis
Financial models, spreadsheets, trend exploration, operations research models, decision support systems.
1980s - 1990s
Spatial decision support systems
1990s
Just beginning Complex and fuzzy decision situations, expanding to collaborative decision making and machine learning
Group support systems, neural computing, knowledge management, fuzzy logic, intelligent agents
Group SDSS, Intelligent spatial interfaces, evolutionary techniques for spatial problems, Geolibraries
8
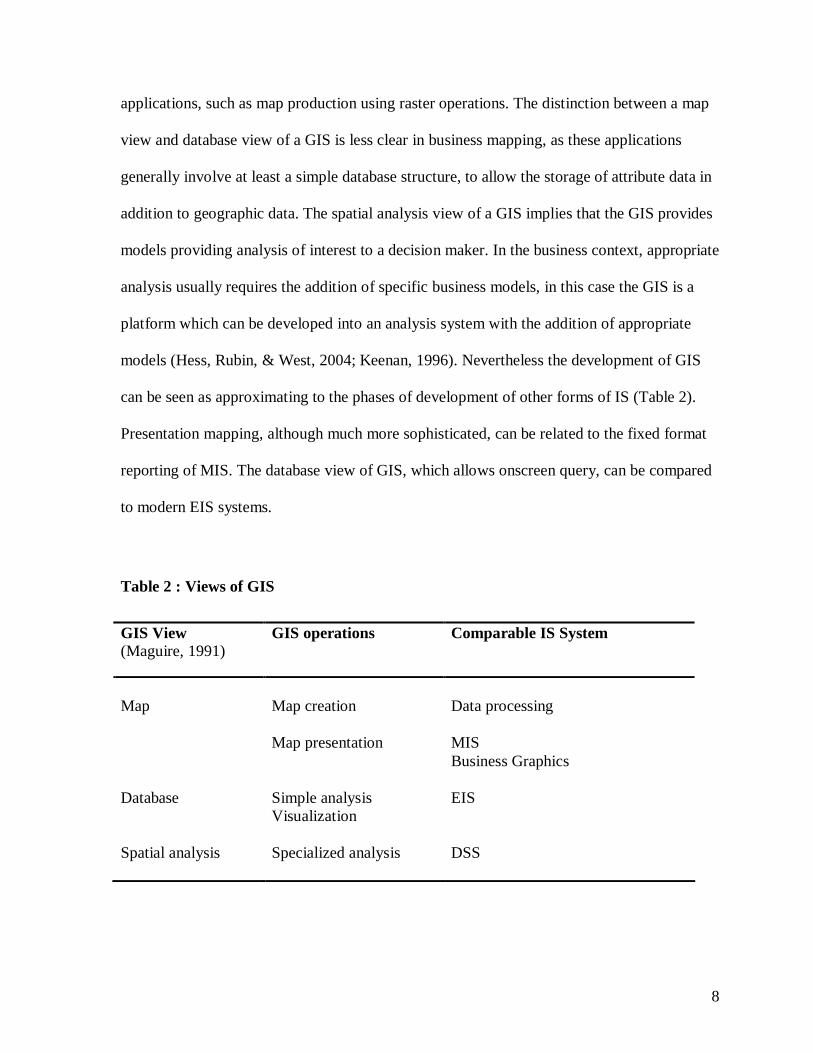
applications, such as map production using raster operations. The distinction between a map
view and database view of a GIS is less clear in business mapping, as these applications
generally involve at least a simple database structure, to allow the storage of attribute data in
addition to geographic data. The spatial analysis view of a GIS implies that the GIS provides
models providing analysis of interest to a decision maker. In the business context, appropriate
analysis usually requires the addition of specific business models, in this case the GIS is a
platform which can be developed into an analysis system with the addition of appropriate
models (Hess, Rubin, & West, 2004; Keenan, 1996). Nevertheless the development of GIS
can be seen as approximating to the phases of development of other forms of IS (Table 2).
Presentation mapping, although much more sophisticated, can be related to the fixed format
reporting of MIS. The database view of GIS, which allows onscreen query, can be compared
to modern EIS systems.
Table 2 : Views of GIS
GIS View (Maguire, 1991)
GIS operations Comparable IS System
Map creation
Data processing
Map
Map presentation MIS Business Graphics
Database Simple analysis Visualization
EIS
Spatial analysis Specialized analysis DSS

9
Spatial visualization
The vast majority of modern GIS applications are characterized by sophisticated graphics and
this capacity for visualization allows GIS to provide effective support for problem
representation in spatial problems. Long before computer technology was introduced, users
gained an improved understanding of spatial problems by the use of maps. While maps were
usually initially prepared by governments for political or military reasons, these could also be
used for business applications. An important early map, the 1815 geological map of England
by Smith (Winchester, 2002), also facilitated business projects such as coal mining and canal
construction. In the same period, British Admiralty charts were also seen as an important
advantage for British merchant ships trading in distant parts of the world. Early government
maps could also be used to assess business potential, one example of this was the nineteenth
century ‘Atlas to accompany the second report of the Irish Railway Commissioners’, which
showed population, traffic flow, geology, and topography all displayed on the same map
(Gardner, Griffith, Harness, & Larcom, 1838). This allowed easy understanding of the
feasibility of proposed railway routes planned by the private railway companies of that
period.
The growth of IS has seen the introduction of new information representation paradigms. As
technology has advanced, users' ability to work with information has been enhanced by
innovations such as graphical user interfaces. Even relatively simple concepts, such as the
representation of multiple spreadsheet tables as tabbed worksheets or the use of hypertext,
have greatly enhanced the usability of computer systems. The rapid pace of change in
technology has provided scope for the use of new problem representations. However, it takes
some time for interface design to take advantage of these developments, as suitable
references must be found to assist in the design of new information representation paradigms.
10
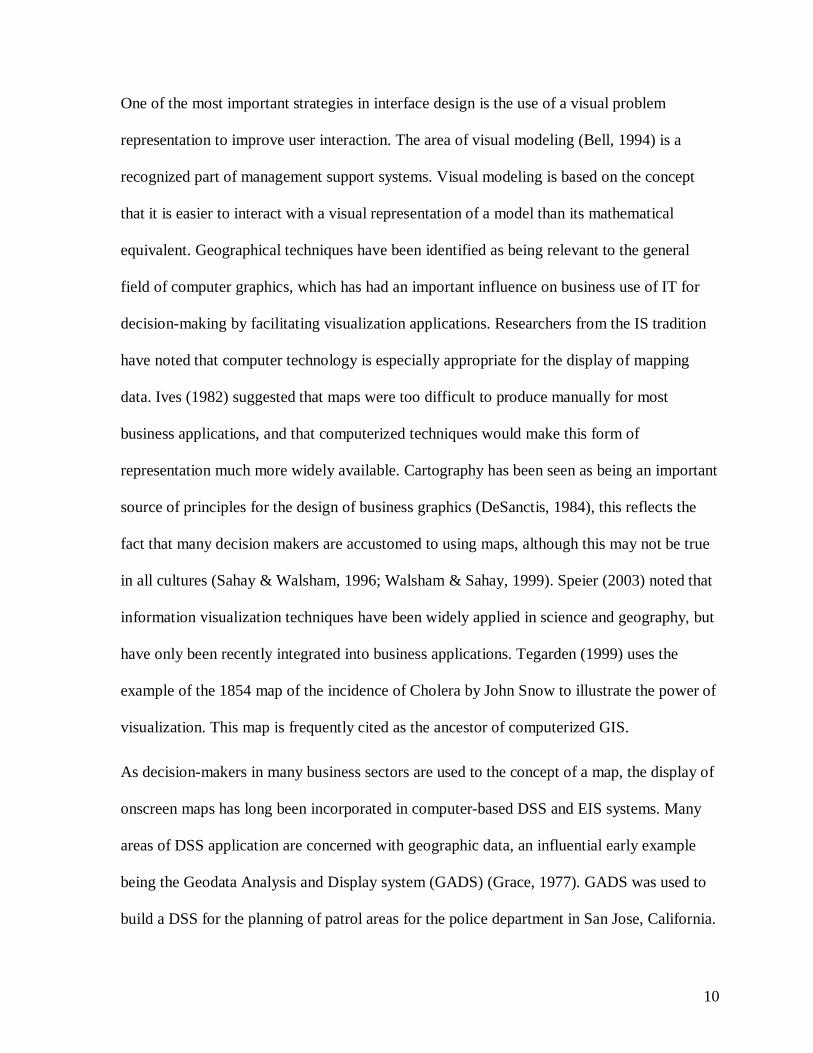
One of the most important strategies in interface design is the use of a visual problem
representation to improve user interaction. The area of visual modeling (Bell, 1994) is a
recognized part of management support systems. Visual modeling is based on the concept
that it is easier to interact with a visual representation of a model than its mathematical
equivalent. Geographical techniques have been identified as being relevant to the general
field of computer graphics, which has had an important influence on business use of IT for
decision-making by facilitating visualization applications. Researchers from the IS tradition
have noted that computer technology is especially appropriate for the display of mapping
data. Ives (1982) suggested that maps were too difficult to produce manually for most
business applications, and that computerized techniques would make this form of
representation much more widely available. Cartography has been seen as being an important
source of principles for the design of business graphics (DeSanctis, 1984), this reflects the
fact that many decision makers are accustomed to using maps, although this may not be true
in all cultures (Sahay & Walsham, 1996; Walsham & Sahay, 1999). Speier (2003) noted that
information visualization techniques have been widely applied in science and geography, but
have only been recently integrated into business applications. Tegarden (1999) uses the
example of the 1854 map of the incidence of Cholera by John Snow to illustrate the power of
visualization. This map is frequently cited as the ancestor of computerized GIS.
As decision-makers in many business sectors are used to the concept of a map, the display of
onscreen maps has long been incorporated in computer-based DSS and EIS systems. Many
areas of DSS application are concerned with geographic data, an influential early example
being the Geodata Analysis and Display system (GADS) (Grace, 1977). GADS was used to
build a DSS for the planning of patrol areas for the police department in San Jose, California.

11
This system allowed a police officer to display a map outline and to call up data by
geographical zone, showing police calls for service, activity levels, service time, etc. The
increasingly widespread use in business of GIS based systems for map creation and display
since GADS reflects the importance of visualization in human information processing.
In the business context, visualization in GIS poses a challenge to interface designers to
provide facilities that meet the problem representation needs of users, while also providing
convenient ways of interacting with that representation. Computer interface design generally
has yet to take full advantage of the increased power of computing and the richer set of
possibilities that this offers for user interaction. The complex nature of spatial data requires
GIS to use sophisticated visualization techniques to represent information. It is therefore
quite challenging for GIS to also to provide an interactive interface on the same screen.
Consequently, GIS applications can especially benefit from better designed human-computer
interfaces which meet their specific needs (Hearnshaw & Medyckyj-Scott, 1993).
Visualization has been recognized in the GIS community as an important aspect of GIS
(Buttenfield & Mackaness, 1991). This may reflect support for the map view of GIS. One
limitation of GIS interface designs, is that they are seen to provide a means for visualizing
results only, rather than providing a comprehensive problem representation for all stages of
the problem (Blaser, Sester, & Egenhofer, 2000). A more comprehensive system would allow
problem specification using interactive techniques. One example is the Tolomeo system
(Angehrn and Lüthi 1990; Angehrn 1991). In this case, the user can sketch their problem in a
geographical context and the Tolomeo system will try to infer the appropriate management
science model to use to solve the problem outlined by the user. Another example of sketching
might be a real estate agent who could use a GIS interface capable of interpreting a sketch of
12
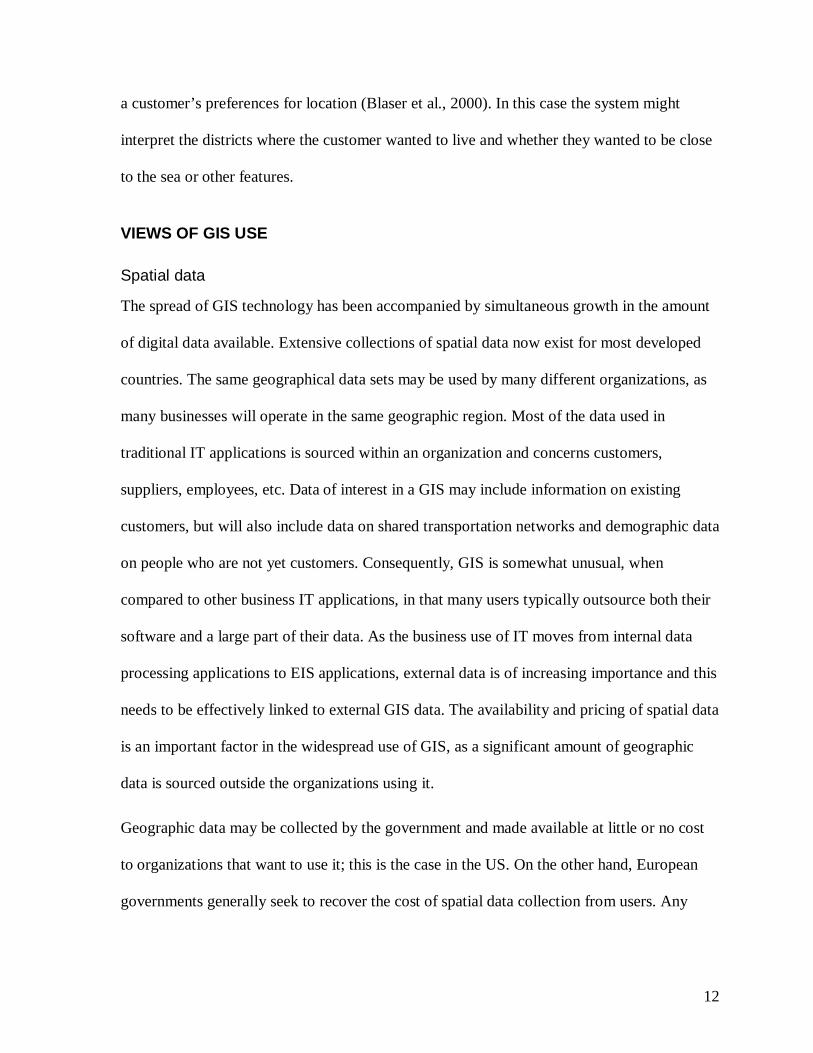
a customer’s preferences for location (Blaser et al., 2000). In this case the system might
interpret the districts where the customer wanted to live and whether they wanted to be close
to the sea or other features.
VIEWS OF GIS USE
Spatial data
The spread of GIS technology has been accompanied by simultaneous growth in the amount
of digital data available. Extensive collections of spatial data now exist for most developed
countries. The same geographical data sets may be used by many different organizations, as
many businesses will operate in the same geographic region. Most of the data used in
traditional IT applications is sourced within an organization and concerns customers,
suppliers, employees, etc. Data of interest in a GIS may include information on existing
customers, but will also include data on shared transportation networks and demographic data
on people who are not yet customers. Consequently, GIS is somewhat unusual, when
compared to other business IT applications, in that many users typically outsource both their
software and a large part of their data. As the business use of IT moves from internal data
processing applications to EIS applications, external data is of increasing importance and this
needs to be effectively linked to external GIS data. The availability and pricing of spatial data
is an important factor in the widespread use of GIS, as a significant amount of geographic
data is sourced outside the organizations using it.
Geographic data may be collected by the government and made available at little or no cost
to organizations that want to use it; this is the case in the US. On the other hand, European
governments generally seek to recover the cost of spatial data collection from users. Any

13
assessment of the potential of the GIS field to business must take account of the cost and
availability of the common data, as well as software and hardware.
Use of GIS as automation tool
GIS is of interest to a wide range of businesses. These organizations use IT in very different
ways and this influences their adoption of GIS. Reflecting Zuboff’s concepts of automating
and informating, GIS may be seen as a means to automate spatial operations or as a tool for
obtaining better information about business operations. Map automation is most relevant
where traditional paper maps were used; this arises only in specialist roles in most business
organizations. One example is the field of Facilities Management (FM), which makes use of
computer assisted design (CAD) approaches to record factory layouts, locations of pipe
networks, etc. Typically these layouts were superimposed on maps, therefore GIS can be
used to better integrate this data and to produce appropriate integrated maps in a less
expensive and timelier way.
Utility companies such as electricity, gas, or water companies can also exploit GIS to support
routine maintenance of pipe, cable, and power networks. For these organizations, the ability
to locate quickly a pipe or cable is critical to their ability to continue to provide service to
their customers. Traditional approaches suffered from missing data, for example where a map
was lost, and inadequate indexing of the data available. GIS based technology can be used to
automate the search procedure for pipe location, thereby making operations more efficient.
Just as data processing allowed simple checks on the integrity of data, GIS based applications
can improve the quality of spatial data used. The productivity gains alone from this type of
application may be sufficient to justify the use of GIS, just as productivity gains can justify
the use of data processing in business generally.

14
GIS as an information reporting tool
While automation applications of GIS are not of direct interest to most businesses,
applications with the capacity to informate are potentially of much wider interest. The
simplest forms of information-based applications are those where a map is produced with
some graphical information on attribute values superimposed. Presentation mapping has been
identified as the dominant requirement of the business use of GIS based technology (Landis,
1993). Presentation mapping creates a one-way report; the user cannot query the map
presented, instead the user assimilates the information provided and indirectly manipulates
the data. For example, a map may be displayed on screen with superimposed bar charts on
each region showing sales for an organization’s products. This is similar to other graphics
and charts produced in business software; the graphic provides a report, not an interface. The
use of maps as an extension of business graphics is facilitated by the inclusion of a simple
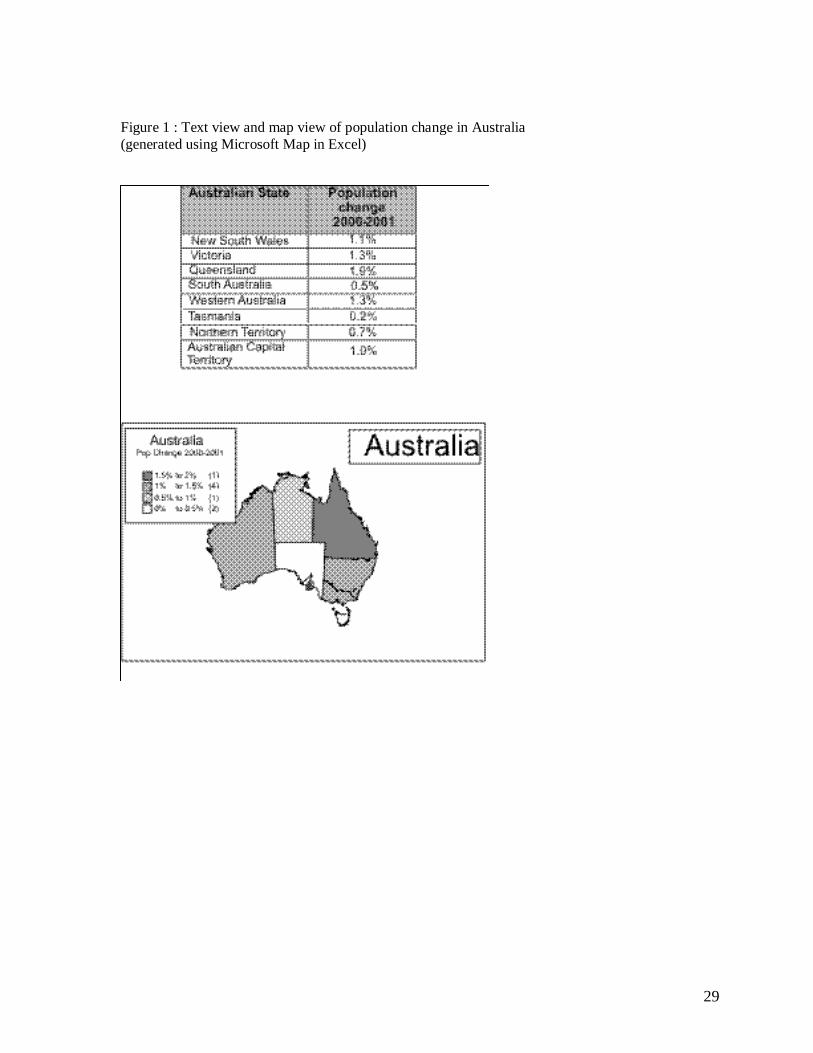
mapping add-on in Microsoft Excel. This allows the creation of a form of chart where simple
graphics can be associated with spatial entities. A choropleth map (thematic map) displays
attribute data, in this case population, associated with relevant spatial units. One example can
be seen in Figure 1, which allows the user to identify the states in Australia with faster
population growth. This type of simple graphic can make the visualization of areas of
potential demand easier than a traditional table format. Other simple graphic maps allow the
display of bar or pie charts for each spatial entity on the map.
Modern desktop GIS software, such as ArcGIS or Mapinfo, can be regarded as much more
than presentation mapping software. This software can better be regarded as illustrating the
database or spatial analysis view of GIS. However, in addition this type of software also
provides comprehensive presentation facilities. These facilities include the ability to generate
thematic maps using a variety of shading techniques, bar and pie charts, graduated symbols,

15
and dot density maps. Modern presentation mapping software allows three-dimensional
representations to be used, with the capability to extrude areas on the map to represent
particular attribute values.
GIS as a database
A GIS interface can be used to query a database; although this requires a more sophisticated
interface with the ability to formulate a query using the interactive commands. As IT has
developed, a limited level of database functionality has become common in almost all
software applications. This trend has also been seen in GIS where modern desktop packages,
such as Mapinfo, ArcGIS, or Maptitude, have sophisticated database functionality. Database
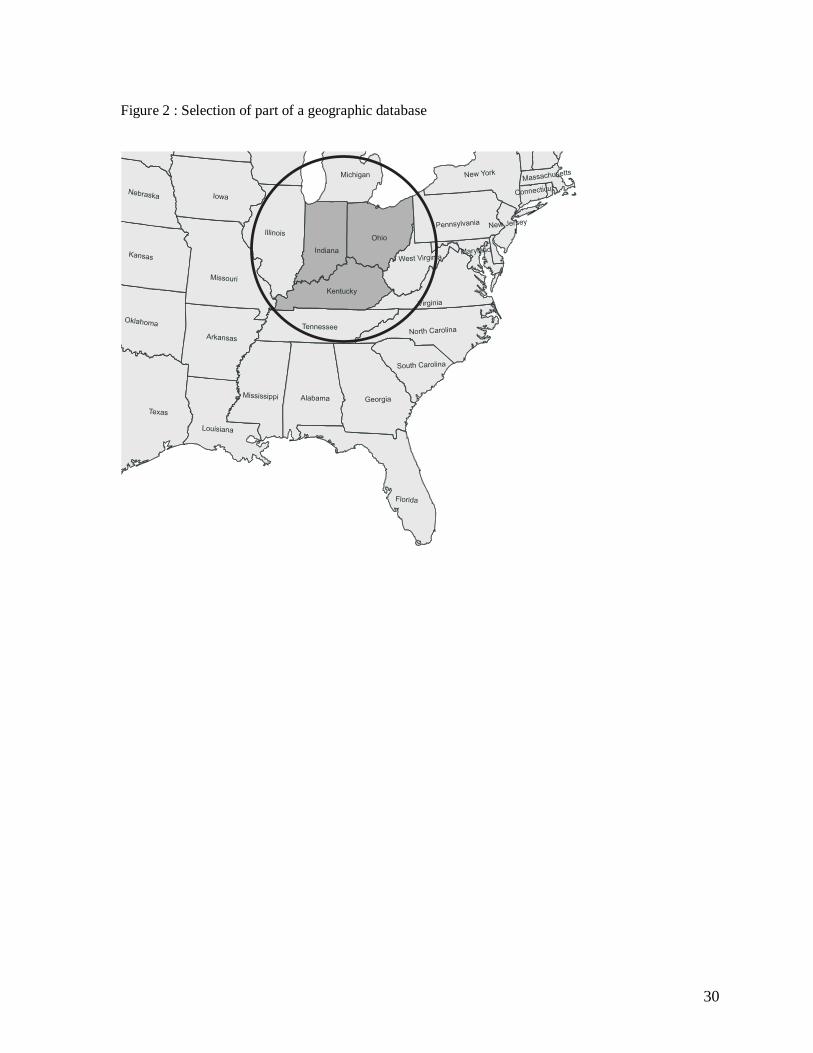
capability allows queries be generated in the GIS to show only areas selected by attribute
value, e.g. sales value. This type of software also allows simple spatial database queries such
as selection of a particular region and operations such as buffering or overlay.
In the business world, information systems have continued to evolve towards the introduction
of large databases, which extensive networking then make available throughout the
organization. This evolution has led to the introduction of EIS; these systems need to
facilitate information retrieval from traditional forms of non-spatial data and a variety of
types of data outside the organization. A limited map presentation capability is a recognized
feature of EIS type applications and the use of map representation can reduce the information
overload that might arise in the use of an EIS. These maps form the basis of an interface for
querying data, this facility can include the ability to conduct spatial operations. Spatial data is
increasingly becoming a standard part of corporate databases, as evidenced by the alliances
between the GIS market leader ESRI and organizations like IBM, Oracle and SAP (Good,
1999).

16
Spatial decision support
IT applications generally have moved from automation applications to decision support
applications and GIS is following the same path (see Table 1 above). In most cases, spatial
data is only one form of data relevant to business users, since many business sectors have
existing non-GIS based DSS systems. Traditional users of DSS include fields such as
marketing and routing (Eom, Lee, & Kim, 1993) with obvious scope for the use of GIS.
While the growth of traditional IS has already made an important contribution to the
management of these fields, it has not yet fully catered for the spatial component of
decisions. The ability to handle both spatial and non-spatial data appropriately is required for
better support for management decision making in a range of applications. Effective decision
support is characterized by the use of specialized models directed at the specific business
decision being made. These need to be closely integrated with GIS techniques to enhance
business decision-making. In this book, the literature on spatial decision support is elaborated
on in the chapter by Huerta, Ryan, and Navarrete, while its theoretical aspects are examined
in the chapter by Jarupathirun and Zahedi.
BUSINESS APPLICATIONS OF GIS
Contribution of IT to business
Business organizations operate in an ever changing and challenging environment, in which
competitive forces require that information technology be exploited to the full. One widely
cited model of business, the Value Chain model (Porter 1985), identifies five primary
business activities. These are (1) inbound logistics (inputs), (2) operations, (3) outbound
logistics (outputs), (4) marketing and sales, and (5) service. Porter argues that the ability to
perform effectively particular activities, and to manage the linkages between these activities,

17
is a source of competitive advantage. An organization exists to deliver a product or service,
for which the customer is willing to pay more than the sum of the costs of all activities in the
value chain. Consequently, management should be concerned with ways to improve these
activities.
Information technology can contribute to the efficient organization of all of these primary
business activities. As the business environment becomes increasingly competitive, the use of
IT becomes an important component of business strategy. Importantly, spatial techniques can
have a major role in this contribution. In addition to the basic issues raised by the value chain
model, other developments in business provide further opportunities for the use of spatial
techniques. There is increasing concern about the natural environment and companies are
anxious to be seen to respond to these concerns. Issues such as pollution control often have a
spatial dimension and planning for the location of new facilities requires the use of spatial
techniques to address public concern over issues such as traffic impact.
Logistics support
Business logistics has an inherent spatial dimension, as goods must be moved from one point
to another. Modern businesses have sophisticated supply chains, with goods being moved
around the world on a just-in-time basis. However, these supply chains are vulnerable to
disruption due to political events, bad weather and natural disasters and unforeseen events
such as quarantine due to disease. In these circumstances, it is important to be aware of the
spatial location of parties involved and to be able to plan rapidly alternative routes to resolve
any difficulties. It is therefore not surprising that routing and location analysis are some of
the most important areas of application of spatial techniques, a good example being the
comprehensive restructuring of a Proctor and Gamble’s logistics (Camm et al., 1997).
18
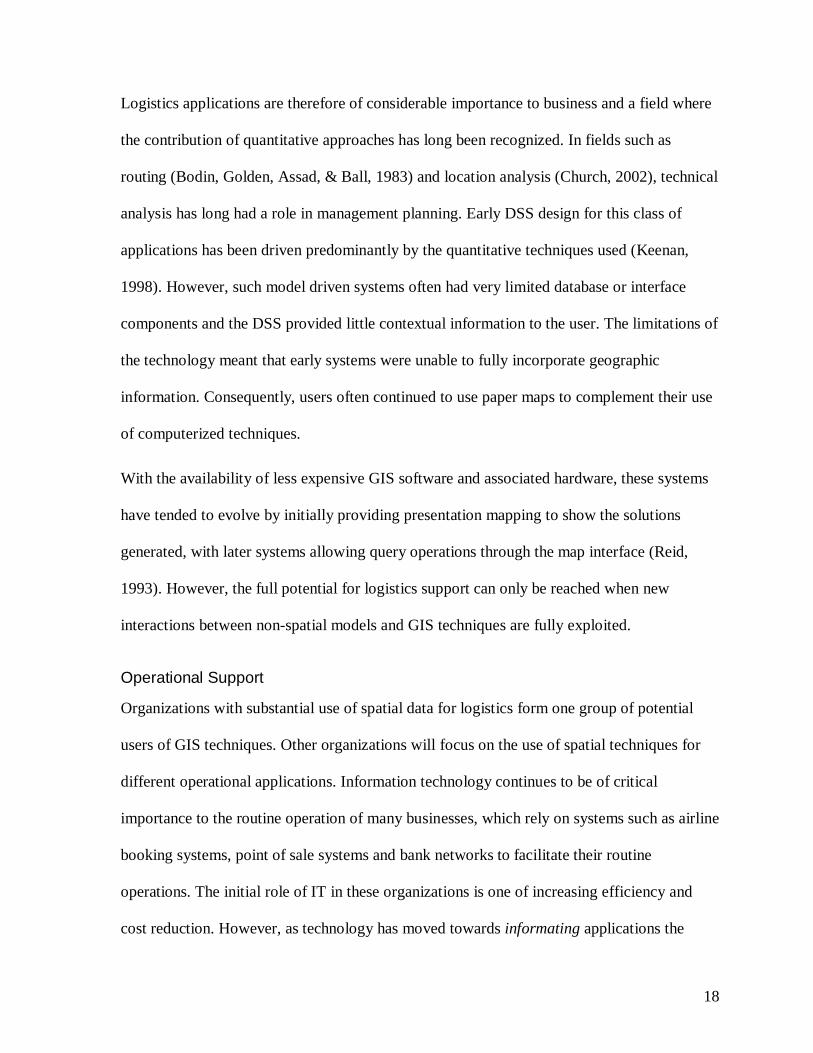
Logistics applications are therefore of considerable importance to business and a field where
the contribution of quantitative approaches has long been recognized. In fields such as
routing (Bodin, Golden, Assad, & Ball, 1983) and location analysis (Church, 2002), technical
analysis has long had a role in management planning. Early DSS design for this class of
applications has been driven predominantly by the quantitative techniques used (Keenan,
1998). However, such model driven systems often had very limited database or interface
components and the DSS provided little contextual information to the user. The limitations of
the technology meant that early systems were unable to fully incorporate geographic
information. Consequently, users often continued to use paper maps to complement their use
of computerized techniques.
With the availability of less expensive GIS software and associated hardware, these systems
have tended to evolve by initially providing presentation mapping to show the solutions
generated, with later systems allowing query operations through the map interface (Reid,
1993). However, the full potential for logistics support can only be reached when new
interactions between non-spatial models and GIS techniques are fully exploited.
Operational Support
Organizations with substantial use of spatial data for logistics form one group of potential
users of GIS techniques. Other organizations will focus on the use of spatial techniques for
different operational applications. Information technology continues to be of critical
importance to the routine operation of many businesses, which rely on systems such as airline
booking systems, point of sale systems and bank networks to facilitate their routine
operations. The initial role of IT in these organizations is one of increasing efficiency and
cost reduction. However, as technology has moved towards informating applications the
19
scope of these sectors has been changed by the use of technology. For example, the complex
pricing models found in the airline industry would be difficult to sustain without IT. While
many operational applications of GIS lie in the government sector, these often involve
private contractors. For example, road networks may be publicly owned, but may be
constructed and maintained by the private sector. The use of GIS should lead to greater
efficiencies in this type of application and ultimately to new procedures and processes for the
allocation of this type of work.
However, as with other business applications, the collection of large amounts of data for
operational purposes can provide data for use in decision-oriented applications. Business data
processing produces low-level transaction data that can be aggregated and processed for EIS
applications. In a similar way, those organizations using spatial data for operational reasons
have the opportunity to exploit their spatial data resources for strategic management
purposes. This will mean a move towards spatial decision support applications and the
incorporation of spatial data in EIS systems. The synthesis of EIS and spatial techniques is
most promising where there is already a large volume of operational spatial data in the
organization, as well as a requirement for access to spatial data outside the organization.
However, if managers are to take advantage of the inclusion of spatial data in EIS, and other
GIS applications in business, they must be aware of contribution of spatial techniques.
Marketing
In disciplines such as marketing, additional possibilities for analysis are provided by the
availability of increasing amounts of reasonably priced spatial data. Demographic data is of
particular importance to business (Mennecke, 1997) and basic census information is now
available for use in GIS throughout the western world. The relevance of GIS to this type of
20
work is becoming widely recognized (Fung & Remsen, 1997). The availability of user
friendly SDSS to manipulate this type of data will lead to additional decision possibilities
being examined which are difficult to evaluate without the use of such techniques
(Grimshaw, 2000). This is reflected in increasing interest in spatial applications for sectors
such as retailing (Nasirin & Birks, 2003) which may not have used this form of technical
analysis in the past.
The marketing field in general has shown interest in GIS, this was reflected in the absorption
of the GeoBusiness Association into the American Marketing Association. GIS has been seen
as being a critical component of a marketing information system (Hess et al., 2004). There
are significant obstacles to the more widespread use of GIS in fields such as marketing. In
business disciplines such as marketing, operational applications of GIS are less important
than decision support applications. However, this group of potential SDSS users has little
background in spatial processing and is inexperienced in the use of any type of DSS
technology. Consequently, this category of users is not accustomed to the restrictions on
model realism and the interface limitations that many users of DSS have been willing to put
up with in the past. Such users will therefore require systems that are straightforward to use
and which do not require the users to accommodate themselves to artificial restrictions on the
problem representation. While the availability of user-friendly systems and interfaces
incorporating spatial visualization will make modeling techniques in this field more
accessible, potential users must gain experience with GIS based systems in order to put them
to effective use. GIS is therefore becoming more common, but is still far from universal, in
education in business schools. GIS, which has been seen as the preserve of geographers and
computer scientists, needs to also become the concern of managers (Reeve & Petch, 1999).

21
Service
Within Porter’s value chain model, service refers to customer related activities other than
direct sales and product delivery. This would include after sales service and support. With the
routine high standards in modern manufacture and the outsourcing of logistics, service is
often one area where companies can try to achieve a competitive advantage. There is
increasing interest in the service dimension, this is reflected by the growth of IT systems such
as customer relationship management (CRM) systems. A recent book, “The Support
Economy” (Zuboff & Maxmin, 2002) argues for the role of customized customer support.
One element of “knowing your customer” is that customer’s geographic location and good
service requires an approach tailored to that location.
GIS based techniques have an important role to play in customer service. Call centers will
often use a customer’s telephone number to identify where they are calling from, thereby
providing a service appropriate to that customer. Spatial databases can be used to identify the
nearest shop or repair center to a customer. Utilities can identify whether a customer is
sufficiently close to a cable network or telephone exchange to avail of an improved service.
Some service activities may overlap with sales or logistics, one example would be the use of
GIS to improve both product dispatch and technician routing for Sears (Weigel & Cao,
1999).
New areas for SDSS use in business
One area of growing importance for SDSS application is businesses where the importance of
both spatial data and modeling is somewhat neglected at present, in sectors where decision-
makers are less accustomed to using maps. Groups such as the insurance sector have been
accustomed to using statistical and actuarial models, but have not tended to use information
22
on the location of their customers. As insurance risks are often strongly spatially correlated,
this sector needs to make more use of spatial techniques in the future (Morton, 2002).
Software vendors are aware of the market for GIS related risk management software and are
moving to provide solutions for this market (Francica, 2003).
Other recent developments in business such as the growth of Electronic Commerce (Kalakota
& Whinston, 1997) also provide opportunities for the use of GIS. Although the Internet is
available throughout the world, the location of customers is of importance in the services
offered in many Electronic Commerce applications. Many consumer Electronic Commerce
applications offer goods that must be delivered to the customer. This mode of doing business
requires a sophisticated delivery operation and GIS techniques have an important role to play
in the management of this function. In this environment it can be argued that the move to
Electronic Commerce will increase, rather than decrease, the importance of GIS.
Mobile computing and telecommunications is an emerging area of IT application that is of
increasing interest to business (Mennecke & Strader, 2003). GIS is widely used by
operational activities by mobile service providers for modeling service levels and locating
signal masts. Mobile services can be largely distinguished from fixed internet services by the
presence of a locational element (MacKintosh, Keen, & Heikkonen, 2001). Mobile services
can be divided into mobile commerce and Location Based Services (LBS) (Mitchell &
Whitmore, 2003). LBS applications require the integration of wireless technology with GIS
applications. Future developments will enhance the capabilities of these devices and we are
likely to see the integration of mobile data devices and spatial technologies such as Global
Positioning Systems (GPS). This will allow the location of the mobile user to be easily
identified and will therefore provide the basis for a service customized to that location. This
23
allows for the growth in situation-dependent services (Figge, 2004) directed at a particular
customer in a particular location. For businesses in the mobile services sphere, spatial
technologies are core to their business model and there are many opportunities for businesses
that can successfully exploit this technology.
CONCLUSIONS
Trends in Business GIS
Business use of GIS covers a spectrum of GIS applications. The use of GIS applications is
still somewhat fragmented and there is a need for further integration with other forms of IT.
The trend in IT applications has been for initial operational use in specialized situations,
followed by a more general information providing use, followed in turn by sophisticated
specialist decision-making and executive management applications. The Nolan stages of
growth model (Nolan, 1973; Nolan, 1979) is a model of computing growth in an organization
based on the organization’s level of expenditure on IT. The more recent 1979 version of the
model comprises the steps of initiation, expansion/contagion, formalization/control,
integration, data administration, and maturity. Chan (1998) identifies a number of GIS
researchers who have used the Nolan model and suggests that this research shows a common
trend in public organizations towards GIS becoming an integral part of the overall corporate
information system.
The availability of moderately priced data, and software for working with that data, means
that the necessary conditions for contagion already exist. One significant difference in GIS,
when compared to other forms of IT, is that applications in different parts of an organization
may be concerned with the same geographic area. Geographic location provides a common
feature facilitating this data integration. Business users are generally already reasonably
24
sophisticated users of IT and there will be pressure for GIS to integrate in this infrastructure.
The data administration phase of the Nolan model could be problematic for business, owing
to the complexity of GIS data. One recent published example of a GIS failure in business
noted difficulties with integrating diverse data sources (Birks, Nasirin, & Zailini, 2003). In
general there are significant difficulties building a comprehensive spatial database in the first
instance, but subsequently it is often easier to maintain this database. The GIS community
generally is attempting to integrate multiple spatial data sources and new metadata standards
and other initiatives aim to facilitate this (Goodchild & Zhou, 2003). With data organization
made easier, business users will be able to take advantage of better integrated GIS data to
extend the areas of business where GIS is used. With concerns about data integrity and
relationships resolved, business use of GIS can move to maturity in the Nolan model.
In IT adoption generally, the culture of organizations is an important factor in the adoption of
technology. GIS applications are relevant to a wide range of sectors, from engineering related
applications where technical solutions are readily accepted, to marketing departments where
there is less tradition of using IT. GIS faces particular problems as most people in business
have little training in spatial techniques and may consequently be slower to make full use of
the technology. Where top managers have little appreciation of the technology, they are
unlikely to be sufficiently enthusiastic in supporting it. The GIS failure discussed above
(Birks et al., 2003) also resulted in part from a lack of senior management interest in the
project. These researchers noted that lessons learned in different environments, such as the
application of GIS in local government, could also have implications for the successful
business use of GIS.
25
Summary
GIS represents a sophisticated information technology application that has grown in parallel
with traditional business IT. As GIS techniques have come to focus on decision support, they
have increasing potential for wider use in business, a potential that has yet to be fully
realized. GIS has an important role to play in a variety of decision-making systems in
specific functional areas, but GIS also needs to be incorporated in enterprise wide systems.
Newer technologies such as e-commerce and location based services have an intrinsic spatial
element and the spread of these applications will serve to further increase the importance of
GIS.
26
References
Armstrong, M. P., Densham, P. J., & Rushton, G. (1986). Architecture for a microcomputer based spatial decision support system. Paper presented at the Second International Symposium on Spatial Data Handling.
Bell, P. C. (1994). Visualization and Optimization : The future lies together. ORSA Journal on Computing, 6(3), 258-260.
Birks, D. F., Nasirin, S., & Zailini, S. H. M. (2003). Factors influencing GIS project implementation failure in the UK retailing industry. International Journal of Information Management, 23, 73-82.
Blaser, A. D., Sester, M., & Egenhofer, M. J. (2000). Visualization in an early stage of the problem-solving process in GIS. Computers & Geosciences, 26(1), 57-66.
Bodin, L. D., Golden, B. L., Assad, A., A., & Ball, M. O. (1983). Routing and Scheduling of Vehicles and Crews: The State of the Art. Computers and Operations Research, 10(2), 67-211.
Buttenfield, B. P., & Mackaness, W. A. (1991). Visualization. In D. J. Maguire, M. F. Goodchild, & D. W. Rhind (Eds.), Geographical Information Systems, Volume 1 : Principles (Vol. 1, pp. 427-443). Harlow, Essex, England: Longman Scientific & Technical.
Camm, J. D., Chorman, T. E., Dill, F. A., Evans, J. R., Sweeney, D. J., & Wegryn, G. W. (1997). Blending OR/MS, Judgement and GIS: Restructuring P&G's Supply Chain. Interfaces, 27(1), 128-142.
Chan, T. O. (1998). The Dynamics of Diffusion of Corporate GIS. Unpublished PhD, The University of Melbourne, Melbourne, Australia.
Church, R. L. (2002). Geographical information systems and location science. Computers & Operations Research, 29(6), 541-562.
Coppock, J. T., & Rhind, D. W. (1991). The history of GIS. In D. J. Maguire, M. F. Goodchild, & D. W. Rhind (Eds.), Geographical Information Systems, Volume 1 : Principles (Vol. 1, pp. 21-43). Harlow, Essex, England: Longman Scientific & Technical.
Densham, P. J. (1991). Spatial Decision Support Systems. In D. J. Maguire, M. F. Goodchild, & D. W. Rhind (Eds.), Geographical Information Systems, Volume 1 : Principles (Vol. 1, pp. 403-412). Harlow, Essex, England: Longman Scientific & Technical.
DeSanctis, G. (1984). Computer graphics as decision aids: directions for research. Decision Sciences, 15(4), 463-487.
Eom, S., Lee, S., & Kim, J. (1993). The intellectual structure of Decision Support Systems (1971-1989). Decision Support Systems, 10(1), 19-35.
Figge, S. (2004). Situation-dependent services––a challenge for mobile network operators. Journal of Business Research, forthcoming.
Francica, J. (2003, October 22, 2003). MapInfo Looks to Take the Risk Out of Insurance Policy Underwriting. Directions Magazine.
27
Fung, D. S., & Remsen, A. P. (1997). Geographic Information Systems technology for business applications. Journal of Applied Business Research, 13(3), 17-23.
Gardner, J., Griffith, R. J., Harness, H. D., & Larcom, T. A. (1838). Irish Railway Commission. (Atlas to accompany 2nd. Report of the Railway Commissioners). London.
Good, M. (1999). SAP Business Data Visualization with MapObjects. Paper presented at the 1999 ESRI User Conference, Redlands, CA, USA.
Goodchild, M., & Zhou, J. (2003). Finding geographic information: Collection-level metadata. Geoinformatica, 7(2), 95-112.
Grace, B. F. (1977). Training Users of a prototype DSS. Data Base, 8(3), 30-36.
Grimshaw, D. J. (2000). Bringing Geographical Information Systems into Business. (2nd ed.): Wiley.
Hearnshaw, H., & Medyckyj-Scott, D. (1993). The way forward for human factors in GIS. In D. Medyckyj-Scott & H. Hearnshaw (Eds.), Human factors in Geographical Information Systems (pp. 235-243). London: Belhaven Press.
Hess, R. L., Rubin, R. S., & West, L. A. (2004). Geographic information systems as a marketing information system technology. Decision Support Systems, forthcoming.
Ives, B. (1982). Graphical user interfaces for business information systems. MIS Quarterly, 6(5), 15-47.
Kalakota, R., & Whinston, A. B. (1997). Electronic commerce : a manager's guide. Reading, Massachusetts: Addison-Wesley.
Keenan, P. (1996). Using a GIS as a DSS Generator. In J. Darzentas, J. S. Darzentas, & T. Spyrou (Eds.), Perspectives on DSS (pp. 33-40): University of the Aegean, Greece.
Keenan, P. B. (1998). When the Question is 'Where'? Integrating geographic information systems and management science. OR Insight, 11(1), 23-28.
Keenan, P. B. (2003). Spatial Decision Support Systems. In M. Mora, G. Forgionne, & J. N. D. Gupta (Eds.), Decision Making Support Systems: Achievements and challenges for the New Decade (pp. 28-39): Idea Group Publishing.
Landis, J. D. (1993). GIS capabilities, use and organizational issues. In G. H. Castle (Ed.), Profiting from a Geographic Information System (pp. 23-53). Fort Collins, CO, USA: GIS World Books.
MacKintosh, R., Keen, P. G. W., & Heikkonen, M. (2001). The Freedom Economy: Gaining the mCommerce Edge in the Era of the Wireless Internet: McGraw Hill.
Madon, S., & Sahay, S. (1997). Managing natural resources using GIS: Experiences in India. Information & Management, 32(1), 45-53.
Maguire, D. J. (1991). An Overview and definition of GIS. In D. J. Maguire, M. F. Goodchild, & D. W. Rhind (Eds.), Geographical Information Systems, Volume 1 : Principles (Vol. 1, pp. 9-20). Harlow, Essex, England: Longman Scientific & Technical.

28
Mennecke, B. E. (1997). Understanding the Role of Geographic Information Technologies in Business: Applications and Research Directions. Journal of Geographic Information and Decision Analysis, 1(1), 44-68.
Mennecke, B. E., & Strader, T. J. (2003). Mobile commerce : technology, theory, and applications. Hershey, PA, USA: Idea Group Pub.
Mitchell, K., & Whitmore, M. (2003). Location Based Services: Locating the money. In B. E. Mennecke & T. J. Strader (Eds.), Mobile commerce : technology, theory, and applications (pp. 51-66). Hershey, PA, USA.: Idea Group Pub.
Morton, K. (2002). Mapping out risks. Canadian Insurance, 107(12), 8-10.
Nasirin, S., & Birks, D. F. (2003). DSS implementation in the UK retail organisations: a GIS perspective. Information & Management, 40(4), 325-336.
Nolan, R. L. (1973). Managing the computer resources: a stage hypothesis. Communications of the ACM, 16(7), 399-405.
Nolan, R. L. (1979). Managing the crises in data processing. Harvard Business Review, 57(2), 115-126.
Reeve, D. E., & Petch, J. R. (1999). GIS, organisations and people : a socio-technical approach. London: Taylor & Francis.
Reid, H. G. (1993). Retail trade. In G. H. Castle (Ed.), Profiting from a Geographic Information System (pp. 131-151). Fort Collins, CO, USA: GIS World Books.
Sahay, S., & Walsham, G. (1996). Implementation of GIS in India:organizational issues and implications. International Journal of Geographical Information Systems, 10(4), 385-404.
Snellen, I. (2001). ICTs, bureaucracies, and the future of democracy. Communications of the ACM, 44(1), 45-48.
Speier, C., & Morris, M. G. (2003). The influence of query interface design on decision-making performance. MIS Quarterly, 27(3), 397-423.
Sprague, R. (1980). A Framework for the development of Decision Support Systems. MIS Quarterly, 4(1), 1-26.
Tegarden, D. P. (1999). Business Information Visualization. Communications of the Association for Information Systems, 1(4).
Walsham, G., & Sahay, S. (1999). GIS for district-level administration in India: Problems and opportunities. MIS Quarterly, 23(1), 39-65.
Weigel, D., & Cao, B. (1999). Applying GIS and OR techniques to solve Sears technician dispatching and home delivery problems. Interfaces, 29(1), 112-130.
Winchester, S. (2002). The Map That Changed the World: A Tale of Rocks, Ruin and Redemption: Penguin Books.
Zuboff, S. (1988). In the Age of the Smart Machine. New York: Basic Books.
Zuboff, S., & Maxmin, J. (2002). The support economy : why corporations are failing individuals and the next episode of capitalism. New York: Viking.
29
Figure 1 : Text view and map view of population change in Australia (generated using Microsoft Map in Excel)
30
Figure 2 : Selection of part of a geographic database
Kansas
Nebraska
Missouri
Oklahoma
Georgia
Michigan
Illinois
Iowa
Arkansas
Alabama
North Carolina
New York
Mississippi
Louisiana
Pennsylvania
Tennessee
Ohio
Kentucky
Virginia
Indiana
South Carolina
West VirginiaMaryland
Massachusetts
New Jersey
Connecticut
Florida
Texas

31
Table 1 : Computerized Support for Decision Making (adapted from Turban and Aronson, 2001, page 22)
Phase Description Traditional Tools Spatial Tools
Early
Compute, “crunch numbers”, summarize, organize
Early computer programs, management science models
1950s - 1960s
Computerized cartography
1960s - 1970s
Intermediate Find, organize and display decision relevant information
Database management systems, MIS
1970s
Workstation GIS
1980s
Current Perform decision relevant computations on decision relevant information; organize and display the results. Query based and user-friendly approach. “What if” analysis
Financial models, spreadsheets, trend exploration, operations research models, decision support systems.
1980s - 1990s
Spatial decision support systems
1990s
Just beginning
Complex and fuzzy decision situations, expanding to collaborative decision making and machine learning
Group support systems, neural computing, knowledge management, fuzzy logic, intelligent agents
Group SDSS, Intelligent spatial interfaces, evolutionary techniques for spatial problems, Geolibraries

32
Table 2 : Views of GIS
GIS View (Maguire, 1991)
GIS operations Comparable IS System
Map creation
Data processing
Map
Map presentation MIS Business Graphics
Database Simple analysis Visualization
EIS
Spatial analysis
Specialized analysis
DSS