concentration in local commercial banking markets: a study of
TRANSCRIPT

Concentration in Local CommercialBanking Markets: A Study of theEighth Federal Reserve DistrictPATRICK J. WELCH
ONCENTRAT1ON measures indicate the extentto which some specific magnitude, such as total de-posits, sales or capacity, is controlled by one or a fewdecision-making units in a market. At the firm level,which is the focus of this study, concentration dependson the number offirms in the market and their relativesizes. Accordingly, the fewer the banking organiza-tions in a local commercial banking market or the moreunevenly deposits are distributed among a given num-ber of organizations within a market, the higher theconcentration in that market.
may be proposed to monitor or inodif~’market per-formance.
The concentration of total deposits among bankingorganizations in 176 Eighth District local commercialbanking markets is described in this study.3 Also de-scribed is the distribution of observed levels ofconcen-tration according to a recently published Departmentof Justice criterion for classifying markets as highlyconcentrated, moderately concentrated and uncon-centrated. Finally, the effects on concentration due to
The degree of market concentration is importantbecause it may affect the overall “performance” of themarket — the extent to which firms in the market actindependently, aggressively adopt new technologies,provide desired types and levels of services and carryout other activities that benefit buyers, suppliers andothers. While the existence of a systematic link be-tween concentration and performance is open to de-bate, there are many, including the U.S. Departmentof Justice, who believe that a high level of concentra-tion in a market will affect the market’s performanceadversely.2 Thus, if a market is characterized as beinghighly concentrated, sonic form of policy intervention
The author is a profrssor of economics at Saint Louis University.i’hanks go to Jude Noes for programming anti research assistance.and to Barbara Scott B rundey for research assistance.
‘Concentration also can he measured at the plant level.2The Department of Justice, in its June 1982 merger guidelines,noted that:
Other things being equal. concentration affects tlsc likelihood that onefirm, or a snsall grot p of fi rnss, could successfully exercise marketpower. The smaller the percentage of total stipp
1v that a finn controls.
tlse more severely it ,ss sist restrict its own outpu tin order to prodi cc’ agiven price increase’. a,i cI tlse lcss likely it is that an output restrictionwill he profitable. Where collective action is neeessarv, an additionalconstrast applies. As the nuinber of firnis necessary to control a given
pereestage of total a upph- increases, cIsc dibEciilties and costs ofreaching and eniorcing consensus with respect to the cssistrol tsf tlsatstipply also ilserease.
U.S. Department of Justice, “Merger Guidelines,” federal Regis-ter (June 30, 1982), p. 28497.
For more on the conccntration—perforrnanee relatiotsslsip, seeDonald H. Fraser and Peter S. Rose, ‘Banking Structure andPerlbrmance in Isolated Markets: The lsnplieatiosss for Public Pol-icy,” The Antitrust Bulletin (Fall 1972), pp. 927—47; Arnold ,k.Heggestad and Jolsis J. Mingo, “Prices, Nonpriees, and Concentra—tissn in Commercial Batsking, Journal of Money, Credit and Bank-ing (February 1976). pp. 107—17; Ahnarin Plsillips, “Competition,Confusioss, and Comisiercial Ranking,” The Journal of Finance(March 1964), pp. 32—45; atsd Thomas H. Saving, “CoueeistrationRatios atsd the Degree of Monopoly,’’ International EconomicReview (Fehruary 1970), pp. 139—46.
3Banking organizatiosss included in the study are ussit banks, multi-bank holding companies and branch bassking organizations. Chaissbanking relationships arising through common ownei’ship or man—agement interlocks are not cosssidered due to slata litnitatiosss,Thus, observed levels of cosse’esstration nsav smnderstate the effec-tive degree of control in particular markets.
For other studies of the relationships ainotsg banking organiza-tions iss the Eighth District, see Gerald P. Dwyer. Jr.. amsd WilliamC. Nihlack, ‘‘Branching, Holding Cosnpanies, asscl Ranking Con-centration in tlse Eighth District, this Recieiv (July 1974), PP.11—23; Ross NI. Robertson, ‘The Strstctum’e of Banking us tlseEighth District: Branches assd Mergers,” this Reciew (April 1956),pp. 45—51; and Ross NI. Robertson, ‘‘The Structure of Baisking issthe Eighth District: Chaisss, Crotsps amsd lntem’industry Cotsspeti—tion,” this Renew (October 1956), pp. 113—21.
15

FEDERAL RESERVE BANK OF ST. LOUIS OCTOBER 1983
demand in local commercial banking markets, differ-ences in state laws allowing branching and multibankholding companies, and physical space within localmarkets are considered.
The study is divided into three sections: First, defi-nitions and the measure of concentration are intro-duced. Second, the concentration of total depositsamong banking organizations in local comniercialbanking markets is reported and analyzed.4 A sum-mary and conclusions are then presented.
THE 1HEASUREMENT OFCONCENTRATION
Concentration and the Definition ofRelevant Commercial Banking Markets
Market boundaries separate sellers who competedirectly from those with whom there is no direct com-petition. Consequently, the measure of concentrationin a market depends in a critical way on the manner inwhich the boundaries of the market are defined. Allelse equal, the more narrowly defined the market, thehigher the measured concentration for a specific num-ber of firms.
The definition of a market’s boundaries depends ontwo considerations: the products that are judged to beclose substitutes and the geographic space over whichthe producers of those products compete for the samebuyers.” In this study, the product analyzed is com-
4Deposits in banking organizatiosss in the 176 observed markets areevaluated as of June 30, 1981, and come to $51.31 billion, or 86.99percesat ofthe $58.98 billion total deposits in the Eighth District onthat date. The balance of the deposits is from areas within theEightls District where specific markets were ssot defined, Foreigndeposits are not included in the calculation of total deposits.
Total deposit data are from “Report of Condition,” June 30,1981, and ‘Sssmmary of Deposits,”June 30, 1981. compiled by theFederal Deposit lissurance Corporation. Data on multihank hold-ing companies and branch relatimss are from “Bank and BranchStructure File,” Jusse 30, 1981, compiled by the Board of Gov-ernors of the Federal Reserve System from secondary sources,
5For studies treating market definition criteria, see Deane Carsonand Paul NI. Horvitz, “Concentration Ratios and Competition,”The .Vational Banking Reciew (September 1963), pp. 105—10;Stephen A. Rhoades, Stnwture-Perfonnanee Studies in Banking:A Summary and Evalaation, Staff Economic Studies 92 (Board ofCovem-nors of the Federal Reserve System, 1977); Michael E.Trebing, “The New Bank-Thrift Competition: Will It Affect BankAcquisition and Merger Analysis?” this Review (February 1981),pp. 3—11; and David 0. Whitehead, ‘Relevant Geographic Bank-ing Markets: How Should They Be Defined?’ Federal ReserveBank of Atlanta Economic Review (January/February 1980), pp.20—28.
mercial banking services. While this specification isnarrower than if thrifts were included, it is chosenbecause comnmercial banking, considered as a separateline of commerce, is the point of reference in courtdecisions and Federal Reserve System guidelines thataffect bank market concentration.6
The geographic boundaries of markets in this studyare those established by the Federal Reserve Bank ofSt. Louis in its analysis of bank holding company andhank merger applications. A frequent alternative tothis approach is to define banking markets along coun-ty or_Standard Metropolitan Statistical Area (SMSA)lines. This alternative, however, is rejected under theassumption that market boundaries need not coincidewith political boundaries.8
fl.e Selection of a Concentration Measure
Once the relevant markets are defined, the concen-tration measure must be selected and its quantitativevalue obtained for each market.
Because concentration measures are based on thebehavior of a single variable, such as capacity, valueadded or sales, the results and rankings obtained usingone variable may differ from those obtained usinganother. This is especially a problem when dealingwith commercial banks, which are multiproduct firms
°Forexample, in a Board of Governors memo on the considerationof thrifts in competitive analysis, it was concluded that:
The present general framework of conspetitive analysis shosmld con-tinue, with initial consideration always of cssmpetitive effects on thestructure and performance of commercial banking alone,
Letter, William W. Wiles, Associate Director, Division ofBankingSupervision and Regulation, Board of Governors of the FederalReserve System, to the officers in charge of Examinations, Legal,and Research Departments at all Federal Reserve Banks, June 25,1950.
For examples and explanations of the courts’ definition of com-mercial banking as a separate line of commerce, see United States
Philadelphia National Bank, 374 U.S. 321, 355—57 (1963);United States v. Connecticut NationalBank, 418 U.S. 656, 660—66(1974); and United States v. First National State Baneorporation,499 F. Supp. 793, 799-801, 810—11 (l).N.J. 1980).
7For a summary of alternative geographic market definitions inbanking structore-performance studies, see Rhoades, Struc-ture-Pemfornsance Studies, appendix table.
8The distinction between the county/SMSA market defisaition andthe definitions smsed in this study may be naore important isa prin-ciple than in effect. Of the 176 banking mam-kets examined, 99(56.25 percent) coincide with single counties, 24 (13.64 percent)coincide with two or more whole counties, and 53(30.11 percemat)coincide with parts of individual counties, whole counties plusparts of other counties or Ranally Metropolitan Areas.
16

FEDERAL RESERVE BANK OF ST. LOUIS OCTOBER 1983
and thus offer a wide range of variables as potentialcandidates for evaluation. This study focuses on totaldeposits in commercial banks because of its impor-tance in Federal Reserve Board policy decisions thataffect concentration in commercial banking markets.°
The concentration of total deposits in each localmarket is calculated using a Herfindahl index (H-index), which is the sum of the squared market sharesof the organizations in the market.’° Each bankingorganization’s share ofa market is equal to the percent-age of total deposits in the market that it controls.
The H-index is chosen over other concentrationmeasures for three reasons. First, the recently pub-lished Department of Justice merger guidelines relyprimarily on the H-index to measure concentration.”Second, unlike other widely used concentration mea-sures, the H-index is explicitly sensitive to the impacton concentration of the number of sellers in a marketand their relative sizes,’2 Third, H-index numberstranslate conveniently into “numbers-equivalents,”which are useful for making intermarket comparisonsofconcentration. The numbers-equivalent is the num-her of equally sized sellers that would generate anH-index value equal to the observed value.’3
°See,for example, orders on bank holding company eases publishedin the Federal Reserve Bulletin,
n tImoHindex = ~ (-_±-!-)~,where td~is total deposits in the ith
i=1 TDcommercial banking organization in a market, TI) is total depositsin all commercial banking organizations in that market, and n isthe number ofbanking orgassizations in that market, The H-indexcan assume a value of from 1/n through 1. As a market becomesmore concentrated, either through a decrease in the nssmnber ofsellers or a widening issequality among a given numl,er of sellers’market shares, the H-index number approaches 1.
For discussions of concentration measures, see “Measures ofBanking Structure and Competitiosa,” Federal Reserve Bulletin(September 1965), pp. 1212—2i’, and Christian Marfels, “A Bird’sEye View to Measures of Concentration,” The Antitrust Bolletin(Fall 1975). pp. 485—503.
“U.S. Department of Justice. “Merger Guidelines,” p. 28497.saTOP level concentration measssres (e.g.: three-firm, fommr-flrm or
eight-firm concentration ratios and curves) focus primarily on thesnarket shares ofthe largest firsus with passing, if any, cosasidem’a-tionofsmaller sellers in a market. Lorenzcurves measure ineqssal-ity in the distribution of mnarket shares, with no particular refer-ence to the numnber of sellers in a mnarket,
It shossld he noted that the greater semasitivity of the H-indexdoes not necessarily make it superior to other measures ofconcen-tration. The appropriateness of any measure must be judgedaccording to the theoretical relationship it is describing.
t3~rhenumbers-equivalent is the reciprocal ofthe Hem’findahl issdex
nsmtnher: 1/I-I—index.
ANALYSIS OF LOCAL MARKETCONCENTRATION
Summary of Conce-ntration i-n LocalCommercial Banking 1.-larkets
On the basis of its H-index value, each kical com-mercialbanking market in the Eighth District is placedinto one of 15 concentration categories. These cate-gories, along with their respective H-index valueranges and the numbers-equivalents indicating theleast concentrated market consistent with placementin each category, are listed in table 1, Also listed intable 1 is the distribution of all 176 markets amongH-index categories, the distribution among categoriesof markets in each state, and the distribution amongcategories of markets that cross state lines. For allmarkets taken together, the mode category is H4 (theequivalent offrom 3 to 2 equal-sized banking organiza-tions in a market), and the median is in category H5(the equivalent of from 4 to 3 equal-sized bankiugorganizations in a market).
The extent ofconcentration in the observed bankingmarkets can be further categorized according to theDepartment of Justice guidelines for evaluating hori-zontal mergers. Markets with H-index values less than0.10 are considered to be “unconcentrated,” marketswith H-index values greater than 0.18 are consideredto be “highly concentrated,” and markets with H-indexvalues between 0.10 and 0.18 are considered to he“moderately concentrated.”4 This categorization islisted in the right-hand column of table 1.
Generally, as illustrated in table 1, local commercialbanking markets in the Eighth District are highly con-centrated by the Department ofJustice criterion: over80 percent of the markets studied fall into the highlyconcentrated group. Several factors that help explainwhy concentration is higher in some markets than inothers are discussed below.
“The “unconcentrated, ““moderastely concentrated” and “highlyconcentrated” distinctions are based on post-merger H-indexvalises. The Department of Justice has indicated that it is ttnlikelyto challenge mergers in markets where the post-merger H-indexvalue is less than 0.10; unlikely to challenge mergers that increasethe Fl-index value by less than 0.01 in mnarkets where the post-merger H-index value is between 0.10 and 0.18; and unlikely tochallenge mergers that isserease the H-index value by less than0.965 in snarkets where the post-merger I-I-index value is gm-eaterthan 0.18. The Department of Jsastice also has identified otherfactors that are of consequence in evaluatimag the effects oflaorizon-tal mergers. See U.S. Department of Justice, “Merger Guide-lines,” pp. 28496—99.
17

FEDERAL RESERVE BANK OF ST. LOUIS OCTOBER 1983
Table 1
Distribution of Local Commercial Banking Markets Among Herfindahl Index andDepartment of Justice Concentration Categories
Numoe’s-Eqmmmva’ent statnsH-lmsoex rlax:rnurn rurnoe’ at A Dept at Jtislmce
Calegory VaueRarge ‘szect’rrs Markets Ak Ii IN KY MS MO TN I, M ‘ , , categories
F-il 1(1 ‘ 2 2H2’ 0.55o56to 10 ‘.8 -
H3 05to055556 2 7 2 2 3FM 033333 to 05 3 50 6 6 1 9 9 15 3 1 Highly corcertratedH5 025to033333 4 40 6 3 3 8 4 1’ 4 1 n4,rnaketslH6 02to025 5 34 58 3 5 9 1 3jH? 0.lBtoO.2 5556 4 2 1
H8 016667to018 6 5 1 2 1
H9 0.14256to0 6667 / 10 2 3 1 2F-lW Cl 12h coO 14286 8 5 1 2 Mooeralely concentratedF-ill OlUim toOA2S 9 2 1 1 ~24r”arkets)H12 0.1 toOi’lll ‘0 2
H13 008333to01 ‘2 4 1 2H14 0 07143 to 008333 14 UrconcentralcoHis 0.0625 to 0.07143 ‘6 1 ~ rnarketsl
Tolams t76 30 24 8 25 19 47 11 12
Interstate rrmarkets
“H-index . 0 55556 is the Herf noahl va’ue assocated wmth a two semier mar’et. where one semler is twice as la-ge as the other
What Factors Influence the Extent ofConcent-ratio-n?
Concentration and Demand — One factor that caninfluence concentration is the level of demand in aanarket. All other things equal, lower demand wouldbe expected to lead to fewer sellers and greater con-centration in a market. Such a relationship can beexplained on efficiency grounds. Operation belowsome specified level of output prevents a seller fromfully exploiting the scale economnies that allow unitcosts to fall as output increases. Such scale economiesresult, for example, from the utilization of specializedinputs, or efficiencies from consolidating previouslyseparate activities. The level of output at which scaleeconomies are exhausted (i.e., at which unit costs areminimized) is termed the “minimum efficient scale,”and the number of sellers that can achieve that level ofoutput is influenced by the size of the snarket as mea-sured imi terms of demand: the greater the demand in amarket, the greater the number of sellers achievingminimum efficient scale it can accommodate. As aresult of this interaction between scale econosnies anddesnand, there is an upper limit on the number of
sellers which can operate at or above a minimum
efficient level of output in a market.
In this study, total population in the market is usedas a proxy for market demand: the greater the popula-tion, the greater tlse demand. “ The distribution ofEighth District local commercial banking marketsaccording to total population is shown in table 2.
To test for the effect of demand on concentration, asimple statistical procedure is used. One hypothesis,
‘Population and related data are from 1982 Commercial Atlas and
Marketing Guide (Rand McNally amad Co., 1982), pp 94—95.130—31, 194, 320, 374—75, 377; Rand McNally Road At/as (RandMcNally amad Co., 1982), pp. 26—27; Bureau of the Census, 1980Census of Fopolation, Vol. 1, Characteristics of the Population(U.S. Government Primsting Office, 1982), Part 5, Arkansas, pp.5-8, 5-33: Part 15, Illinois, pp. t5-8. 1.5-23; Part 16, Indiana, p.16-8; Part 19. Kentucky, p. 19-8; Part 26, Mississippi, p. 26-8: Part27, Missouri, p. 27-8; Part 38, Oklahoma, p. 38-8: and Part 44,Tessnessee, p. 44-8.
It is necessary to estimate the populatiosas of markets tlaatinclude parts of counties. For these niarkets. it is assumed thatpopulation is distributed evenly across each relevant coumatv, sothat the proportion of a county’s physical space included isa amarket is equal to the prtsportion oF that cousaty ‘5 ~O~O latiossisscluded in the market.
18

FEDERAL RESERVE BANK OF ST. LOUIS OCTOBER 1983
Table 2Distribution at Local CommercialBanking Markets by otal Popu!a Ion
tat Population Number B along
(lo (basso Markets025 *1
2Slo5Ø 54tOTS 2
Ito GO
60tSQto S
gob
400 to 500
son to 900
2000 to 5000
tersned the. null ha pothesis states that H—imadex saluesin tlae 88 sanallest (least populated) markets are essentiallv the sasne on averact. as those for the 88 largest(most populated) markets The. alternative h~pothesisis that H-indt.x alues an the 88 least popul<tted markt tsar higher on ax rage, tlaan those for the 88 mostpopulated markets. Table. 3 lists the. distributionsaniong tlae 15 H-index cate.gorses of markets in the 88least populated and 88 most populated groupings
‘I he null ha potlaesis as cx aluated and re.jccted usingthe. chi-square. approximation of the kolmogorox-Smirs_iox txx-o—sample test.afi This result suggests that
Th chs-square pproxsrn itsosa of the Kolsnoooro~—Smmrno, two—41) ~nn
asnpl t st is a n II ssher ‘ n s asad n are sanapl group
szes. as_id I) s the in xuum dafferesice h tuc( n the eosaasal sta~(‘frequ -sacses of th smpk. groups as snd~st d in ass pectioma ofeach of the c stegos-m s sma which the simple roups are coropari dW hess tI_ic dcul Its d ft st statsstsc ompam-o’d ‘, sth seIne frosnth
5chi square dsstrshotaon ss tI lv, ts d~i,r es of freedom th null
h\ potht is c in he rejoeted at a partscsslar Its c I ofcosafids necwh s_itI_it calcsmlated stats tic c uds the apprOprs ateb 3 fis_ied chs—squ u-c ilue 5cc Ssdsae Smegs I \ onpa am trw Statisticsft r rIsc& has io al Sac sac s (\lcCraw lull Book Compan~ 1956) pp12 e—36
Table 3
Distribution of the 88 Least Populatedand 88 Most Populated LocalCommercial Banking Markets byHerfindahi Index Category
Her’mnaahI 88 L.past 88 MostIndex ~oputateo Populateo
~ateqory Markets MarKets
H’ 2H2 3H3 ‘1 3H4 36 14H5 22 18H6 13 2’H7 4H8 1 4H9 toH1O 5Hil 2Hl2 2H13 4H14bib 1
See lade
relatively higher levels of concentration canpected in markets with smaller populations.
he cx-
Concentration, State Banking Laws and MarketSpace — In any given market, a reorganization ofsellers that reduces their number or increases the mar-ket share of one large firm generally increases theH-index value fhr that snarket. In commercial banking,the merging of two or anore previously competingbanks into a snultibank holding company generallywould increase concentration. Sisnilarly, an increase inthe number of branches in a market by a large bankwould increase concentration if it draws deposits awayfrona smaller banks. Thus, in principle, legislationallowing multibank holding companies or branchingwould he expected to increase coracentration.
On June 30, 1981, there were several different leg-islative environmnents within which Eightla Districtbanking organizations operated. Illinois allowedneither branching nor snultibank holding companies;
TI_ic valise of tI_ic test statistic. usisag a os_ic—tailed test, is 34.57 forthe 88 least popsalated vs. 88 most populated markets con_iparison.At tI_ic 0.1 percent level, ti_is exceeds the clai—sqoare statistic withtv,’o degrees of freedom of 13.82.
19
FEDERAL RESERVE BANK OF ST. LOUIS OCTOBER 1983
Arkansas, Indiana, Kentucky and Mississippi allowedlimited branching but not multibank holding com-panies; Missouri allowed multibank holding com-panies but not branching; and Tennessee allowed bothlimited branching and multibank holding companies.5
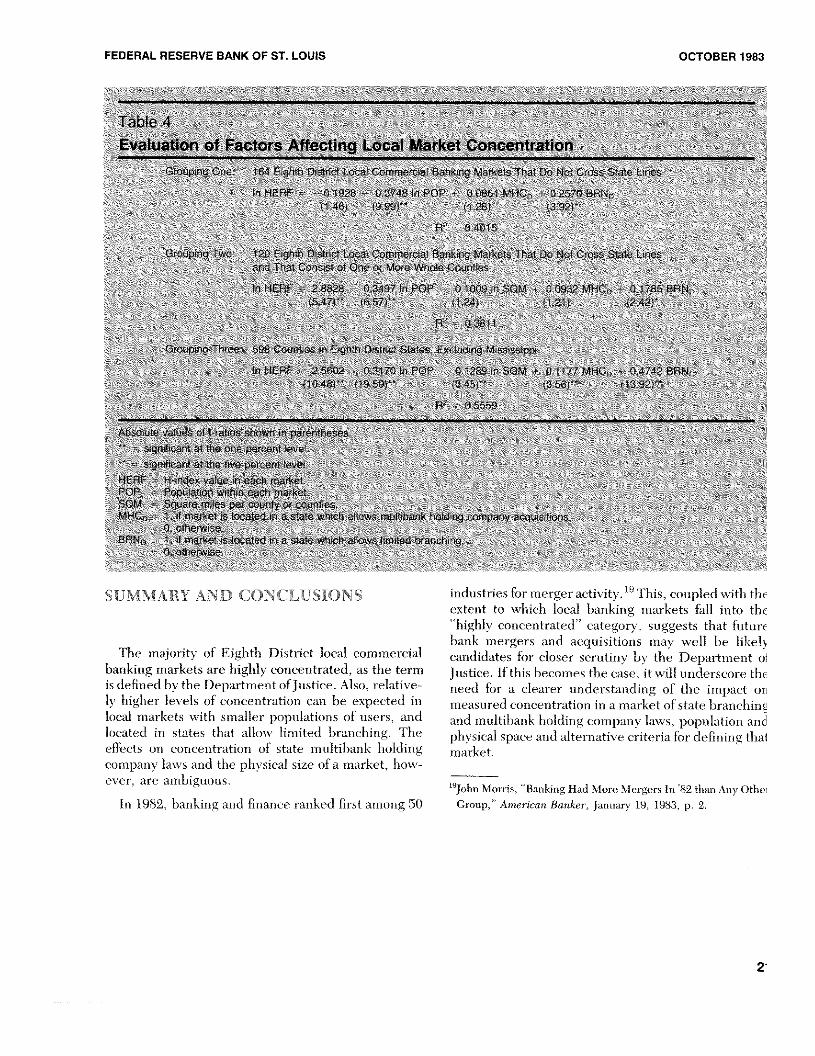
To test for the effect of state banking laws on localmarket concentration, three market groupisags areevaluated using multiple regression analysis. In thefirst grouping, the H-index values for the 164 marketsthat do not cross state lines are regressed on marketpopulation, a multihank holding company dusnsnvvariable and a branching dummy variable. In tI_icsecond and third groupings, the H-index values forlocal markets are regressed on market population, themultihank holding company dummy variable, thebranchirag dummy variable and a “square miles” vari-able, introduced to capture the effect on concesatrationof physical space within a market. All else equal, it isexpected that the greater the geographic size of a mar-ket, the larger the number of firms it can accommno-date, and the lower the concentration.
The space variable is n_ieasured in terms of squaremiles of county rather than square miles of market asdefined by competitive relationships. Therefore, thesecond grouping is limited to the 120 Eighth Districtlocal commercial banking markets that do not crossstate lines and that are made up of one or more wholecounties. The third grouping is composed of598 singlecounties in the states encompassing the Eighth Dis-trict, except Mississippi, for which there are inade-quate data.Th Market areas within these states but out-side the Eighth District are included ira tlais grouping.It is implied in the third grouping that, in all instances,the relevarat market is eqrsal to a single county. Thisgrouping is introduced to test the effects of state bank-ing laws, population and space on local market con-centration using an alternative criterion for definingrelevant markets.
57Arkasasas, Indias_ia, Kes_itucky aad Tem_inessee allowed county—widebranchis_ig. Mississippi allowed bras_icl_iing withima 100 n_iiles of ahank’s borne office,
‘5The ol_iservatioma date for the third groupis_ig of n_iarkets is Decess_i—her 31, 1981, Total depcssit data are from “Report of Condition,”Decersal_ier 31, 1981. Total deposits for cad_i ham_iking orgas_iizationin Mississippi on this date are listed according to the location oftheorganization’s main office and are not disaggregated according tobranches in different counties- Population and square miles ofcounty data are from the 1980 Census of Population sources listedin footnote 15. When a market equals a single county, the size ofthe market is equal to the square miles of the county. For thosemarkets in the second grouping that equal two or more wholecounties, the size of the market is equal to the sum of the squaremiles of the relevant counties,
The regression equation for each grouping is calcu-lated in its natural log form, and the results are pre-sented in table 4. As illustrated, the explanatory vari-ables have the expected signs. For each grouping, localmarket concentration increases with decreases inpopulation and with the introduction of state bankinglaws allowing multihank holding companies and lim-ited branching. In tile second and third groupings,where size of county is introduced, concentration in-creases as the space withira the relevantly defined mar-kets decreases.
Unfortunately, there is some variation ira the statis-tical significance attached to these variables in explain-ing levels of local market concentration. Populationavithin the relevantly defined market area is a signifi-cant explanatory variable irrespective of the marketgrouping chosen. This supports the conclusion of thenonparametric test of population and concentrationpresented in the preceding section.
The presence or absence of state branching laws alsois significant in explaining local n_iarket concentrationusing each market grouping. Its statistical significancedeclines somewhat, however, when applied to the 120Eighth District markets that cover one or more wholecounties, compared with its impact in the other twogroupings.
The performance ofthe size of county and multihankholding company variables is mixed. Size of county issignificant fir the 598 county markets grouping, hutnot for the 120 Eighth District markets coveringone ormore whole counties. Likewise, while multihank laold-ingcon_ipany laws are statistically significant inexplain-ing concentration where markets are defined to hesingle counties, they lose their explanatory powerwhen applied to the two groupings derived from tlaeFederal Reserve Bank of St. Louis market definitions.
Tlaus, the results of the evaluations suggest thatbranching laws tend to significantly increase local mar-ket concentration. The impact of multihank holdingcompany laws is unclear; its significance depends uponhow the market is defined.
The results in table 4 indicate the problems iraherentin determining useful definitioras of banking markets.While the explanatory variables perform best when tlaemarkets are defined alorag singlecounty lines, the cate-gorical definition of a county as a market is conceptu-ally empty. It takes no account of the actual state ofinterseller rivalry; yet, the notion of interseller rivalryrepresents the underlying reason for sneasuring mar-ket concentration in the first place.
20
FEDERAL RESERVE BANK OF ST. LOUIS OCTOBER 1983
N N / ‘K N’ // /‘K’’ ,‘,/N’,, N / N,,’’ / ,‘ X ~
N / /‘‘K./~,N, /\,‘
N NN / N “ / /N’ ~
EvslOaflonMFa~torp~AttecttngLtcatMa*etC*SsdraUon.N / N/
‘P64 Dlot’ CoflI(b ‘Ma C
N \flEnp N 85 N NN ‘I N~ N N
N N N N N N
N N n_i I o>tidrNk
N Ni’cN N
N N’ N N ,~ NN N N N
NY N,, N ‘ .N N N N /
N N / / / N N
N / N N N N / N
N N / // /N N~ N
N’/N // / / 0 / NN ‘K r / N N N NN /NN
N’’ , N’ ‘ ‘, N ‘ N ‘ ‘ ‘ / f/N’
/ /N N / / / ‘K N ‘KNN/N, ~/N/J
7,) /< ~, ‘ ,. ‘K~NN,, - \, NY, • “‘~‘ N
/ N / / / N / / ~ NJ N N N N
///‘ N / ~/ /N / / N N’ N/
N // / N N N NN N /
N’ ~/ / / N N~ N N // N / N N /
N NN N N /N N / / N~ N / N ~ N N~
/ / ,‘ /, / , , *Sll~ø* //Nf • “N / N’
N N
4 loSifi (aft N ~0bIt’~° N N ‘K
N ~ N
industries for merger activita - K’~This, coupled xs ith thextent to wl_iich local banking markets fall snto ti_ic“highly conceratrated” categor~ suggests that futureharak snergers and acquisitions may well he likel\candidates for closer scrutiny hx the Department oJustice. If this hecon_ies tht case, it will tirades score. ti_id
need for a clearer undc a tanding of the impact os_imeasured concentration in a snarket of statc branchirafarad snultihank holding comp-ina laws, popul-ition andplaysical space and alternatix e crateria for defining thaimarket.
‘°JohnMorris, “Banking Had More Mergers to ‘82 tlaan Any Othei
Group,” American Banker, Januara’ 19, 1983, p. 2.
SUMMARY AND CONCLUSIONS
TI_ic majority of Eighth District local commercialbanking markets are highly concentrated, as the termis defined by the Department ofjustice. Also, relative-ly higher levels of concentration c--an he expected inlocal markets with smaller populations of users, andlocated in states that allow limited branching. Theeffects on concentration of state multibank l_ioldingcompaaay laws and tlae pl_iysical size of a snarket, how-ever, are asnl_iiguorss.
in 1982, banking as_id finance ranked first among 50
2