concentration effect and reaction rate - hkedcity.net st. clare's girls' school date : f.6...
TRANSCRIPT
EXPERIMENT St. Clare's Girls' School DATE : F.6 Chemistry
Concentration Effect and Reaction Rate
Purposes
1. To investigate the dependence of reaction rate on concentration for the reaction between S2O32-(aq) and H+(aq).
2. To establish the rate equation for the reaction between S2O32-(aq) and H+(aq). Introduction
Sodium thiosulphate, Na2S2O3, reacts with dilute acids to form yellow precipitates of sulphur. S2O32-(aq) + 2H+(aq) → S(s) + SO2(g) + H2O(l) Instead of measuring the rate of decrease in concentration of the reactants, rate of formation of a fixed amount of sulphur is selected as the variable for measurement. As the formation of sulphur depends on the consumption of S2O32-(aq), the rate of decrease in concentration of S2O32-(aq) is measured indirectly in the experiment. Safety
Sulphur dioxide produced in the reaction is toxic. Never smell the gas directly. The experiment should be performed in a well-ventilated laboratory. Avoid skin contact with the chemicals.
Materials and Apparatus
1 M H2SO4(aq) 0.25 M Na2S2O3(aq), deionized water Two 8-well reaction strips, micro-tip plastic pipette, stopwatch, 50 cm3 beaker, micro-stirrer or toothpicks, cotton swabs, a piece of white paper, pencil, light table (if available). Experimental Procedures
(A) Effect of varying concentration of S2O32-(aq)
1. Using clean micro-tip plastic pipettes, transfer drops of 0.25 M Na2S2O3(aq) and deionized water to a clean 8-well reaction strip (Strip A) according to the following scheme:
Well no. A1 A2 A3 A4 A5 A6 A7 Drops of Na2S2O3(aq) 1 2 3 4 5 6 7 Drops of DI water 6 5 4 3 2 1 0
2. Transfer drops of 1 M H2SO4(aq) and deionized water to another 8-well reaction
strip (Strip B) as follows:
Well no. B1 B2 B3 B4 B5 B6 B7 Drops of H2SO4(aq) 7 7 7 7 7 7 7 Drops of DI water 2 2 2 2 2 2 2
IRRITANT
EYE PROTECTIONMUST BE WORN

3. Rest a 8-well reaction strip on a piece of white paper and trace its shape by a pencil.
Mark a cross (X) on each of the 7 well images. (Place the piece of white paper on top of a light table, if available).
4. Invert Strip A, stack it atop Strip B so that the wells of strip A is directly above those of strip B.
5. Hold the two strips firmly and lower them suddenly so that the solution mixtures in the wells mix together (“shake-down technique”). Start the stop watch at the same time.
6. Shake down all the solution to Strip B. Detach Strip B from the double arrangement and place it on the white paper over the array of crosses.
7. Record the time (t) taken for the total disappearance of each cross.
8. To prevent the colloidal sulphur from sticking onto the wells, use a micro-tip plastic pipette to withdraw the product mixtures immediately after the experiment and dispose them of into a waste beaker. Clean the wells with a wet cotton swab together with some detergent and finally rinse with tap water.
Fig.1 Experimental set-up Fig. 2 Viewing “X” disappearance
(B) Effect of varying concentration of H+(aq)
9. Using clean micro-tip pipettes, transfer 1 M H2SO4(aq) and deionized water to a clean 8-well reaction strip (Strip A) according to the following scheme:
Well no. A1 A2 A3 A4 A5 A6 A7 Drops of H2SO4(aq) 1 2 3 4 5 6 7 Drops of DI water 6 5 4 3 2 1 0
10. Transfer 0.25 M Na2S2O3(aq) and deionized water to another 8-well reaction strip
(Strip B) as follows:
Well no. B1 B2 B3 B4 B5 B6 B7 Drops of Na2S2O3(aq) 7 7 7 7 7 7 7 Drops of DI water 2 2 2 2 2 2 2
11. Repeat steps (4) to (8).

Results
Complete the following table:
Part A Part B Relative conc. of S2O32(aq)
ln[S2O32-(aq)] t /s Relative conc. of H2SO4(aq)
ln[H+(aq)] t /s
1 0.00 1 0.00 2 0.69 2 0.69 3 1.10 3 1.10 4 1.39 4 1.39 5 1.61 5 1.61 6 1.79 6 1.79 7 1.95 7 1.95
Treatment of Data
Start the Excel program and complete the above table. Highlight the figures in the ln[S2O32-(aq)] and t columns and executes the Graph Wizard function. Choose the X-Y scattered plot option and streamline the graph plotted by giving a title and labeling the axes. Discussion Questions
1. Deduce the order of reaction with respect to S2O32-(aq) from the graph of ln[S2O32-(aq)] against t.
2. Deduce the order of reaction with respect to H+(aq) by inspecting values of t.
3. Deduce the rate equation for the reaction.
EXPERIMENT St. Clare's Girls' School DATE : F.6 Chemistry
Investigation of the Overall Order of Reaction
between Hydrogen Peroxide and Iodide in Acidic Medium (Iodine Clock Reaction)
Purposes
To determine the kinetic order of the reaction between H2O2(aq) and I-(aq) in acidic media with respect to 1. H2O2(aq), 2. I-(aq) and 3. H+(aq). Introduction
The kinetics of the reaction:
H2O2(aq) + 2I-(aq) + 2H+(aq) → I2(aq) + 2H2O(l)
can be investigated by the introduction of a small and fixed amount of S2O32-(aq) and starch indicator. H2O2(aq) + 2I-(aq) + 2H+(aq) → I2(aq) + 2H2O(l) ……….. main reaction
2S2O32-(aq) + I2(aq) → S4O62-(aq) + 2I-(aq) …….monitor reaction Starch solution + I2(aq) → blue complex ………… ..indicator reaction The added S2O32-(aq) consumes the I2(aq) produced from the main reaction. As long as there are S2O32-(aq) ions in the reaction mixture, I2(aq) formed from the main reaction will be instantaneously consumed by the S2O32-(aq) ions and the starch indicator will not be affected. However, when all S2O32-(aq) ions are consumed, the I2(aq) starts to form and will immediately turn the starch indicator to deep blue. The overall result is that upon mixing different amounts of H2O2(aq), I-(aq), H+(aq), S2O32-(aq) and starch indicator, no change will be observed at the start of the experiment, but the reaction mixture suddenly changes to deep blue after a period of time. The time elapsed before the development of the blue colour depends on the amount of S2O32-(aq) used. The greater the amount of S2O32-(aq) is used, the longer will be the time taken for the development of colour. Thus the reaction responsible by the S2O32-(aq) is also known as the monitor reaction, as it controls the time taken for the development of colour. Reactions using the above technique are collectively classified as ‘clock reactions’. If iodine is used to indicate the reaction time, it is called an iodine clock reaction. Likewise, if bromine is used, it is called a bromine clock reaction. Kinetic interpretation of clock reactions
Time elapsed for colour development indicates the time (t) taken for the formation of a certain amount of iodine from the main reaction. 1/t would be proportional to the rate of formation of this amount of iodine. 1/t would also be proportional to the initial rate of decrease in concentration of I-(aq) or H2O2(aq) if the amount of iodine formed is small or if the amount of S2O32-(aq) used is small. Hence there is a need to use small amount of S2O32-(aq). Order of the reaction w.r.t. I-(aq) will be investigated by keeping concentrations of H2O2(aq) and H+(aq) constant while varying the concentration of I-(aq) in the ratio of 1 : 2 : 4 : 8. If the ratio of (1/t)

doubles each time, the order of reaction w.r.t. to I-(aq) will be determined as 1. If the ratio of (1/t) remains unchanged, the order can be regarded as zero. The experiment is then repeated for determining orders for H2O2(aq) and H+(aq). Safety
Avoid skin contact with the chemicals. Materials and Apparatus
About 20 cm3 of each of the following solutions in labelled plastic bottles:
1.50% H2O2(aq)
0.60 M H2SO4(aq), 0.60 M KI(aq), 0.08 M Na2S2O3(aq), starch solution, deionized water. Two 8-well reaction strips, micro-tip plastic pipette, stop watch, microspatula. Experimental Procedures
(A) Kinetic order w.r.t. iodide ion
1. Using a fresh and clean micro-tip plastic pipette, transfer 1 drop each of 1.5% H2O2(aq), 0.6 M H2SO4(aq) and starch indicator solution to 4 separate wells of a 8-well reaction strip (call it strip A) so that each well has a total volume of 3 drops.
2. Take another 8-well reaction strip (call it strip B), again using a fresh and clean micro-tip plastic pipette, transfer 1 drop of 0.08 M Na2S2O3(aq) to each of the first 4 wells.
3. Into the same 8-well reaction strip, place 1 drop of 0.6 M KI(aq) to the first well, 2 drops to the second, 4 drops to the third and 8 drops to the fourth. Add 7 drops of deionized water to the first well, 6 drops to the second and 4 drops to the third so that the total volume of reactant mixture in each of the 4 well of strip B is 9 drops. (see Table A)
4. Stir the solution mixture in each of the wells of strip B with a microspatula.
5. Invert strip B and stack it atop strip A so that the first 4 wells of strip B is directly above the first 4 wells of strip A.
6. Hold the two strips firmly together by means of two small pieces of rubber tubing, one at each end and lower the strip combination suddenly (“shake-down” technique) so that the two solution mixtures mix thoroughly (see Figure 2). Start the stop watch at the same time.
7. Turn the strip combination upside down repeatedly and look for the sudden appearance of a deep blue colour. Record the time taken. Carry on recording time until all the 4 wells have developed colour in the correct sequence.
8. Clean the reaction strips thoroughly with deionized water and empty the water in the wells.
IRRITANT
EYE PROTECTIONMUST BE WORN

Fig. 1 Size of 8-well reaction strip Fig. 2 The “shake-down” technique
Table A
Number of drops
Strip A Strip B
Well H2O2(aq) H2SO4(aq) Starch
solution I-(aq) H2O(l)
0.08M S2O32-(aq)
1 1 7 2 2 6 3 4 4 4
1 1 1
8 0
1
(B) Kinetic order w.r.t. H2O2
9. Repeat steps (1) to (8) according to Table B.
Table B Number of drops
Strip A Strip B
Well I-(aq) 0.08 M
S2O32-(aq) Starch
solution H2O2(aq) H2O(l) H2SO4(aq)
1 1 7 2 2 6 3 4 4 4
1 1 1
8 0
1
(C) Kinetic order w.r.t. H+
10. Repeat steps (1) to (8) according to Table C.
Table C:
Number of drops
Strip A Strip B
Well I-(aq) 0.08M
S2O32-(aq) Starch
solution H2SO4(aq) H2O(l) H2O2(aq)
1 1 7 2 2 6 3 4 4 4
1 1 1
8 0
1

Results
(If initial rate doubles when the concentration of a species is doubled, the reaction is first order with respect to that species)
Discussion Questions
1. With the help of an appropriate sketch, illustrate the meaning of “initial rate”.
2. Why is it assumed that in order to obtain initial rate, time (t) has to be small?
3. Why are initial rate preferred to rates at other times of a reaction, i.e. instantaneous rates?
4. Why the amount of S2O32-(aq) added to the reaction mixture has to be small?
5. From the deduced order of each of the reactants, give a rate equation for the reaction.
6. A mechanism for the reaction consists of the following three elementary steps:
H2O2(aq) + I-(aq) → X + H2O(l) …………. (slow) H+(aq) + X → Y …………………. (fast)
Y + H+(aq) + I-(aq) → I2(aq) + H2O(l) ……... (fast) Suggest species for X and Y in the above elementary reactions in order that the rate expression
for the rate determining step fits with the experimental rate equation.
Variable Relative
concentration t (s)
Rel. initial rate,1/t (s-1)
Deduced order
1 2 4
[I-(aq)]
8
1 2 4
[H2O2(aq)]
8
1 2
4 [H+(aq)]
8

EXPERIMENT St. Clare's Girls' School DATE : F.6 Chemistry
Kinetics of Iodination of Propanone by Colorimetry
Purpose
To determine the rate equation of the reaction between acidified propanone solution and iodine.
Introduction
As the following reaction proceeds,
CH3COCH3(aq) + I2(aq) → CH3COCH2I(aq) + H+(aq) + I-(aq) colourless (brown/yellow) colourless colourless
the concentration of iodine decreases and the brown/yellow colour intensity of the reacting solution also decreases. The change in colour intensity allows the use of colorimetry to follow the reaction kinetics. For dilute solutions, absorbance is proportional to concentration. Decrease in concentration of species can be measured by the change in absorbance. Relative rate of disappearance of iodine, in terms of decrease in absorbance and not in terms of actual decrease in concentration of iodine, is measured from the absorbance vs time plot. This avoids the time-consuming conversion to concentration units using a calibration curve. Order of reaction with respect to each reactant is determined by separately doubling the concentrations of each of CH3COCH3(aq), H+(aq) and I2(aq). A first order reaction with respect to CH3COCH3(aq) is confirmed when, while keeping the concentrations of I2(aq) and H+(aq) constant, the initial rate of decrease in concentration of I2(aq) (or the initial rate of decrease in absorbance) doubles as the concentration of CH3COCH3(aq) is doubled. Safety
Avoid skin contact with chemicals.
Materials and Apparatus
1 M sulphuric acid, 1 M propanone solution 0.02 M iodine solution, deionised water, a datalogger with colorimeter accessories, computer, micro-tip plastic pipette, 5 cm3 graduated pipette.
IRRITANT
EYE PROTECTIONMUST BE WORN

Experimental Procedures
Part A: Calibration of the colorimeter
1. Set up the interface box and connect it to the computer. Calibrate the colorimeter as described in the manual that accompanies with the commercial datalogger. A blue filter should be used for the experiment.
Part B: Kinetic runs
2. Start the program for colorimetry with graphical display. Choose the option for transmittance and a time interval of 10 minutes.
3. Using a clean graduated pipette, transfer 0.75 cm3 of 1 M propanone and 0.75 cm3 1 M sulphuric acid into a clean cuvette. Add 1.50 cm3 of deionised water. Mix the solution well by capping the cuvette and inverting it upside down for three times.
4. Uncap the cuvette, and using a micro-tip plastic pipette, quickly add 30 drops of 0.02 M iodine solution. Cap the cuvette, lower it into the cell compartment of the colorimeter and start recording at the same time.
5. Stop recording when the transmittance signal flattens.
6. Convert the OY axis to absorbance scale and measure the initial rate of decrease in absorbance according to the software manual. Save the data file.
7. Repeat steps (3) to (6) with other runs according to the following scheme.
Run Vol. of 1 M Propanone
/cm3
Vol. of 1 M sulphuric acid/cm3
Vol. of deionised water/cm3
No. of drops of 0.02 M
I2(aq)
No. of drops of deionised water
1 0.75 0.75 1.50 30 - 2 1.50 0.75 0.75 30 - 3 0.75 1.50 0.75 30 - 4 0.75 0.75 1.50 15 15
(Adjust volume or no. of drops accordingly to size of cuvette used)
Fig. 1: Setup for colorimetric measurement.

Treatment of Data
From the absorbance vs time plot, calculate the relative initial rate of decrease in concentration of iodine for the following cases: 1. Doubling the concentration of propanone
Run Rel. concentration
of propanone
Initial rate of decrease in conc.
of I2(aq)
Rel. initial rate of decrease in conc. of I2(aq)
Order w.r.t. propanone(aq)
1 1 2 2
2. Doubling the concentration of sulphuric acid
Run Rel. concentration
of H+(aq)
Initial rate of decrease in conc.
of I2(aq)
Rel. initial rate of decrease in conc. of I2(aq)
Order w.r.t. H+(aq)
1 1 3 2
3. Doubling the concentration of iodine solution.
Run Rel. concentration
of I2(aq)
Initial rate of decrease in conc.
of I2(aq)
Rel. initial rate of decrease in conc. of I2(aq)
Order w.r.t. I2(aq)
4 1 1 2
Discussion Questions
1. Deduce the kinetic order of the reaction w.r.t. (i) propanone, (ii) H+(aq) and (iii) I2(aq), and hence the experimental rate equation for the reaction.
2. The role played by H+(aq) in the reaction is suggested to involve the formation of a –C(OH)=C- group (enol) from the –CO- group (keto) [ketoenol tautomerism]. Propose a mechanism for the reaction that agrees with the experimental rate equation.

EXPERIMENT St. Clare's Girls' School DATE :
F.6 Chemistry
To Determine the Activation Energy of the Reaction between Bromide Ion and Bromate(V) Ion in Acid Solution
Introduction
The reaction can be represented by
BrO3- (aq) + 5Br- (aq) + 6H+ (aq) → 3Br2 (aq) + 3H2O (aq)
The progress of the reaction may be followed by adding a fixed amount of phenol together with some methyl red indicator. The bromine produced during the reaction reacts very rapidly with phenol
OH OHBr Br
Br
+ Br23 + 3 HBr
Once all the phenol is consumed, any further bromine bleaches the indicator immediately. Therefore, the time for the reaction to proceed to a given point may be determined. Apparatus
• Beaker • thermometer • boiling tube • burettes • Bunsen burner • stop-watch Chemicals
• 0.01 M phenol solution • 0.083 M KBr / 0.017 M KBrO3 solution • 0.5 M H2SO4 • methyl red indicator Procedure
1. Place 10.00 cm3 of 0.01 M phenol solution, 10.00 cm3 0.083 M KBr/ 0.017 M KBrO3 mixture and 10 drops of methyl red indicator into the FIRST boiling tube.
2. Place 5.00 cm3 of 0.5 M H2SO4 in the SECOND boiling tube
3. Place BOTH boiling tubes into a large beaker of water which is maintained between 49°C - 51°C by careful warming. Suitably clamp the FIRST boiling tube and place a thermometer in this solution. Allow the contents of the tubes to reach the temperature of the water bath (± 1°C) and wait until the temperature remains to be constant.
4. Pour the entire 5.00 cm3 H2SO4 into the clamped boiling tube, and swirl gently.
5. The clamped tube should remain in the water bath throughout the experiment. Record the time, to the nearest second, from the moment of mixing to that of complete disappearance of red colour.
6. Record also the temperature, to the nearest degree, of the content of the clamped tube at the end of the experiment.
7. Repeat this experiment, at about 45°C, 40°C, 35°C and 30°C. Record your result in the table below.
run Temperature /°C Temperature (T) / K Time (t) / sec In 1/t 1/ T
1
2
3
4
5

Questions
1. Why does the reaction not start until the contents of the boiling tubes are mixed?
__________________________________________________________________________________________________
__________________________________________________________________________________________________
2. What function does methyl red play in this experiment? (Hint: it is not acting as an indicator in the accepted sense.)
__________________________________________________________________________________________________
__________________________________________________________________________________________________
3. Why is it unsatisfactory to measure the reaction rate at high temperature such as 80°C?
__________________________________________________________________________________________________
__________________________________________________________________________________________________
4. Why is it not necessary to know far the reaction has proceeded at the point where the methyl red is decolourised?
__________________________________________________________________________________________________
__________________________________________________________________________________________________
__________________________________________________________________________________________________
5. Arrhenius equation is given as RTE
Aek−
= . What do k and E represent?
__________________________________________________________________________________________________
6. Can 1/t replace k in the Arrhenius equation? Why?
__________________________________________________________________________________________________
__________________________________________________________________________________________________
7. Derive another equation to relate ln k and 1/T.
__________________________________________________________________________________________________
8. Plot a suitable graph to calculate E. Show your calculation clearly. (R = 8.31 J K-1mol-1)
__________________________________________________________________________________________________
__________________________________________________________________________________________________
__________________________________________________________________________________________________
__________________________________________________________________________________________________
9. Explain why temperature can affect reaction rate.
__________________________________________________________________________________________________
__________________________________________________________________________________________________
__________________________________________________________________________________________________
__________________________________________________________________________________________________

10. Explain the fact that the reaction with low activation energy proceeds faster.
__________________________________________________________________________________________________
__________________________________________________________________________________________________
__________________________________________________________________________________________________
__________________________________________________________________________________________________
__________________________________________________________________________________________________
11. What thermodynamic sign does ∆E have? What does it signify?
__________________________________________________________________________________________________
__________________________________________________________________________________________________
__________________________________________________________________________________________________
(Attach your graph here.)

EXPERIMENT St. Clare's Girls' School DATE : F.6 Chemistry
Determination of Dissociation Constants
Of Weak Acids By pH Measurements Introduction
For a weak acid, HX, dissociating according to the equation
HX ↔ H+ + X-
The dissociation constant, Ka, is given by
][]][[
HXXH
K a
−+= …… equation 1
where [H+], [X-] and [HX] are the molar concentrations at equilibrium. Now if the acid is a weak acid (i.e. a weak electrolyte), and its salts are strong electrolytes. Then for a mixture of the acid with one of its salts, it may be possible to assume that
[HX] ≈ total acid concentration [X-] ≈ total salt concentration
Using these assumptions, and rearranging equation 1, we have
][
][][
−+ =
X
HXKH a and thus
total
totala
saltacidK
H][
][][ ≈+
If the concentrations of the acid and salt in the mixture are equal, i.e. when the acid in the mixture is exactly half-neutralized,
[acid]total = [salt]total
[ H+ ] = Ka
pH = pKa Procedure
1. Calibrate a pH meter, using a buffer solution accurately known pH.
2. Pipette 20.0 cm3 of 0.10 M ethanoic acid into a conical flask.
3. Titrate with 0.10 M sodium hydroxide solution, using phenolphthalein as indicator, until the solution is just pink.
4. Add a further 20.0 cm3 of the same ethanoic acid solution to the flask and mix thoroughly.
5. Determine the pH of the resulting solution.
6. Repeat the above procedure but substituting for the acetic acid (a) 2-chloroethanoic acid, (b) 2,2-dichloroethanoic acid.
7. Calculate Ka and/ or pKa of the three acids used.
Questions
1. If the titre were, say 22.0 cm3, should one add a further 25.0 cm3 of acid, or a further 22.0 cm3 of acid? Explain.
2. How do the values you obtained for Ka compare with the literature values? Which values show the greatest divergence from the accepted values? What explanation can you offer for the divergence of these results from the accepted values?
3. What suggestions can you make to explain the relative values of Ka for the three acids?
4. Could this method be used to determine the dissociation constant of weak bases? If you think so, suggest how you would determine Kb for ammonia.
EXPERIMENT St. Clare's Girls' School DATE : F.6 Chemistry
Acid-Base Titration Curves
(Double Indicators) Purposes
To determine the composition of the following mixture by double indicator method: 1. NaOH(aq) and Na2CO3(aq)
2. NaHCO3(aq) and Na2CO3(aq) Introduction
Consider a mixture of NaOH(aq) and Na2CO3(aq). Reaction between HCl(aq) and Na2CO3(aq)
takes place in two stages:
HCl(aq) + Na2CO3(aq) → NaHCO3(aq) + H2O(l) …………………. (1) HCl(aq) + NaHCO3(aq) → NaCl(aq) + CO2(g) + H2O(l) …………. (2)
While that between HCl(aq) and NaOH(aq) completes in only one step:
HCl(aq) + NaOH(aq) → NaCl(aq) + H2O(l) ……………….………. (3)
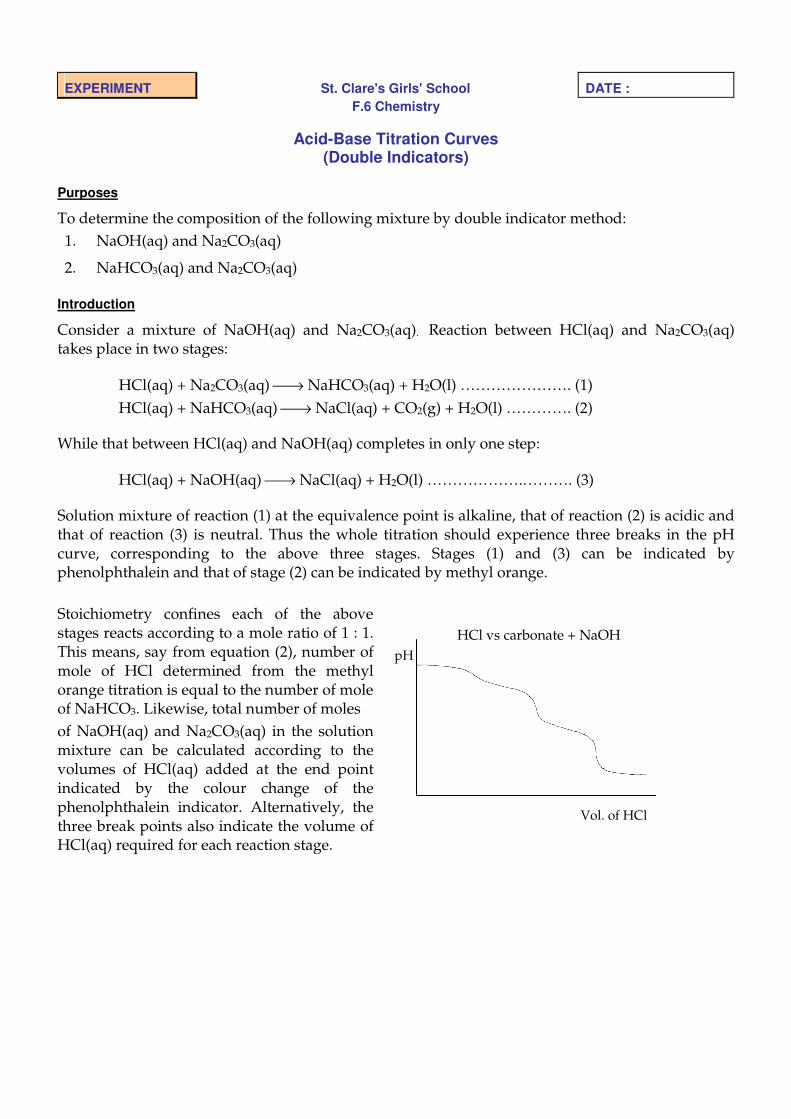
Solution mixture of reaction (1) at the equivalence point is alkaline, that of reaction (2) is acidic and that of reaction (3) is neutral. Thus the whole titration should experience three breaks in the pH curve, corresponding to the above three stages. Stages (1) and (3) can be indicated by phenolphthalein and that of stage (2) can be indicated by methyl orange. Stoichiometry confines each of the above stages reacts according to a mole ratio of 1 : 1. This means, say from equation (2), number of mole of HCl determined from the methyl orange titration is equal to the number of mole of NaHCO3. Likewise, total number of moles of NaOH(aq) and Na2CO3(aq) in the solution mixture can be calculated according to the volumes of HCl(aq) added at the end point indicated by the colour change of the phenolphthalein indicator. Alternatively, the three break points also indicate the volume of HCl(aq) required for each reaction stage.
HCl vs carbonate + NaOH pH
Vol. of HCl

For the case of HCl(aq) vs a mixture of NaHCO3(aq) and Na2CO3(aq), only two break points are expected. Volume of HCl(aq) added for each break point can be easily obtained by observing either the colour change at the end point or the shape of the titration curve.
HCl vs carbonate + hydrogencarbonate pH
Vol of HCl Safety
Avoid skin contact with chemicals. Any acid or alkali spilt should be thoroughly washed with tap water. Materials and Apparatus
Phenolphthalein indicator, methyl orange indicator
Standard 0.15 M and 0.2 M HCl(aq), solution mixture of NaOH and Na2CO3, solution mixture of Na2CO3 and NaHCO3, deionized water, A commercial data logger with pH sensor, computer, magnetic stirrer, small beaker, burette and pipette, stand and clamp Experimental Procedures
(A) 0.15 M HCl(aq) vs solution mixture of sodium carbonate and sodium hydroxide using phenolphthalein indicator followed by methyl orange indicator
1. Setup the interface box and connect it to the computer. Arrange the setup for pH determination as described in the lab manual that goes with the commercial data logger. The pH sensor should be calibrated before use.
2. Pipette 25 cm3 of the solution mixture into a small beaker and add 2 drops of phenolphthalein indicator. Place a stirrer bar into the alkaline solution and rest the beaker on a magnetic stirrer which is covered by a white tile. Switch on the magnetic stirrer. Lower the pH electrode into the alkaline solution, ensuring that the glass bulb is completely immersed while the stirrer bar is spinning smoothly (see Fig. 1).
Fig. 1 Setup for pH datalogging
3. Start the datalogging software and select the pH sensor with graph display screen
format. Set the pH value limits from 0 to 13. The logging mode is set to manual operation with readings taken for each cm3 addition of the titrant.
EYE PROTECTIONMUST BE WORN
FLAMMABLE
4. Fill the burette with 0.15 M HCl(aq). Open the stopcock of the burette and start recording at the same time. When approaching the first end point, as judged by the disappearance of the red colour of the solution in the beaker, adjust interval additions each to 0.50 cm3. Allow time for the evolution of CO2 gas bubbles as their presence round the glass bulb of the electrode may interfere with pH measurements.
5. Observe the colour change of the reaction mixture in the beaker and the display of pH variation in the monitor screen carefully when the titration passes the first end point.
6. Add 3 drops of methyl orange indicator when the reaction mixture becomes colourless. Look for the second end point and continue titration as in step 4 until a total volume of 50 cm3 of the titrant has been added.
7. Save the data file.
8. Carefully empty the contents of the beaker, pay special attention to retain the small stirrer bar. Clean the pH electrode with D.I. water.
(B) 0.20 M HCl(aq) vs solution mixture of sodium carbonate and sodium hydrogencarbonate
using phenolphthalein indicator followed by methyl orange indicator
9. Repeat steps (2) to (8), using a solution mixture of sodium carbonate and sodium hydrogencarbonate.
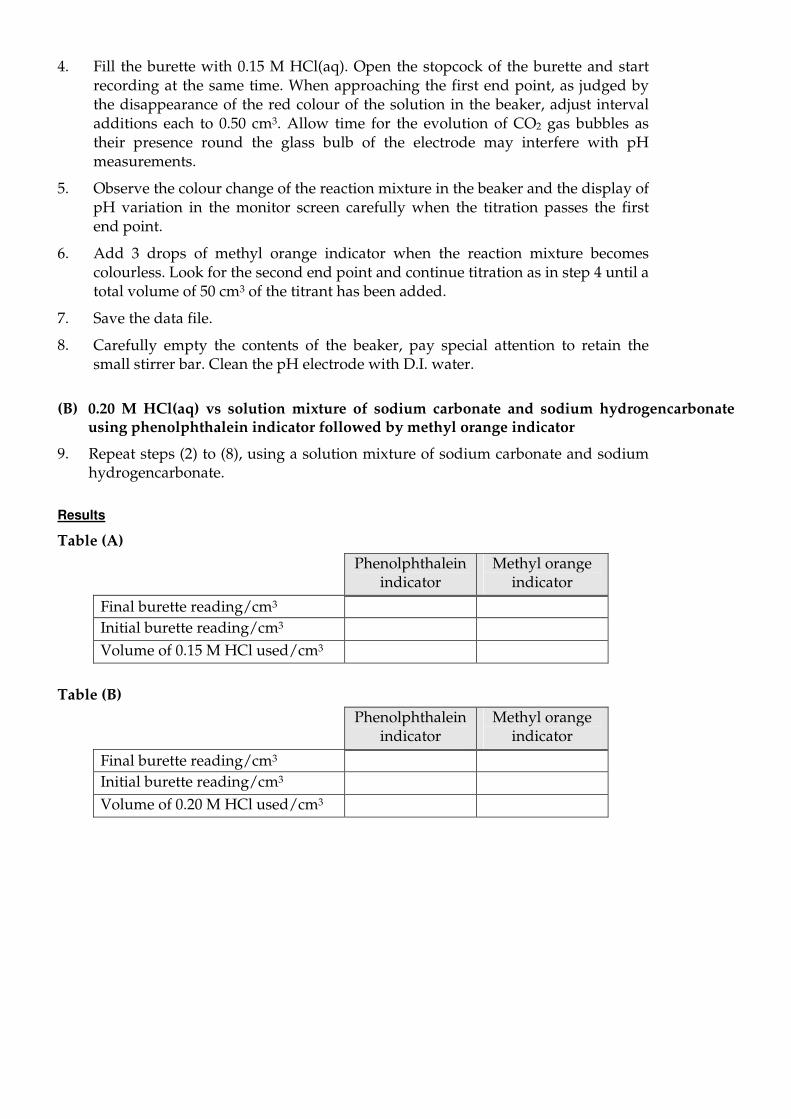
Results
Table (A) Phenolphthalein
indicator Methyl orange
indicator
Final burette reading/cm3 Initial burette reading/cm3 Volume of 0.15 M HCl used/cm3
Table (B)
Phenolphthalein indicator
Methyl orange indicator
Final burette reading/cm3 Initial burette reading/cm3 Volume of 0.20 M HCl used/cm3

Treatment of Data
Part (A)
1. From the methyl orange end point, calculate the number of moles of 0.15 M HCl(aq) added and hence the number of moles of Na2CO3 in 25 cm3 of the alkaline solution mixture.
2. From the phenolphthalein end point, calculate the number of moles of 0.15 M HCl(aq) added and hence the total number of moles of NaOH(aq) and Na2CO3(aq) in 25 cm3 of the alkaline solution mixture.
3. Calculate the number of mole of NaOH(aq) in 25 cm3 of the alkaline solution mixture.
4. Calculate the mass of Na2CO3(aq) and NaOH(aq) in 1 dm3 of the solution mixture respectively.
Part (B)
1. From the methyl orange end point, calculate the number of moles of 0.2 M HCl(aq) added and hence the number of moles of Na2CO3(aq) in 25 cm3 of the alkaline solution mixture.
2. From the phenolphthalein end point, calculate the number of moles of 0.2 M HCl(aq) added and hence the number of moles of NaHCO3(aq) in 25 cm3 of the alkaline solution mixture.
3. Calculate the mass of Na2CO3 and NaHCO3 in 1 dm3 of the solution mixture respectively.
Discussion Questions
1. Explain why some breaks of the pH curve are more significant but some are less significant.
2. Suggest and explain other indicators that can be used in place of methyl orange and phenolphthalein.
3. From the shape of the pH titration curve plotted and the criterion for the choice of indicator, comment on the reliability of the method as applied to the case of NaOH/Na2CO3 and Na2CO3/NaHCO3 mixtures.
4. Can the same method be applied to determine the concentrations of Na3PO4 and NaH2PO4 in a solution mixture of the two salts? What factors should be considered?

EXPERIMENT St. Clare's Girls' School DATE : F.6 Chemistry
Ksp of Calcium Hydroxide
Purpose
To determine the solubility product of calcium hydroxide. Introduction
Calcium hydroxide dissolves slightly and ionizes partly in water: Ca(OH)2(s)+ aq Ca2+(aq) + 2OH-(aq)
For a saturated solution of calcium hydroxide (lime water), concentration of OH-(aq) ions doubles that of the Ca2+(aq) ions, and Ksp Ca(OH)2(s) can be calculated if concentration of OH-(aq) is known. As volume of solution delivered is proportional to number of drops, the volume term in calculating number of mole, [(C)(Vol)/1000], can be replaced by number of drops. In this experiment, calcium hydroxide is dissolved in, including deionized water, NaOH(aq) of various known concentrations. The concentration of OH-(aq) in equilibrium with the solid calcium hydroxide is determined by micro-scale titration using plastic pipette containing standard hydrochloric acid. Conventional burette volume readings are replaced by number of drops from the plastic pipette. Ksp Ca(OH)2(s) is calculated from a derived concentration of Ca2+(aq) and an experimental concentration of OH-(aq). Materials and Apparatus
Ca(OH)2 solid, NaOH(aq) of strengths 0.05 M and 0.025 M
Phenolphthalein indicator
Standard 0.0096 M HCl(aq) Well-plate, plastic pipette, micro-spatula, light table (if available) Experimental Procedures
1. Prepare saturated stock solutions of Ca(OH)2(aq) according to the following scheme:
Stock solution
About 1g Ca(OH)2(s) in each of the following 50 cm3 liquids
1 Deionized water 2 0.025M NaOH(aq)
3 0.050M NaOH(aq) Cover the saturated stock solutions and leave them overnight.
2. Measure the temperature of the saturated stock solutions.
3. Using three separate wells and clean plastic pipettes, withdraw supernatant liquids of the saturated stock solutions 1, 2 and 3 and dilute ten times by using a dilution ratio of 8 drops: 72 drops of deionized water. Stir well with micro-spatula.
4. Place the well-plate on a light table (if available). Using a clean plastic pipette, transfer 25 drops of the diluted solution 1 into a well of the well-plate. Add one drop of phenolphthalein indicator. Clean and wash the same plastic pipette with deionized water.
IRRITANT
FLAMMABLE

Rinse and fill with 0.0096 M HCl(aq). Carefully titrate the diluted solution 1 (see figure 1) by adding drops of 0.0096 M HCl(aq) solution from the plastic pipette, until the red colour is discharged. Occasionally stir the solution. Record the number of drops of 0.0096 M HCl(aq) added.
5. Repeat step (4) with the diluted stock solutions 2 and 3.
Fig. 1 Microscale titration
Results
Solution temperature = _______ oC
Stock solution
No. of drops of 0.0096M HCl (aq)
Original conc. of OH-(aq) / M
1 10-7
2 0.025 3 0.050
Treatment of Data
Calculate the concentration of Ca2+(aq) in the stock solutions (1), (2) and (3) and complete the following table.
Stock solution
[Ca2+(aq)] / mol dm-3
[OH-(aq)] / mol dm-3
Ksp = [Ca2+(aq)] [OH-(aq)]2 / mol3dm-9
1 2 3
Discussion Questions
1. Write down the expression for the Ksp of calcium hydroxide.
2. Explain the variation in concentration of Ca2+(aq) as the concentration of OH-(aq) increases.
3. Calculate an average value of Ksp of calcium hydroxide and compare with the literature value from a data book. Comment on the discrepancy, if any.

EXPERIMENT St. Clare's Girls' School DATE : F.6 Chemistry
A Test Tube Of Redox Reaction
In this practical you will attempt to place a number of redox pairs in order of oxidizing strength by carrying out suitable experiments. The redox pairs concerned are: A I2 + 2e- ↔ 2I-
B SO42- + 4H+ +2e- ↔ H2SO3 + H2O
C ClO- + H2O + 2e- ↔ Cl- + 2OH-
D Cl2 + 2e- ↔ 2Cl-
E Br2 + 2e- ↔ 2Br-
F Fe3+ + e- ↔ Fe2+
ClO- is called chlorate(I) (hypochlorite) ion, and H2SO3 sulphurous acid.
Procedure
EXPERIMENT 1
Add a little of a solution of iron(III) ions to a solution of iodide ions. Describe what happens and test to see if iodine has been formed. The half equations involved are: A I2 + 2e- ↔ 2I-
F Fe3+ + e- ↔ Fe2+
EXPERIMENT 2
Add a little sodium chlorate(I) solution to a solution containing iron(II) ions. Decide whether or not Fe2+ ions have been oxidized. (Hint: when chlorate(I) acts as an oxidizing agent, hydroxide ions are produced. What effect will this have on iron(II) or iron(III) ions?)
EXPERIMENT 3
Add a little sodium chlorate(I) solution to a solution containing bromide ions. Decide whether or not bromide ions have been oxidized to bromine.
EXPERIMENT 4
Add a little sulphurous acid to a solution containing iodine, I2, and note the result.
EXPERIMENT 5
Finally, decide the position of half-equation D by adding chlorine water to a solution containing bromide ions.
For each of the above experiments, write a balanced ionic equation for the reaction and arrange the half-equations A to F in its correct position as found in the electrochemical series.
EXPERIMENT 6
Use your final order of oxidizing power to predict whether chlorate(I) ions will oxidize iodide ions to iodine. Test your prediction experimentally.

Worksheet for Qualitative Analysis
of Inorganic Compounds
Name : ________________________________
Class : ______ Date : ____/____/____
1. Describe the solid.
2. Report on the solubility in water.
3. Estimate the pH.
4. Heat a small amount of the solid in an
ignition tube at first gently and then strongly. Report the observation.
5. Report the observation on a flame test.
6. Report on the action of 2M HCl on the
solid.
7. Report on the action of 1M H2SO4 on
the solid.
8. Report on the action of conc. H2SO4 on
the solid.
9. Report on the action of 2M NaOH on
the aqueous solution.
10. Report on the action of 2M NH3 on the
aqueous solution.
11. Report on the action of acidified KMnO4 solution made from equal volumes of 0.2M KMnO4 and 1M H2SO4 on the aqueous solution.
12. Report on the action of
Write your interpretation of the various observations reported above and comment on the chemical nature of the substance. _______________________________________________________________________________________________________________
_______________________________________________________________________________________________________________
_______________________________________________________________________________________________________________
_______________________________________________________________________________________________________________
_______________________________________________________________________________________________________________
_______________________________________________________________________________________________________________
____________________________________________________________________________________________________